Article

Structural and Electrochemical Properties of Scandia Alumina Stabilized Zirconia Thin Films

Physics Department, Kaunas University of Technology, Studentu Str. 50, LT-51368 Kaunas, Lithuania
*
Author to whom correspondence should be addressed.
Coatings 2021, 11(7), 800; https://doi.org/10.3390/coatings11070800
Submission received: 10 June 2021 / Revised: 29 June 2021 / Accepted: 30 June 2021 / Published: 2 July 2021

Abstract

:
This work presents a systematic investigation of scandia alumina stabilized zirconia (ScAlSZ, composition: ZrO2:Sc2O3:Al2O3 93:6:1 wt.%) thin films (~2 μm). Thin films were formed by the e-beam evaporation method on 450 °C substrates. The influence of Al concentration on thin film microstructure, structure, and electrochemical properties was characterized by EDS, XRD, Raman, and EIS methods. It was found that the aluminum concentration in the deposited thin films decreased with an increase in the deposition rate. The concentration of Al changed from 15.9 to 3.8 at.% when the deposition rates were 0.2 and 1.6 nm/s, respectively. The crystallinity of the thin films depended strongly on the concentration of Al, resulting in an amorphous phase when Al concentration was 22.2 at.% and a crystalline phase when Al concentration was lower. ScAlSZ thin films containing 15.9 at.% of Al had monoclinic and tetragonal phases, while thin films with 1.6 and 3.8 at.% of Al had a mixture of cubic, tetragonal, and monoclinic phases. The phase transition was observed during the thermal annealing process. Cubic and rhombohedral phases formed in addition to monoclinic and tetragonal phases appeared after annealing ScAlSZ thin films containing 15.9 and 22.2 at.% of aluminum. The highest total ionic conductivity (σbulk = 2.89 Sm−1 at 800 °C) was achieved for ScAlSZ thin films containing 3.8 at.% of Al. However, thin films containing a higher concentration of aluminum had more than 10 times lower total conductivity and demonstrated changes in activation energy at high temperatures (>560 °C). Activation energies changed from ~1.10 to ~1.85 eV.

1. Introduction

Doped ZrO2 is one of the most widely investigated fluorite-structured electrolytes. Pure ZrO2 does not exhibit high oxygen ion conductivity due to a low number of oxygen vacancies and polymorphic nature. ZrO2 has a monoclinic structure below 1170 °C, a tetragonal structure below 2370 °C, and a cubic structure above 2370 °C. The presence of aliovalent dopants such as Sc, Y, Gd, Yb, Er, Dy, and Eu may help to overcome both issues. However, not all aliovalent dopants are equally suitable. The ionic conductivity of electrolytes depends on dopant atomic radii, dopant concentration, electrostatic interactions between dopants and oxygen vacancies, and phase composition [1,2]. It was found that the optimal concentration of dopants is around 8–10 mol.% [3]. The conductivity decreases at higher or lower dopant concentrations due to dopant clustering or a low number of oxygen vacancies [4]. Zirconia doped with 10 mol.% of Sc (10ScSZ) exhibit the highest conductivity at 1000 °C among all ZrO2 based electrolytes due to low association enthalpy of the defect reactions and similar ionic radii (0.075 nm—Sc3+, 0.072 nm—Zr4+) [2,5]. However, the conductivity becomes equal or lower to the conductivity of YSZ at 500 °C due to increased activation energy [6]. Therefore, the oxygen ion conductivity and cubic phase stability should be increased even more. The 10ScSZ can be co-doped with small amounts (0.5–2 mol.%) of CeO2, Gd2O3, Sm2O3, Bi2O3, Yb2O3, and Al2O3 [7,8,9,10,11,12]. The cubic phase is mixed with other phases of ZrO2 using most co-dopants. The exception is 10ScSZ co-doped with 0.5 mol.% of Al2O3. Authors suggest that a low concentration of alumina co-dopant can stabilize the cubic phase [13,14]. Yet, co-doping with alumina gives contradictive results. Other authors found that 5.5 mol.% and higher alumina concentrations do not fully stabilize the cubic phase [15,16,17]. The additional phases exist, reducing the ionic conductivity. Being an aliovalent dopant, alumina co-dopants influence the ionic conductivity of zirconia-based ceramics by increasing the concentration of oxygen vacancies after the co-doping. Despite that, the bulk conductivity decreases due to defect association and even more due to higher association energy of A l Z r V O * * defect in comparison to association energy of Y Z r V O * * defect [18]. The solubility of Al in zirconia lattice is low at ~1.2 mol.% [18]. The solubility limit was determined by measuring the influence of Al concentration on the size of the YSZ lattice, which size decreased by about 0.12% due to the smaller Al3+ ion that replaced Zr4+ and Y3+ in the crystalline lattice. Al2O3 forms its phase in the grain boundaries above 1.2 mol.%, and does not influence the size of the YSZ lattice. Alumina acts as a scavenger for SiO2 impurities at the grain boundaries [19,20]. It was also proposed that the alumina phase in grain boundaries influences the properties of the space charge region in the vicinity of the grain boundary core [21]. The space charge region is usually depleted of oxygen vacancies and enriched with electrons which act as an energy barrier for oxygen diffusion. It is believed that Al2O3 existence in the grain boundaries reduces the concentration of electrons and increases the concentration of oxygen vacancies in the space charge layer. Therefore, it is expected that Al2O3 co-dopants increase the grain boundary conductivity.
Most research articles focus on synthesizing zirconia-based pellets from powders and their ionic conductivity measurements. The pellet electrolytes usually are 1–2 mm thick, porous, and the manufacturing process uses additional chemicals [11,22]. These reasons lead to quality and conductivity issues. In comparison, thin film technology has advantages, i.e., low electrolyte thickness, controllable structure and composition, high purity, and high density [23,24]. One of the best methods for the deposition of ceramic thin films is the e-beam evaporation technique because the temperature in the crucible is sufficiently high to melt and evaporate high melting temperature materials.

2. Materials and Methods

2.1. Formation of Thin Films

The ScAlSZ thin ceramic films were deposited using the electron beam technique, “Kurt J. Lesker EB-PVD 75” (Kurt J. Lesker Company, Pittsburg, PA, USA). The initial powder was pressed into pallets and evaporated on Alloy 600 (Fe–Ni–Cr) and Al2O3 substrates. Alloy 600 (Fe–Ni–Cr) substrates were used for X-ray diffraction, EDS, and Raman spectroscopy measurements, while Al2O3 substrates were used for EIS measurements due to a high melting temperature (2345 K) and low electrical conductivity. Substrates were cleaned before the deposition process by conventional methods [25]. All ScAlSZ thin films were deposited on 450 °C substrates using 0.2, 0.4, 1.2, and 1.6 nm/s deposition rates, which were controlled with a crystal sensor (Inficon, Bad Ragaz, Switzerland). The thickness of ceramic films (~2 μm) was estimated with profilometer (Ambios Technology XP-200, Keep Looking Ahead (KLA), San Jose, CA, USA).

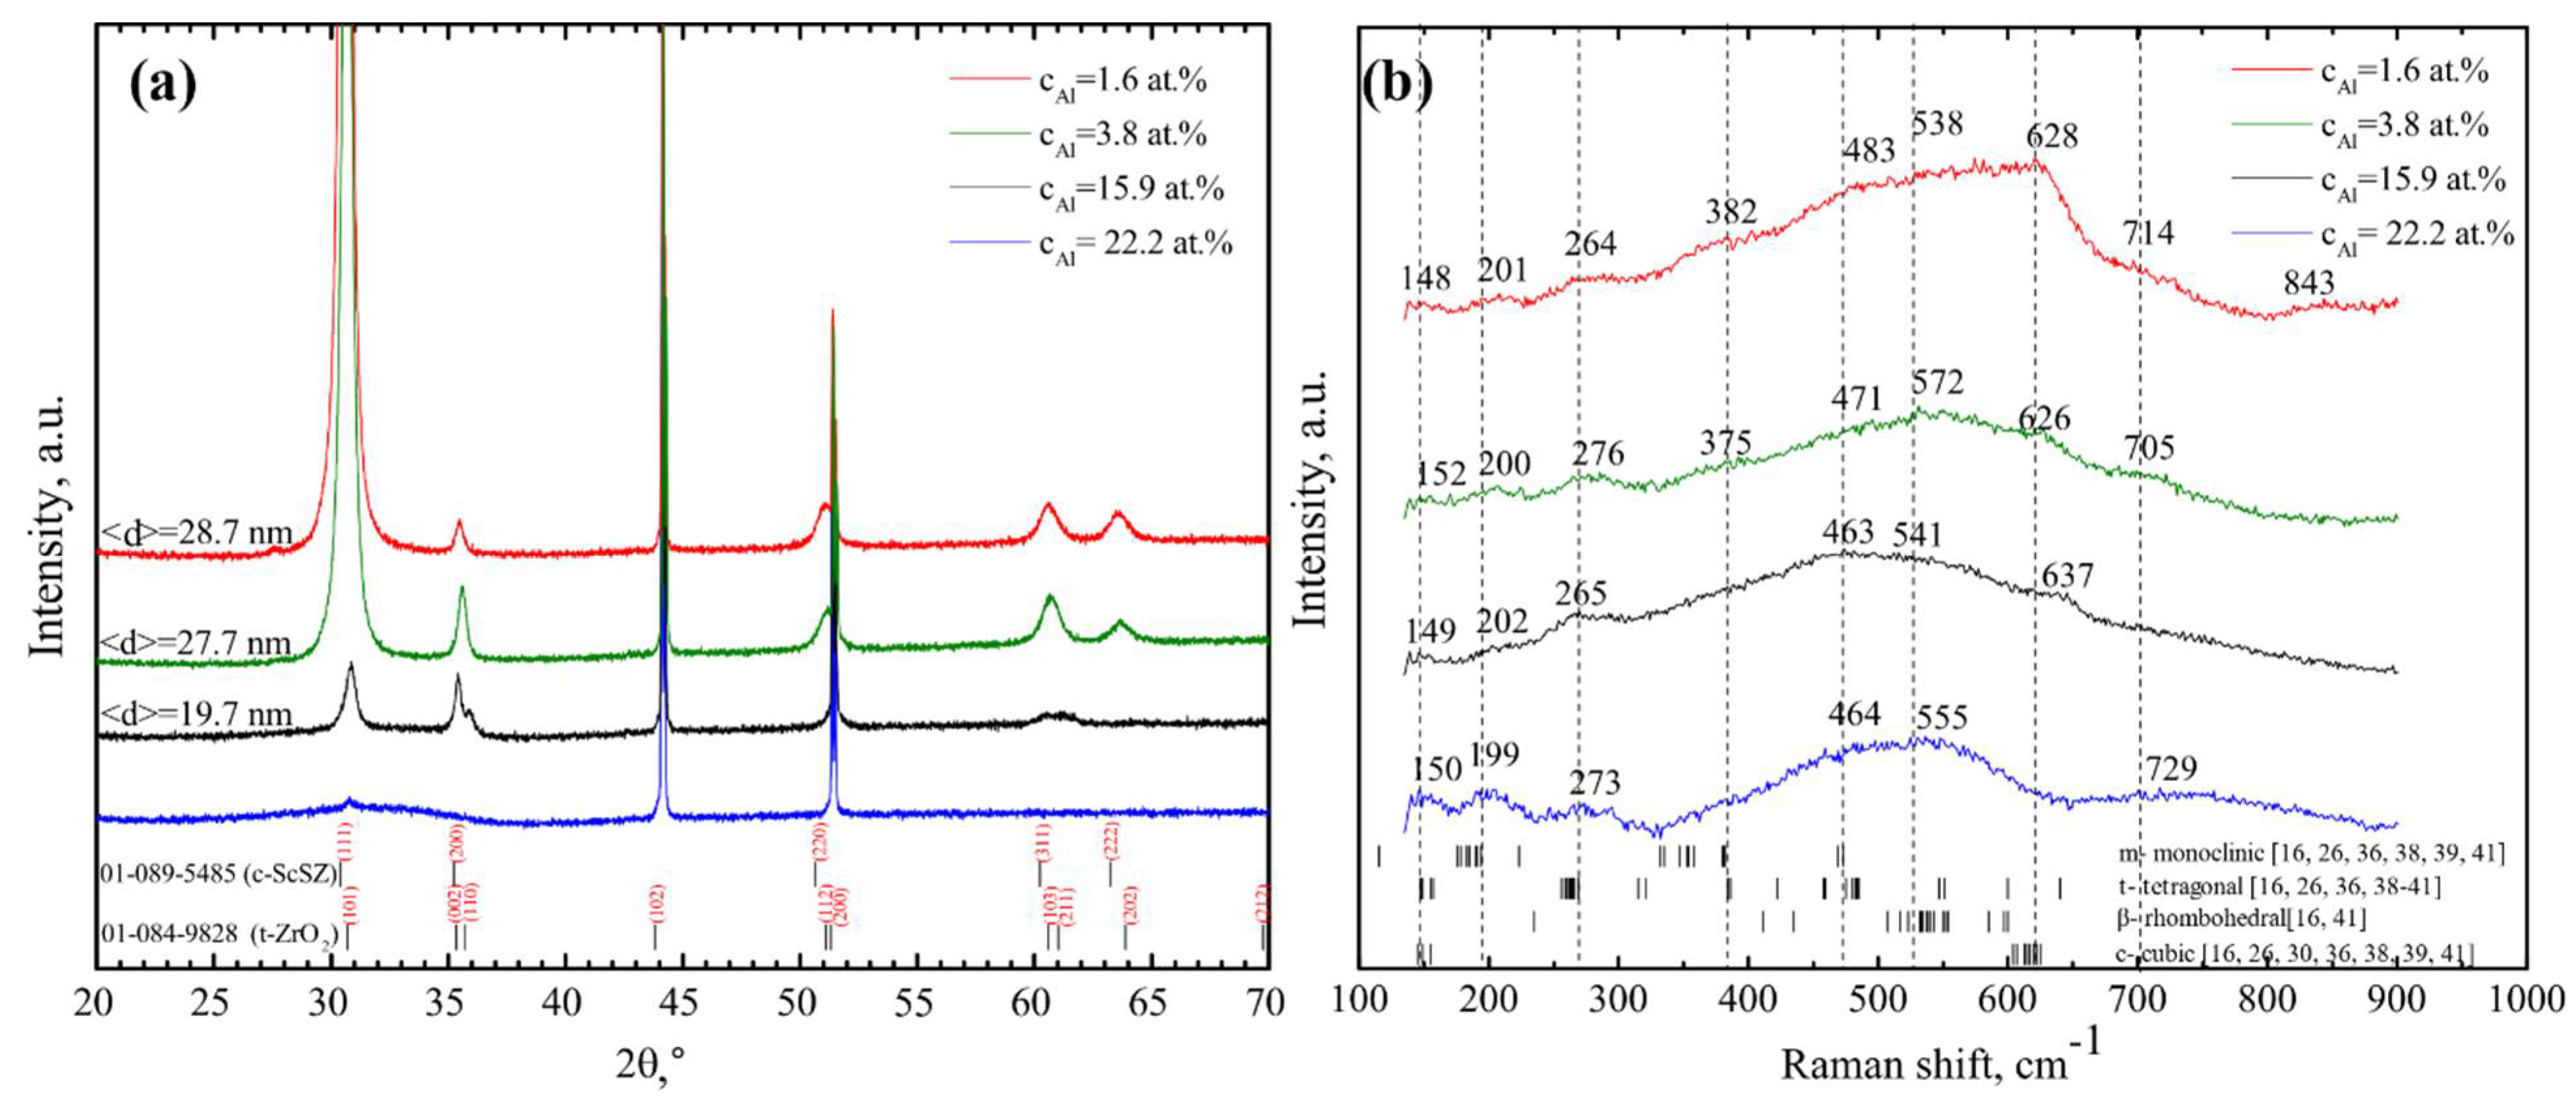
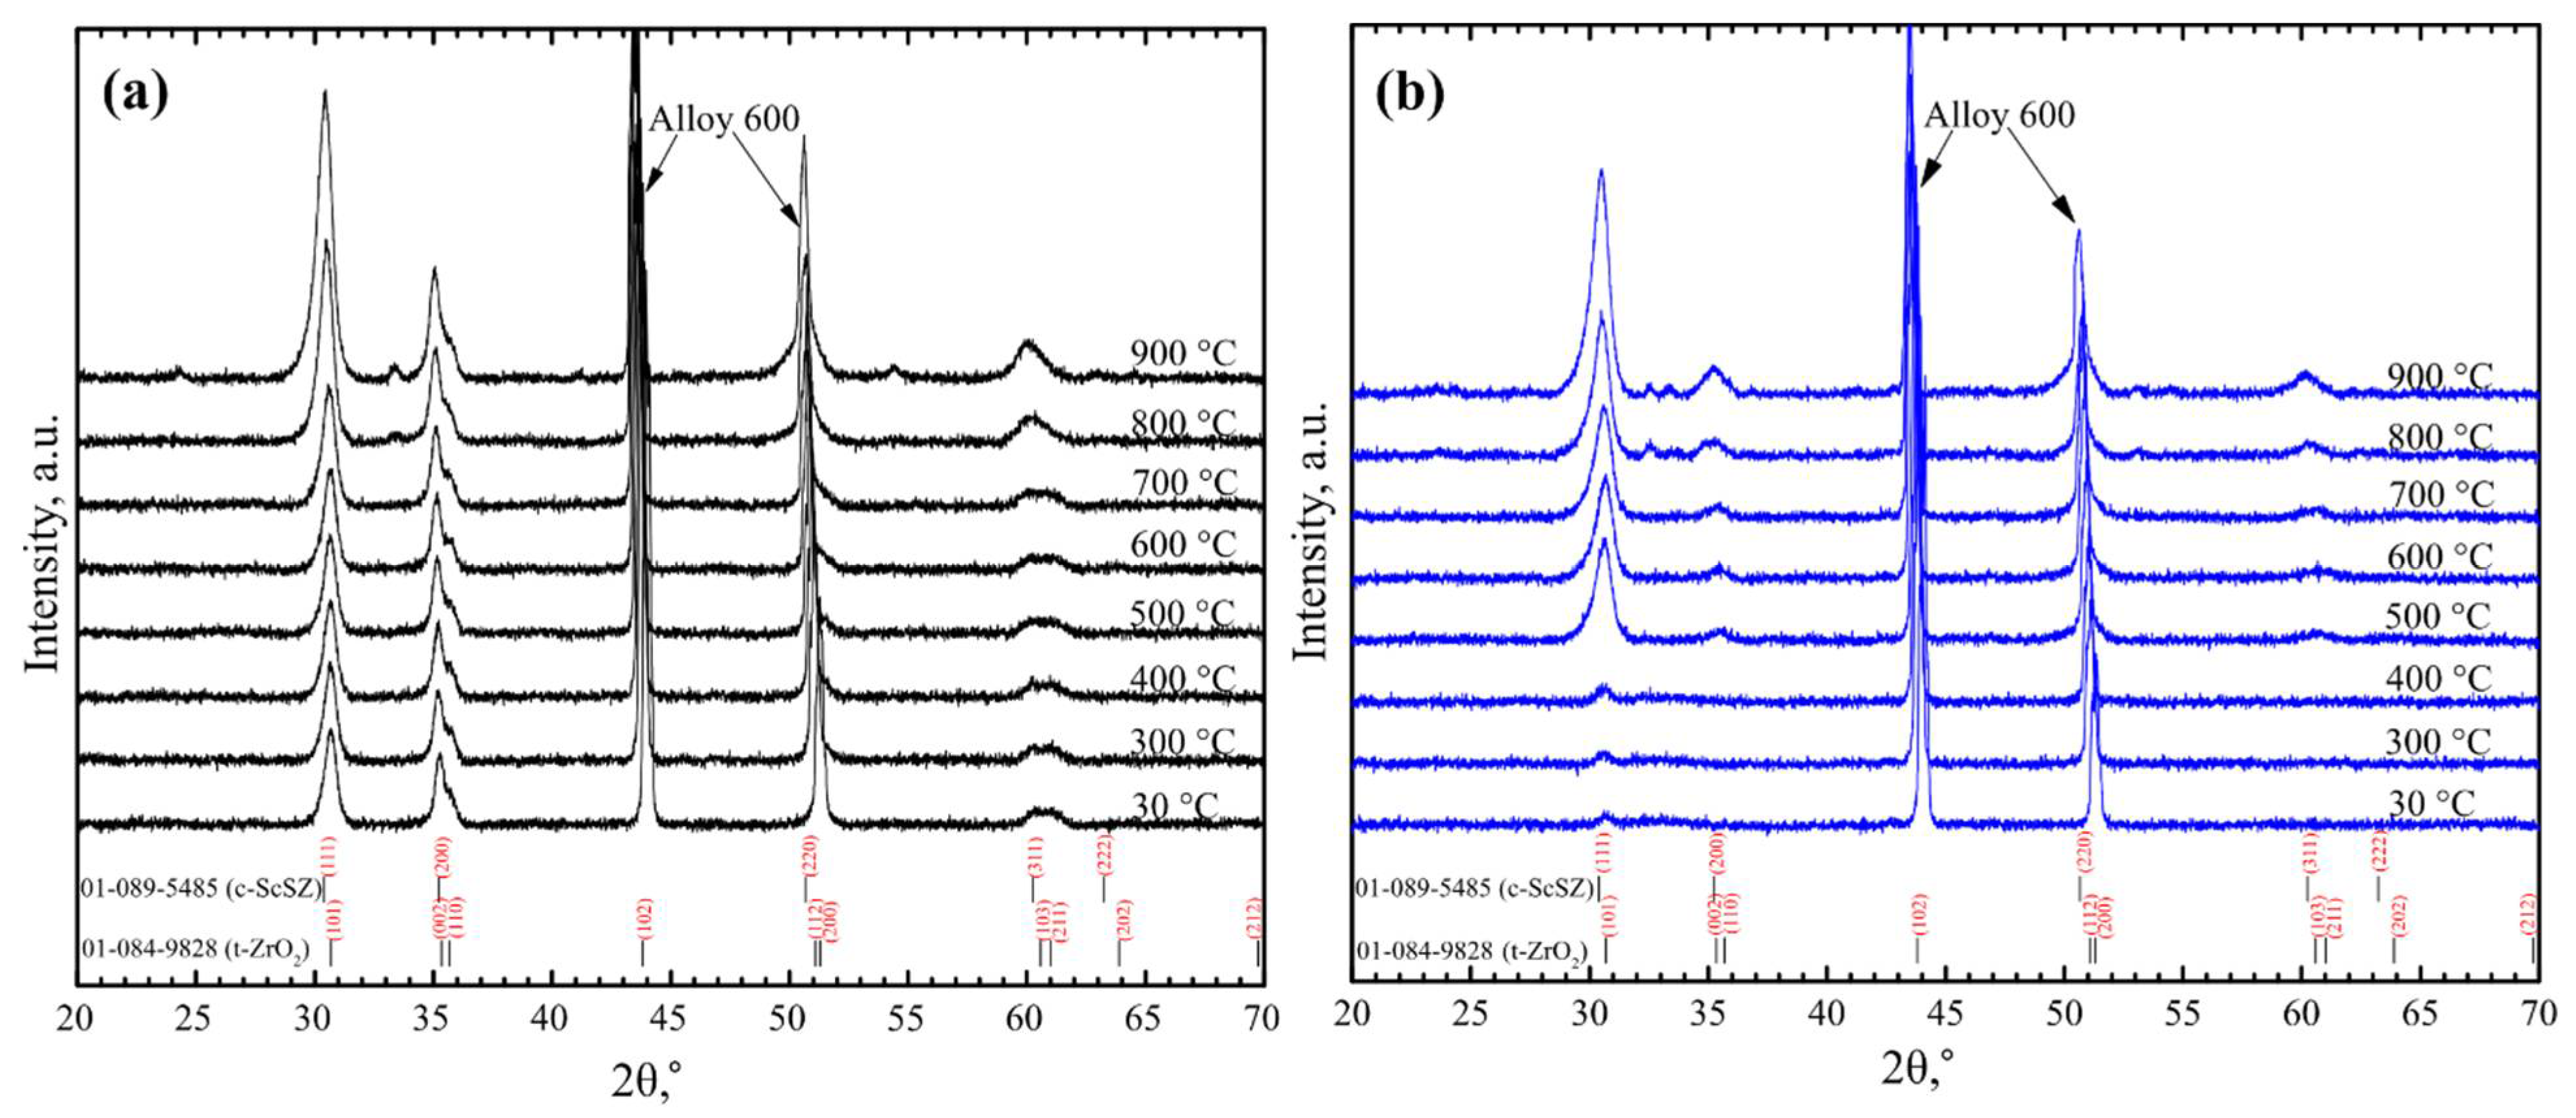
2.2. X-ray Diffraction

The crystalline structure characterization of the samples was carried out using an X-ray diffractometer “Bruker D8 Discover” (XRD, Bruker, Billerica, MA, USA). The measurements were performed at room temperature and in situ during the annealing procedure using Cu Kα1 (λ = 0.154059 nm) radiation and a typical Bragg–Brentano focusing geometry in a 20°–70° scan range and a step size of 0.01°. The in situ measurements of X-ray diffraction were carried out in the Mri TC-basic chamber. The samples were placed on a Pt:Rh heating foil strip with an S-type thermocouple and heated at the following temperatures: 30, 300, 400, 500, 600, 700, 800, and 900 °C. The heating rate was 1 °C/min and temperature stabilization time was 20 min. The crystalline phase and crystallite size (<d>) of ScAlSZ thin films were estimated using “Sleve” (PDF-4 database) and “TOPAS 4.1” software, respectively.

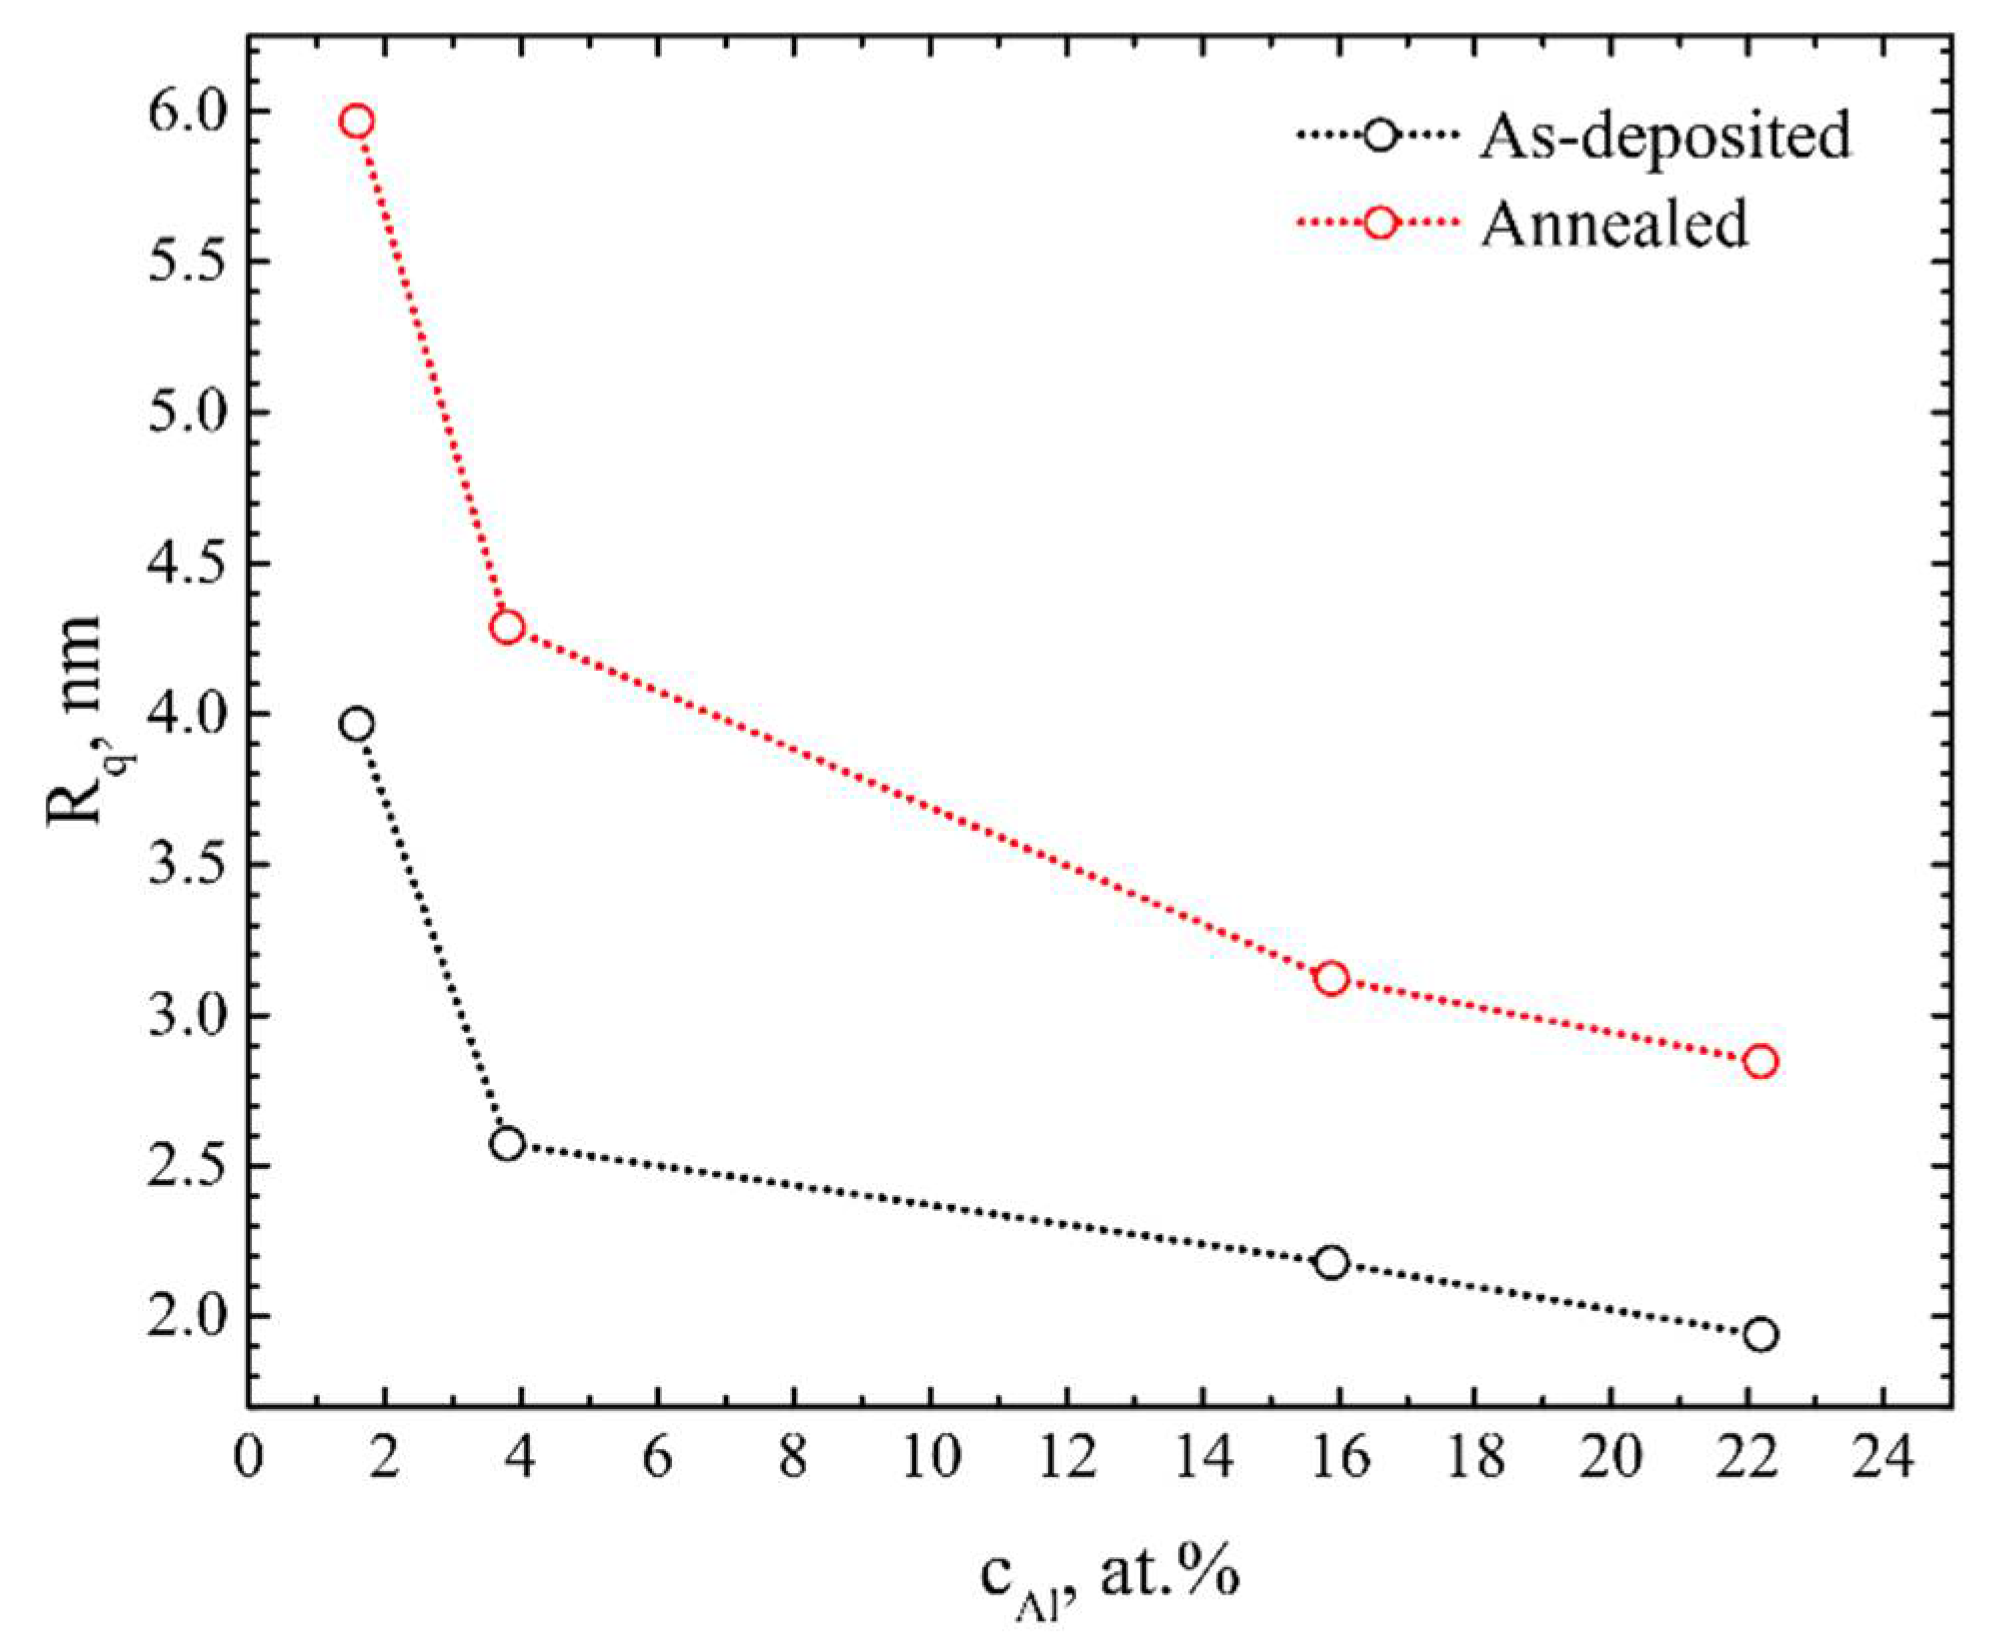
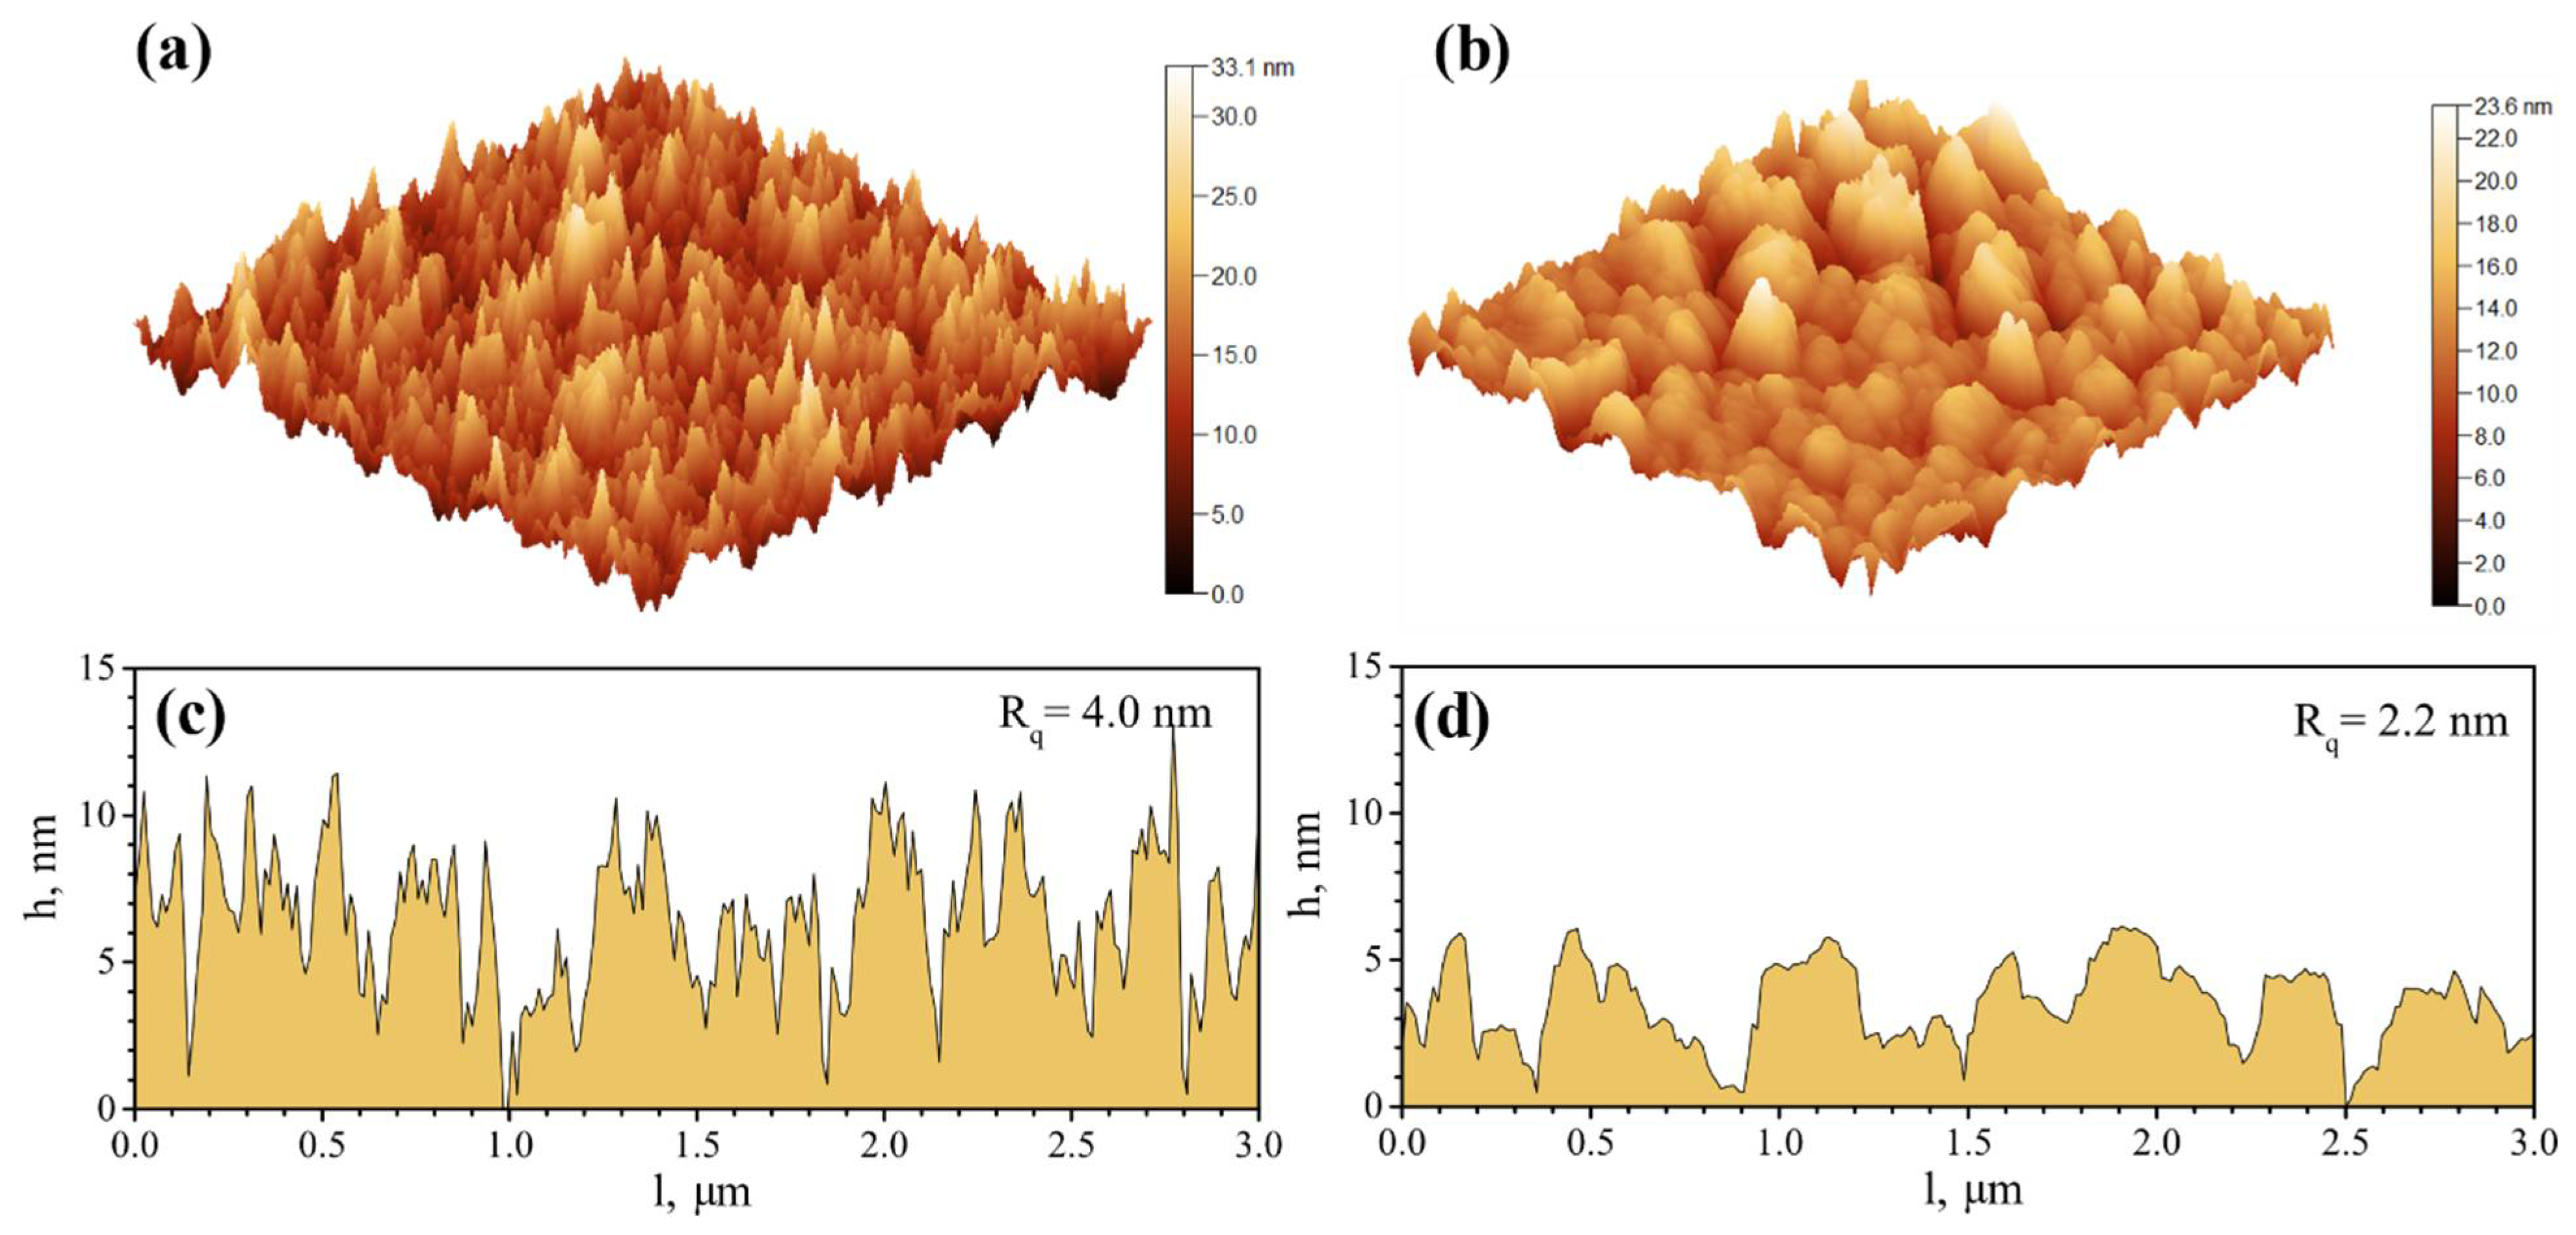
2.3. Atomic Force Microscopy

The 3D images (3.0 µm × 3.0 µm) of thin films were obtained by employing an atomic force microscope “AFM NT-206” (Microtestmachines, Gomel, Belarus). The tapping mode with a step size of 12 nm was used for the measurements. The Si tip used during the scans was pyramidal shape, 16 μm high, and 6 nm diameter. The roughness values (Rq) were calculated using “Gwyddion 2.59” software.

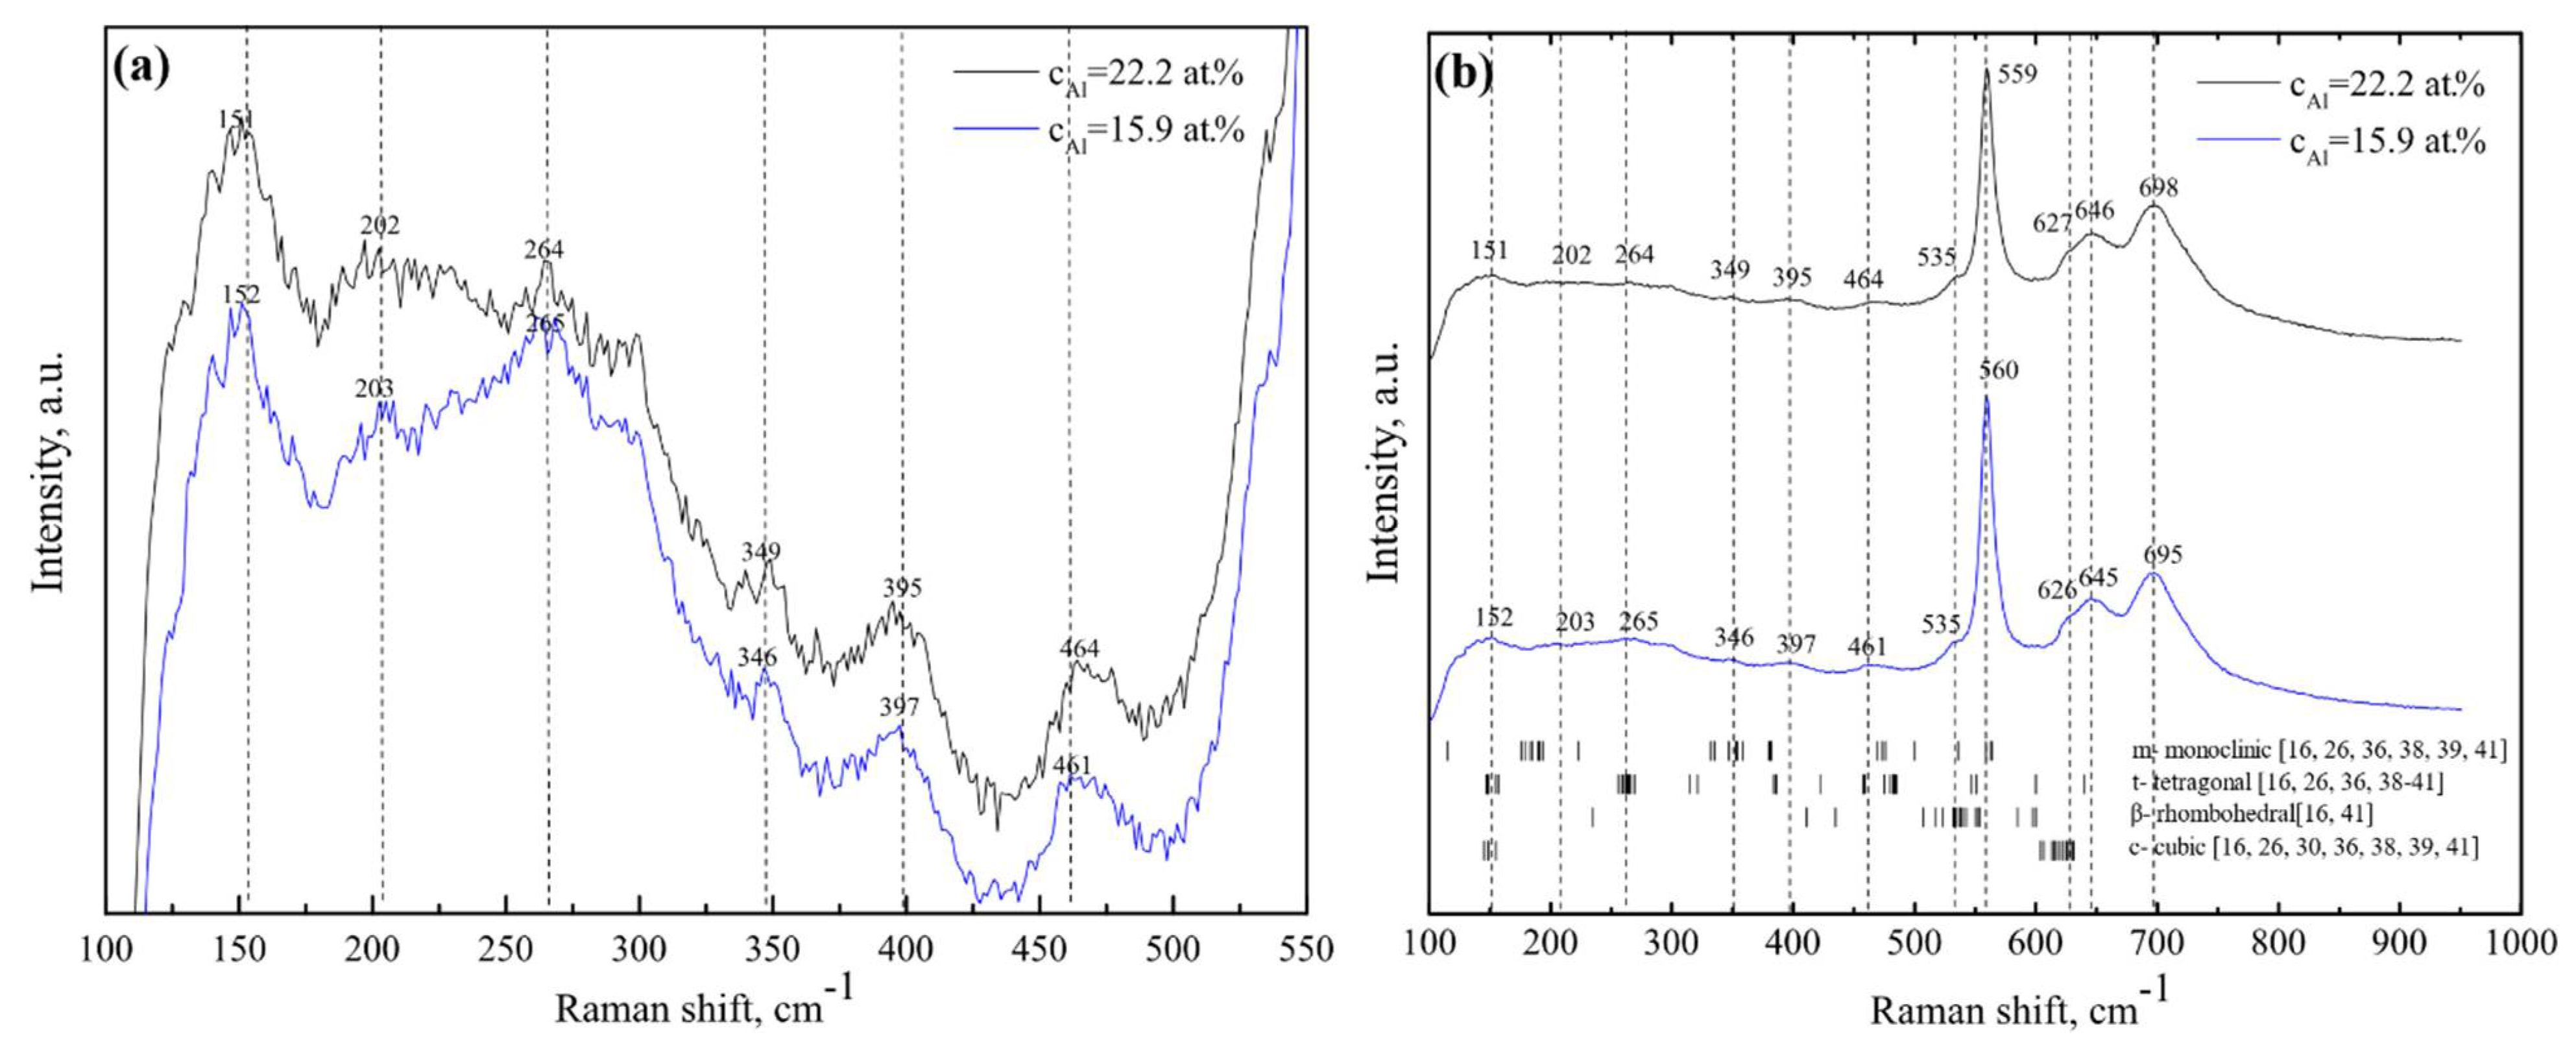
2.4. Raman Spectroscopy

The phase identification was supported by Raman scattering spectroscopy. The Raman spectra were obtained using an inVia spectrometer (Renishaw, Gloucestershire, UK). The 532 nm wavelength diode laser and 4 μm laser diameter were used during the measurements. The laser spot was focused on a sample using a 50× objective (NA = 0.75, Leica, Wetzlar, Germany). The integration time of signals was 15–30 s. The signals were accumulated 5 times and averaged. The diffraction gratings (2400 grooves/mm) provided a spectral resolution of 1 cm−1. A Peltier cooled charge-coupled device (CCD) camera detector was used to record the data (Renishaw, Gloucestershire, UK) (1024 × 256 pixels). The overlapped background-corrected Raman spectral bands were fitted with Lorentz contours using least-squares fitting software. RS were recorded in the Raman shift range from 100 to 800 cm−1. The phase ratio was calculated using the formula:
ϑ c = I c k ( I m + I t ) + I c ,
where coefficient k = 0.97 is the factor required to convert the Raman intensities to the XRD intensities of the reference material, Ic, Im, and It are the scattering intensity of cubic (~620 cm−1), monoclinic (~150 cm−1), and tetragonal (~200 cm−1) Raman modes [26,27].

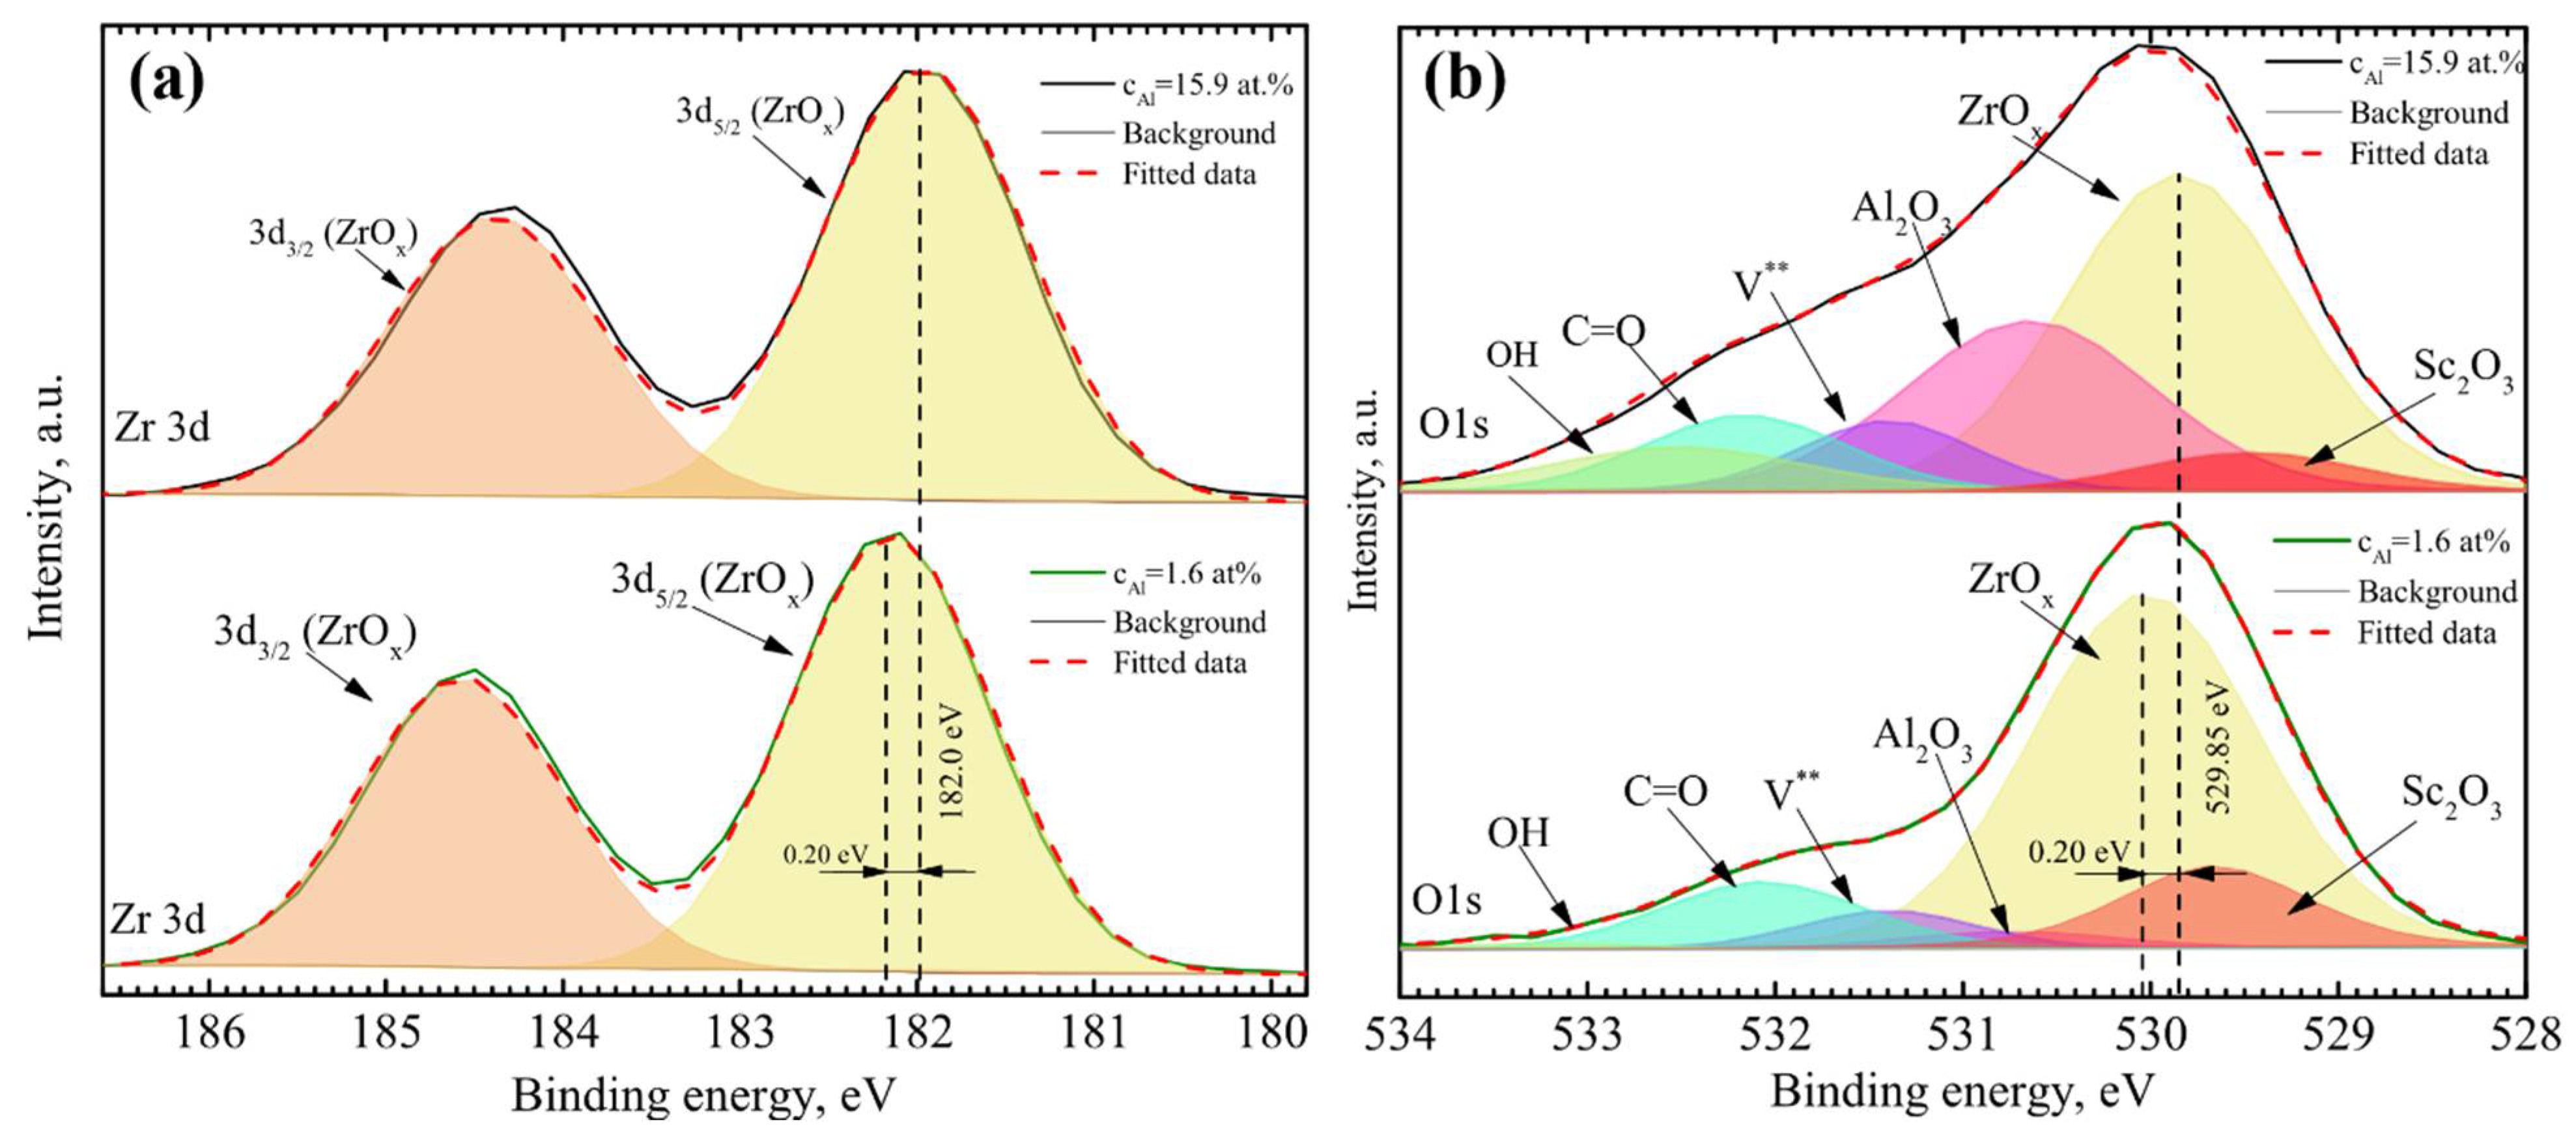
2.5. Determination of Chemical Composition

The energy-dispersive X-ray spectroscope “BrukerXFlash QUAD 5040” (EDS, Bruker, Billerica, MA, USA) was used to examine the elemental composition of formed ceramic thin films. The energy-dispersive X-ray spectroscope “BrukerXFlash QUAD 5040” (EDS) was used to examine the elemental composition of formed ceramic thin films. Chemical analysis was estimated using an X-ray photoelectron spectrometer (XPS, PHI Versaprobe 5000, ULVAC-PHI, Chigasaki, Kanagawa, Japan). The following parameters were used: Al Kα (1486.6 eV) radiation, 25 W power, 100μm beam size, 45° measurement angle, 187.580 eV pass energy, 1 eV resolution for Survey Spectrum, and 0.1 eV for detailed chemical analysis.

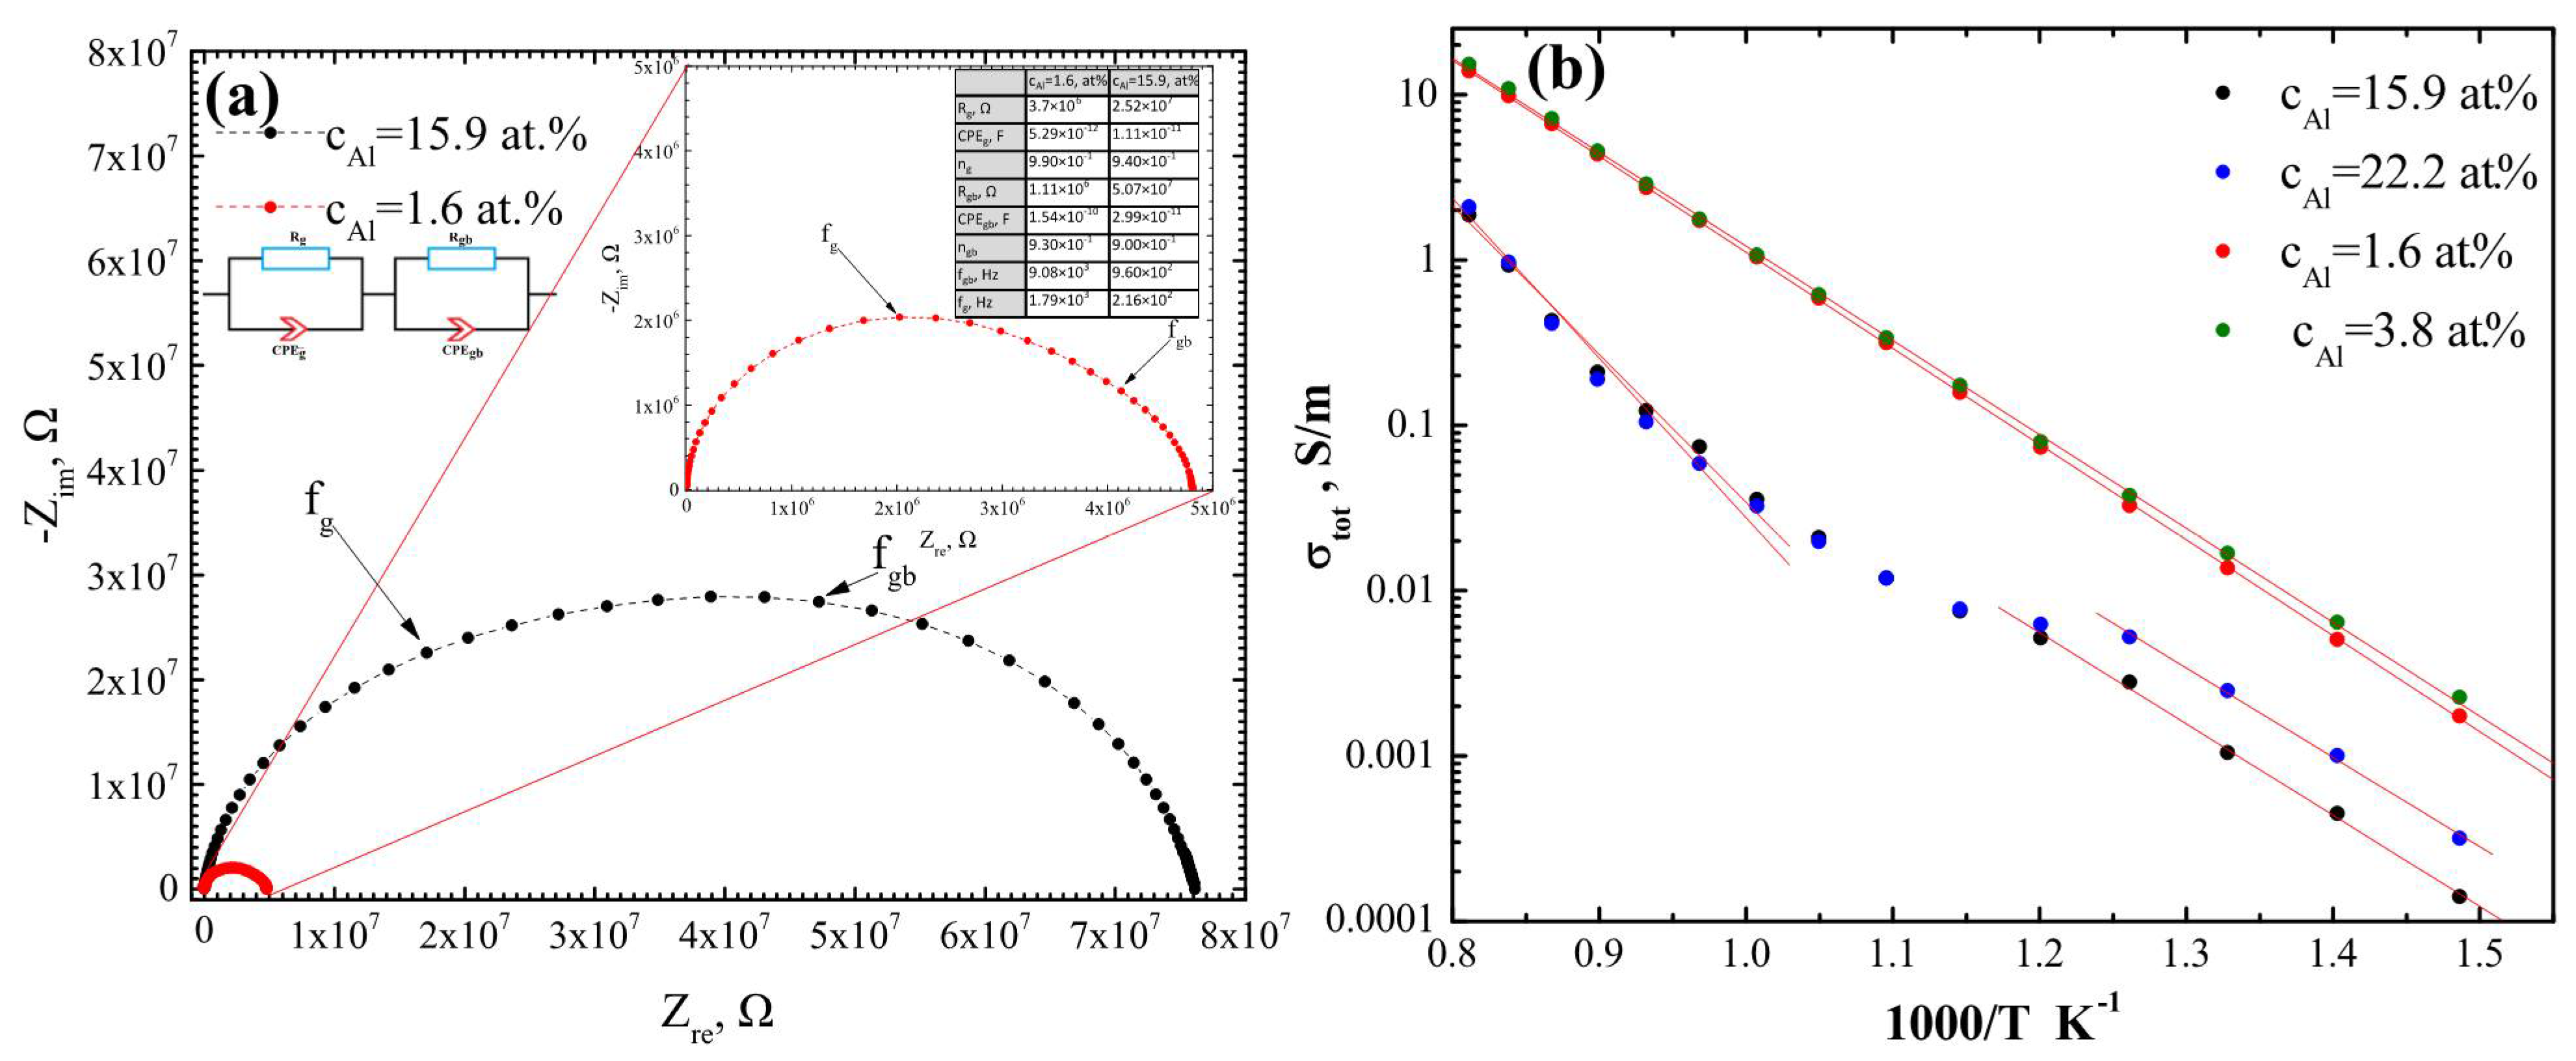
2.6. Electrochemical Impedance Spectroscopy

The electrical properties of thin ceramic films were investigated using a Probostat® (Norecs AS, Oslo, Norway) measurement cell. The impedance spectrum was measured in parallel (in-plane) to the coating surface. Two Pt electrodes were overlaid on top of the thin films using a mask reproducing the geometry of the electrodes (a two-probe method). The size of rectangular geometry electrodes was 1 cm × 0.5 cm, and separation between electrodes was 1 cm. Impedance measurements were carried out in the air in a temperature range between 400 and 1000 °C and over a frequency range of 0.1 Hz to 1 MHz (13 points per decade). The impedance spectra were analyzed, and the modeling of Nyquist plots was done using “Z-view 2” software. The total conductivity was calculated according to:
σ = L e   R s A = L e R s h l e ,  
where L e is the distance between the Pt electrodes, R s is the resistance obtained from the impedance spectra, A is the cross-sectional area, h is the thickness of the thin films, and   l e is the length of the electrodes.
The activation energy was determined from the Arrhenius equation [28]:
σ T = σ 0 e E a k T ,
where σ is ionic conductivity, T is temperature of measurement, σ 0 is exponential prefactor, E a is the activation energy, and k is the Boltzmann constant.

3. Results

The EDS analysis of ScAlSZ thin films was performed after deposition (Table 1), and it was determined that the chemical composition of thin films depended on the deposition rate. The aluminum concentration decreased using a higher deposition rate. The concentration of Al was 15.9 and 3.8 at.% when the deposition rates were 0.2 and 1.6 nm/s, respectively. The concentrations of Sc and Zr were inversely proportional to the concentration of aluminum. The concentration of Sc was from 3.4 to 7.7 at.%, and the concentration of Zr was from 27.4 to 34.4 at.% when the deposition rate was changed from 0.2 to 1.6 nm/s, respectively.
In addition to the EDS measurements, XPS measurements were performed, and Al3+ cation concentration was calculated using Al2p spectra and survey results (Table 1). Al2p spectra consisted of AlO(OH) (~75.3 eV), Al2O3 (Al3+) (~73.8 eV), and Al (~72.5 eV) peaks. Al2O3 (Al3+) fraction was calculated from the peak area ratio and multiplied by Al concentration from the survey results. It was found that the concentration of Al was 11.8 and 3.5 at.% when the deposition rates were 0.2 and 1.6 nm/s, respectively. It decreased using a higher deposition rate.
To fully understand the chemical composition of ScAlSZ thin films, analysis of Zr3d, and O1s spectra was performed (Figure 1). It was found that the Zr3d5/2 peak is positioned at ~182.0 eV, indicating its belonging to Zr3+ suboxide. The presence of Zr3+ ions suggested the existence of oxygen vacancies. The spectra of O1s core level consisted of peaks belonging to OH groups, C=O groups, V** (O2− ions located in oxygen-vacancy region ZrOx lattice), Al2O3 (Al3+), and ZrOx (O2− ion) [29,30,31,32,33,34,35]. The most important part of O1s core level spectra were areas of Al2O3 and V** peaks. A higher concentration of oxygen vacancies is represented by the enlarged areas with the increase of Al concentration.
The AFM measurements were done to investigate the influence of Al concentration on the microstructure. Thin films containing low Al concentration (e.g., 1.6 at.%) have a fiber-like structure and roughness of 4.0 nm (Figure 2a and Figure 5). The transition from fiber-like to grained structure occurs at higher Al concentrations (e.g., 15.9 at.%). In these cases, columns of ScAlSZ thin films consist of small grains (globulars) instead of fibers (Figure 2b) due to the inhibiting effect of Al or Al2O3 phases in grain boundaries. The surface roughness also decreased from 4.0 to 1.9 nm with increasing Al concentration (Figure 5).
XRD identified that ScAlSZ thin films were amorphous when Al concentration in thin films was 22.2 at.% and crystalline when Al concentration was lower (Figure 3a). However, the crystalline phases were different depending on the concentration of aluminum. The XRD pattern of ScAlSZ thin films containing 15.9 at.% of Al consisted of peaks belonging to the tetragonal phase of zirconia (JCPSD No. 01-084-9828). The XRD patterns of ScAlSZ thin films with low (1.6 and 3.8 at.%) Al concentration had peaks belonging to the cubic phase of scandia stabilized zirconia (JCPSD No. 01-089-5485) and the tetragonal phase of zirconia (JCPSD No. 01-084-9828).
The Raman spectroscopy measurements of ScAlSZ supplemented the XRD analysis. Additionally, the monoclinic phase was found in all thin films. Even more, thin films had formed tetragonal and monoclinic phases at 22.2 at.% concentration of aluminum, although an amorphous phase was identified after XRD measurements. The Raman measurements show that ScAlSZ peaks belong to monoclinic (m-ZrO2), tetragonal (t-ZrO2), and cubic (c-ZrO2) phases (Figure 3b, Table 2). The detected peaks at 626 and 628 cm−1 are assigned to the cubic phase. The peaks at 148, 149, 150, 152, 264, 265, 273, 278, 337, 464, 463, 471, and 483 cm−1 are presence of tetragonal phase, and 199, 200, 201, 202, 375, and 382 cm−1 belong to monoclinic phase [16,26,36,37,38,39,40,41,42,43].
The electrical properties of ScAlSZ thin films were investigated using EIS method, and the Nyquist plots (Figure 4a) were obtained from measurement data. The shape of the Nyquist plot was irregular, indicating the existence of two paths of oxygen diffusion, i.e., grain and grain boundary. The equivalent circuit modeling proved it. The best results were obtained using a model of Rg|CPEg-Rgb|CPEgb. Simulation results gave information that grain impedance was higher than grain boundary impedance for thin films with low concentrations (<3.8 at.%) of Al. On the other hand, grain impedance was lower than grain boundary impedance for thin films with high concentrations of (>3.8 at.%) Al. The Rg and Rgb were ~3.70 × 10⁶ and 1.11 × 10⁶ Ω when Al concentration was 1.6 at.%, and Rg and Rgb were ~2.52 × 10⁷ and 5.07 × 10⁷ Ω when Al concentration was 15.9 at.%. Moreover, the critical frequency of grain boundaries (fg) decreased from 9.08 to 0.96 kHz, and the critical frequency of grains (fgb) decreased from 1.79 to 0.22 kHz for ScAlSZ thin films with 1.6 and 15.9 at.% Al concentration, respectively.
Moreover, Arrhenius plots show linear dependences when Al concentrations in ScAlSZ thin films are 1.6 and 3.8 at.%. The nonlinear dependences appear when Al concentrations in ScAlSZ thin films are 15.9 and 22.2 at.%. The activation energy is higher at higher temperatures for ScAlSZ thin films with 15.9 and 22.2 at.% of Al. Activation energies are ~1.10 eV in range 1 (400–560 °C and ~1.85 eV in range 2 (720–1000 °C) (Table 3).
The highest total conductivity values were found for thin films containing 3.8 at.% of Al. It varied from 1.1 to 19.2 S/m in the temperature interval 700–1000 °C (Figure 4b and Table 3). In comparison, the total ionic conductivity was lower more than 10 times when thin films contained 15.9 and 22.2 at.% of aluminum (Figure 4b). A summary of Zr-based ceramic ionic conductivity found in the literature was also made (Table 4). Conductivities of ZrO2, ScxZr1−xO2, YxZr1−xO2, AlxScyZr1−x−yO2, AlxScyZr1−x−yO2, GaxScyZr1−x−yO2, YbxScyZr1−x−yO2, CexScyZr1−x−yO2, and MgxScyZr1−x−yO2 ceramics at various temperatures were compared with the results obtained in our study. The values found in the literature varied from 1 to 31 S/m in the temperature interval of 700–1000 °C (Table 4). Total conductivity obtained in our study was lower than found in the literature. However, it was in the same order of magnitude.
The microstructure of ScAlSZ thin films was also investigated after annealing. According to AFM measurements, the surface roughness of ScAlSZ thin films increased ~1.5 times for all thin films (Figure 5). Surface roughness decreased from 6.0 to 2.8 nm with increasing Al concentration from 1.6 to 22.2 at.%. No other changes in microstructure were observed. Thin films remained uniform, without cracks and visible pores.
Thin films were annealed, and in situ XRD measurements were taken at different temperatures from 30 to 900 °C to investigate changes in crystalline structure (Figure 6). The phase transitions and increase of crystallinity occurred above ~500 °C, i.e., the peaks in the XRD patterns appeared and/or the intensity of the peaks increased. However, it was not possible to determine the exact phase transition nature due to overlapping peaks of cubic, tetragonal, monoclinic, and rhombohedral phases from XRD measurements. It is only possible to presume that the amount of tetragonal phase increases when Al concentration is 15.9 at.%, and the amorphous phase transforms to cubic, tetragonal, and rhombohedral phase mixture when Al concentration is 22.2 at.%.
Phase transitions were also investigated by employing Raman spectroscopy after the annealing process. The shape of Raman spectra (Figure 7) of annealed ScAlSZ thin films containing 15.9 and 22.2 at.% of Al were different compared to as-deposited. Raman peaks about 150 cm−1 (A1g), 265 cm−1 (Eg), 460 cm−1 (A1g), and 645 cm−1 (A1g) belong to the tetragonal (t-ZrO2) phase [17,37,41,42,53]. Peaks about 202 cm−1 and 346 cm−1 belong to the monoclinic (m-ZrO2) phase [26,36,37]. A weak peak around 535 cm−1 (Bg) and a strong, sharp peak centered around 560 cm−1 (Ag) belong to the rhombohedral (β-ZrO2) phase [16,36,42]. One Raman active vibration F2g of the cubic (c-ZrO2) phase should be expressed as a broad line peak between 600 and 630 cm−1 [16,17,43]. The peaks indicating the cubic (c) phase of ZrO2 are not prominently expressed, and the Raman peaks at 621 cm−1 (F2g) and 645 cm−1 (A1g) are merged into one broad peak, possibly due to impurities at the grain boundaries [53]. Finally, peaks 695 cm−1 and 698 cm−1 could be explained as a Raman active lattice phonon and might belong to mixed phases.
The phase composition obtained from Raman spectra is given in Table 5. According to the calculations, tetragonal and rhombohedral phases dominate (~61%), whereas the amounts of cubic (~24%) and monoclinic (~16%) phases are lower than before the annealing procedure. The decrease of monoclinic phase by −4% and −13% was observed for annealed ScAlSZ thin films with 15.8 and 22.2 at.% of Al, respectively. On the other hand, the amount of cubic phase increased by +24%, and the rhombohedral phase formed. However, it was not possible to determine the amount of rhombohedral phase due to overlapped peaks of tetragonal and rhombohedral phases in Raman spectra. Based on the measurements, it is possible to conclude that cubic and rhombohedral phases formed in addition to monoclinic and tetragonal phases after annealing ScAlSZ thin films containing 15.9 and 22.2 at.% of aluminum.

4. Discussion

The elemental composition analysis revealed that the concentration of aluminum was lower using higher deposition rates. A decrease in Al concentration appeared due to the higher evaporation rate of Al2O3 (the lowest melting temperature) in comparison to Sc2O3 and ZrO2. The thin-film (~2 μm) formation process took longer at low deposition rates than higher deposition rates. Therefore, a smaller amount of Al evaporated using a higher deposition rate for the same thickness of the thin film. The influence of deposition rate on the chemical composition was similar to the published results [17]. Moreover, the metallic Al or its compound phases in ScAlSZ thin films could form due to high Al concentrations exceeding the solubility limit (~7 at.%) [54]. XPS analysis of Zr3d, Al2p, and O1s regions supplemented EDS analysis. It was found from Al2p spectra that Al3+ concentration was slightly lower than Al in thin films. Moreover, the presence of Zr3+ suboxide (Zr3d peak positions) indicated oxygen vacancies in the ZrOx lattice. The larger area of Al2O3 and V** peaks (O1s spectra) indicated an increased concentration of oxygen vacancies in ScAlSZ thin films with higher Al concentration.
Thin ScAlSZ films with different Al concentration had different crystalline structure and surface morphology. According to the structure zone models, thin ScAlSZ films grow at the upper edge of zone I [55]. Neither the bulk diffusion nor the self-surface diffusion in this temperature zone should have a remarkable effect. Therefore, the columns should consist of small diameter (1–10 nm) fibers. On the other hand, increased concentration of impurities should suppress the grain growth, and columns should be composed of three-dimensional equiaxial (globular) grains. The same behavior was observed in this research as well. The amorphous phases of Al or Al2O3 in the grain boundaries of ScAlSZ crystallites acted as impurities, suppressed the formation of grains, and influenced microstructure evolution. It was noticed that surface roughness decreased, and column structure changed from fiber-like to grainy for thin films with higher Al concentration. Moreover, the crystallinity and phase composition were different for ScAlSZ thin films with higher Al concentration: smaller crystallite size and no cubic phase.
It was found that grain impedance was higher than grain boundary impedance for thin films with low concentrations (<3.8 at.%) of Al. On the other hand, grain impedance was lower than grain boundary impedance for thin films with high concentrations of (>3.8 at.%) Al. Zre also increased at higher Al concentrations, resulting in a reduced total ionic conductivity (~10 times). The dominance of Rgb and Zre at high Al concentration could be explained by the presence of a large number of grain boundaries (small crystallite size) and an amorphous phase of Al and Al2O3 in the grain boundaries, which acted as impurities suppressing oxygen ions diffusion. Moreover, dopant vacancy complexes (vacancy dopant cation dipoles or tripoles) with high association energy formed in ScAlSZ thin films due to high Al3+ concentration [15,56,57]. The increase of activation energy above 700 °C was also observed for thin films with high Al concentrations. The post-annealing procedure was conducted to repeat conditions of EIS measurements and perform in situ XRD measurements. The AFM measurements were also done for thin films after EIS measurements. Changes in crystalline structure were expected that could help understand the changes in activation energy when high Al concentrations of Al in thin films exist. It was found that the roughness increased about 1.5 times, and no other changes were observed in the microstructure. On the other hand, XRD analysis revealed that the crystallinity of thin films increased during the annealing procedure. However, it was not possible to identify crystalline phases accurately from XRD patterns. Therefore, Raman measurements were done later to find differences in the structure of ScAlSZ thin films with high and low Al concentrations. It was found that cubic and rhombohedral phases formed in addition to monoclinic and tetragonal phases after annealing ScAlSZ thin films with high Al concentration. Soo et al. and Fabris et al. found that a large number of oxygen vacancies promote cubic phase formation [58,59]. Thus, the existence of the cubic phase indicated a high concentration of oxygen vacancies (correlated with XPS analysis) and the presence of oxygen vacancy complexes. The change in activation energy could appear due to various reasons: trapping of oxygen vacancy, defect concentration, vacancy clusters, space charge layers, an association of the defects with the dopant cations, and coexistence of several phases [60]. The most probable reason for changes in activation energy in our case could be the dissociation of oxygen vacancy complexes. Vacancy-dopant cation dimers or trimers were formed at high concentrations of oxygen vacancies [61]. At higher temperatures (~700 °C in our experiments), those dimers and trimers dissociated entirely, and vacancies became free [3]. In this situation, the activation energy contained only the migration energy part, while in low temperatures, activation energy consisted of association and migration energy parts. Therefore, the slope of activation energy became steeper at high temperatures. At low Al concentration, vacancy concentration was also lower. Therefore, dimers and trimers did not form, and the Arrhenius plots had only one slope. In general, the total ionic conductivity achieved was similar to other authors [8,9,13,15,36,44,45,46,47,48,49,50,51,52]. The highest total conductivity values were found for thin films containing 3.8 at.% of Al. It varied from 1.1 to 19.2 S/m, and the values found in the literature vary from 1 to 31 S/m in the temperature interval 700–1000 °C. Thus, the total conductivity measured in our study was slightly lower than those reported in the literature.

5. Conclusions

This work analyzed the influence of Al concentration on chemical, structural, and electrochemical properties of ScAlSZ thin films (~2 μm). Analysis of XPS spectra (Al2p, Zr3d, and O1s) indicated the increase of oxygen vacancy concentration with a higher Al concentration. It was also determined that the microstructure and crystallinity of the ScAlSZ thin films depended on the Al concentration. The crystallinity of ScAlSZ thin films decreased with increasing Al concentration. Moreover, at low Al concentrations (1.6 and 3.8 at.%), the structure of thin films were composed of cubic, monoclinic, and tetragonal phases, while at high Al concentrations (15.9 and 22.2 at.%), the thin films formed had monoclinic and tetragonal phases. However, the cubic phase formed after annealing thin films with high Al, indicating a high oxygen vacancy concentration. AFM measurements revealed that thin films were uniform, without cracks or visible pores, and with lower roughness at higher Al concentrations.
Electrochemical analysis revealed that the presence of a large number of grain boundaries (low crystallinity), an amorphous phase of Al and Al2O3 in the grain boundaries, and dopant vacancy complexes (vacancy dopant cation dipoles or tripoles) with high association energy suppressed diffusion of oxygen ions when Al concentration was high. Therefore, the grain boundary impedance was higher than grain impedance, and total ionic conductivity was lower by more than 10 times for thin films with higher concentrations of Al (>3.8 at.%). Moreover, Arrhenius plots showed nonlinear dependences when Al concentration in ScAlSZ thin films was 15.9 and 22.2 at.%. Activation energies were ~1.10 eV in the 400–560 °C range and ~1.85 eV in the 720–1000 °C range. The dissociation of oxygen vacancy complexes (vacancy-dopant cation dimers or trimers) could explain a jump in conductivity and increase of activation energy. The highest total ionic conductivity (σbulk = 2.89 Sm−1 at 800 °C) was for annealed ScAlSZ thin films containing 3.8 at.% of Al.

Author Contributions

Conceptualization, G.L. and M.S.; methodology, D.V., M.S., N.K., and G.L.; formal analysis, D.V., M.S., and N.K.; investigation and analysis, D.V. (deposition, electrochemical impedance spectroscopy), N.K. (Raman spectroscopy), and M.S. (X-ray diffraction, energy-dispersive X-ray spectroscopy); writing—original draft preparation, M.S., D.V., and G.L.; writing—review and editing, D.V., M.S., K.B., N.K., and G.L.; visualization, D.V. and N.K.; supervision, G.L.; project administration, K.B.; funding acquisition, G.L. All authors have read and agreed to the published version of the manuscript.

Funding

This research was funded by the European Regional Development Fund according to the supported activity “Research Projects Implemented by World-class Researcher Groups” under Measure No. 01.2.2-LMT-K-718.

Institutional Review Board Statement

Not applicable.

Informed Consent Statement

Not applicable.

Data Availability Statement

Not applicable.

Conflicts of Interest

The authors declare no conflict of interest.

References

  1. Bogicevic, A.; Wolverton, C.; Crosbie, G.M.; Stechel, E.B. Defect ordering in aliovalently doped cubic zirconia from first principles. Phys. Rev. B 2001, 64, 014106. [Google Scholar] [CrossRef]
  2. Xue, Q.N.; Wang, L.G.; Huang, X.W.; Zhang, J.X.; Zhang, H. Influence of codoping on the conductivity of Sc-doped zirconia by first-principles calculations and experiments. Mater. Des. 2018, 160, 131–137. [Google Scholar] [CrossRef]
  3. Arachi, Y.; Sakai, H.; Yamamoto, O.; Takeda, Y.; Imanishai, N. Electrical conductivity of the ZrO2-Ln2O3 (Ln = lanthanides) system. Solid State Ion. 1999, 121, 133–139. [Google Scholar] [CrossRef]
  4. Miller, S.P.; Dunlap, B.I.; Fleischer, A.S. Effects of dopant clustering in cubic zirconia stabilized by yttria and scandia from molecular dynamics. Solid State Ion. 2013, 253, 130–136. [Google Scholar] [CrossRef]
  5. Kilner, J.A.; Druce, J.; Ishihara, T. Electrolytes. In High-Temperature Solid Oxide Fuel Cells for the 21st Century: Fundamentals, Design and Applications, 2nd ed.; Elsevier Inc.: Amsterdam, The Netherlands, 2016; pp. 85–132. ISBN 9780124104532. [Google Scholar]
  6. Hussain, S.; Yangping, L. Review of solid oxide fuel cell materials: Cathode, anode, and electrolyte. Energy Transit. 2020, 4, 113–126. [Google Scholar] [CrossRef]
  7. Sarat, S.; Sammes, N.; Smirnova, A. Bismuth oxide doped scandia-stabilized zirconia electrolyte for the intermediate temperature solid oxide fuel cells. J. Power Sour. 2006, 160, 892–896. [Google Scholar] [CrossRef]
  8. Liu, T.; Zhang, X.; Wang, X.; Yu, J.; Li, L. A review of zirconia-based solid electrolytes. Ionics 2016, 22, 2249–2262. [Google Scholar] [CrossRef]
  9. Guo, C.X.; Wang, J.X.; He, C.R.; Wang, W.G. Effect of alumina on the properties of ceria and scandia co-doped zirconia for electrolyte-supported SOFC. Ceram. Int. 2013, 39, 9575–9582. [Google Scholar] [CrossRef]
  10. Badwal, S.P.S.; Ciacchi, F.T.; Milosevic, D. Scandia-zirconia electrolytes for intermediate temperature solid oxide fuel cell operation. Solid State Ion. 2000, 136–137, 91–99. [Google Scholar] [CrossRef]
  11. Yuan, F.; Wang, J.; Miao, H.; Guo, C.; Wang, W.G. Investigation of the crystal structure and ionic conductivity in the ternary system (Yb2O3)x-(Sc2O3)(0.11–x)-(ZrO2)0.89 (x = 0–0.11). J. Alloys Compd. 2013, 549, 200–205. [Google Scholar] [CrossRef]
  12. Lei, Z.; Zhu, Q. Phase transformation and low temperature sintering of manganese oxide and scandia co-doped zirconia. Mater. Lett. 2007, 61, 1311–1314. [Google Scholar] [CrossRef]
  13. Ishii, T. Structural phase transition and ionic conductivity in 0.88ZrO2(0.12–x)Sc2O3xAl2O3. Solid State Ion. 1995, 78, 333–338. [Google Scholar] [CrossRef]
  14. Chiba, R.; Yoshimura, F.; Yamaki, J.; Ishii, T.; Yonezawa, T.; Endou, K. Ionic conductivity and morphology in Sc2O3 and Al2O3 doped ZrO2 films prepared by the sol-gel method. Solid State Ion. 1997, 104, 259–266. [Google Scholar] [CrossRef]
  15. Haering, C.; Roosen, A.; Schichl, H.; Schnöller, M. Degradation of the electrical conductivity in stabilised zirconia system Part II: Scandia-stabilised zirconia. Solid State Ion. 2005, 176, 261–268. [Google Scholar] [CrossRef]
  16. Sriubas, M.; Kainbayev, N.; Virbukas, D.; Bočkutė, K.; Rutkūnienė, Ž.; Laukaitis, G. Structure and conductivity studies of scandia and alumina doped zirconia thin films. Coatings 2019, 9, 317. [Google Scholar] [CrossRef] [Green Version]
  17. Kainbayev, N.; Sriubas, M.; Bockute, K.; Virbukas, D.; Laukaitis, G. E-beam deposition of scandia-stabilized zirconia (ScSZ) thin films Co-doped with Al. Coatings 2020, 10, 870. [Google Scholar] [CrossRef]
  18. Feighery, A.J.; Irvine, J.T.S. Effect of alumina additions upon electrical properties of 8 mol.% yttria-stabilized zirconia. Solid State Ion. 1999, 121, 209–216. [Google Scholar] [CrossRef]
  19. Rizea, A.; Chirlesan, D.; Petot, C.; Petot-Ervas, G. The influence of alumina on the microstructure and grain boundary conductivity of yttria-doped zirconia. Solid State Ion. 2002, 146, 341–353. [Google Scholar] [CrossRef]
  20. Lee, J.-H.; Mori, T.; Li, J.-G.; Ikegami, T.; Komatsu, M.; Haneda, H. Improvement of grain-boundary conductivity of 8 mol.% yttria-stabilized zirconia by precursor scavenging of siliceous phase. J. Electrochem. Soc. 2000, 147, 2822. [Google Scholar] [CrossRef]
  21. Kumar, B.; Chen, C.; Varanasi, C.; Fellner, J.P. Electrical properties of heterogeneously doped yttria stabilized zirconia. J. Power Sources 2005, 140, 12–20. [Google Scholar] [CrossRef]
  22. Kumar, A.; Jaiswal, A.; Sanbui, M.; Omar, S. Oxygen-ion conduction in scandia-stabilized zirconia-ceria solid electrolyte (xSc2O3-1CeO2-(99−x)ZrO2, 5 ≤ x ≤ 11). J. Am. Ceram. Soc. 2017, 100, 659–668. [Google Scholar] [CrossRef]
  23. Zakaria, Z.; Abu Hassan, S.H.; Shaari, N.; Yahaya, A.Z.; Boon Kar, Y. A review on recent status and challenges of yttria stabilized zirconia modification to lowering the temperature of solid oxide fuel cells operation. Int. J. Energy Res. 2020, 44, 631–650. [Google Scholar] [CrossRef]
  24. Tanhaei, M.; Mozammel, M. Yttria-stabilized zirconia thin film electrolyte deposited by EB-PVD on porous anode support for SOFC applications. Ceram. Int. 2017, 43, 3035–3042. [Google Scholar] [CrossRef]
  25. Laukaitis, G.; Virbukas, D. The structural and electrical properties of GDC10 thin films formed by e-beam technique. Solid State Ion. 2013, 247–248, 41–47. [Google Scholar] [CrossRef]
  26. Hirata, T.; Asari, E.; Kitajima, M. Infrared and raman spectroscopic studies of ZrO2 polymorphs doped with Y2O3 or CeO2. J. Solid State Chem. 1994, 110, 201–207. [Google Scholar] [CrossRef]
  27. Russian Journal of Non-Ferrous Metals. Home. Available online: https://www.springer.com/journal/11981 (accessed on 25 January 2021).
  28. Singh, R.K.; Singh, P. Electrical conductivity of barium substituted LSGM electrolyte materials for IT-SOFC. Solid State Ion. 2014, 262, 428–432. [Google Scholar] [CrossRef]
  29. Ganguly, A.; Sharma, S.; Papakonstantinou, P.; Hamilton, J. Probing the thermal deoxygenation of graphene oxide using high-resolution in situ X-ray-based spectroscopies. J. Phys. Chem. C 2011, 115, 17009–17019. [Google Scholar] [CrossRef] [Green Version]
  30. Milanov, A.P.; Xu, K.; Cwik, S.; Parala, H.; De Los Arcos, T.; Becker, H.W.; Rogalla, D.; Cross, R.; Paul, S.; Devi, A. Sc2O3, Er2O3, and Y2O3 thin films by MOCVD from volatile guanidinate class of rare-earth precursors. Dalt. Trans. 2012, 41, 13936–13947. [Google Scholar] [CrossRef]
  31. Corsi, J.S.; Fu, J.; Wang, Z.; Lee, T.; Ng, A.K.; Detsi, E. Hierarchical bulk nanoporous aluminum for on-site generation of hydrogen by hydrolysis in pure water and combustion of solid fuels. ACS Sustain. Chem. Eng. 2019, 7, 11194–11204. [Google Scholar] [CrossRef]
  32. Raja, J.; Nguyen, C.P.T.; Lee, C.; Balaji, N.; Chatterjee, S.; Jang, K.; Kim, H.; Yi, J. Improved data retention of InSnZnO nonvolatile memory by H2O2 treated Al2O3 tunneling layer: A cost-effective method. IEEE Electron Device Lett. 2016, 37, 1272–1275. [Google Scholar] [CrossRef]
  33. Morant, C.; Sanz, J.M.; Galán, L.; Soriano, L.; Rueda, F. An XPS study of the interaction of oxygen with zirconium. Surf. Sci. 1989, 218, 331–345. [Google Scholar] [CrossRef]
  34. Young Choi, J.; Sig Kim, S.; Yeol Lee, S. Effect of hafnium addition on Zn-Sn-O thin film transistors fabricated by solution process. Appl. Phys. Lett. 2012, 100, 022109. [Google Scholar] [CrossRef]
  35. Liu, G.X.; Liu, A.; Meng, Y.; Shan, F.K.; Shin, B.C.; Lee, W.J.; Cho, C.R. Annealing dependence of solution-processed ultra-thin ZrOx films for gate dielectric applications. J. Nanosci. Nanotechnol. 2015, 15, 2185–2191. [Google Scholar] [CrossRef] [PubMed]
  36. Dasari, H.P.; Ahn, J.S.; Ahn, K.; Park, S.Y.; Hong, J.; Kim, H.; Yoon, K.J.; Son, J.W.; Lee, H.W.; Lee, J.H. Synthesis, sintering and conductivity behavior of ceria-doped scandia-stabilized zirconia. Solid State Ion. 2014, 263, 103–109. [Google Scholar] [CrossRef]
  37. Li, L.; Wang, W. Synthesis and characterization of monoclinic ZrO2 nanorods by a novel and simple precursor thermal decomposition approach. Solid State Commun. 2003, 127, 639–643. [Google Scholar] [CrossRef]
  38. Clarke, D.R.; Adar, F. Measurement of the crystallographically transformed zone produced by fracture in ceramics containing tetragonal zirconia. J. Am. Ceram. Soc. 1982, 65, 284–288. [Google Scholar] [CrossRef]
  39. Basahel, S.N.; Ali, T.T.; Mokhtar, M.; Narasimharao, K. Influence of crystal structure of nanosized ZrO2 on photocatalytic degradation of methyl orange. Nanoscale Res. Lett. 2015, 10, 73. [Google Scholar] [CrossRef] [PubMed] [Green Version]
  40. Gazzoli, D.; Mattei, G.; Valigi, M. Raman and X-ray investigations of the incorporation of Ca2+ and Cd2+ in the ZrO2 structure. J. Raman Spectrosc. 2007, 38, 824–831. [Google Scholar] [CrossRef]
  41. Nomura, K.; Mizutani, Y.; Kawai, M.; Nakamura, Y.; Yamamoto, O. Aging and Raman scattering study of scandia and yttria doped zirconia. Solid State Ion. 2000, 132, 235–239. [Google Scholar] [CrossRef]
  42. Kumar, A.; Jaiswal, A.; Sanbui, M.; Omar, S. Scandia stabilized zirconia-ceria solid electrolyte (xSc1CeSZ, 5 <x <11) for IT-SOFCs: Structure and conductivity studies. Scr. Mater. 2016, 121, 10–13. [Google Scholar] [CrossRef]
  43. Xue, Q.; Huang, X.; Zhang, H.; Xu, H.; Zhang, J.; Wang, L. Synthesis and characterization of high ionic conductivity ScSZ core/shell nanocomposites. J. Rare Earths 2017, 35, 567–573. [Google Scholar] [CrossRef]
  44. Apriany, K.; Permadani, I.; Syarif, D.G.; Soepriyanto, S.; Rahmawati, F. Electrical conductivity of zirconia and yttrium-doped zirconia from indonesian local zircon as prospective material for fuel cells. In Proceedings of the IOP Conference Series: Materials Science and Engineering, Solo, Indonesia, 8–9 September 2015; Institute of Physics Publishing: Bristol, UK, 2016; Volume 107, p. 012023. [Google Scholar]
  45. Araki, W.; Koshikawa, T.; Yamaji, A.; Adachi, T. Degradation mechanism of scandia-stabilised zirconia electrolytes: Discussion based on annealing effects on mechanical strength, ionic conductivity, and Raman spectrum. Solid State Ion. 2009, 180, 1484–1489. [Google Scholar] [CrossRef]
  46. Angeles-Rosas, M.; Camacho-López, M.A.; Ruiz-Trejo, E. Structure, conductivity and luminescence of 8 mol.% scandia-doped zirconia prepared by sol-gel. Solid State Ion. 2010, 181, 1349–1354. [Google Scholar] [CrossRef]
  47. Lei, Z.; Zhu, Q. Low temperature processing of dense nanocrystalline scandia-doped zirconia (ScSZ) ceramics. Solid State Ion. 2005, 176, 2791–2797. [Google Scholar] [CrossRef]
  48. Borik, M.A.; Bredikhin, S.I.; Bublik, V.T.; Kulebyakin, A.V.; Kuritsyna, I.E.; Lomonova, E.E.; Milovich, P.O.; Myzina, V.A.; Osiko, V.V.; Ryabochkina, P.A.; et al. Structure and conductivity of yttria and scandia-doped zirconia crystals grown by skull melting. J. Am. Ceram. Soc. 2017, 100, 5536–5547. [Google Scholar] [CrossRef]
  49. Zarkov, A.; Stanulis, A.; Sakaliuniene, J.; Butkute, S.; Abakeviciene, B.; Salkus, T.; Tautkus, S.; Orliukas, A.F.; Tamulevicius, S.; Kareiva, A. On the synthesis of yttria-stabilized zirconia: A comparative study. J. Sol-Gel Sci. Technol. 2015, 76, 309–319. [Google Scholar] [CrossRef]
  50. Ahamer, C.; Opitz, A.K.; Rupp, G.M.; Fleig, J. Revisiting the temperature dependent ionic conductivity of yttria stabilized zirconia (YSZ). J. Electrochem. Soc. 2017, 164, F790–F803. [Google Scholar] [CrossRef]
  51. Ota, Y.; Ikeda, M.; Sakuragi, S.; Iwama, Y.; Sonoyama, N.; Ikeda, S.; Hirano, A.; Imanishi, N.; Takeda, Y.; Yamamoto, O. Crystal structure and oxygen ion conductivity of Ga3+ Co-doped scandia-stabilized zirconia. J. Electrochem. Soc. 2010, 157, B1707. [Google Scholar] [CrossRef]
  52. Sonoyama, N.; Martin, S.G.; Amador, U.; Imanishi, N.; Ikeda, M.; Erfu, N.; Tanimura, H.; Hirano, A.; Takeda, Y.; Yamamoto, O. Crystal structure and electrical properties of magnesia Co-doped scandia stabilized zirconia. J. Electrochem. Soc. 2015, 162, F1397–F1401. [Google Scholar] [CrossRef]
  53. Wang, Z.; Cheng, M.; Bi, Z.; Dong, Y.; Zhang, H.; Zhang, J.; Feng, Z.; Li, C. Structure and impedance of ZrO2 doped with Sc2O3 and CeO2. Mater. Lett. 2005, 59, 2579–2582. [Google Scholar] [CrossRef]
  54. Lyamina, G.; Ilela, A.; Khasanov, O.; Petyukevich, M.; Vaitulevich, E. Synthesis of Al2O3-ZrO2 powders from differently concentrated suspensions with a spray drying technique. In Proceedings of the AIP Conference Proceedings, Tomsk, Russia, 26–29 April 2016; American Institute of Physics Inc.: College Park, MD, USA, 2016; Volume 1772, p. 20011. [Google Scholar]
  55. Barna, P.B.; Adamik, M. Fundamental structure forming phenomena of polycrystalline films and the structure zone models. Thin Solid Films 1998, 317, 27–33. [Google Scholar] [CrossRef]
  56. Haering, C.; Roosen, A.; Schichl, H. Degradation of the electrical conductivity in stabilised zirconia systems Part I: Yttria-stabilised zirconia. Solid State Ion. 2005, 176, 253–259. [Google Scholar] [CrossRef]
  57. Vijaya Lakshmi, V.; Bauri, R.; Gandhi, A.S.; Paul, S. Synthesis and characterization of nanocrystalline ScSZ electrolyte for SOFCs. Int. J. Hydrog. Energy 2011, 36, 14936–14942. [Google Scholar] [CrossRef]
  58. Soo, Y.L.; Chen, P.J.; Huang, S.H.; Shiu, T.J.; Tsai, T.Y.; Chow, Y.H.; Lin, Y.C.; Weng, S.C.; Chang, S.L.; Wang, G.; et al. Local structures surrounding Zr in nanostructurally stabilized cubic zirconia: Structural origin of phase stability. J. Appl. Phys. 2008, 104, 113535. [Google Scholar] [CrossRef] [Green Version]
  59. Fabris, S.; Paxton, A.T.; Finnis, M.W. A stabilization mechanism of zirconia based on oxygen vacancies only. Acta Mater. 2002, 50, 5171–5178. [Google Scholar] [CrossRef] [Green Version]
  60. Thangadurai, P.; Sabarinathan, V.; Bose, A.C.; Ramasamy, S. Conductivity behaviour of a cubic/tetragonal phase stabilized nanocrystalline La2O3—ZrO2. J. Phys. Chem. Solids 2004, 65, 1905–1912. [Google Scholar] [CrossRef]
  61. Ding, H.; Virkar, A.V.; Liu, F. Defect configuration and phase stability of cubic versus tetragonal yttria-stabilized zirconia. Solid State Ion. 2012, 215, 16–23. [Google Scholar] [CrossRef]
Figure 1. XPS spectra of ScAlSZ thin films: (a) Zr 3d and (b) O 1s.
Coatings 11 00800 g001
Figure 2. AFM images of ScAlSZ thin films: (a,c) cAl = 1.6 at.% and (b,c) cAl = 15.9 at.%.
Coatings 11 00800 g002
Figure 3. (a) XRD patterns and (b) Raman spectra of ScAlSZ thin films.
Coatings 11 00800 g003
Figure 4. (a) Nyquist plots of ScAlSZ thin films with 15.9 and 1.6 at.% of Al at 560 °C and (b) Arrhenius’ plots of ScAlSZ thin films with different Al concentrations.
Coatings 11 00800 g004
Figure 5. Surface roughness of ScAlSZ thin films: as-deposited and after annealing.
Coatings 11 00800 g005
Figure 6. XRD patterns of ScAlSZ thin films during annealing process containing different Al concentration: (a) 15.9 at.% and (b) 22.2 at.%.
Coatings 11 00800 g006
Figure 7. Raman spectra measurements of 6ScAlSZ thin ceramic films deposited on Alloy600 in annealing process (30–900 °C) containing 15.9 and 22.2 at.% of Al: (a) range of 100 to 550 cm−1 and (b) range of 100 to 900 cm−1.
Coatings 11 00800 g007
Table 1. EDS analysis results of ScAlSZ thin films deposited on 450 °C substrates (vd—deposition rate, and c—atomic concentration).
vd, nm/scO, at.%cAl, at.%cAl3+, at.%cSc, at.%cZr, at.%
0.253.315.911.83.427.4
0.450.222.220.13.424.2
1.255.61.61.47.435.4
1.654.13.83.57.734.4
Powder52.012.6-3.932.5
Table 2. The ratio of monoclinic, tetragonal, and cubic phases of deposited ScAlSZ thin films.
ScAlSZ PhasecAl = 1.6 at.%cAl = 3.8 at.%cAl = 15.9 at.%cAl = 22.2 at.%
Monoclinic22%18%18%31%
Tetragonal42%40%82%69%
Cubic36%42%0%0%
Table 3. Bulk ionic conductivity (σbulk) at 520 and 800 °C and their activation energy (Ea) of 6ScAlSZ thin ceramic films formed at the different aluminum concentration (cAl).
cAl, at.%Temperature Range
Range 1Range 2
σ, S/mEa, eVσ, S/mEa, eV
1.60.0331.162.741.16
3.80.0381.142.891.14
15.90.00281.100.1231.79
22.20.00251.080.1051.93
Table 4. Total conductivities of ZrO2 based compounds (σtot), highest total conductivities in our study (σ3.8 at.%).
CompoundPhaseσtot, S/mσ3.8 at.%, S/mTm, °CFormation MethodRef.
ZrO2tetragonal31.8750caustic fusion method[44]
Doped ZrO2
Sc0.7Zr0.93O2tetragonal + cubic2519.21000solid-state reaction[45]
Sc0.08Zr0.92O2cubic25.815.2950sol–gel[46]
Sc0.09Zr0.91O2cubic + tetragonal + rhombohedral3119.21000solid-state reaction[45]
Sc0.10Zr0.90O2cubic61.8750solid-state reaction[15]
Sc0.11Zr0.89O2rhombohedral9.32.9800co-precipitation combined with supercritical ethanol drying route[47]
Y0.7Zr0.93O2tetragonal + cubic5.510.9900skull melting[48]
Y0.08Zr0.92O2monoclinic +cubic11.1700sol–gel[49]
Y0.09Zr0.91O2monoclinic +cubic1.52.9800 [8]
Y0.10Zr0.90O2cubic6.210.9900skull melting[48]
Y0.11Zr0.89O2cubic6.516.2950crystalline sample oxide-mixing method[50]
Co-doped ZrO2
Al0.01Sc0.10Zr0.89O2cubic9.22.9800conventional tape-casting method[9]
Al0.001Sc0.12Zr0.88O2rhombohedral104.6850solid-state reaction[13]
Al0.005Sc0.12Zr0.88O2cubic124.6850solid-state reaction[13]
Ga0.01Sc0.10Zr0.89O2cubic1310.9900Sol-gel[51]
Ga0.07Sc0.04Zr0.89O2monoclinic + tetragonal1.610.9900Sol-gel[51]
Yb0.01Sc0.10Zr0.89O2cubic3119.21000solid-state reaction[45]
Yb0.02Sc0.10Zr0.88O2cubic2419.21000solid-state reaction[45]
Ce0.01Sc0.10Zr0.89O2cubic7.910.9900self combustion synthesis[36]
Mg0.03Sc0.08Zr0.89O2cubic1010.9900Sol-gel[52]
Table 5. Ratio of monoclinic, tetragonal and rhombohedral, and cubic phases of annealed ScAlSZ thin films.
ScAlSZ PhasecAl = 15.9 at.%cAl = 22.2 at.%
Monoclinic16%15%
Tetragonal + Rhombohedral61%61%
Cubic23%24%
Publisher’s Note: MDPI stays neutral with regard to jurisdictional claims in published maps and institutional affiliations.

