
Mechanical, Electrochemical, and Osteoblastic Properties of Gradient Tantalum Coatings on Ti6Al4V Prepared by Plasma Alloying Technique


Abstract
1. Introduction
2. Material and Methods
2.1. Sample Preparation
2.2. Samples Characterization
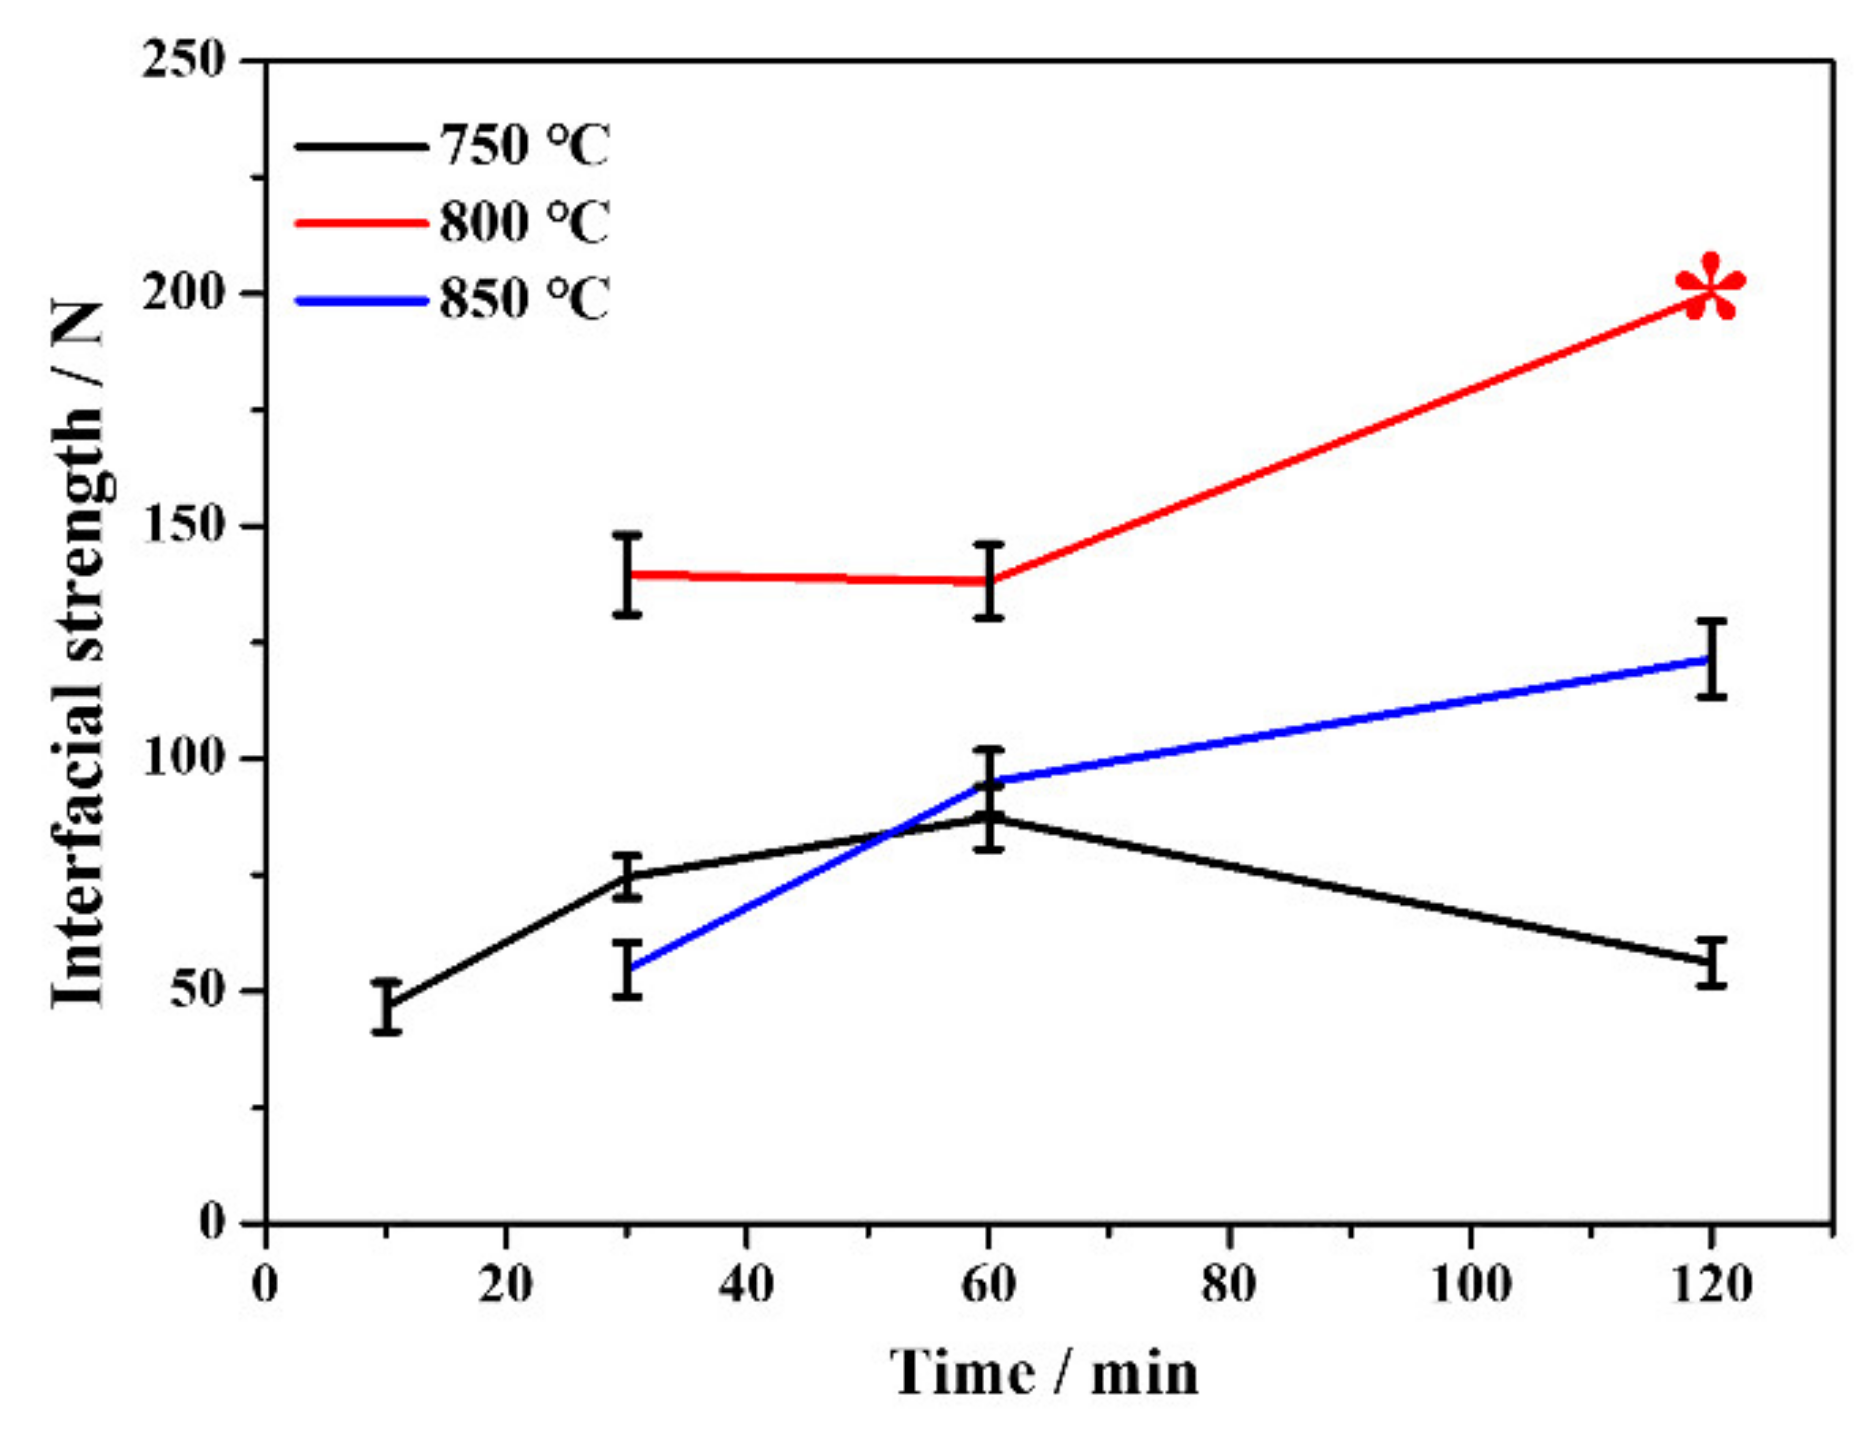
2.3. Scratch Test
2.4. Electrochemical Measurement
2.5. Wear Resistance
2.6. Cell Culture
2.7. Cytotoxicity
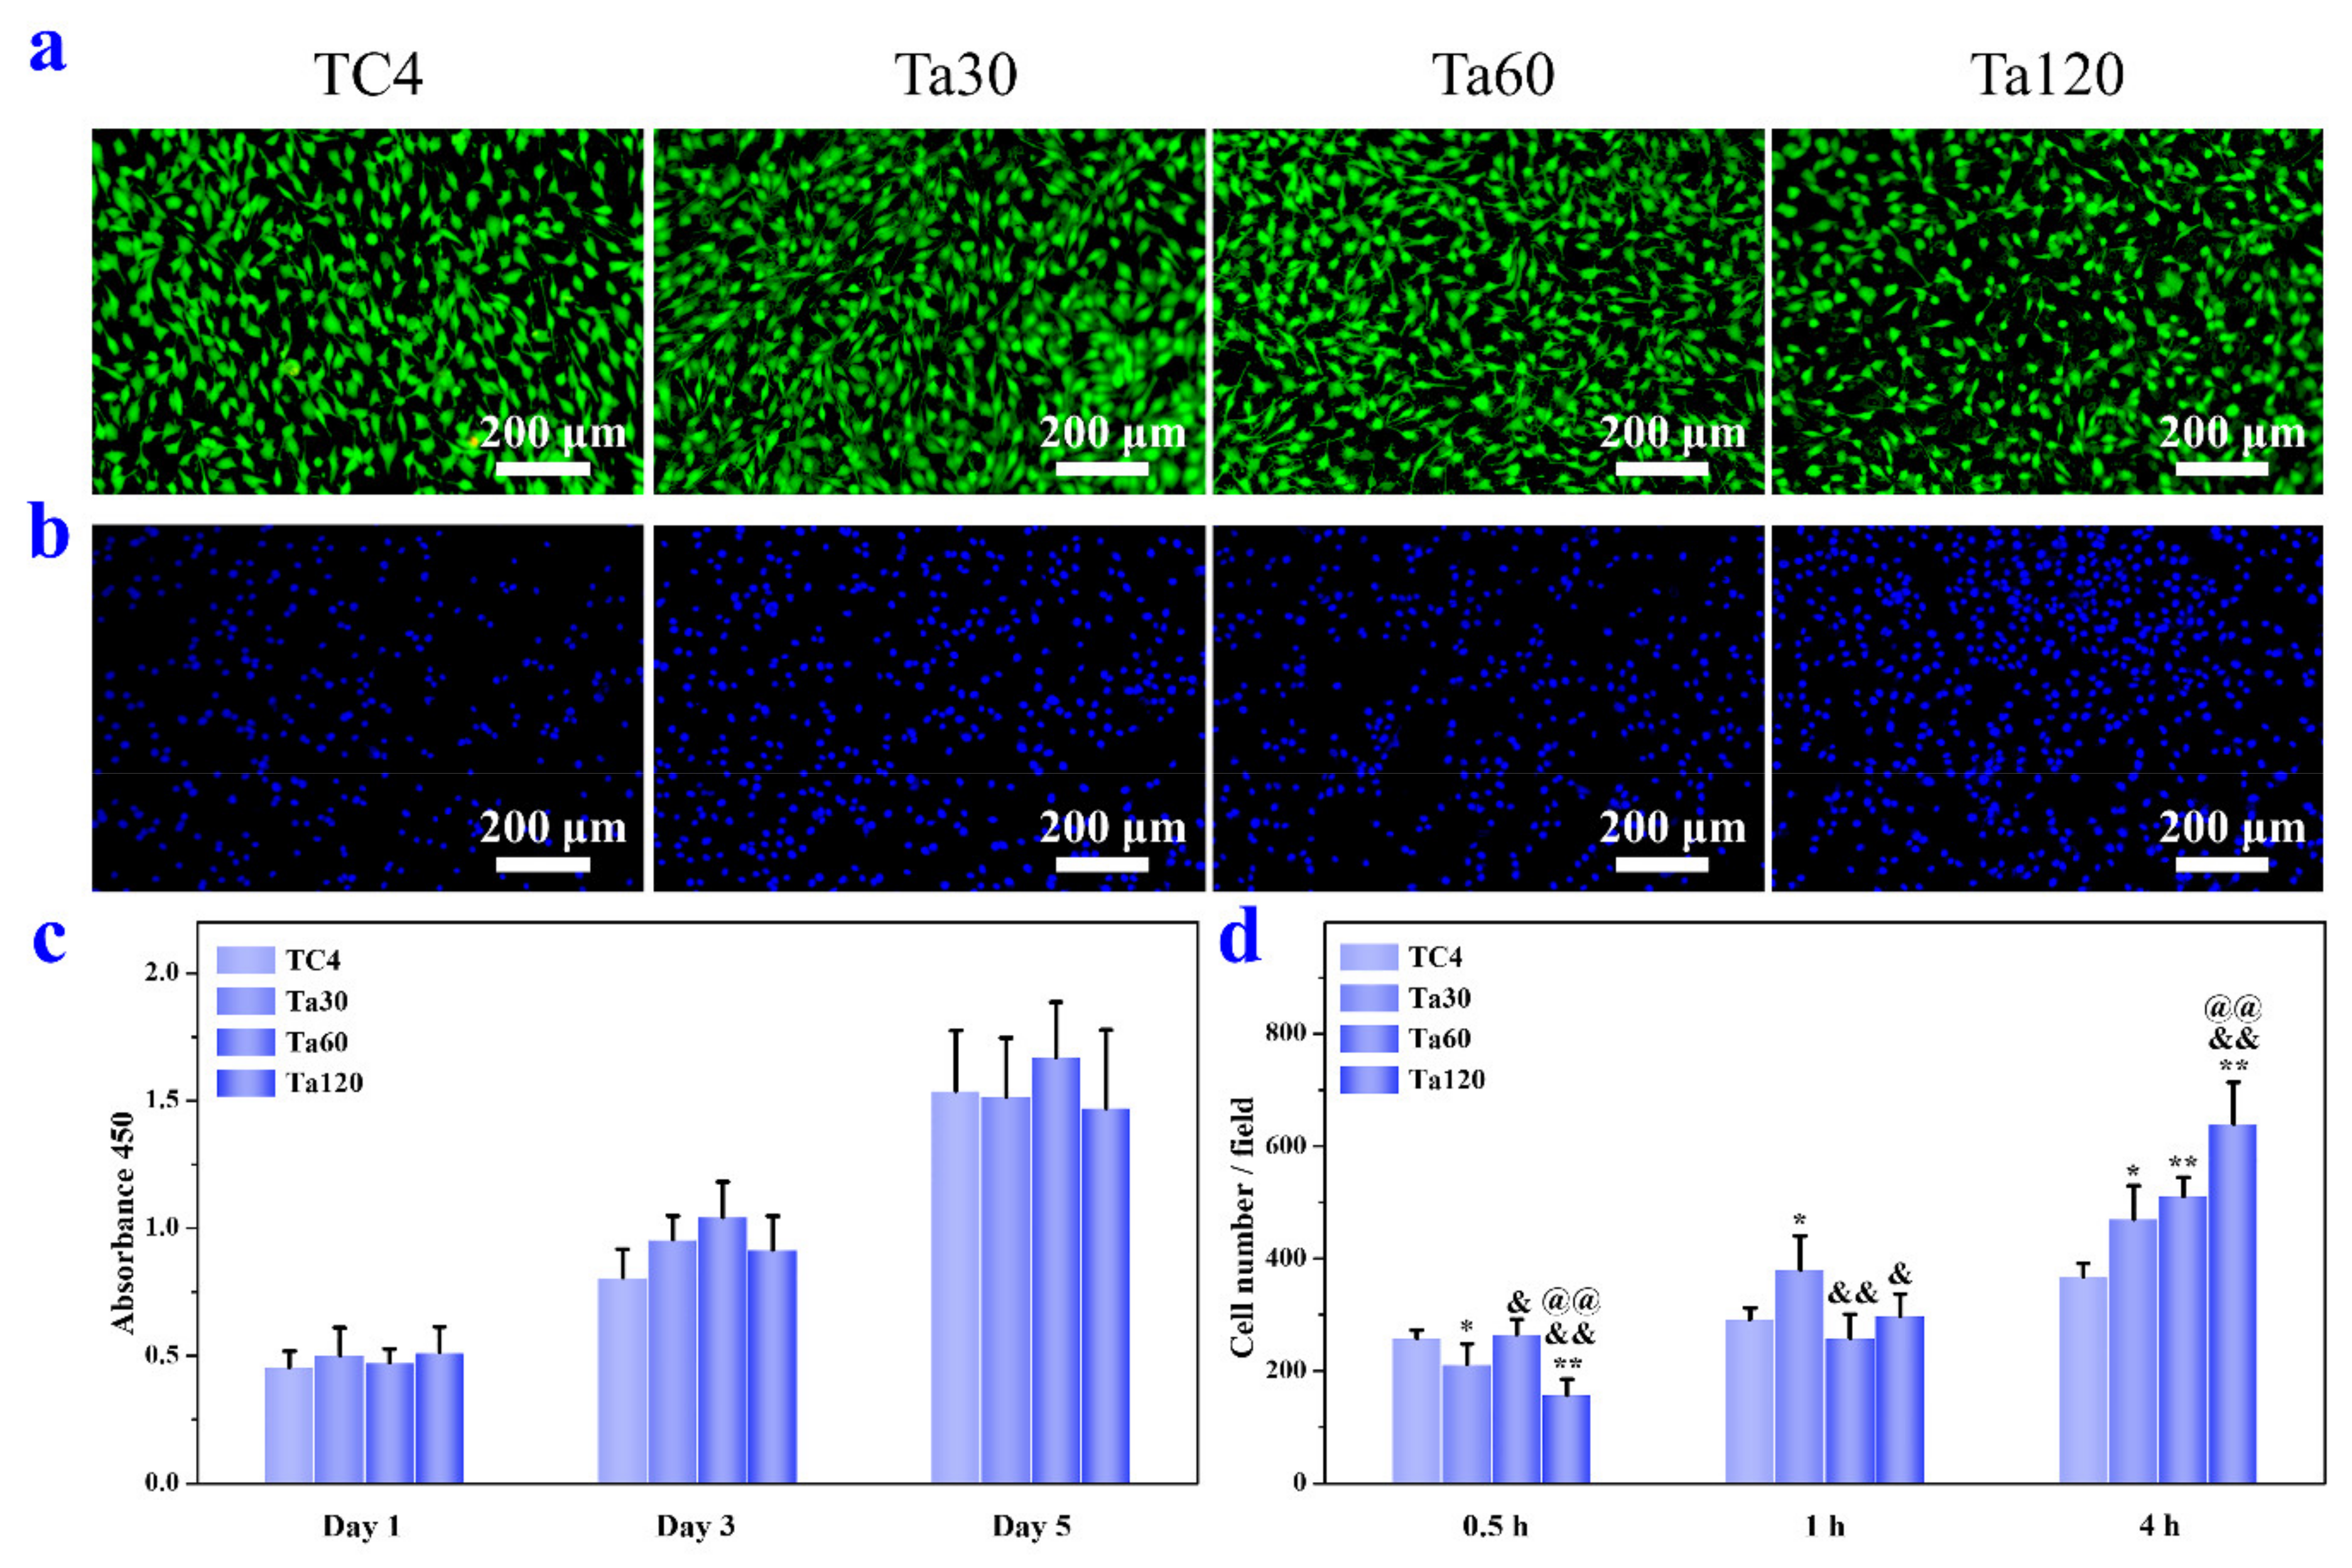
2.8. Cell Adhesion
2.9. Cell Viability
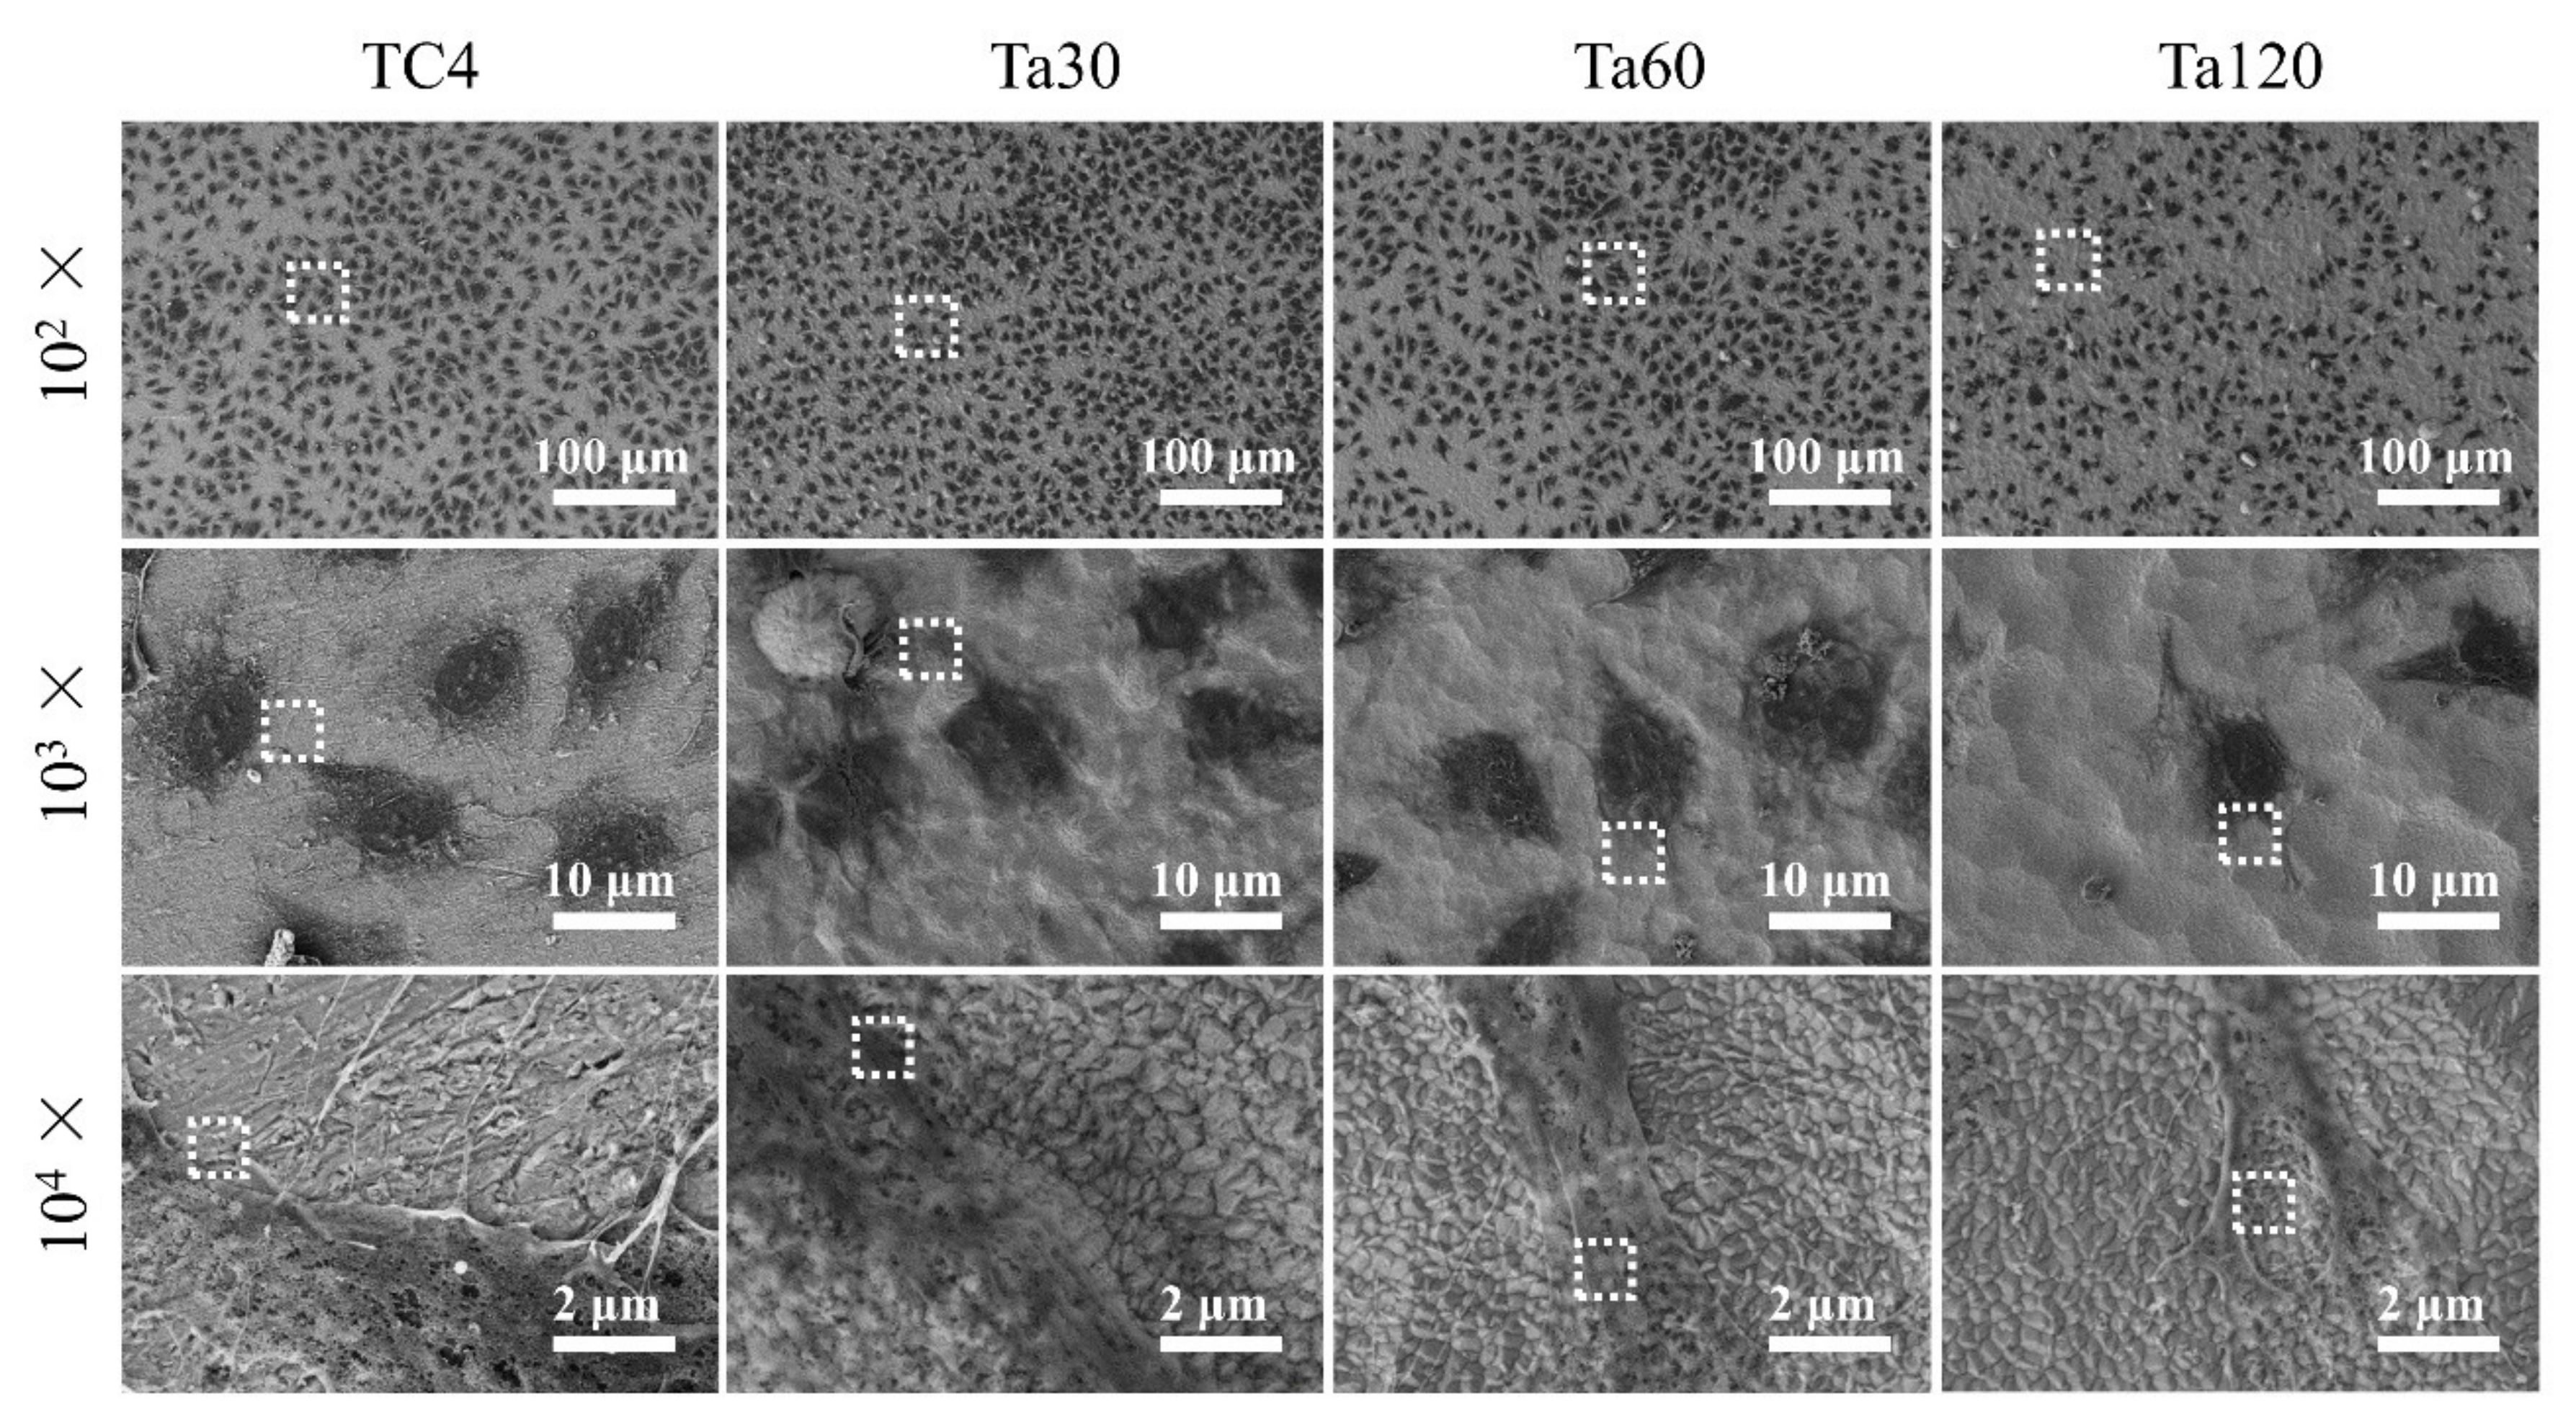
2.10. Cell Morphology
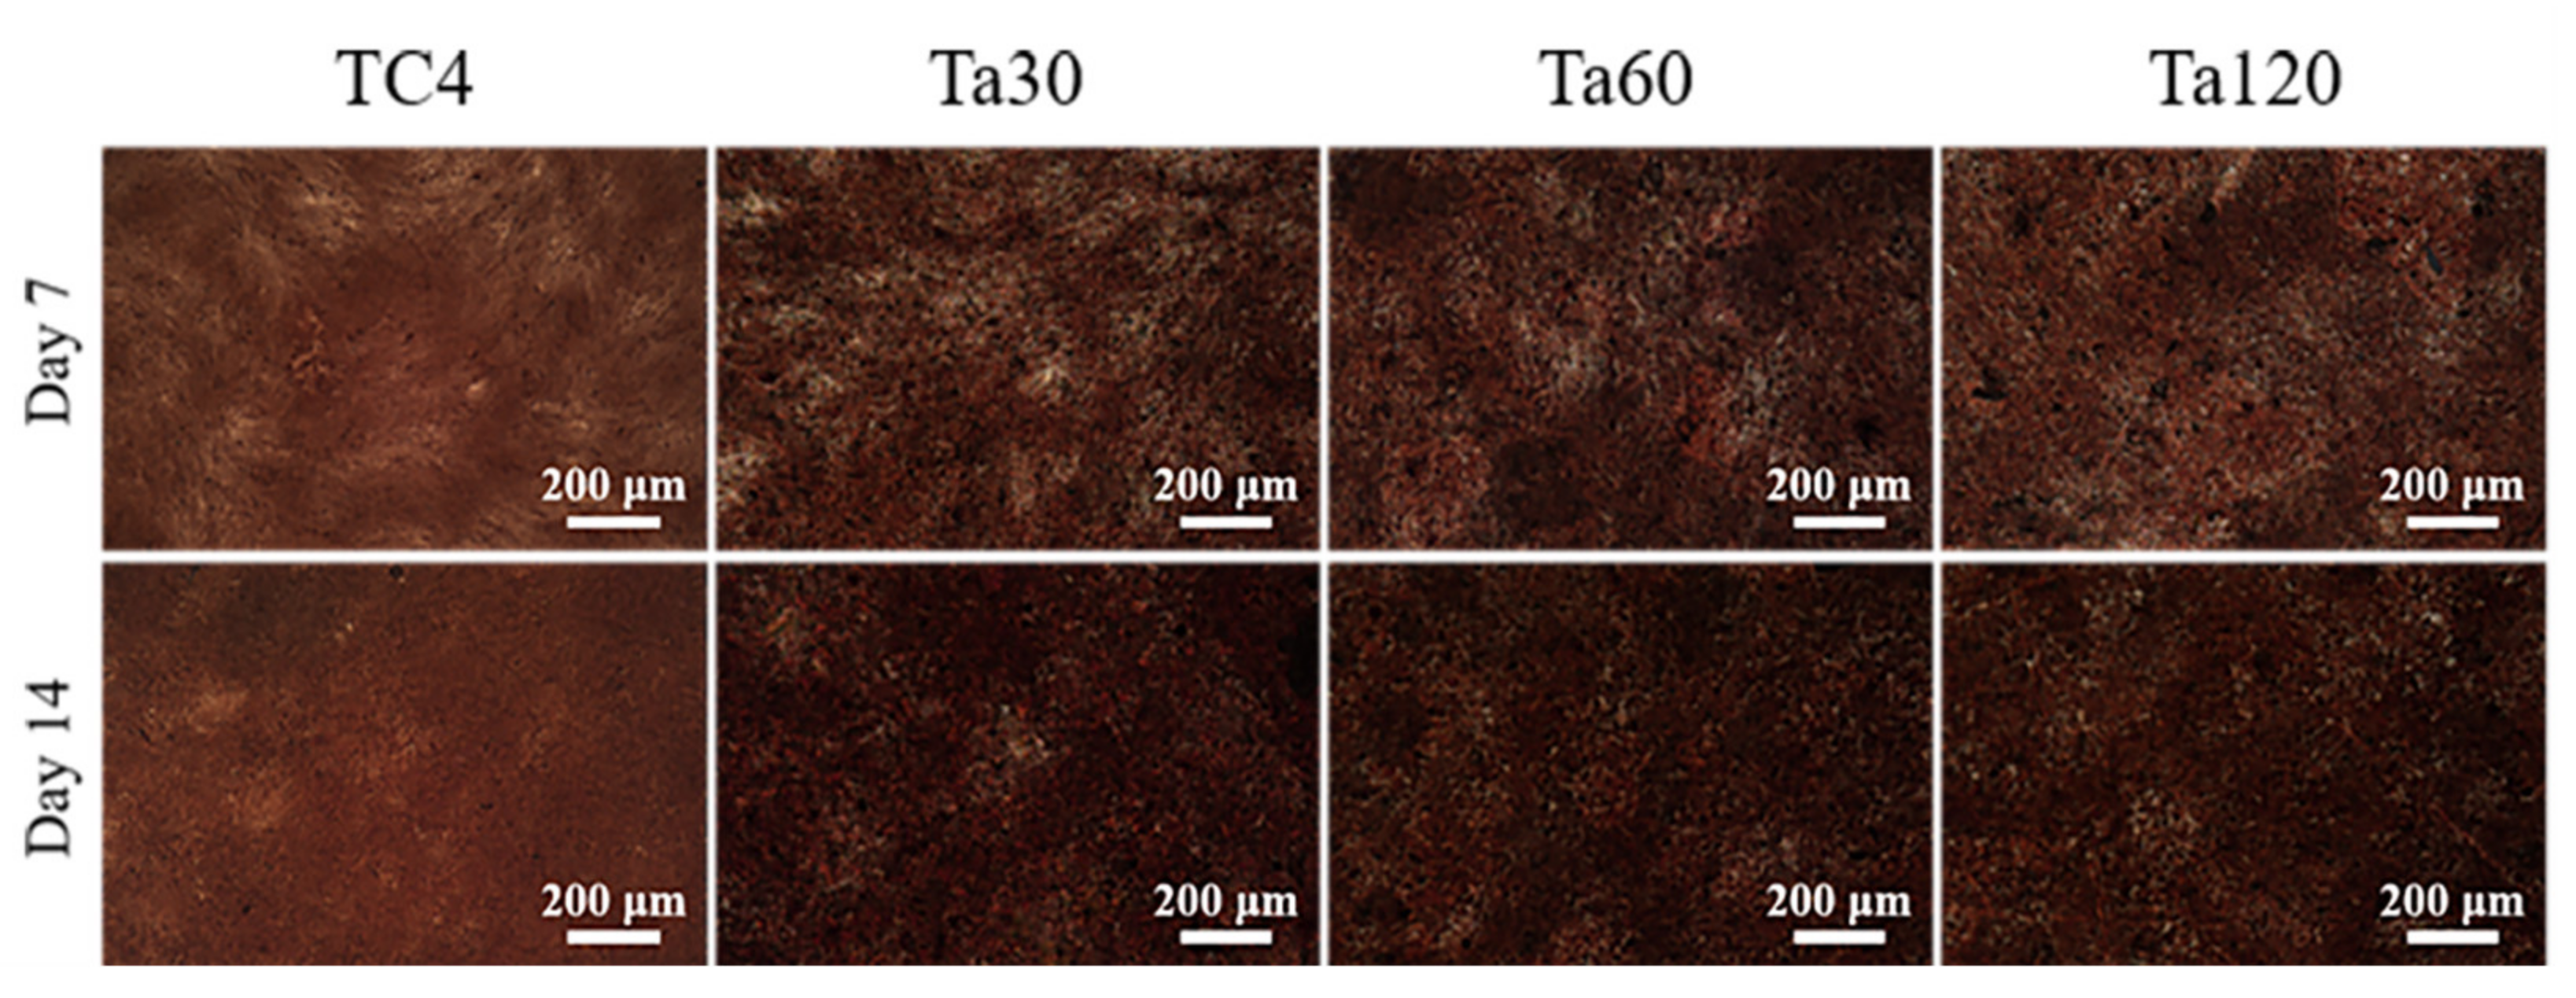
2.11. Extracellular Matrix Mineralization
2.12. Statistic Analysis
3. Results and Discussion
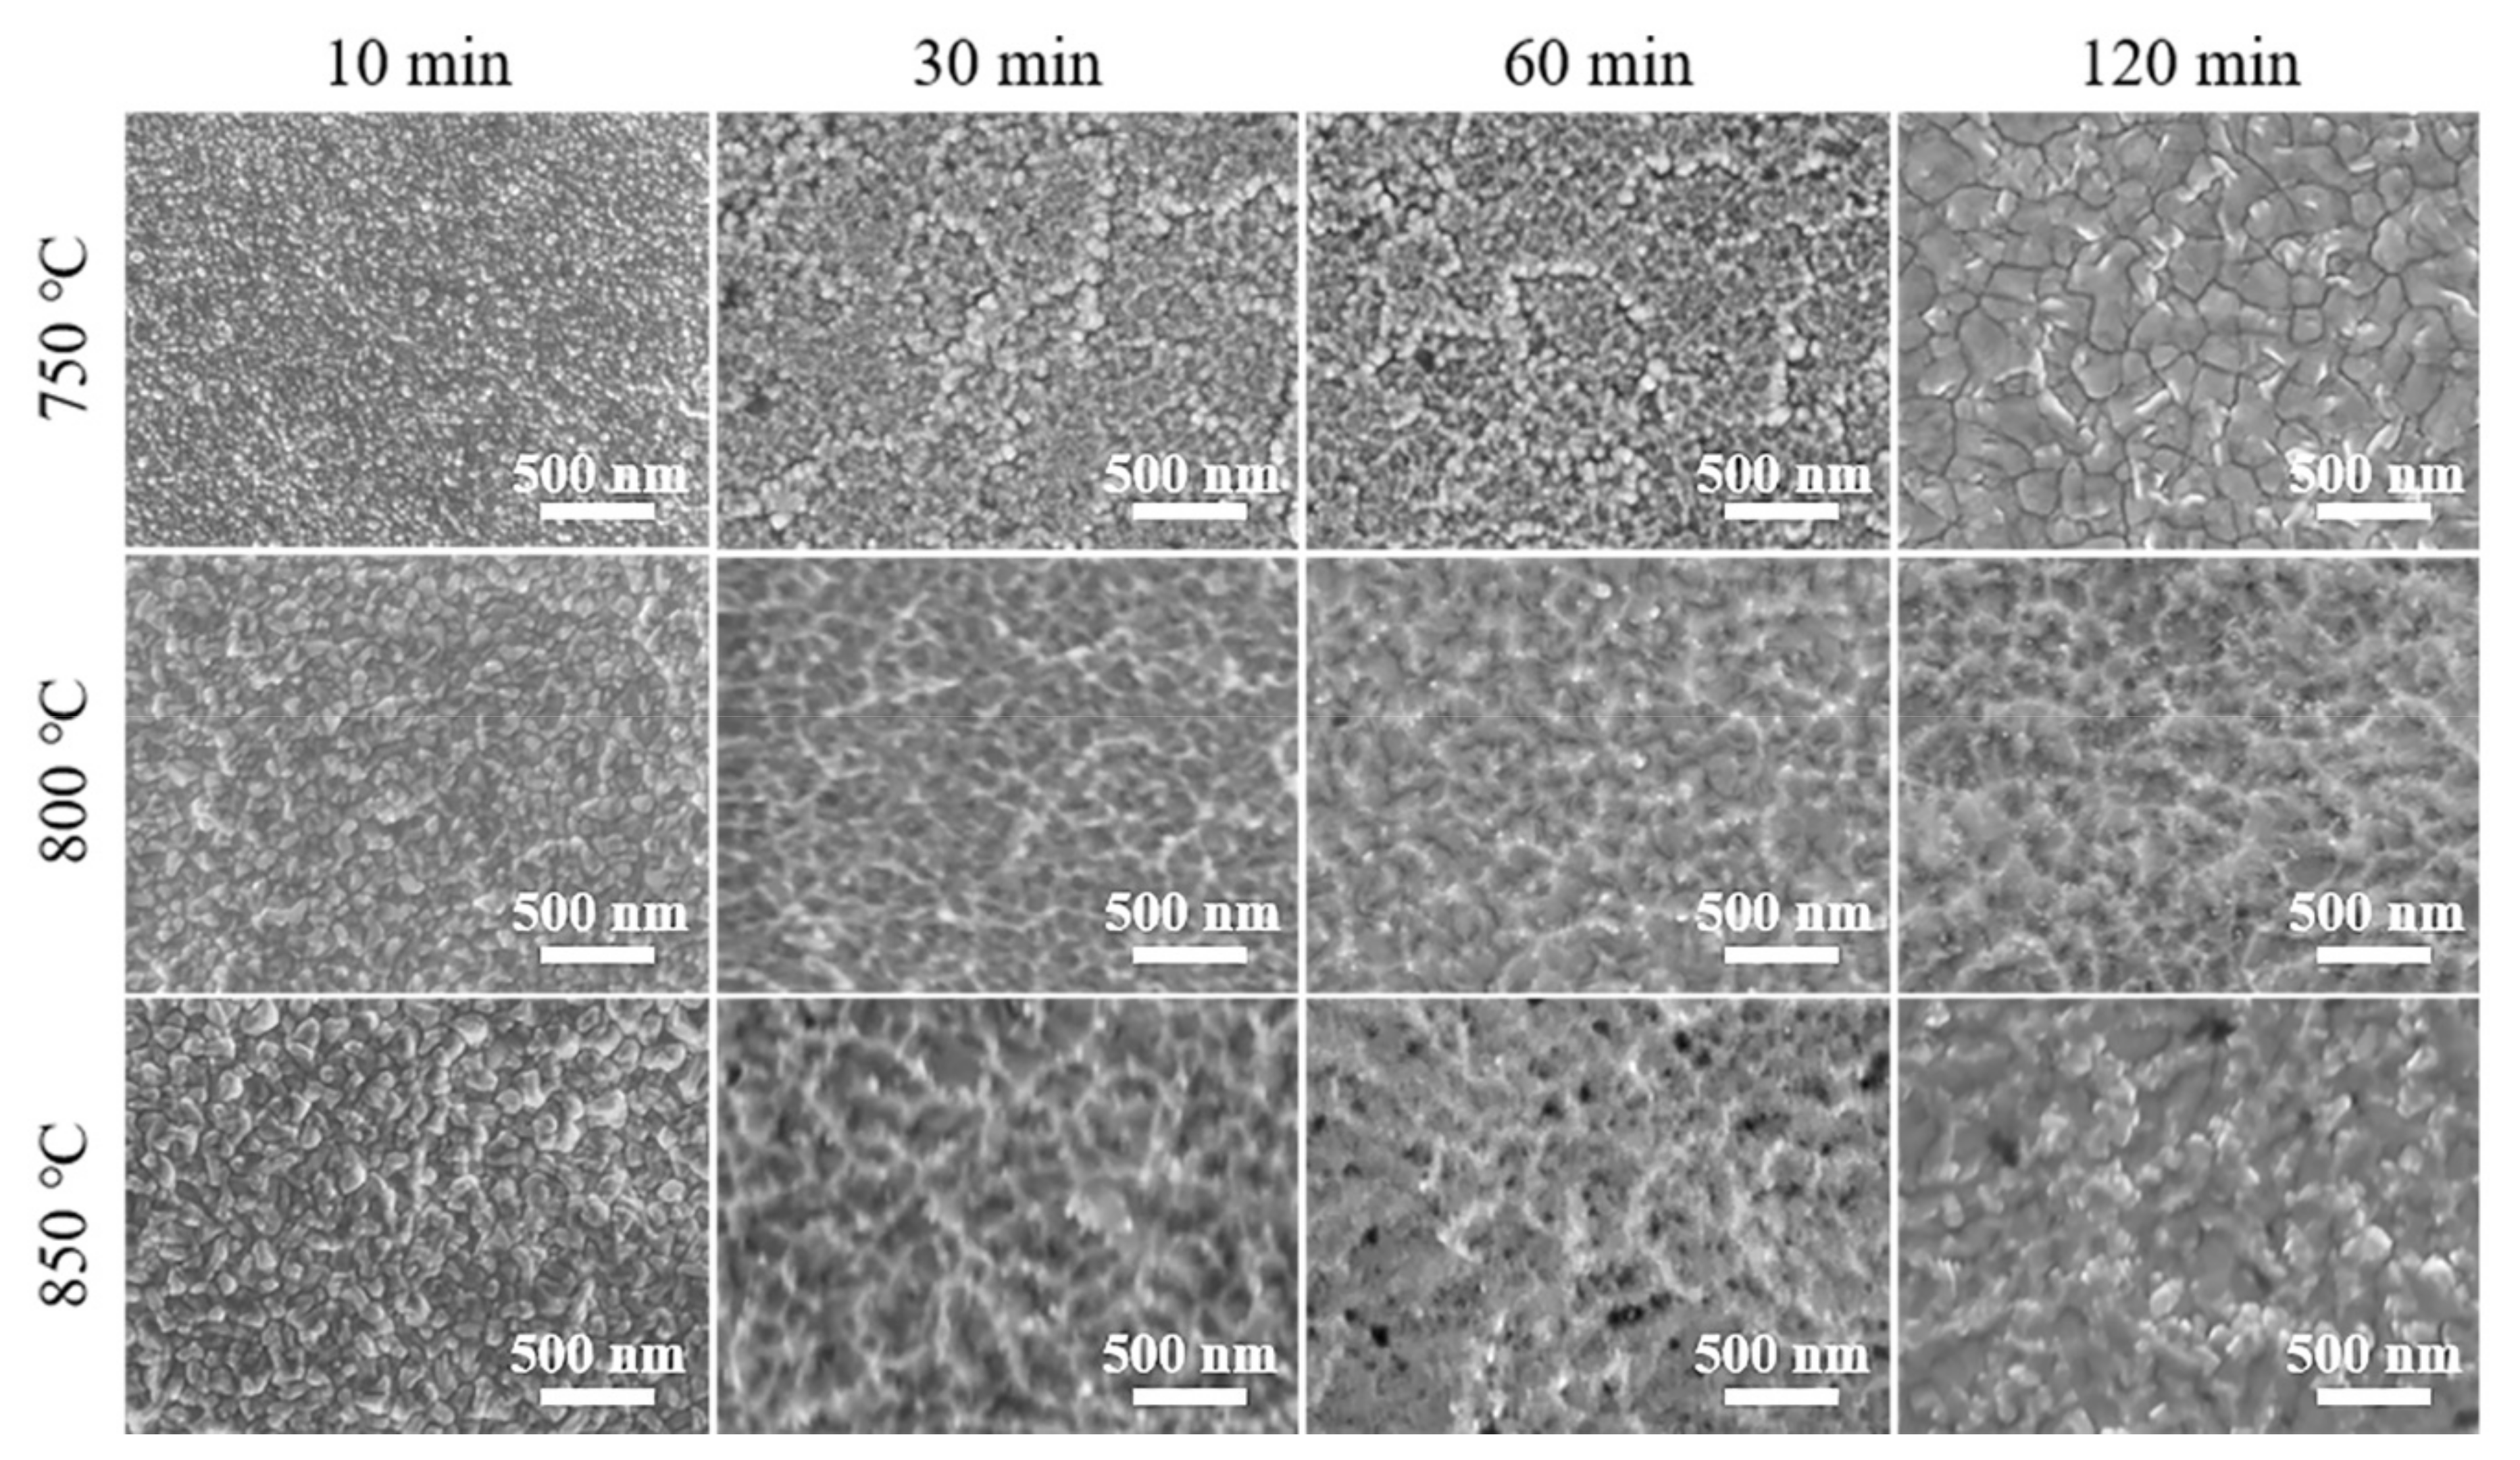
3.1. Parameter Optimization of Plasma Ta Alloying Technique
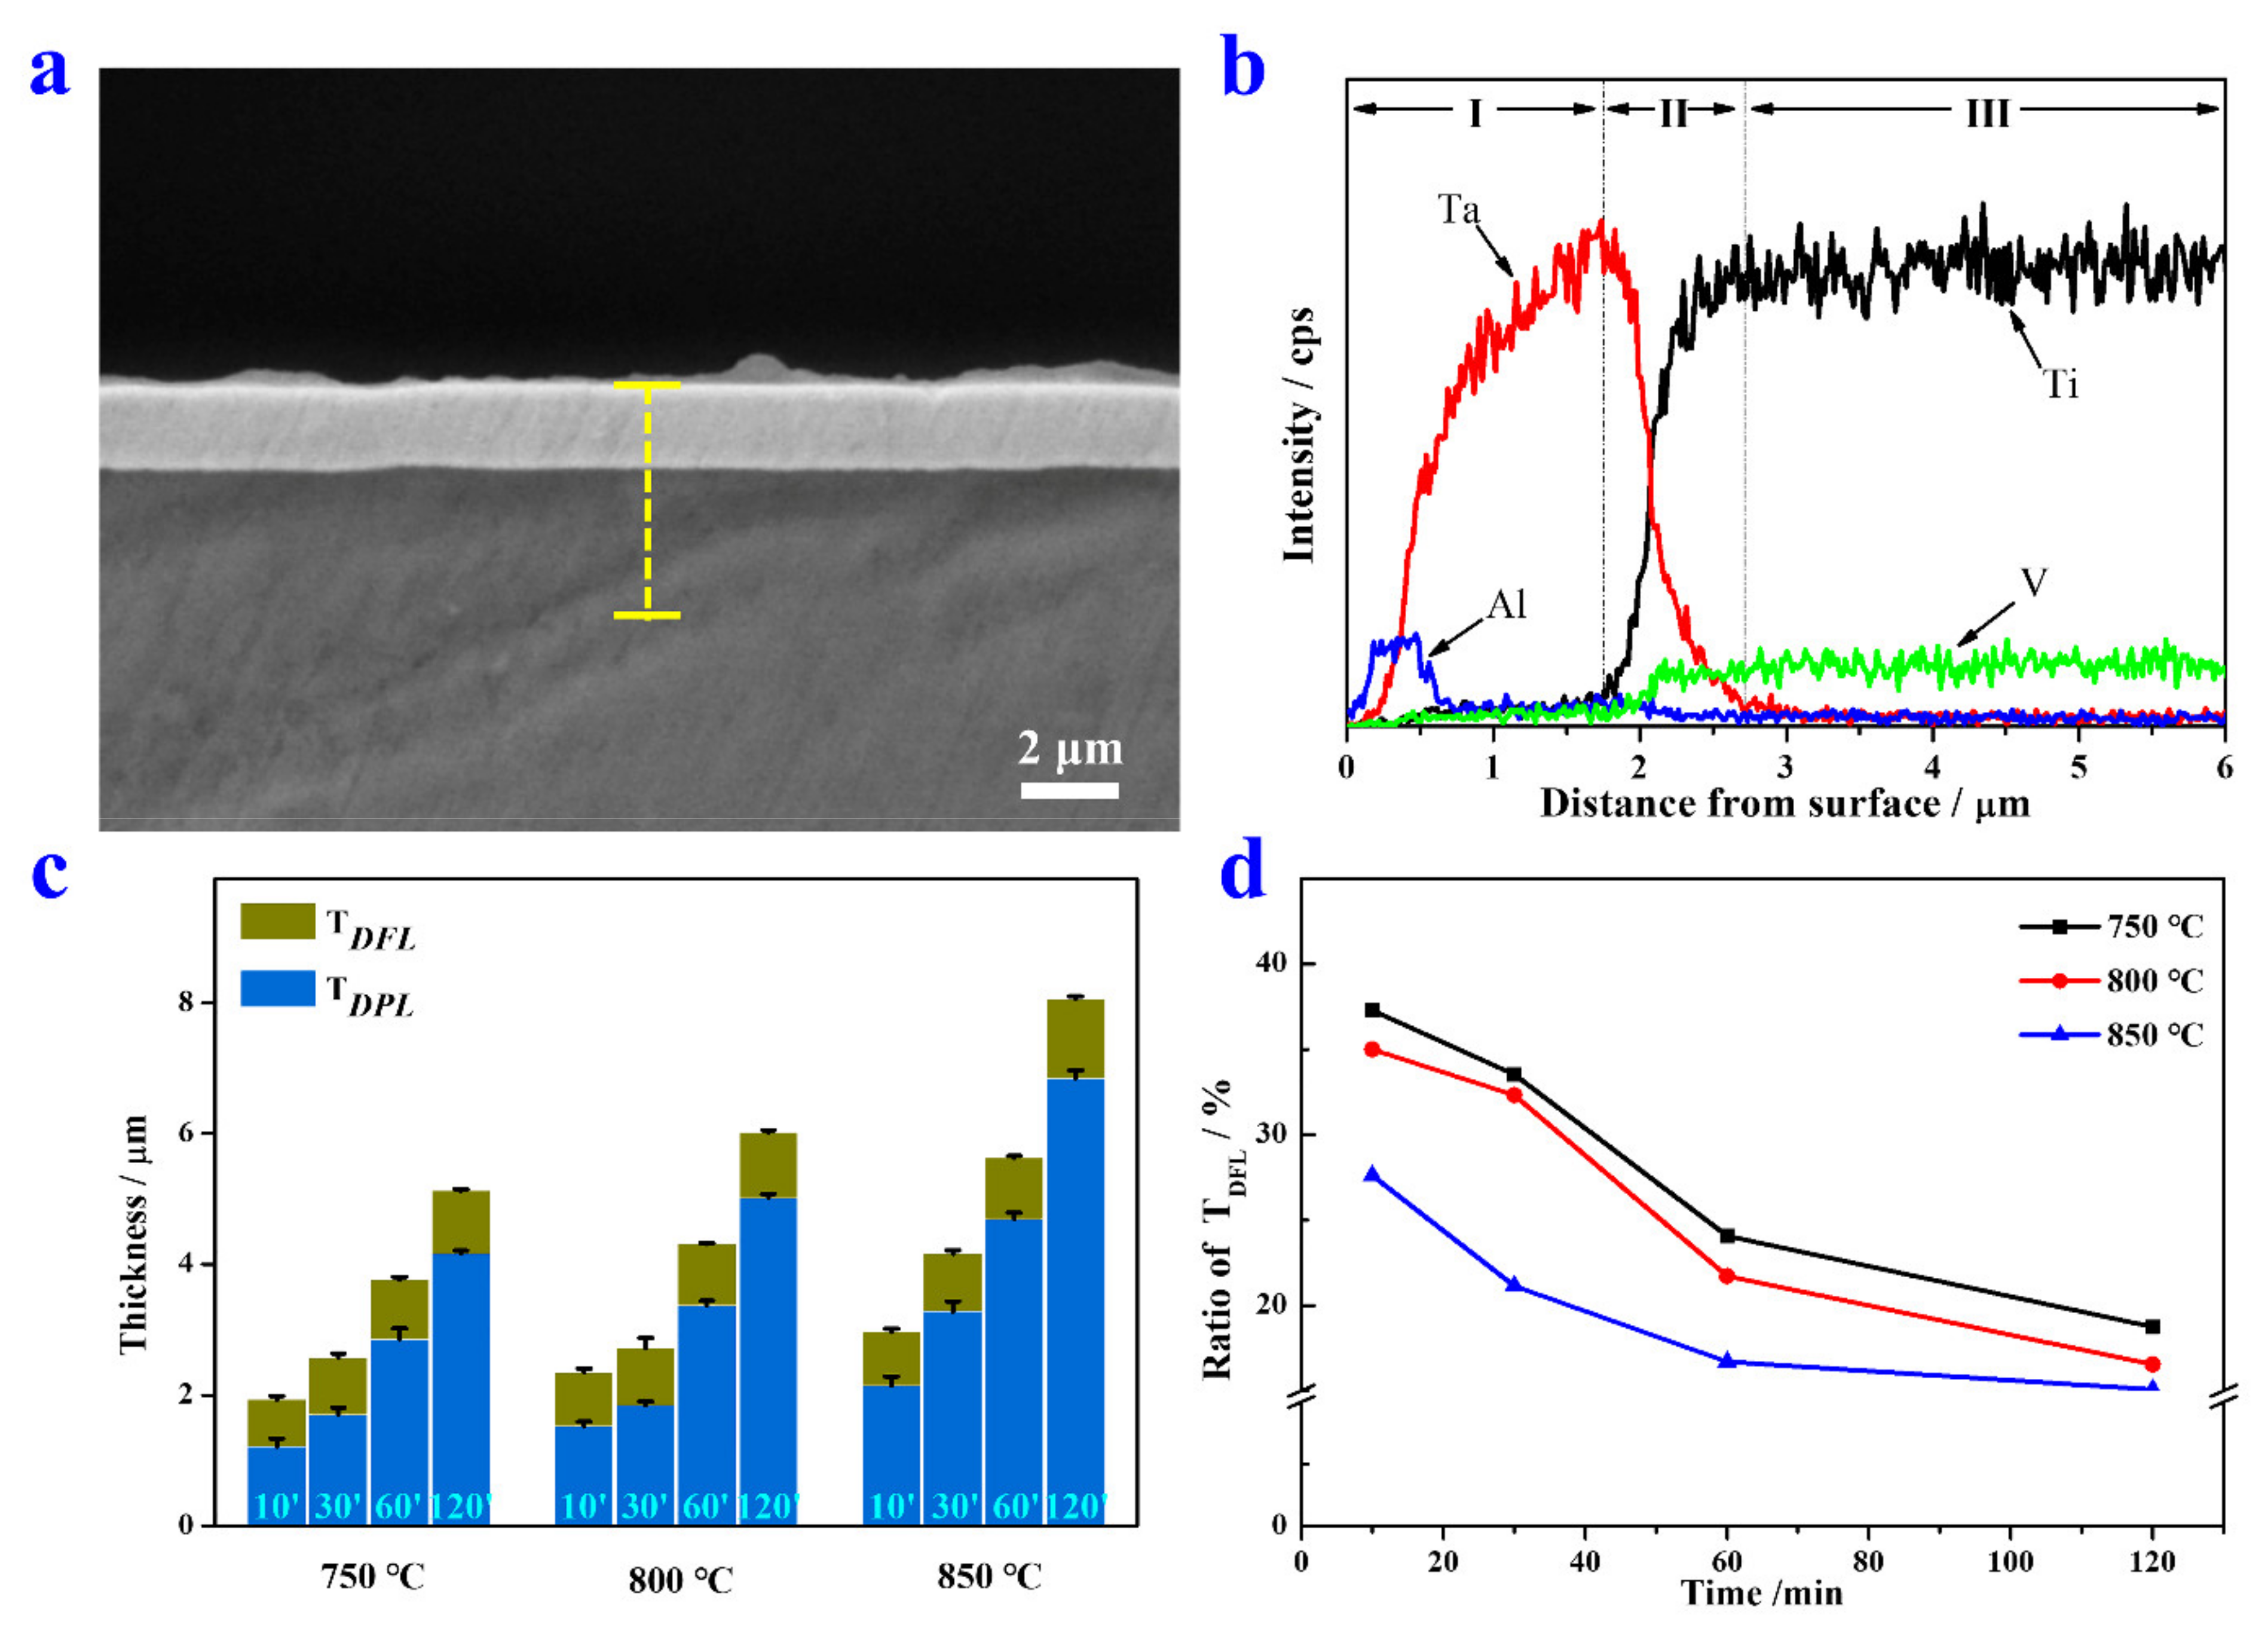
3.2. Characterization of Ta Coating
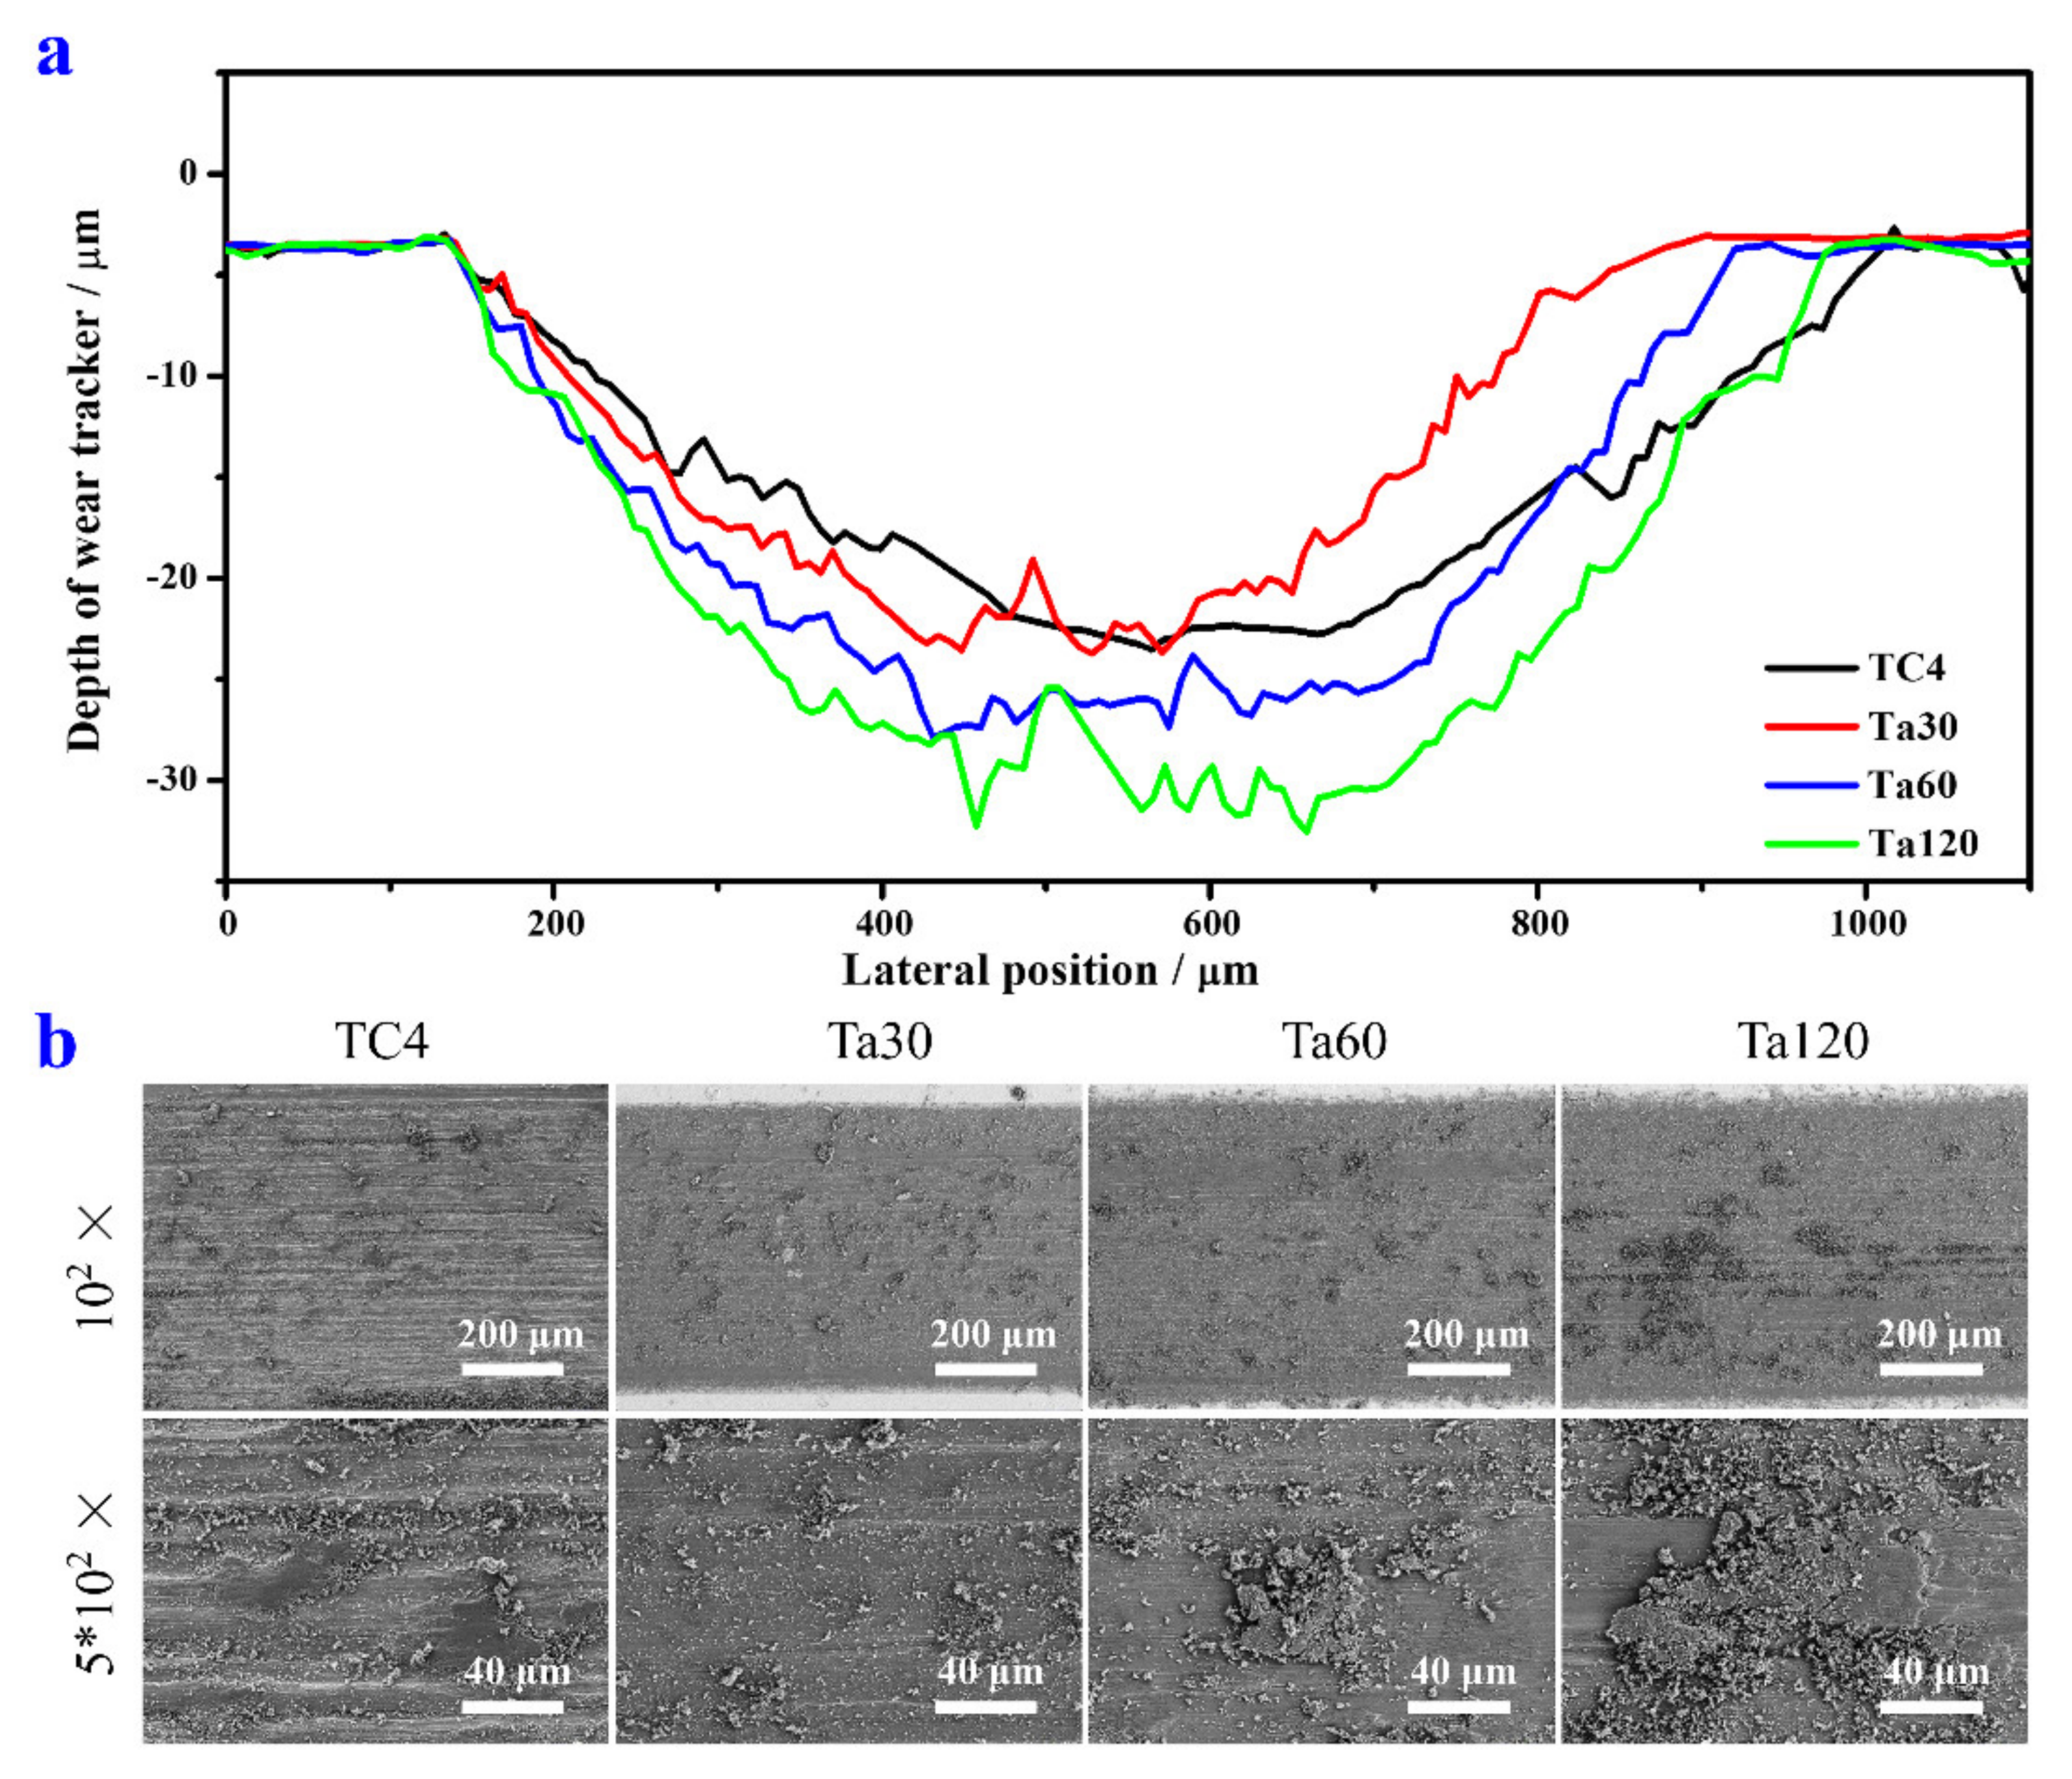
3.3. Wear Resistance
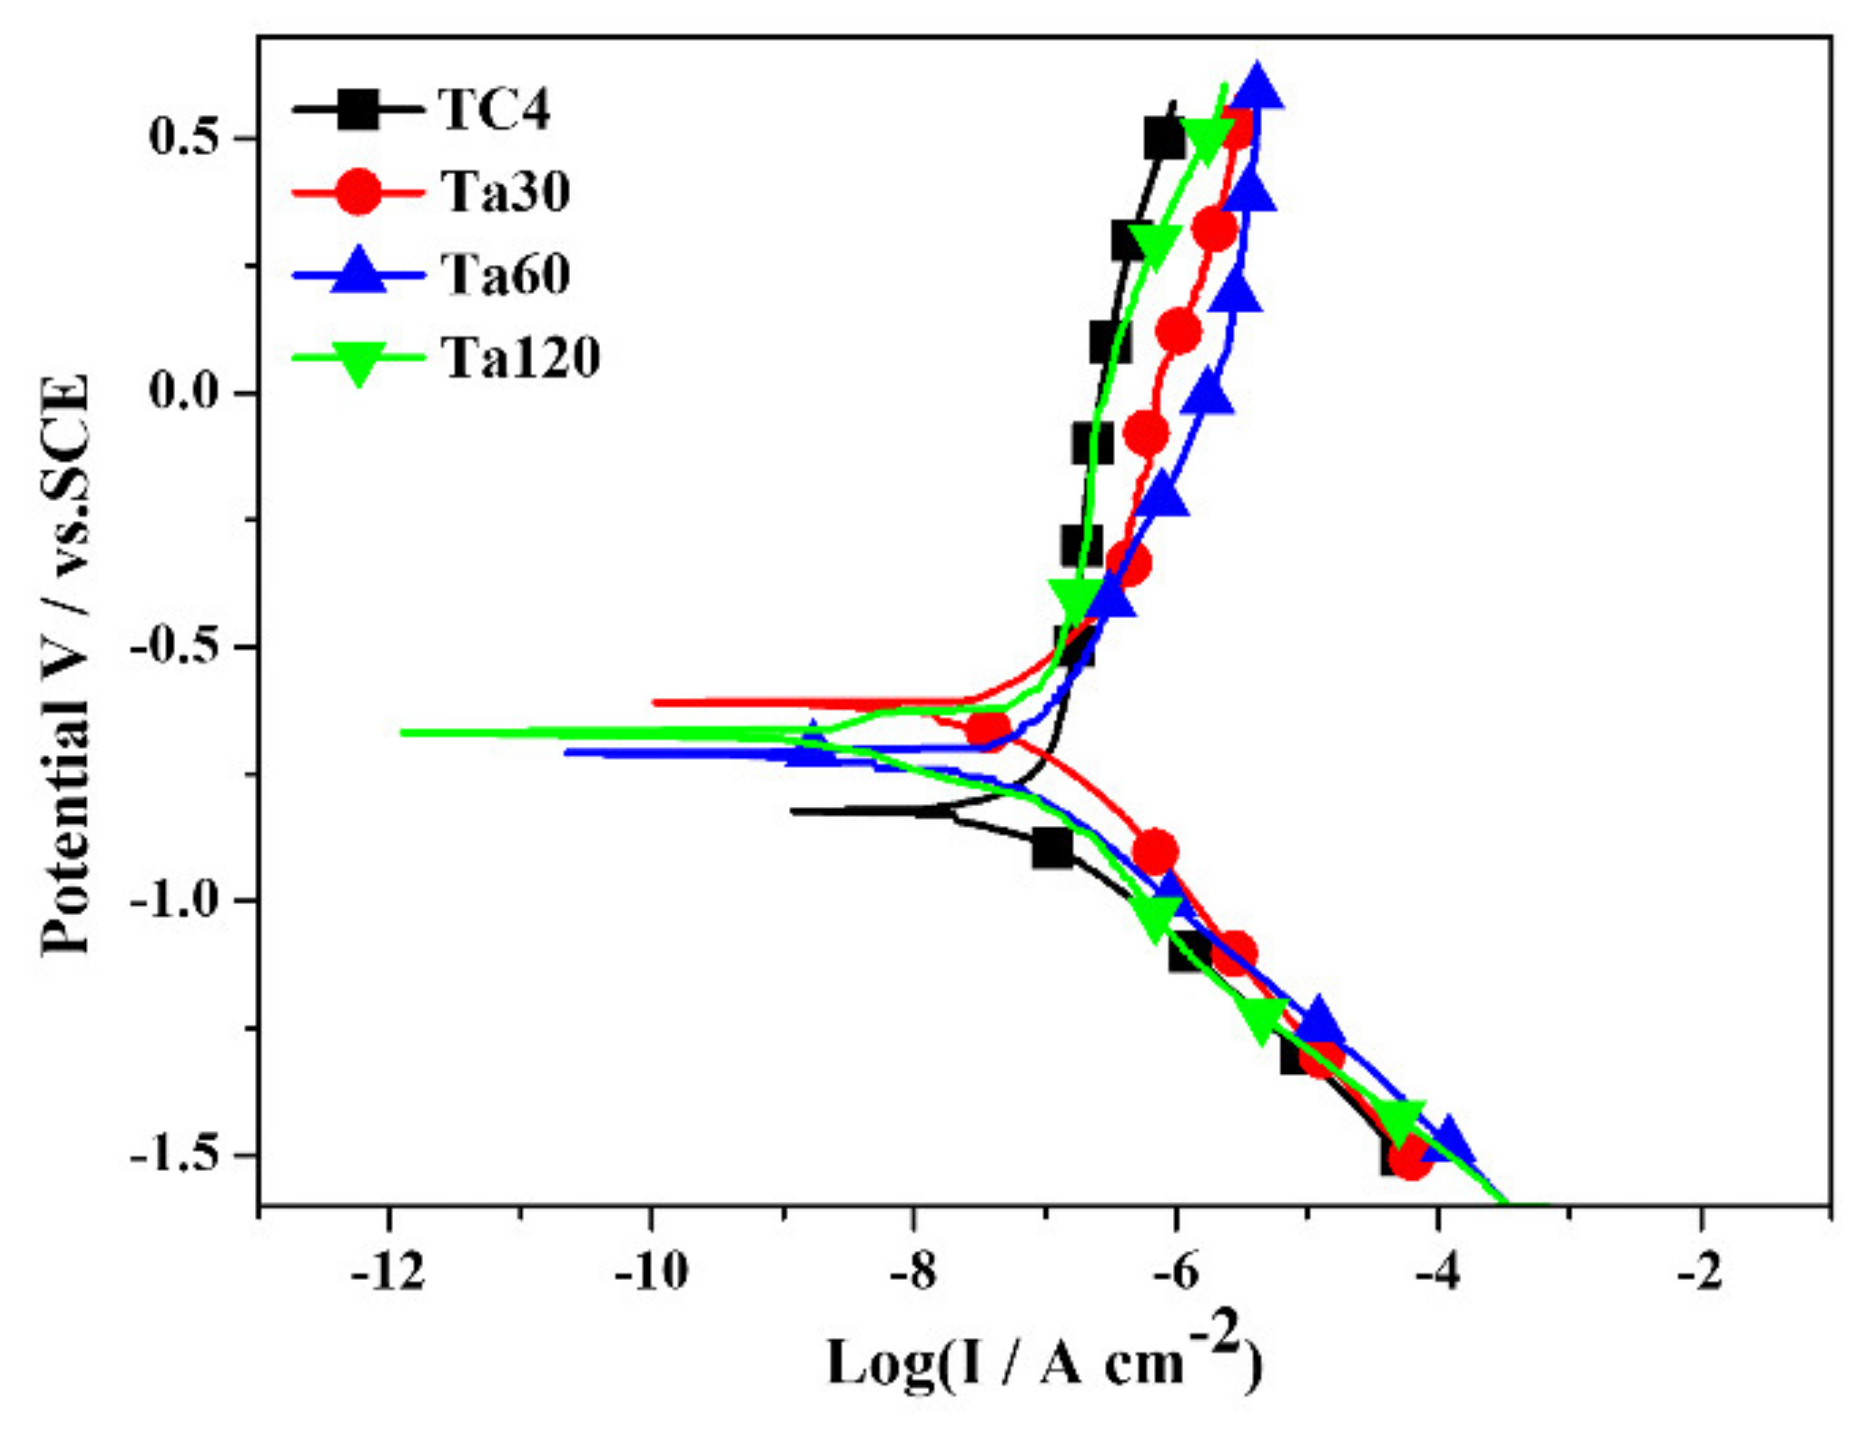
3.4. Corrosion Behavior
3.5. Cell Behavior
4. Conclusions
Supplementary Materials
Author Contributions
Funding
Institutional Review Board Statement
Informed Consent Statement
Data Availability Statement
Conflicts of Interest
References
- Kaur, M.; Singh, K. Review on titanium and titanium based alloys as biomaterials for orthopaedic applications. Mat. Sci. Eng. C Mater. 2019, 102, 844–862. [Google Scholar] [CrossRef]
- Geetha, M.; Singh, A.K.; Asokamani, R.; Gogia, A.K. Ti based biomaterials, the ultimate choice for orthopaedic implants—A review. Prog. Mater. Sci. 2009, 54, 397–425. [Google Scholar] [CrossRef]
- Chen, Q.; Thouas, G.A. Metallic implant biomaterials. Mater. Sci. Eng. R 2015, 87, 1–57. [Google Scholar] [CrossRef]
- Bai, L.; Liu, Y.; Zhang, X.; Huang, X.; Yao, X.; Hang, R.; Tang, B.; Xiao, Y. Favorable manipulation of macrophage/endothelial cell functionality and their cross-talk on silicon-doped titania nanotube arrays. Nanoscale 2019, 11, 5920–5931. [Google Scholar] [CrossRef] [PubMed]
- Uddin, G.M.; Jawad, M.; Ghufran, M.; Saleem, M.W.; Raza, M.A.; Rehman, Z.U.; Arafat, S.M.; Irfan, M.; Waseem, B. Experimental investigation of tribo-mechanical and chemical properties of TiN PVD coating on titanium substrate for biomedical implants manufacturing. Int. J. Adv. Manuf. Tech. 2019, 102, 1391–1404. [Google Scholar] [CrossRef]
- Chapala, P.; Kumar, P.S.; Joardar, J.; Bhandari, V.; Acharyya, S.G. Effect of alloying elements on the microstructure, coefficient of friction, in-vitro corrosion and antibacterial nature of selected Ti-Nb alloys. Appl. Surf. Sci. 2019, 469, 617–623. [Google Scholar] [CrossRef]
- Xia, C.Q.; Zhang, Z.G.; Feng, Z.H.; Pan, B.; Zhang, X.Y.; Ma, M.Z.; Liu, R.P. Effect of zirconium content on the microstructure and corrosion behavior of Ti-6Al-4V-xZr alloys. Corros. Sci. 2016, 112, 687–695. [Google Scholar] [CrossRef]
- Li, J.; He, X.; Zhang, G.; Hang, R.; Huang, X.; Tang, B.; Zhang, X. Electrochemical corrosion, wear and cell behavior of ZrO2/TiO2 alloyed layer on Ti-6Al-4V. Bioelectrochemistry 2018, 121, 105–114. [Google Scholar] [CrossRef]
- Vishnu, J.; Manivasagam, G. Surface modification and biological approaches for tackling titanium wear-induced aseptic loosening. J. Bio. Tribo. Corros. 2021, 7, 1–19. [Google Scholar] [CrossRef]
- Shi, J.; Wang, Z.; Guo, X.; Shen, J.; Sun, H.; Bai, J.; Yu, B.; Wang, L.; Zhou, W.; Liu, Y. Aspirin inhibits osteoclast formation and wear-debris-induced bone destruction by suppressing mitogen-activated protein kinases. J. Cell. Physiol. 2020, 235, 2599–2608. [Google Scholar] [CrossRef] [PubMed]
- Meina, E.G.; Niyogi, S.; Liber, K. Investigating the mechanism of vanadium toxicity in freshwater organisms. Aquat. Toxicol. 2020, 229, 105648. [Google Scholar] [CrossRef]
- Park, C.; Kim, S.; Kim, H.-E.; Jang, T.-S. Mechanically stable tantalum coating on a nano-roughened NiTi stent for enhanced radiopacity and biocompatibility. Surf. Coat. Tech. 2016, 305, 139–145. [Google Scholar] [CrossRef]
- Lin, S.H.; Chien, C.S.; Kuo, T.Y.; Hsieh, Y.H.; Huang, J.W.; Chin, W.H.; Chang, C.P.; Lee, T.M.; Lee, H.T. Biomedical evaluation of vacuum plasma sprayed tantalum coatings processed by alkali treatment and alkali-heat treatment with different NaOH concentrations. Surf. Coat. Tech. 2020, 403, 126400. [Google Scholar] [CrossRef]
- Ding, D.; Xie, Y.; Li, K.; Huang, L.; Zheng, X. Micro/nano structural tantalum coating for enhanced osteogenic differentiation of human bone marrow stem cells. Materials 2019, 11, 546. [Google Scholar] [CrossRef]
- Hee, A.C.; Jamali, S.S.; Bendavid, A.; Martin, P.J.; Kong, C.; Zhao, Y. Corrosion behaviour and adhesion properties of sputtered tantalum coating on Ti6Al4V substrate. Surf. Coat. Tech. 2016, 307, 666–675. [Google Scholar] [CrossRef]
- Wang, F.; Li, C.; Zhang, S.; Liu, H. Tantalum coated on titanium dioxide nanotubes by plasma spraying enhances cytocompatibility for dental implants. Surf. Coat. Tech. 2020, 382, 125161. [Google Scholar] [CrossRef]
- Latif, R.; Jaafar, M.F.; Aziz, M.F.; Zain, A.R.M.; Yunas, J.; Majlis, B.Y. Influence of tantalum’s crystal phase growth on the microstructural, electrical and mechanical properties of sputter-deposited tantalum thin film layer. Int. J. Refract. Met. Hard. Mater. 2020, 92, 105314. [Google Scholar] [CrossRef]
- Wan, Y.; Tang, W.; Li, J.; Xiong, D. Comparison of method and performance in tantalum coating prepared by molten salt electroplating and glow infiltration. Surf. Coat. Tech. 2019, 375, 315–322. [Google Scholar] [CrossRef]
- Zhang, X.; Zhang, G.; Li, J.; He, X.; Wang, Y.; Hang, R.; Huang, X.; Tang, B.; Chu, P.K. Cellular response to nano-structured Zr and ZrO2 alloyed layers on Ti-6Al-4V. Mat. Sci. Eng. C Mater. 2018, 90, 523–530. [Google Scholar] [CrossRef]
- Xu, J.; Sun, T.T.; Jiang, S.; Munroe, P.; Xie, Z.-H. Antimicrobial and biocorrosion-resistant MoO3-SiO2 nanocomposite coating prepared by double cathode glow discharge technique. Appl. Surf. Sci. 2018, 447, 500–511. [Google Scholar] [CrossRef]
- Zhao, Y.; Xu, J.; Li, Z.; Fu, T.; Jiang, S. In vitro antibacterial properties of MoO3/SiO2/Ag2O nanocomposite coating prepared by double cathode glow discharge technique. Surf. Coat. Tech. 2020, 397, 125992. [Google Scholar] [CrossRef]
- Xu, Z.; Liu, X.; Zhang, P.; Zhang, Y.; Zhang, G.; He, Z. Double glow plasma surface alloying and plasma nitriding. Surf. Coat. Tech. 2007, 201, 4822–4825. [Google Scholar] [CrossRef]
- Chen, K.; Liu, X.; Liu, X.; Meng, T.; Guo, Q.; Wang, Z.; Lin, N. Microstructure and wear behavior of Ti-6Al-4V treated by plasma Zr-alloying and plasma nitriding. J. Wuhan Univ. Technol. 2016, 31, 1086–1092. [Google Scholar] [CrossRef]
- Yuan, S.; Lin, N.; Zeng, Q.; Zhang, H.; Liu, X.; Wang, Z.; Wu, Y. Recent developments in research of double glow plasma surface alloying technology: A brief review. J. Mater. Res. Technol. 2020, 9, 6859–6882. [Google Scholar] [CrossRef]
- Ma, Y.; Zhang, Y.; Yao, X.; Zhang, X.; Shu, X.; Tang, B. Characterization of Mo surface modified Ti by indentation techniques. Surf. Coat. Tech. 2013, 226, 75–81. [Google Scholar] [CrossRef]
- Lin, N.; Liu, Q.; Zou, J.; Li, D.; Yuan, S.; Wang, Z.; Tang, B. Surface damage mitigation of Ti6Al4V alloy via thermal oxidation for oil and gas exploitation application: Characterization of the microstructure and evaluation of the surface performance. RSC Adv. 2017, 7, 13517–13535. [Google Scholar] [CrossRef]
- Li, C.; Xu, Z. Diffusion Mechanism of Ion Bombardment. Surf. Eng. 2013, 3, 310–312. [Google Scholar] [CrossRef]
- Alias, R.; Mahmoodian, R.; Genasan, K.; Vellasamy, K.M.; Shukor, M.H.A.; Kamarul, T. Mechanical, antibacterial, and biocompatibility mechanism of PVD grown silver–tantalum-oxide-based nanostructured thin film on stainless steel 316L for surgical applications. Mat. Sci. Eng. C Mater. 2020, 107, 110304. [Google Scholar] [CrossRef]
- Jönsson, B.; Hogmark, S. Hardness measurements of thin films. Thin Solid Film. 1984, 114, 257–269. [Google Scholar] [CrossRef]
- Ge, P.L.; Bao, M.D.; Zhang, H.J.; You, K.; Liu, X.P. Effect of plasma nitriding on adhesion strength of CrTiAlN coatings on H13 steels by closed field unbalanced magnetron sputter ion plating. Surf. Coat. Technol. 2013, 229, 146–150. [Google Scholar] [CrossRef]
- Wang, L.; Zhong, X.; Zhao, Y.; Tao, S.; Zhang, W.; Wang, Y.; Sun, X. Design and optimization of coating structure for the thermal barrier coatings fabricated by atmospheric plasma spraying via finite element method. J. Asian Ceram. Soc. 2014, 2, 102–116. [Google Scholar] [CrossRef]
- Grins, J. TixTa1−x(O,N)y phases formed by ammonolysis of Ti-Ta gels: Preparation of an anatase-type solid solution phase TixTa1−xO1+xN1−x, 0.52 ≤ x ≤ 0.87. J. Eur. Ceram. Soc. 1997, 17, 1819–1824. [Google Scholar] [CrossRef]
- Wei, D.; Chen, X.; Zhang, P.; Ding, F.; Li, F.; Yao, Z. Plasma surface tantalum alloying on titanium and its corrosion behavior in sulfuric acid and hydrochloric acid. Appl. Surf. Sci. 2018, 441, 448–457. [Google Scholar] [CrossRef]
- Zhou, X.; Huang, Y.; Chen, Y.; Peng, P. Laser joining of Mo and Ta sheets with Ti6Al4V or Ni filler. Opt. Laser Technol. 2018, 106, 487–494. [Google Scholar] [CrossRef]
- Larosa, C.R.; Shih, M.; Varvenne, C.; Ghazisaeidi, M. Solid solution strengthening theories of high-entropy alloys. Mater. Charact. 2019, 151, 310–317. [Google Scholar] [CrossRef]
- Bowden, D.; Krysiak, Y.; Palatinus, L.; Tsivoulas, D.; Plana-Ruiz, S.; Sarakinou, E.; Kolb, U.; Stewart, D.; Preuss, M. A high-strength silicide phase in a stainless steel alloy designed for wear-resistant applications. Nat. Commun. 2018, 9, 1–10. [Google Scholar] [CrossRef]
- Kruzic, J.J.; Arsecularatne, J.A.; Tanaka, C.B.; Hoffman, M.J.; Cesar, P. Recent advances in understanding the fatigue and wear behavior of dental composites and ceramics. J. Mech. Behav. Biomed. Mater. 2018, 88, 504–533. [Google Scholar] [CrossRef] [PubMed]
- Cui, W.-F.; Niu, F.-J.; Tan, Y.-L.; Qin, G.-W. Microstructure and tribocorrosion performance of nanocrystalline TiN graded coating on biomedical titanium alloy. Trans. Nonferrous Met. Soc. China 2019, 29, 1026–1035. [Google Scholar] [CrossRef]
- Salou, L.; Hoornaert, A.; Louarn, G.; Layrolle, P. Enhanced osseointegration of titanium implants with nanostructured surfaces: An experimental study in rabbits. Acta Biomater. 2015, 11, 494–502. [Google Scholar] [CrossRef]
- Zhang, M.; Huang, X.; Hang, R.; Zhang, X.; Tang, B. Effect of a biomimetic titania mesoporous coating doped with Sr on the osteogenic activity. Mat. Sci. Eng. C Mater. 2018, 91, 153–162. [Google Scholar] [CrossRef]
- Zhang, M.; Wang, X.; Huang, X.; Wang, Y.; Hang, R.; Zhang, X.; Yao, X.; Tang, B. A high current anodization to fabricate a nano-porous structure on the surface of Ti-based implants. J. Mater. Sci. Mater. Med. 2018, 30, 2. [Google Scholar] [CrossRef] [PubMed]
- Xia, J.; Yuan, Y.; Wu, H.; Huang, Y.; Weitz, D.A. Decoupling the effects of nanopore size and surface roughness on the attachment, spreading and differentiation of bone marrow-derived stem cells. Biomaterials 2020, 248, 120014. [Google Scholar] [CrossRef] [PubMed]
- Faia-Torres, A.B.; Guimond-Lischer, S.; Rottmar, M.; Charnley, M.; Goren, T.; Maniura-Weber, K.; Spencer, N.D.; Reis, R.L.; Textor, M.; Neves, N.M. Differential regulation of osteogenic differentiation of stem cells on surface roughness gradients. Biomaterials 2014, 35, 9023–9032. [Google Scholar] [CrossRef] [PubMed]
- Rabel, K.; Kohal, R.-J.; Steinberg, T.; Tomakidi, P.; Rolauffs, B.; Adolfsson, E.; Palmero, P.; Fürderer, T.; Altmann, B. Controlling osteoblast morphology and proliferation via surface micro-topographies of implant biomaterials. Sci. Rep. 2020, 10, 12810. [Google Scholar] [CrossRef] [PubMed]


| Sample | Wear Width b/mm | Wear Depth h/10−3 mm | Wear Volume Wv/10−3 mm3 |
|---|---|---|---|
| TC4 | 0.88 | 19.87 | 58.66 |
| Ta30 | 0.73 | 20.54 | 50.24 |
| Ta60 | 0.77 | 22.72 | 58.45 |
| Ta120 | 0.82 | 28.55 | 80.68 |
| Sample | Ecorr/mV | Icorr/(μA cm−2) | βc/(mv decade−1) |
|---|---|---|---|
| TC4 | −1.08 | 1.06 × 10⁻¹ | 210.72 |
| Ta30 | −0.62 | 2.63 × 10⁻² | 168.12 |
| Ta60 | −0.71 | 2.05 × 10⁻² | 147.21 |
| Ta120 | −0.67 | 7.54 × 10⁻² | 204.46 |
Publisher’s Note: MDPI stays neutral with regard to jurisdictional claims in published maps and institutional affiliations. |
© 2021 by the authors. Licensee MDPI, Basel, Switzerland. This article is an open access article distributed under the terms and conditions of the Creative Commons Attribution (CC BY) license (https://creativecommons.org/licenses/by/4.0/).
Share and Cite
Zhang, M.; Ma, Y.; Gao, J.; Hei, H.; Jia, W.; Bai, J.; Liu, Z.; Huang, X.; Xue, Y.; Yu, S.; et al. Mechanical, Electrochemical, and Osteoblastic Properties of Gradient Tantalum Coatings on Ti6Al4V Prepared by Plasma Alloying Technique. Coatings 2021, 11, 631. https://doi.org/10.3390/coatings11060631
Zhang M, Ma Y, Gao J, Hei H, Jia W, Bai J, Liu Z, Huang X, Xue Y, Yu S, et al. Mechanical, Electrochemical, and Osteoblastic Properties of Gradient Tantalum Coatings on Ti6Al4V Prepared by Plasma Alloying Technique. Coatings. 2021; 11(6):631. https://doi.org/10.3390/coatings11060631
Chicago/Turabian StyleZhang, Meng, Yong Ma, Jie Gao, Hongjun Hei, Wenru Jia, Jin Bai, Zhubo Liu, Xiaobo Huang, Yanpeng Xue, Shengwang Yu, and et al. 2021. "Mechanical, Electrochemical, and Osteoblastic Properties of Gradient Tantalum Coatings on Ti6Al4V Prepared by Plasma Alloying Technique" Coatings 11, no. 6: 631. https://doi.org/10.3390/coatings11060631
APA StyleZhang, M., Ma, Y., Gao, J., Hei, H., Jia, W., Bai, J., Liu, Z., Huang, X., Xue, Y., Yu, S., & Wu, Y. (2021). Mechanical, Electrochemical, and Osteoblastic Properties of Gradient Tantalum Coatings on Ti6Al4V Prepared by Plasma Alloying Technique. Coatings, 11(6), 631. https://doi.org/10.3390/coatings11060631