
Study on Spray Evaporation Treatment of Desulfurization Wastewater


Abstract
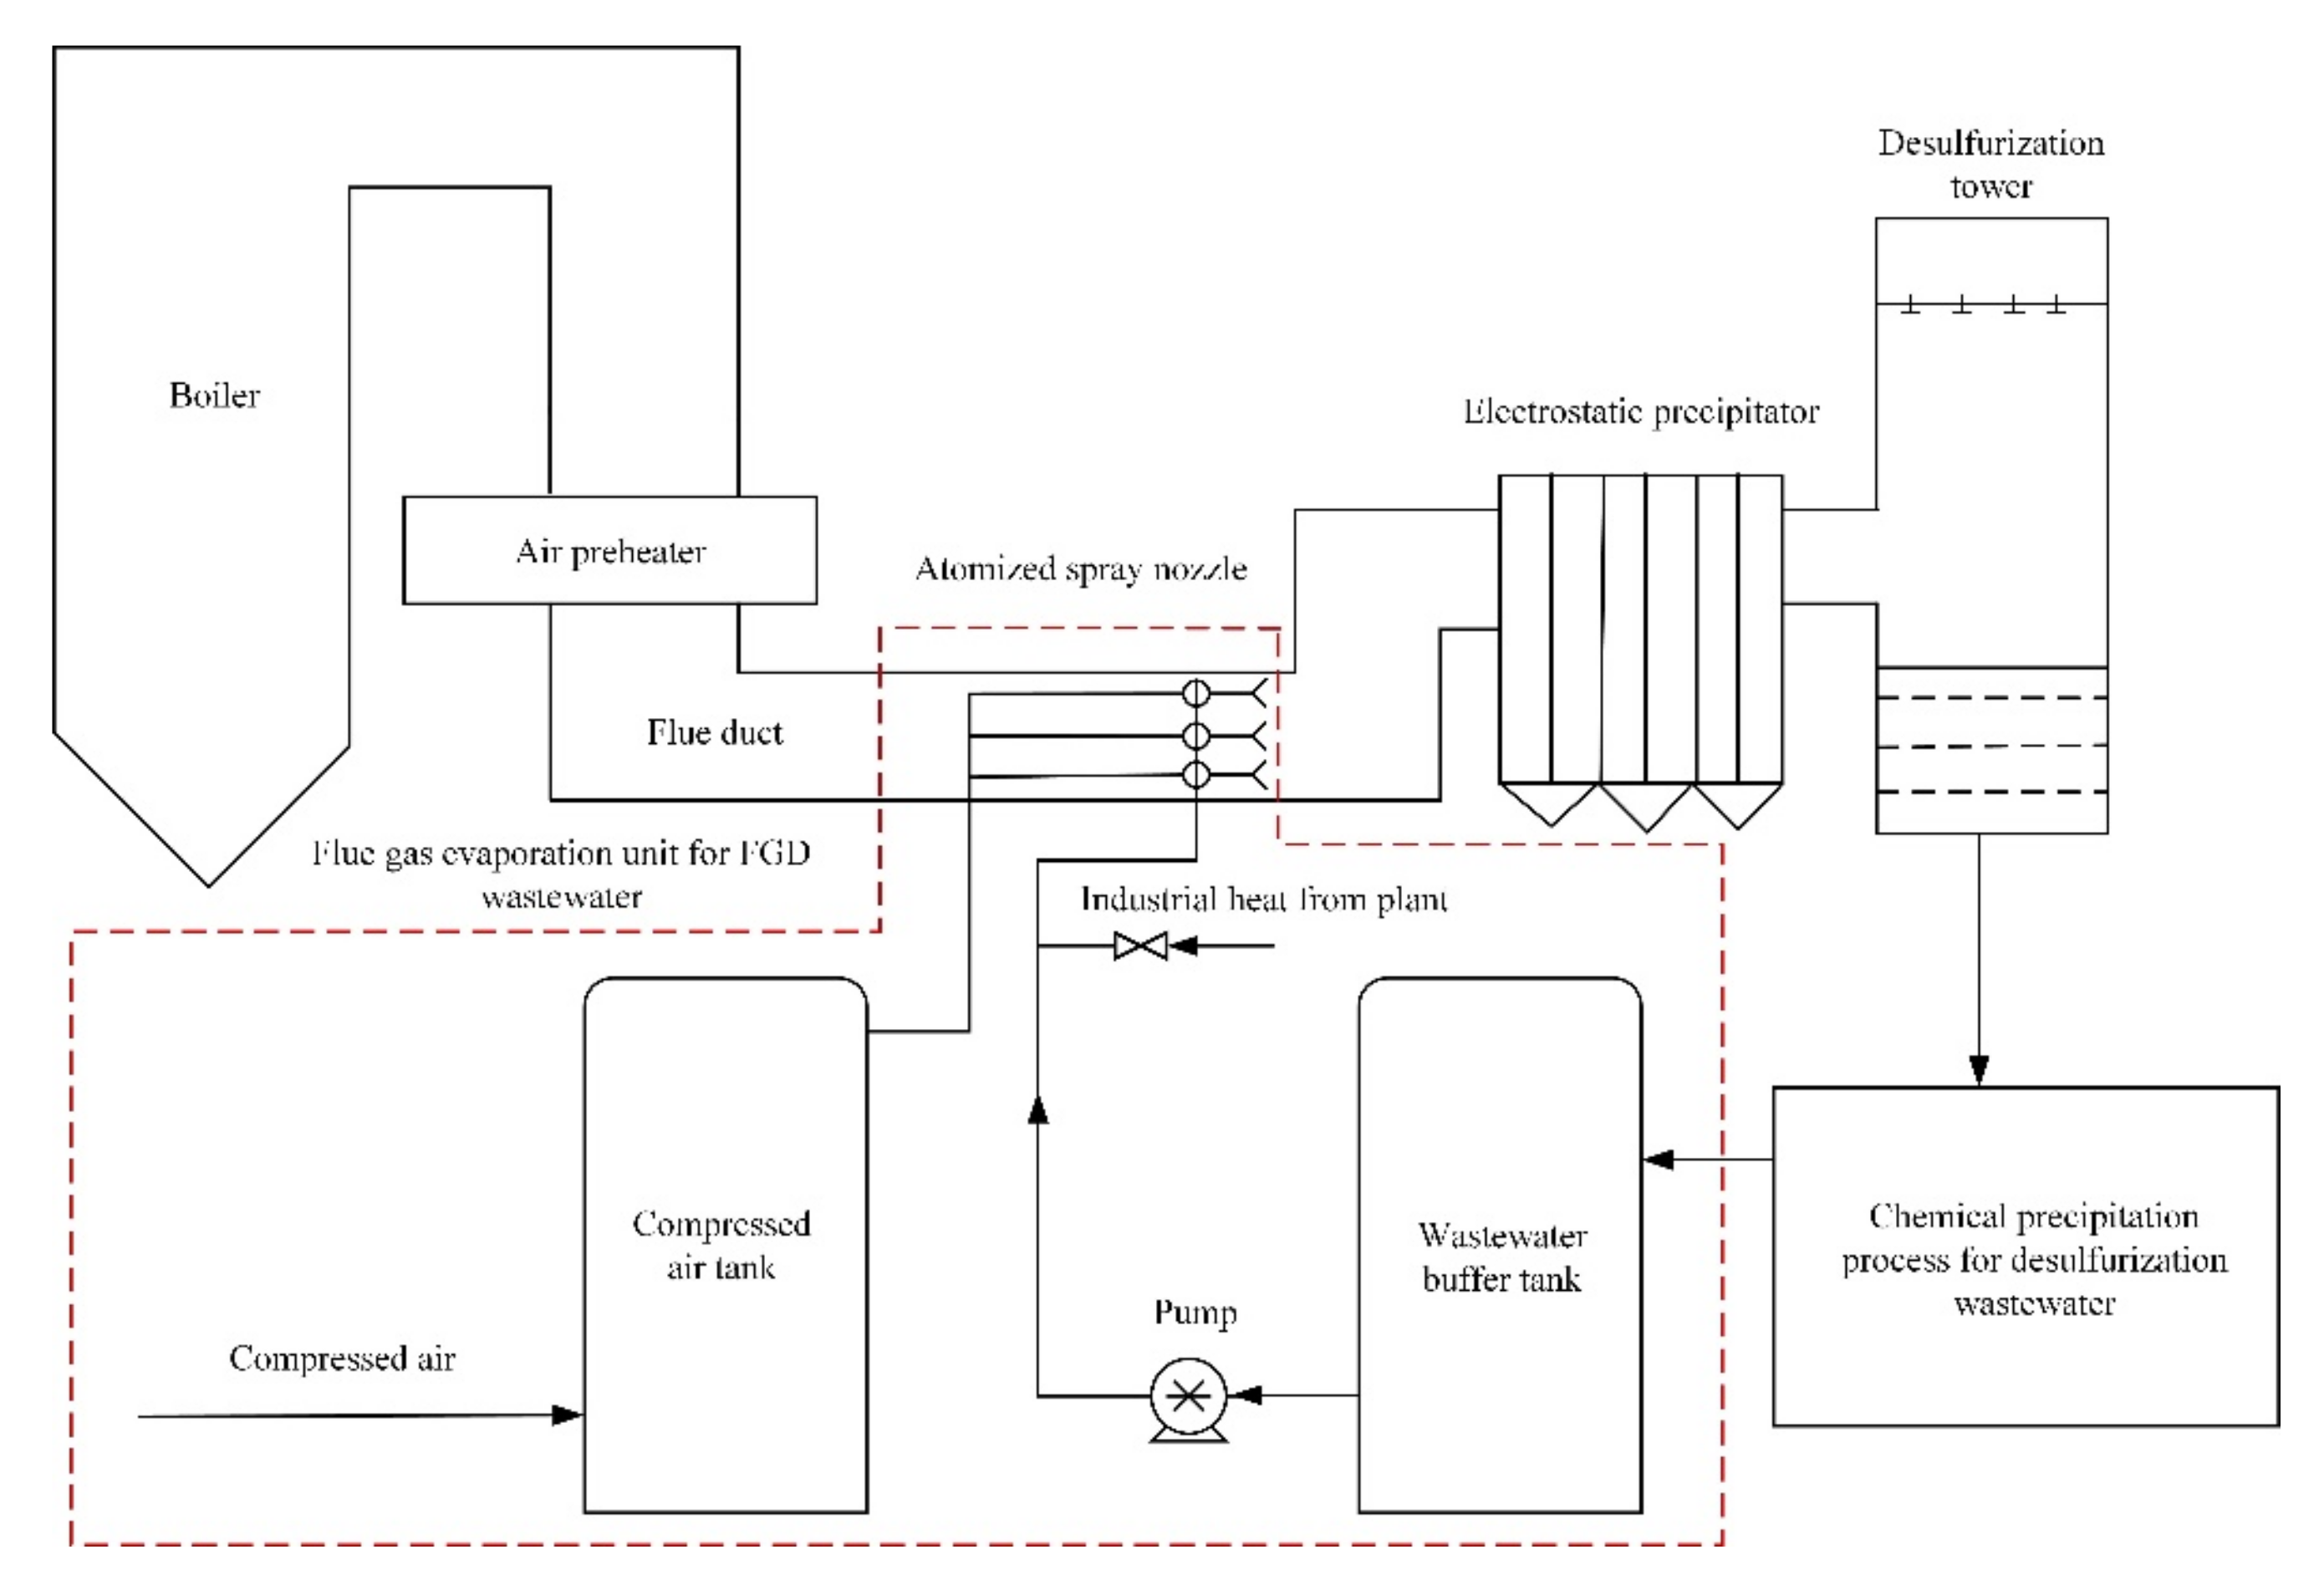
1. Introduction
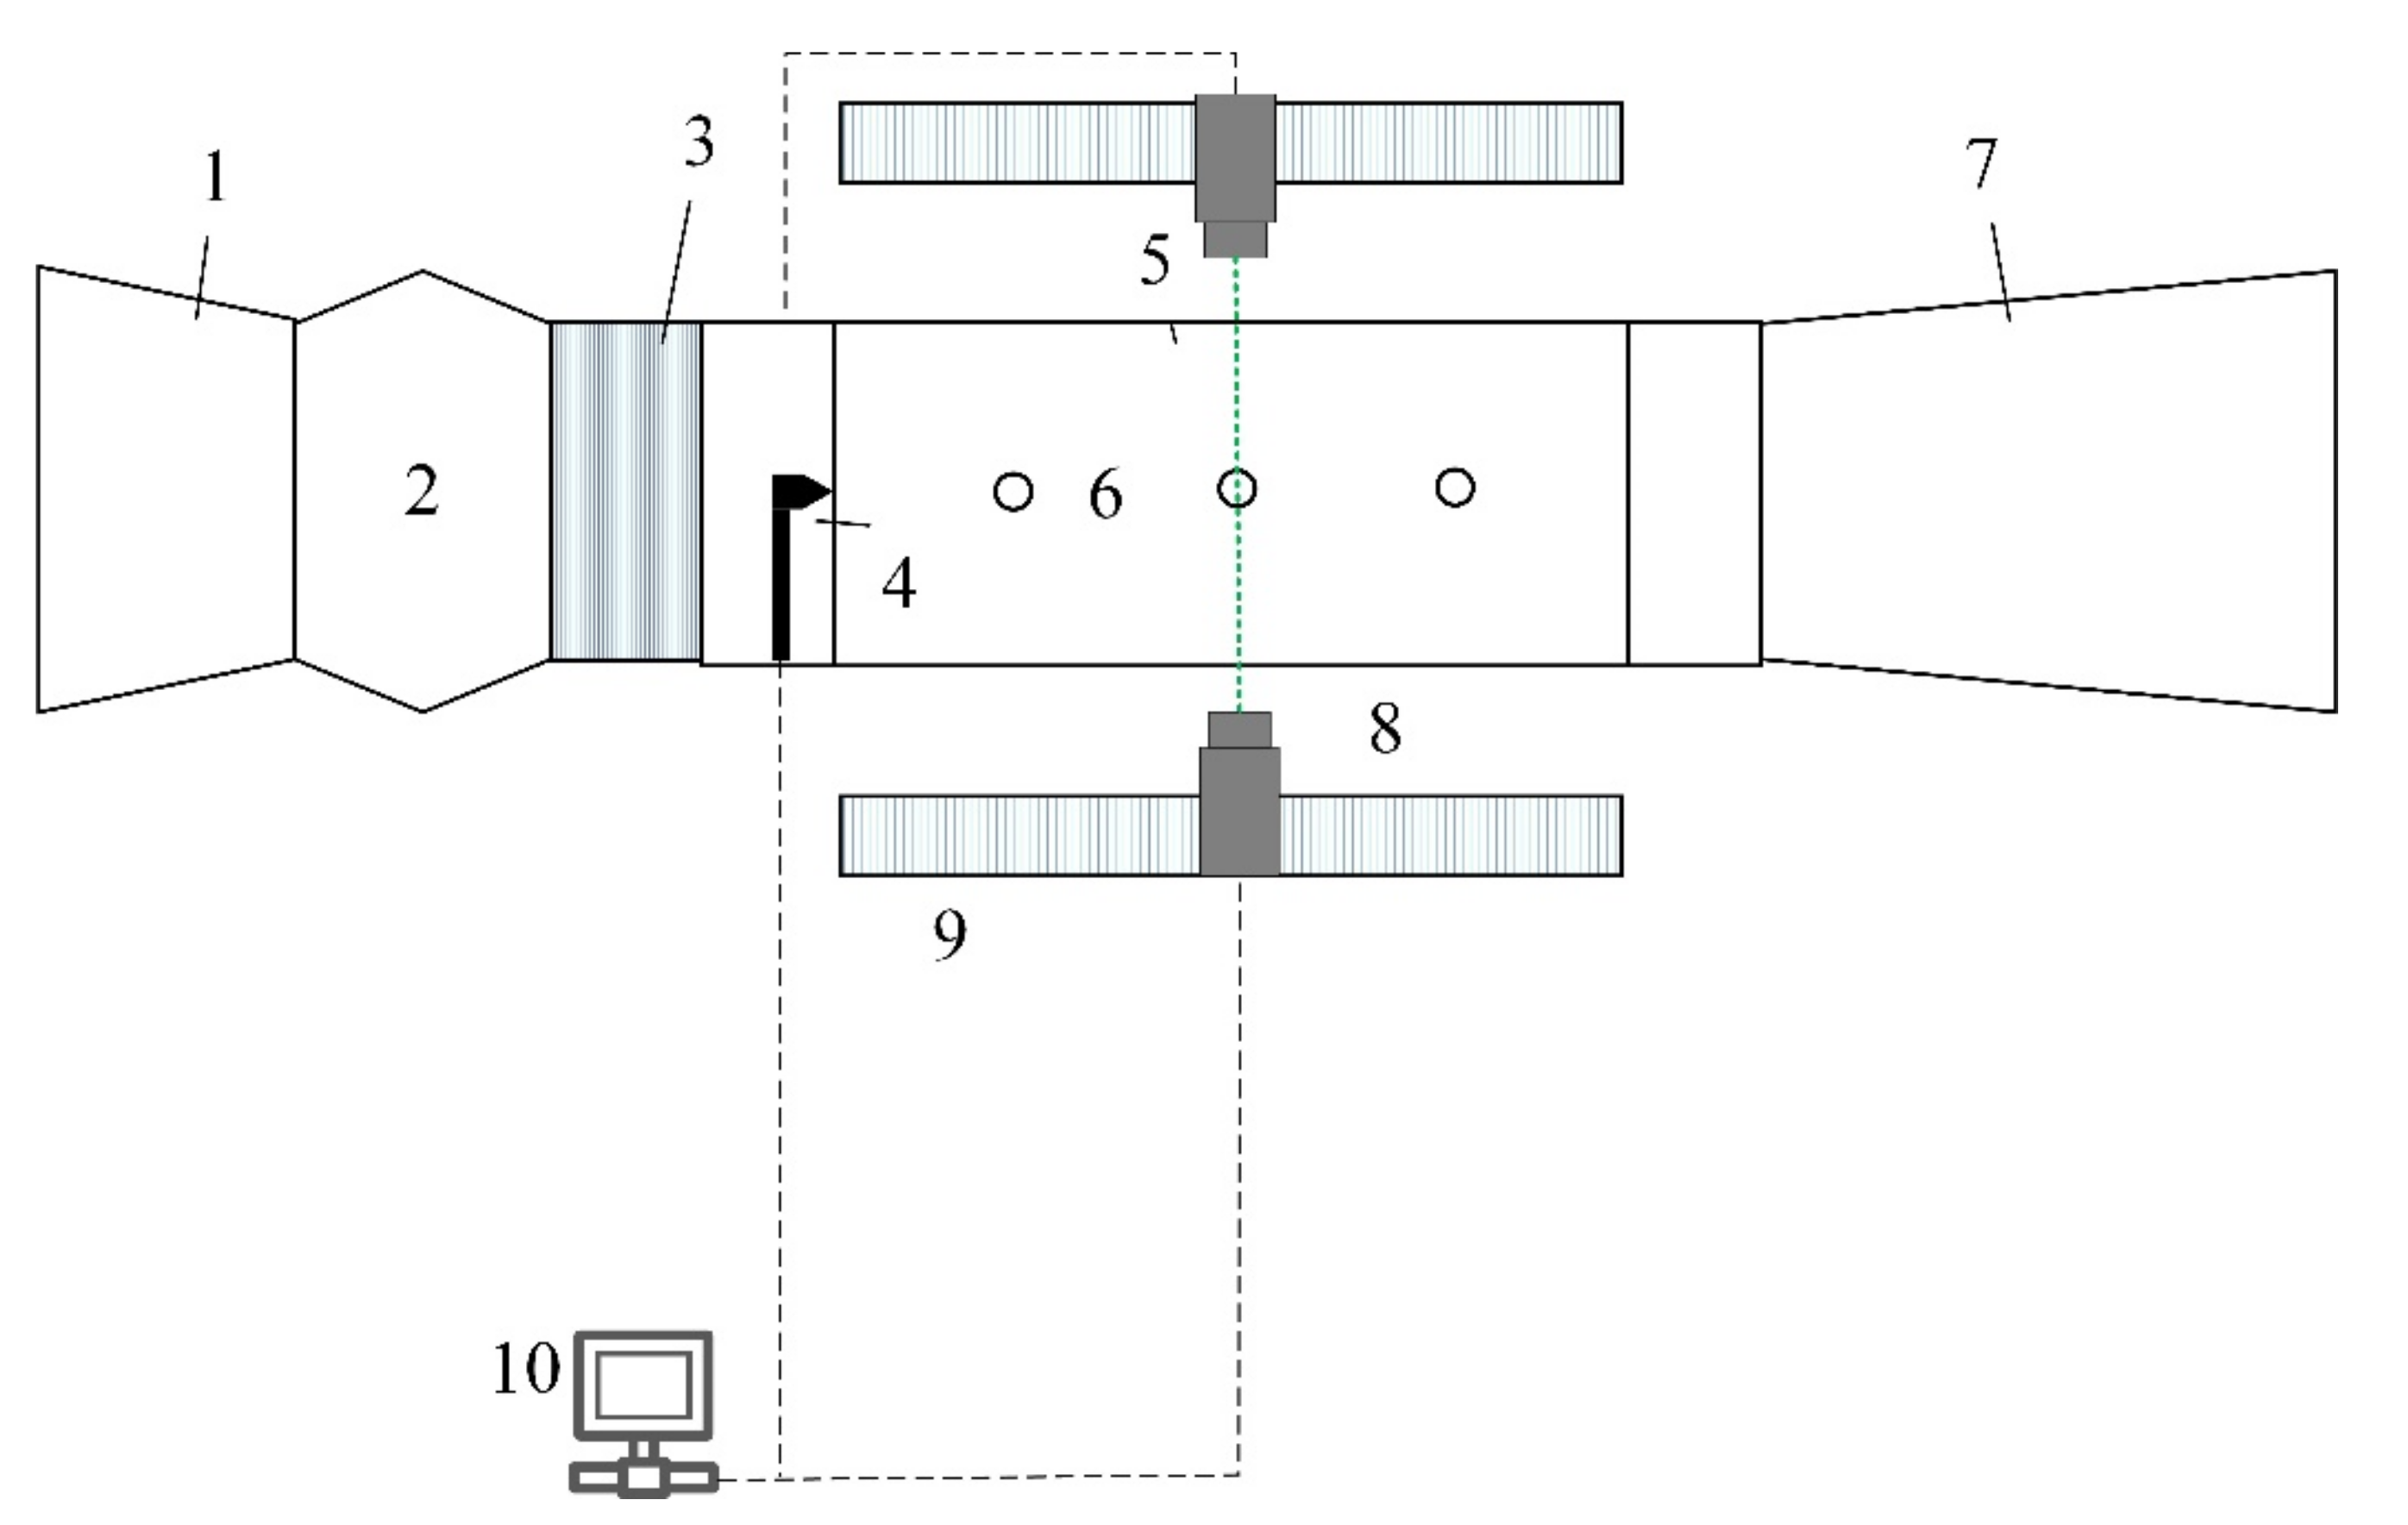
2. Experimental Section
3. Mathematical Model and Numerical Approach
3.1. Governing Equations
3.1.1. Continuous Phase (Flue Gas)
3.1.2. Discrete Phase (Water Droplets)
3.2. Boundary Conditions and Numerical Approach
4. Results and Analysis
4.1. Experimental Results
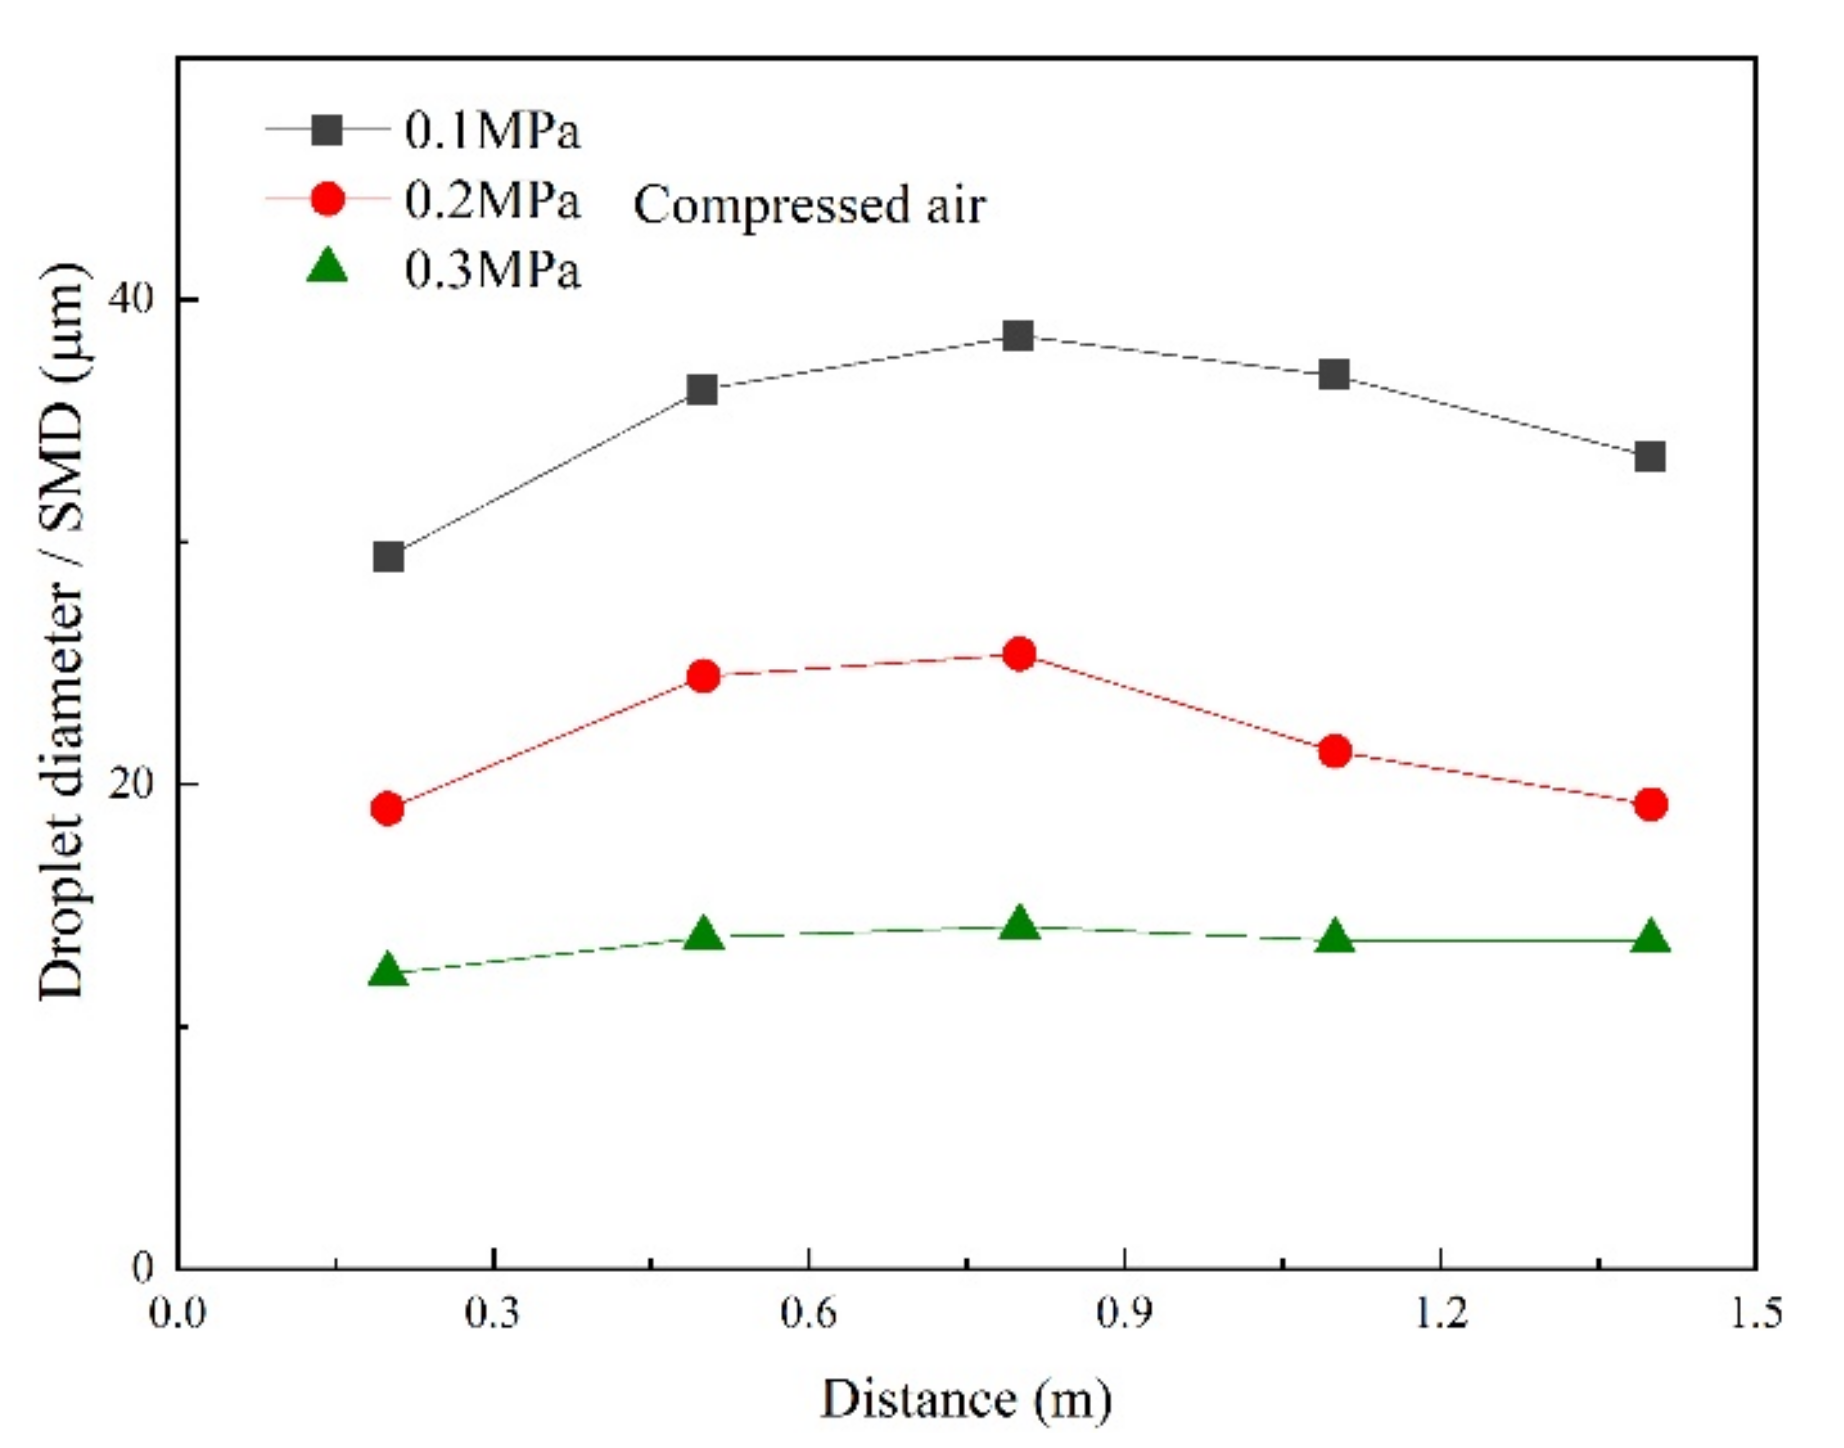
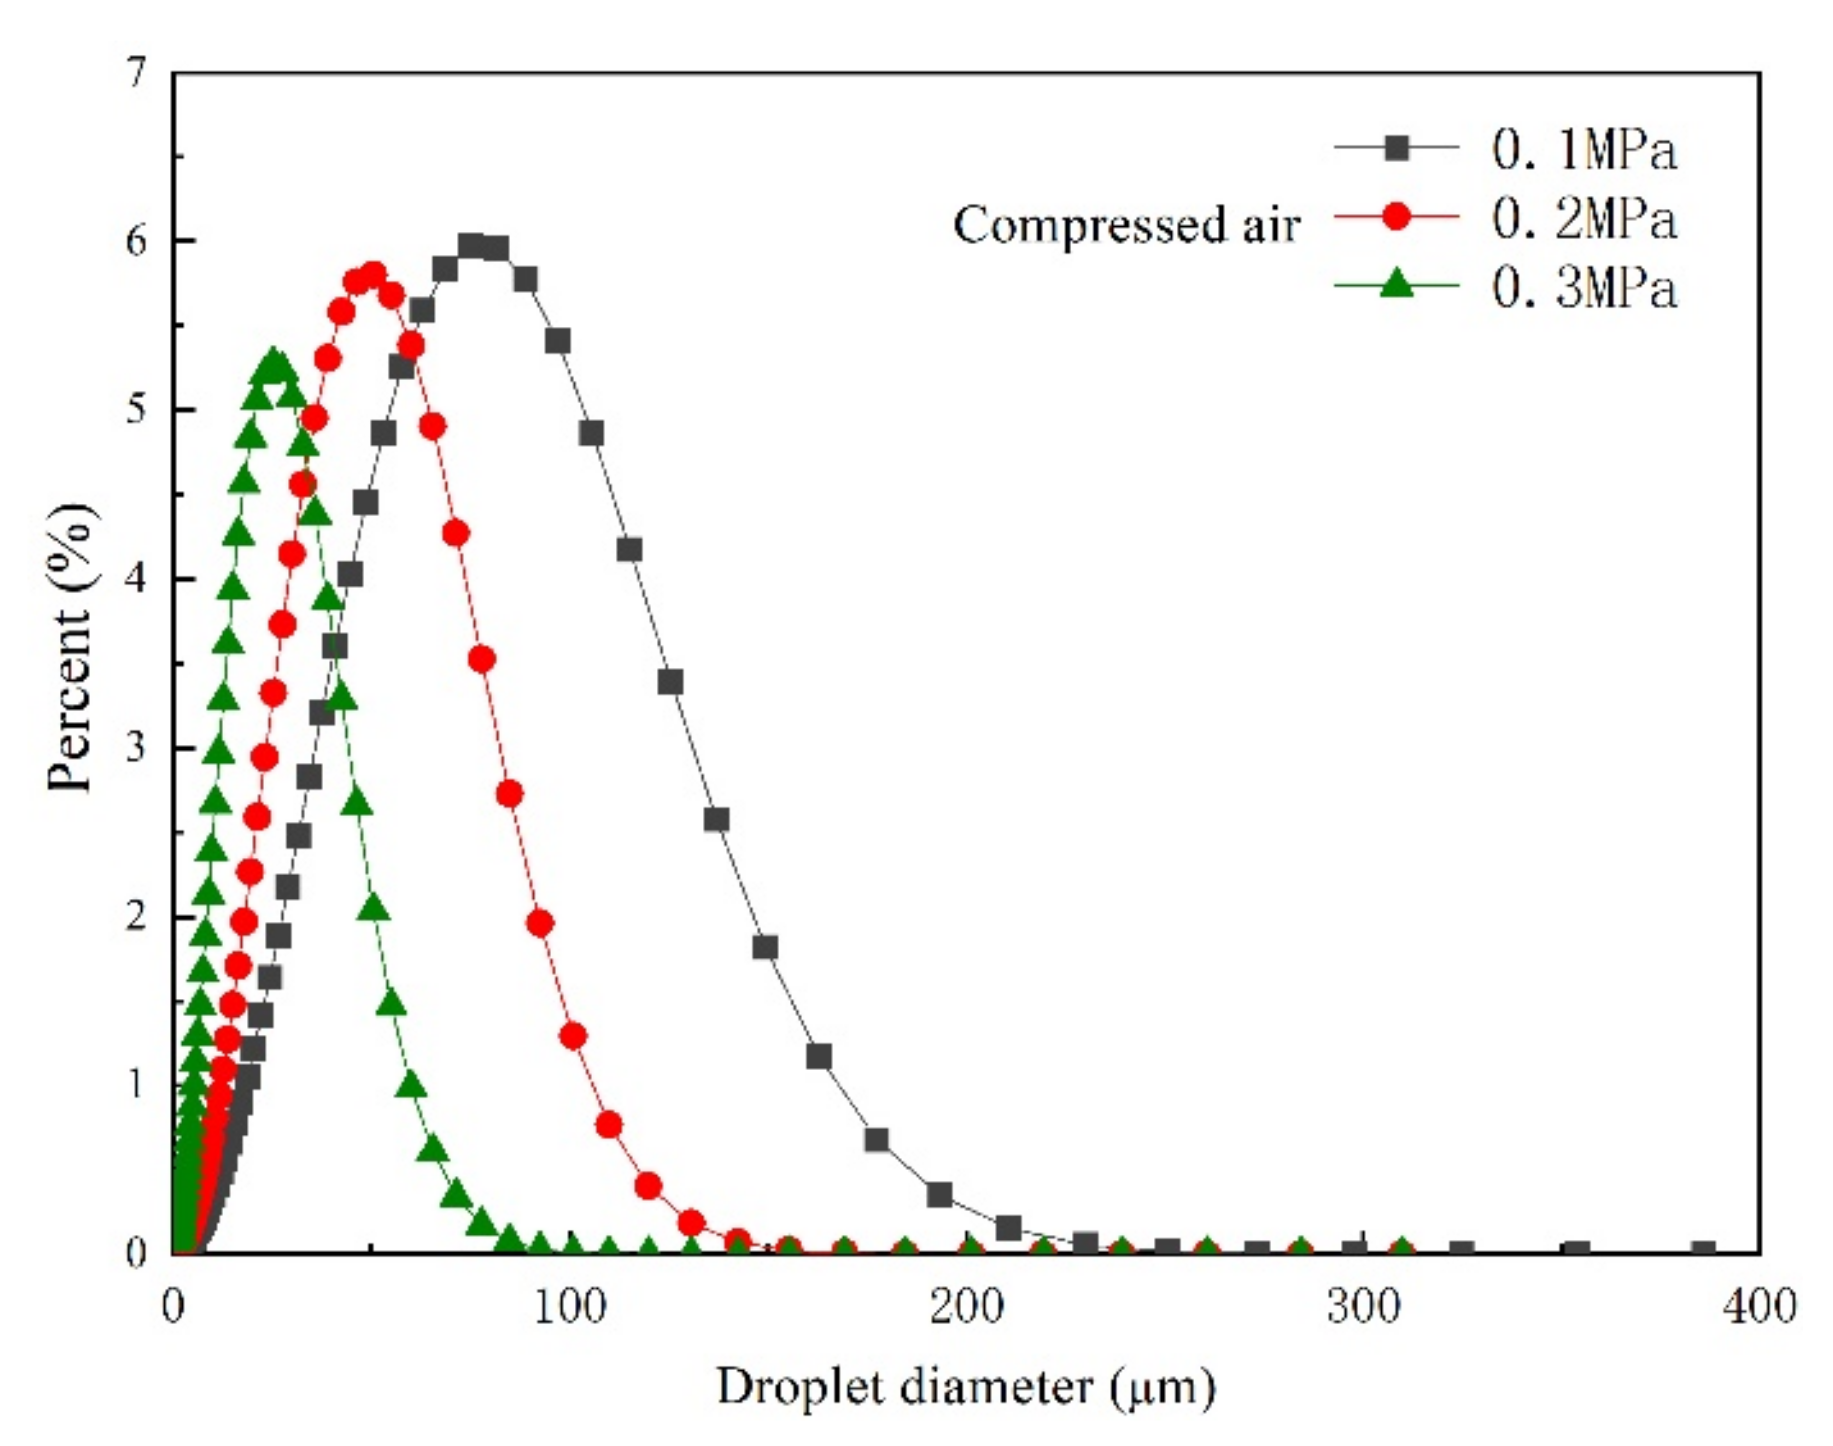
4.1.1. Effect of Compressed Air Pressure in Air-Blast Spray Nozzle
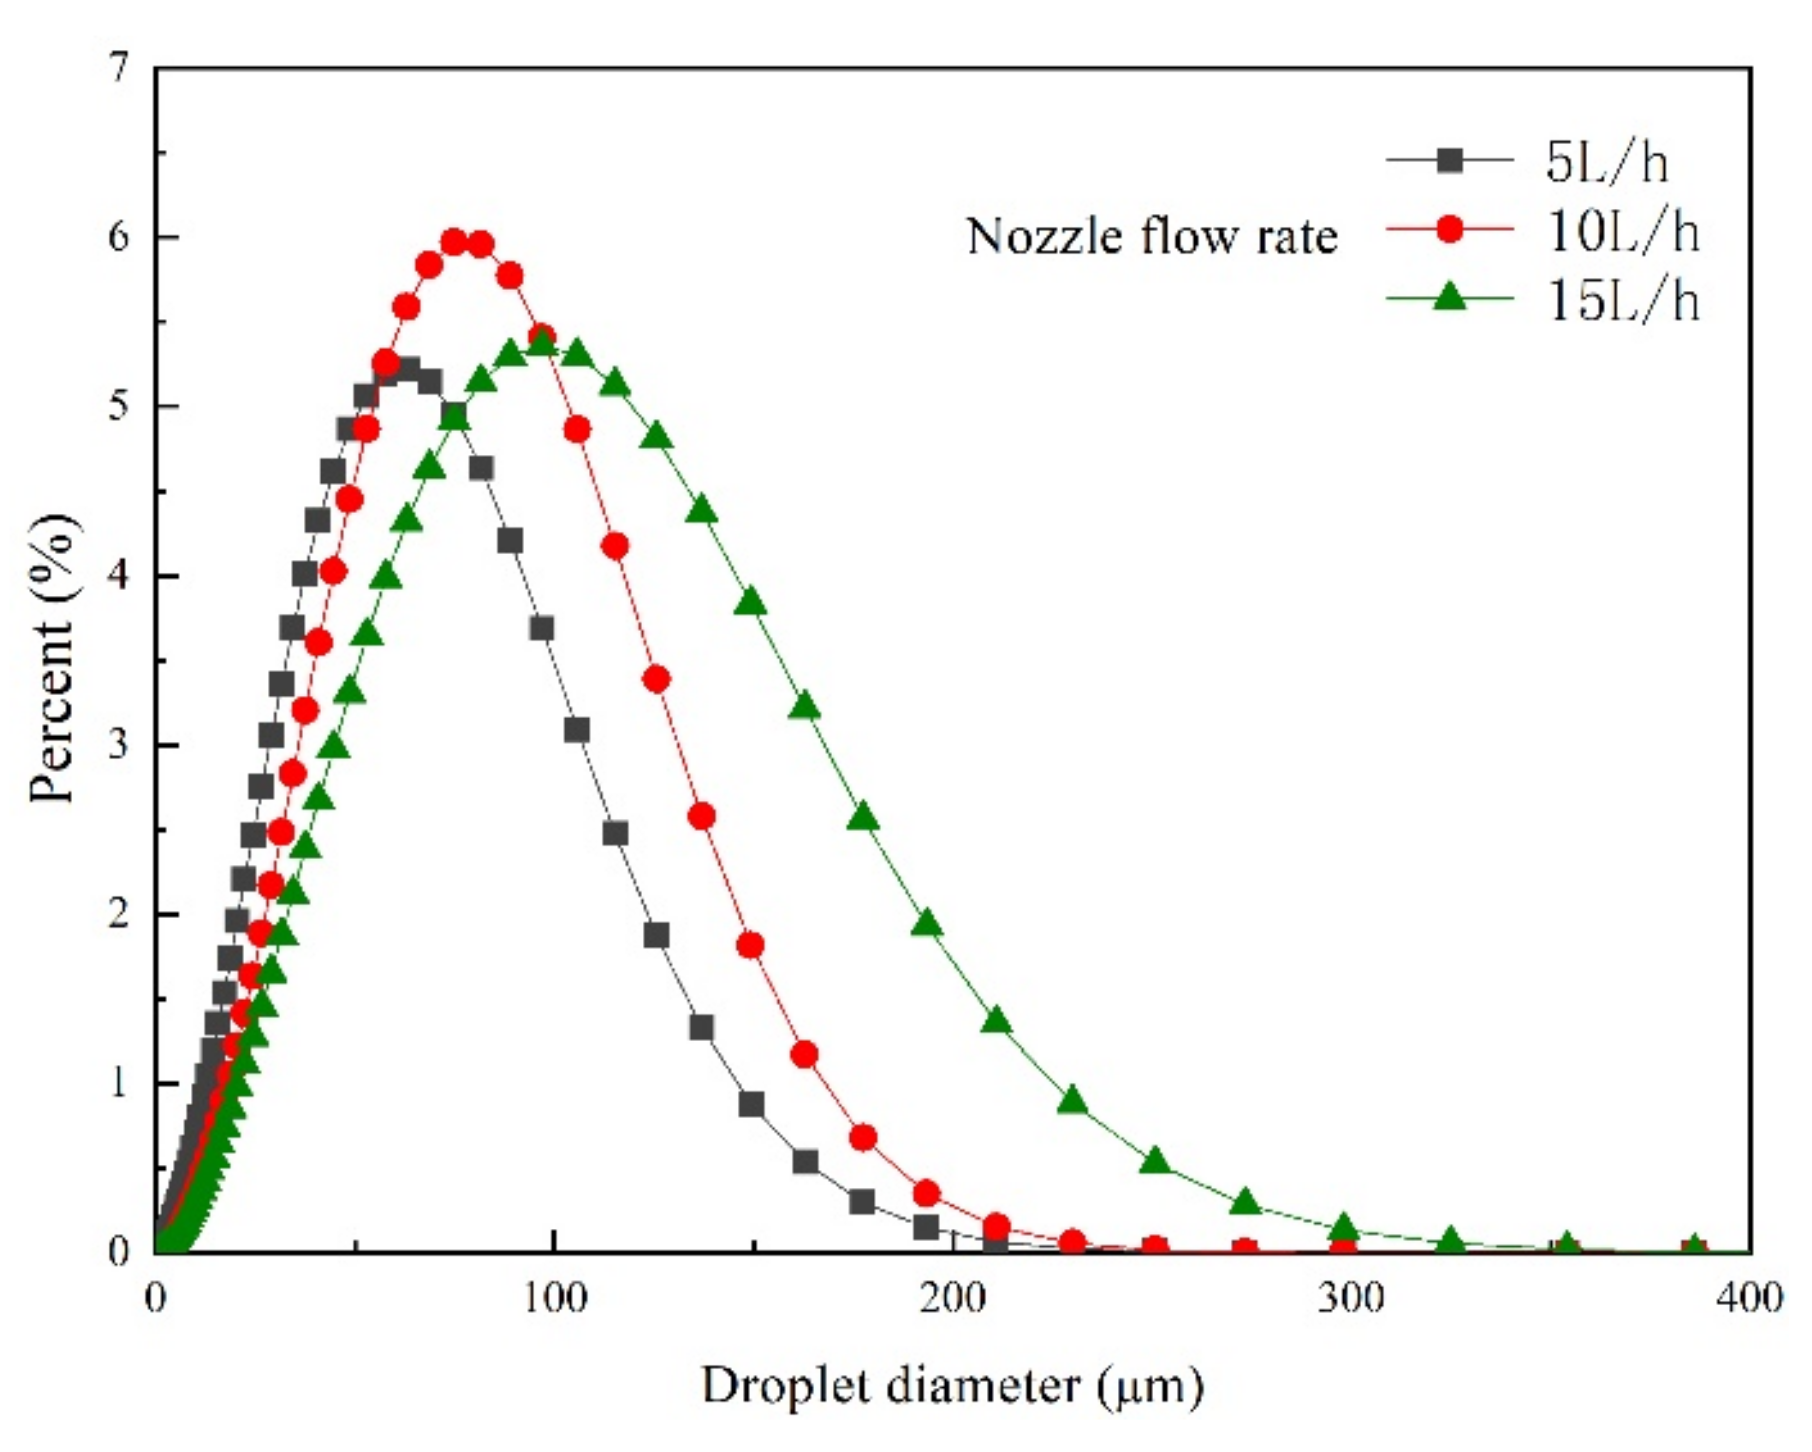
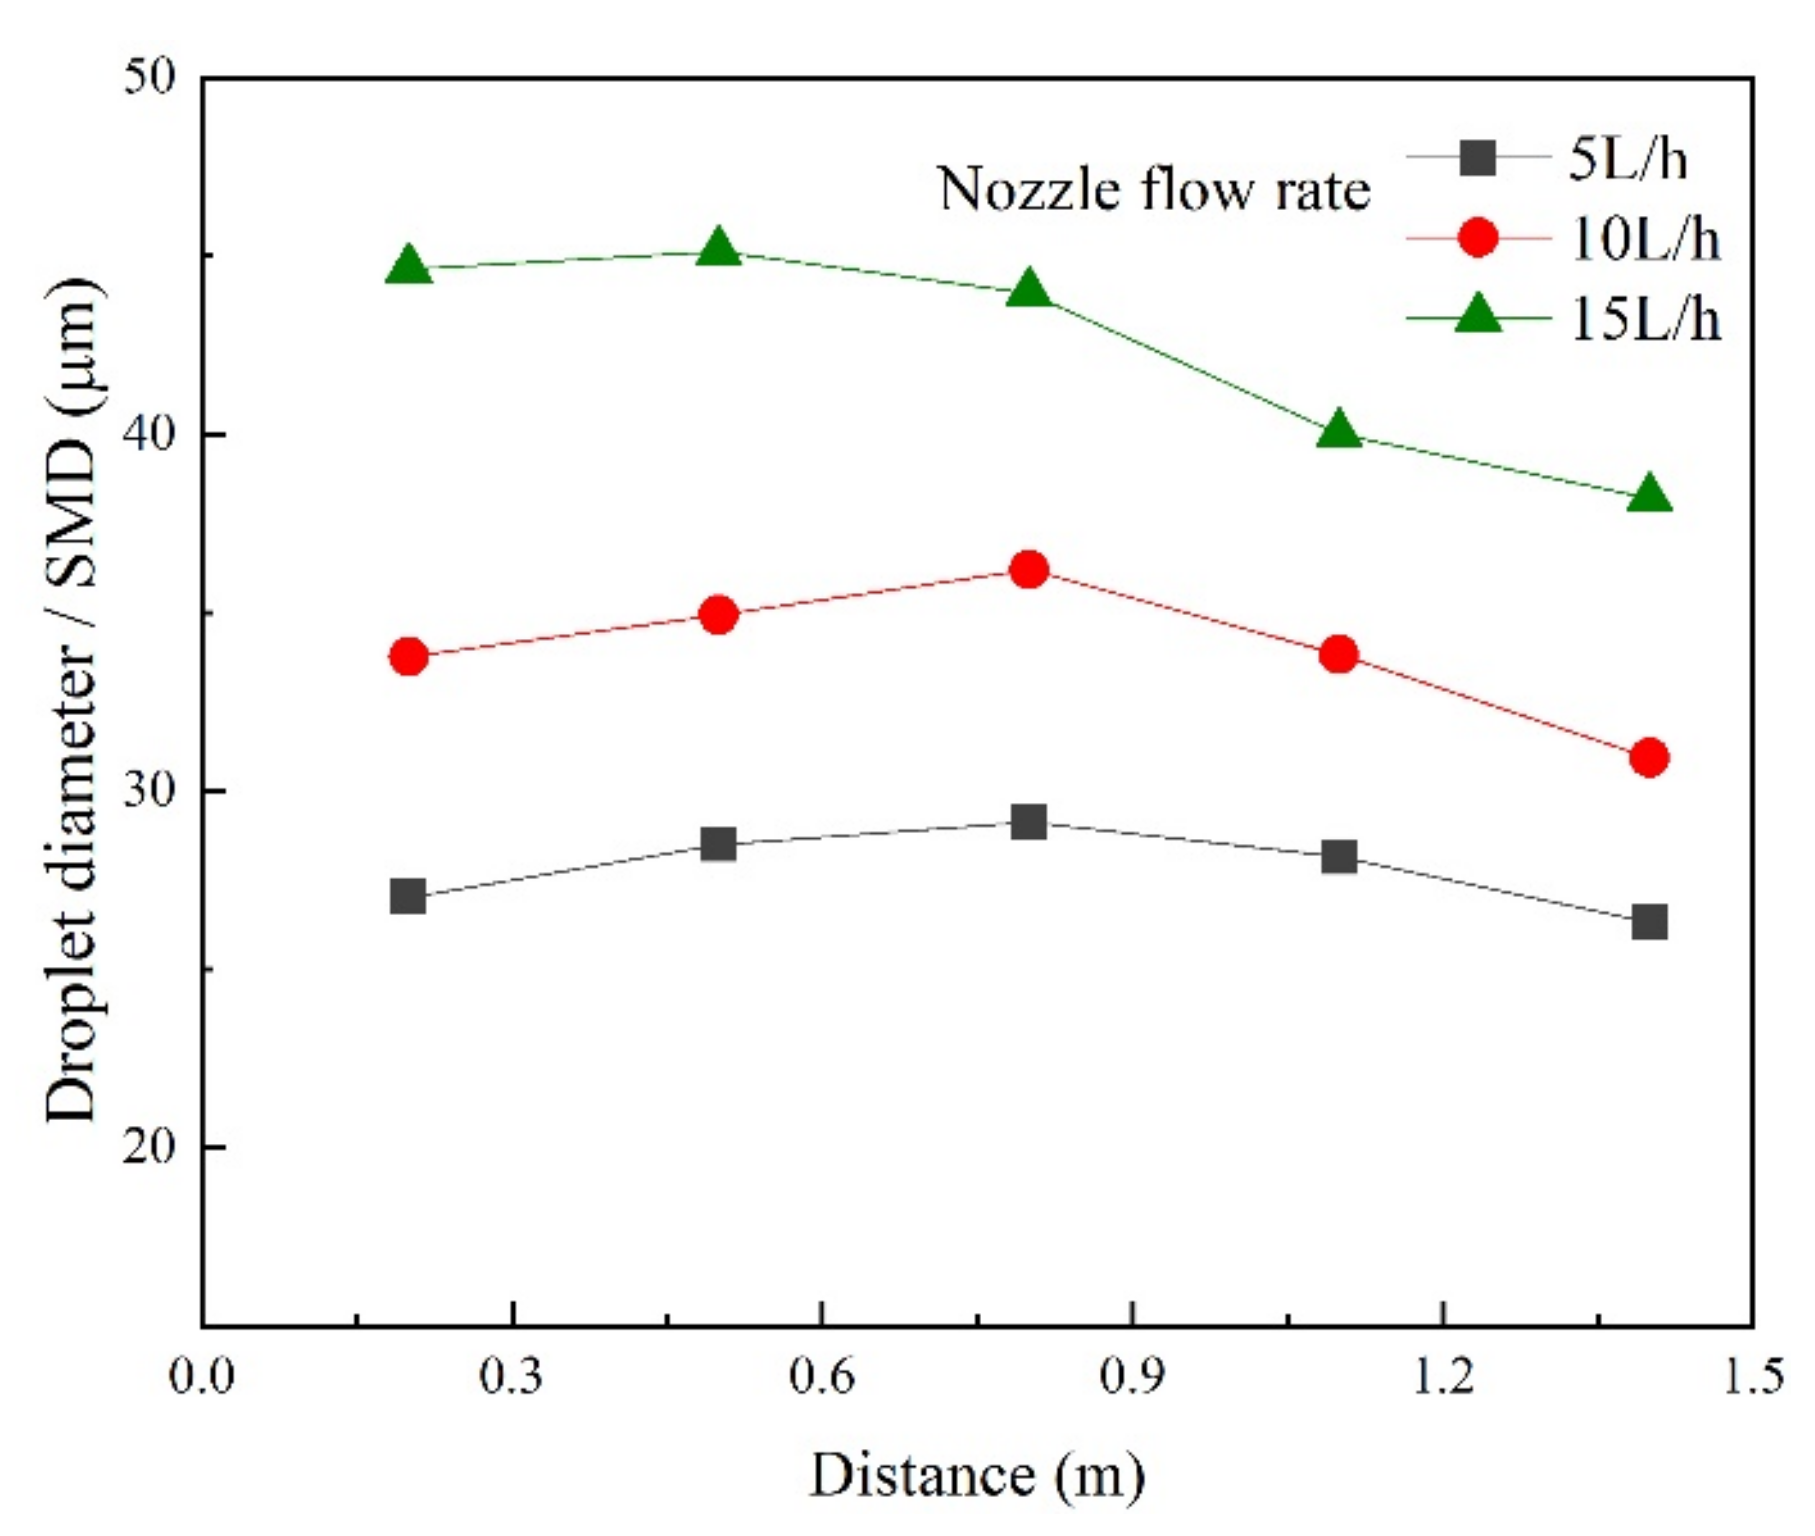
4.1.2. Effect of Flow Rate from Spray Nozzle
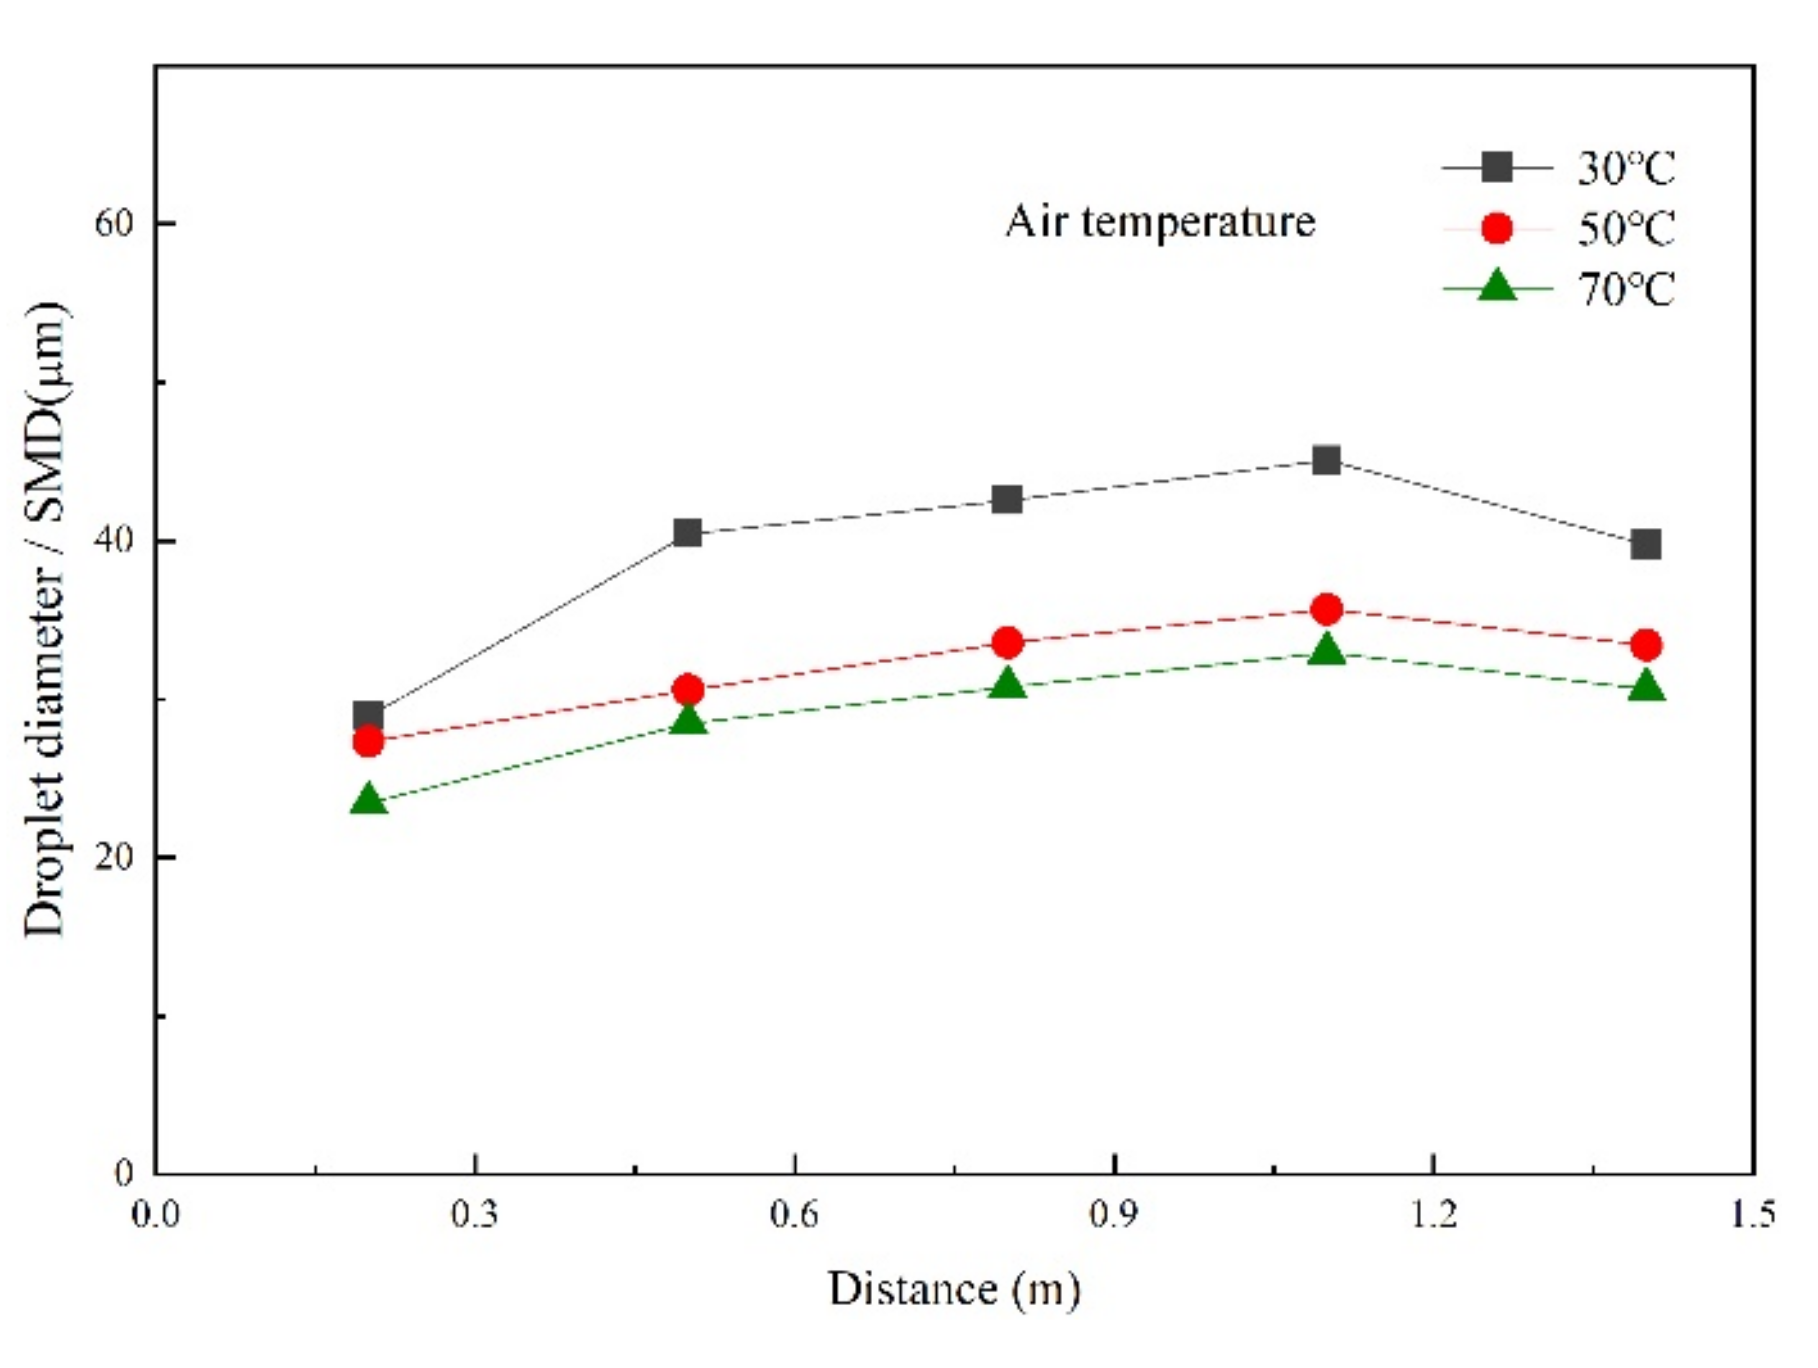
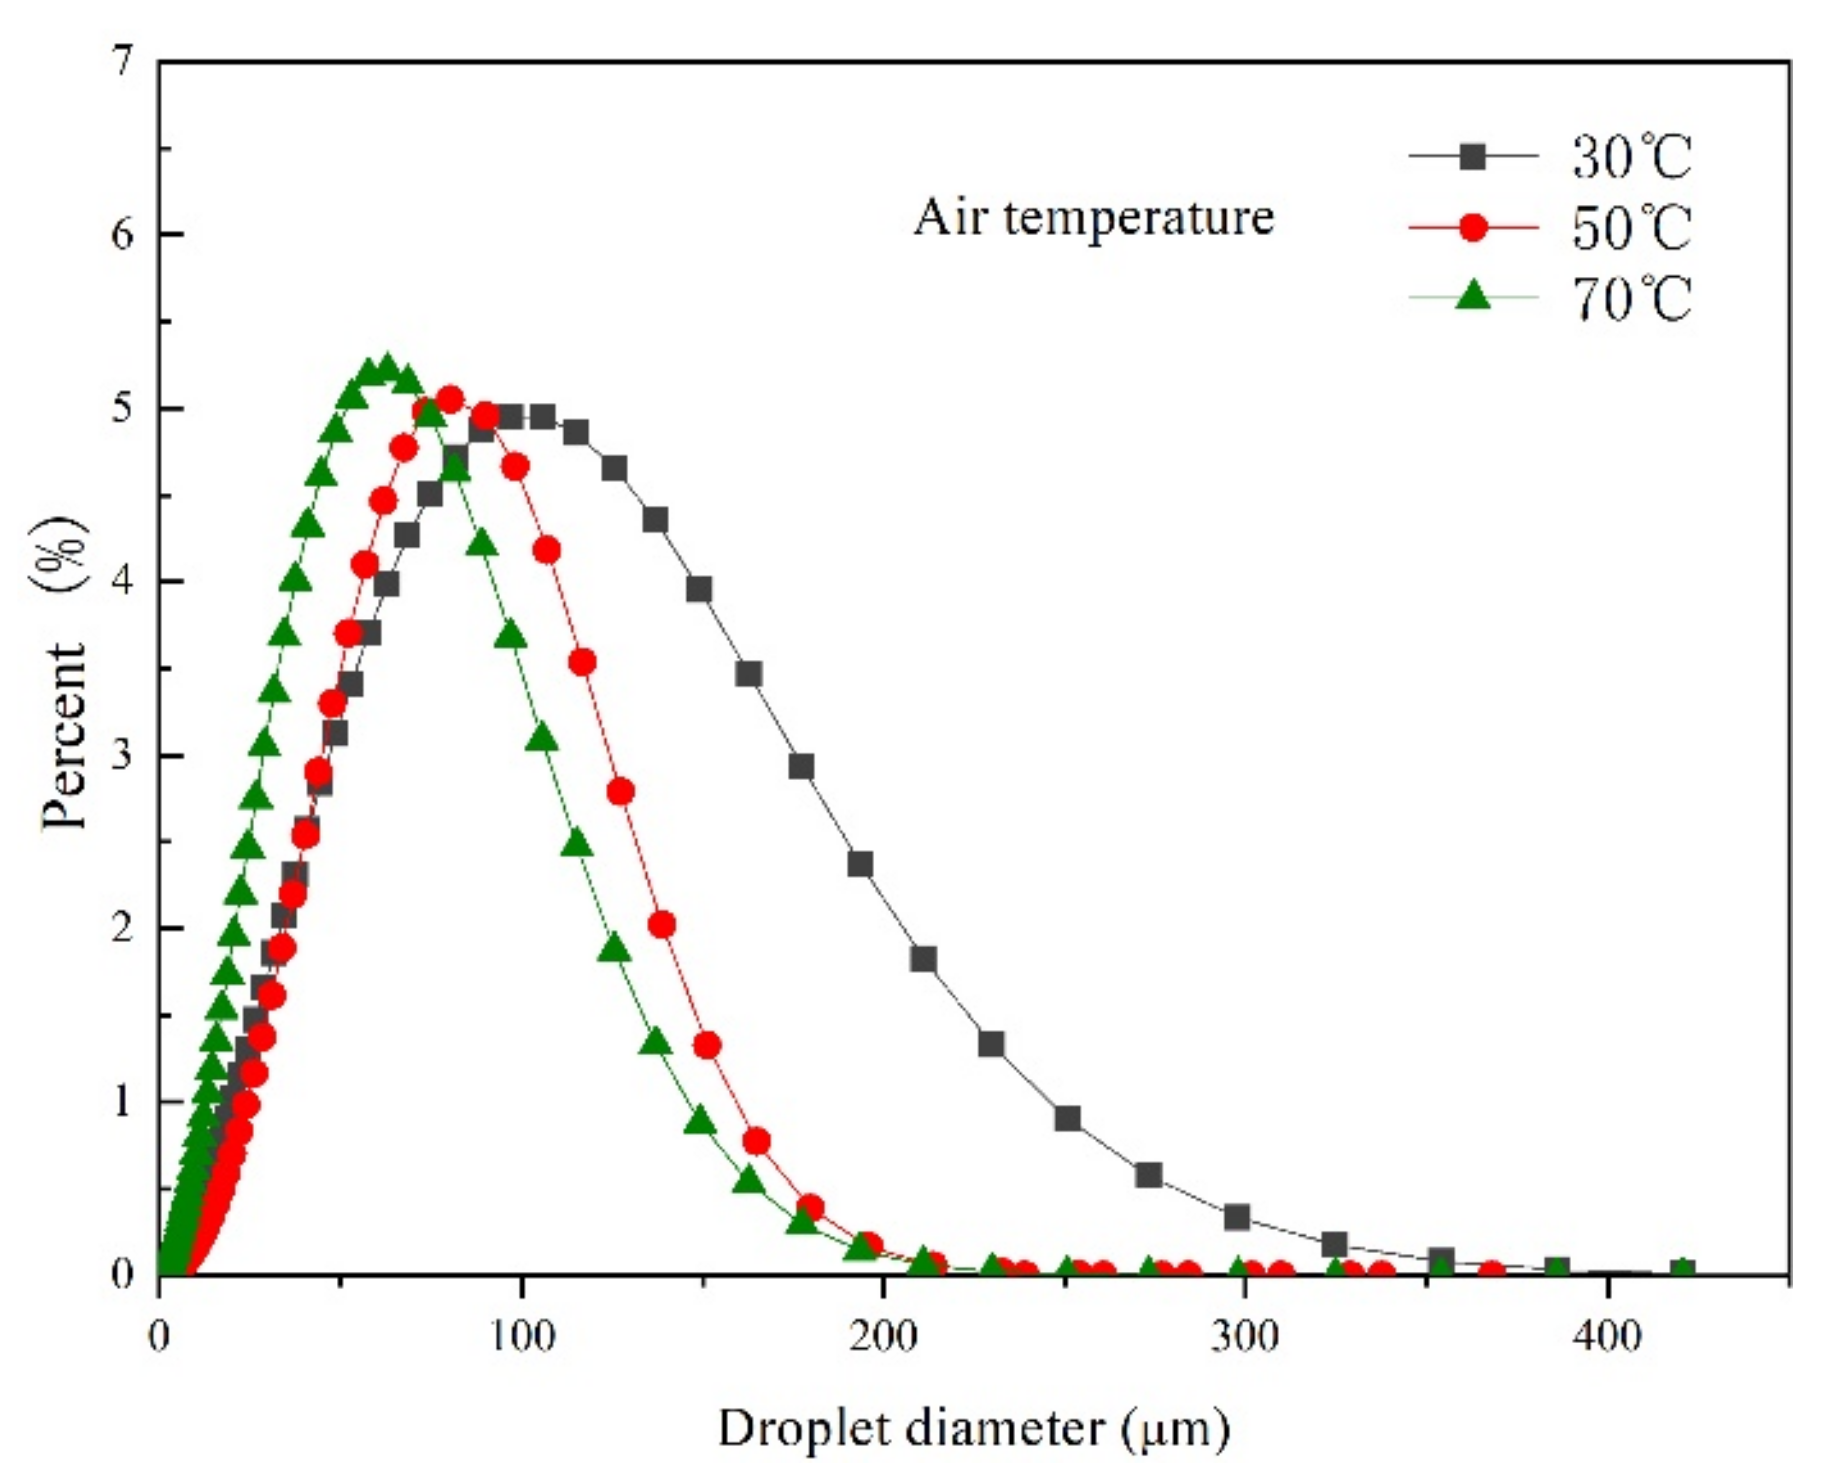
4.1.3. Effect of Air Temperature
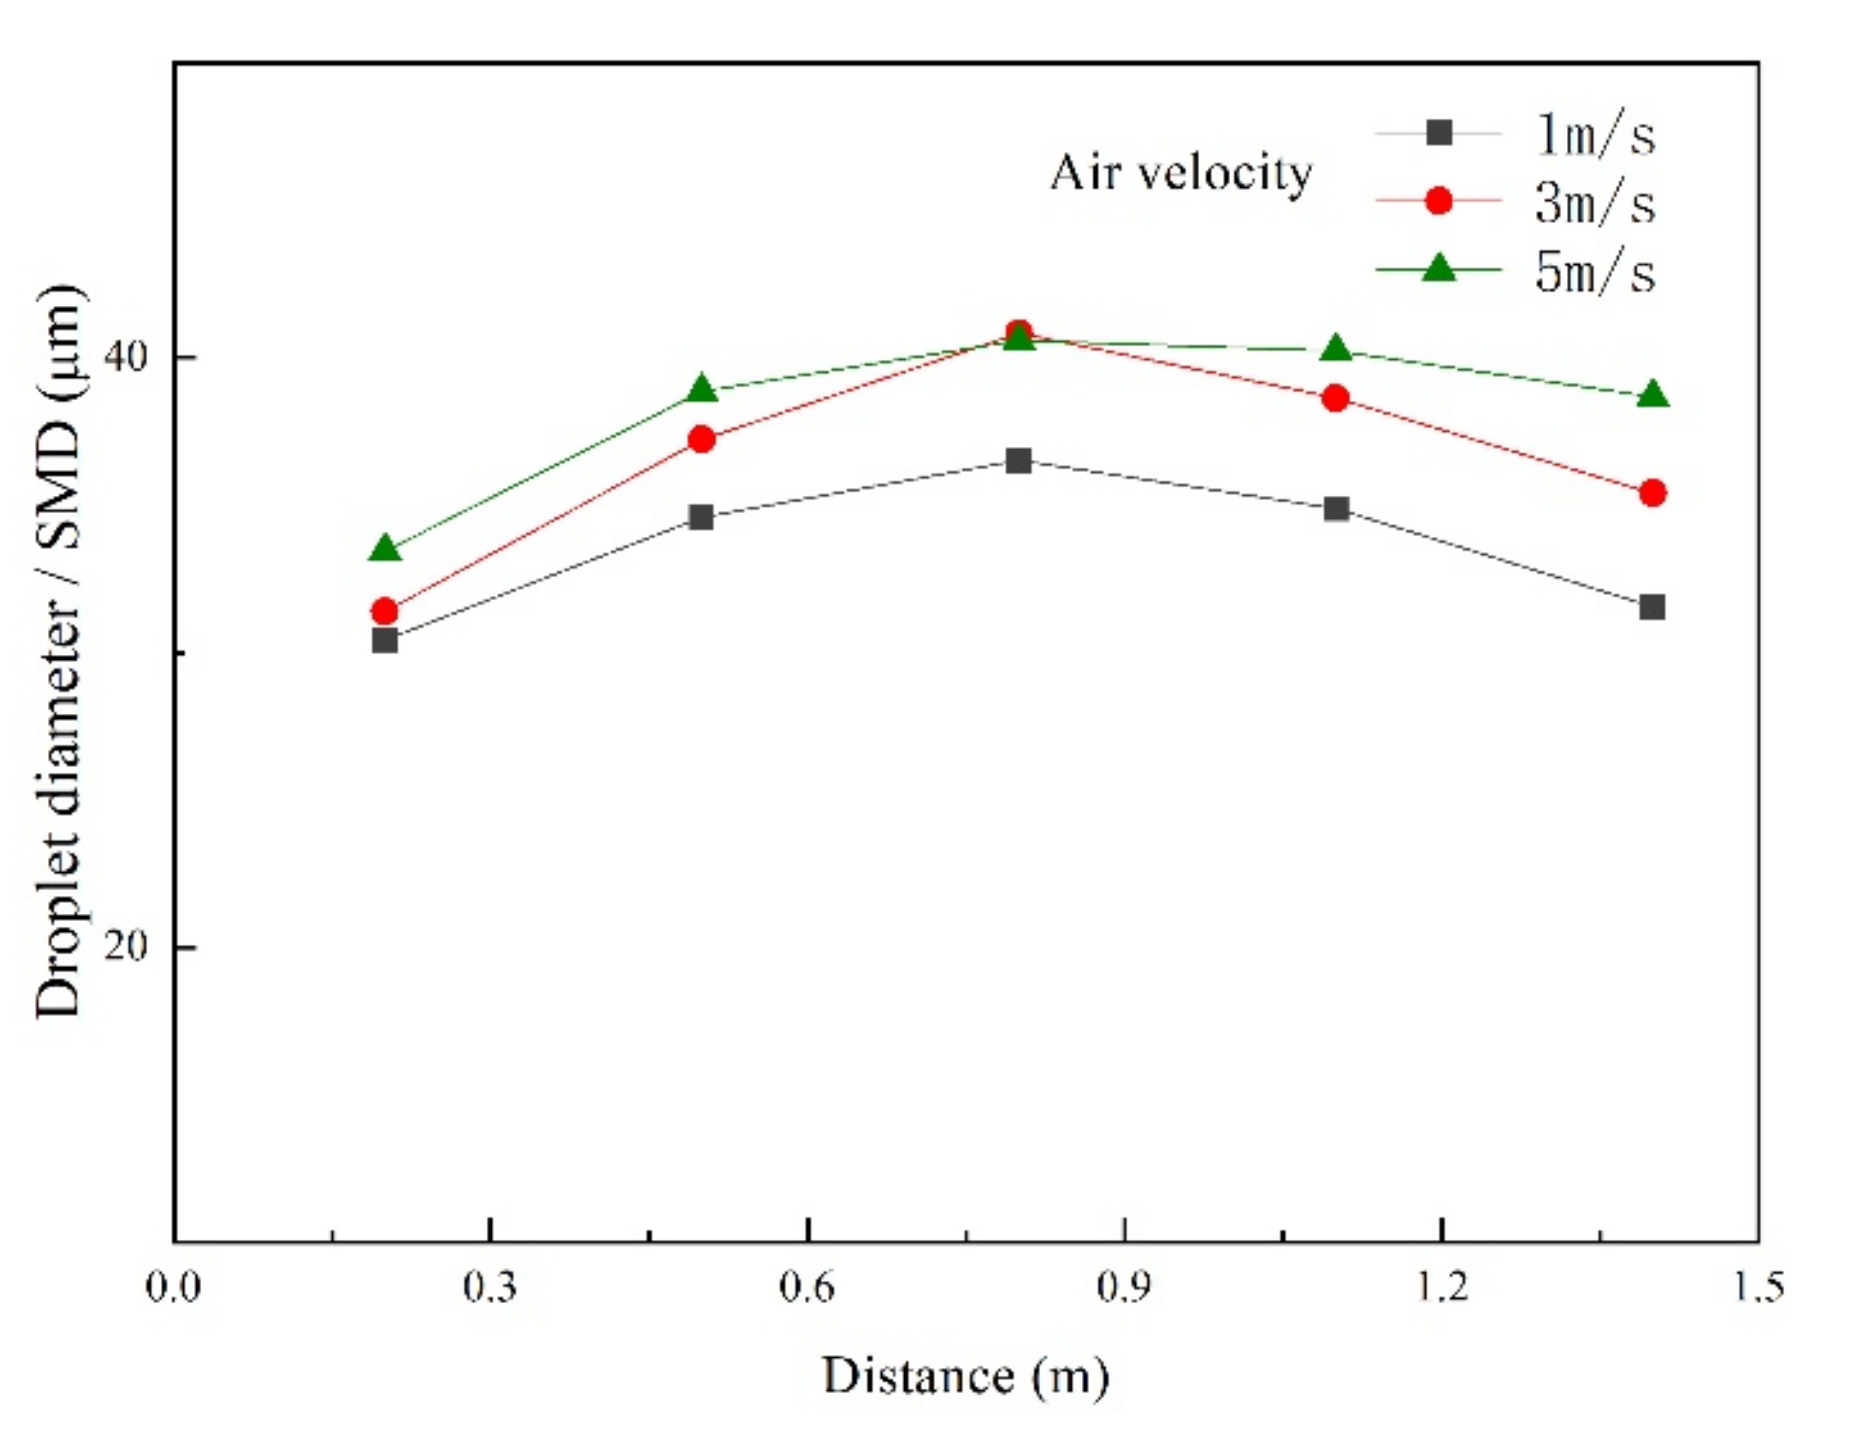
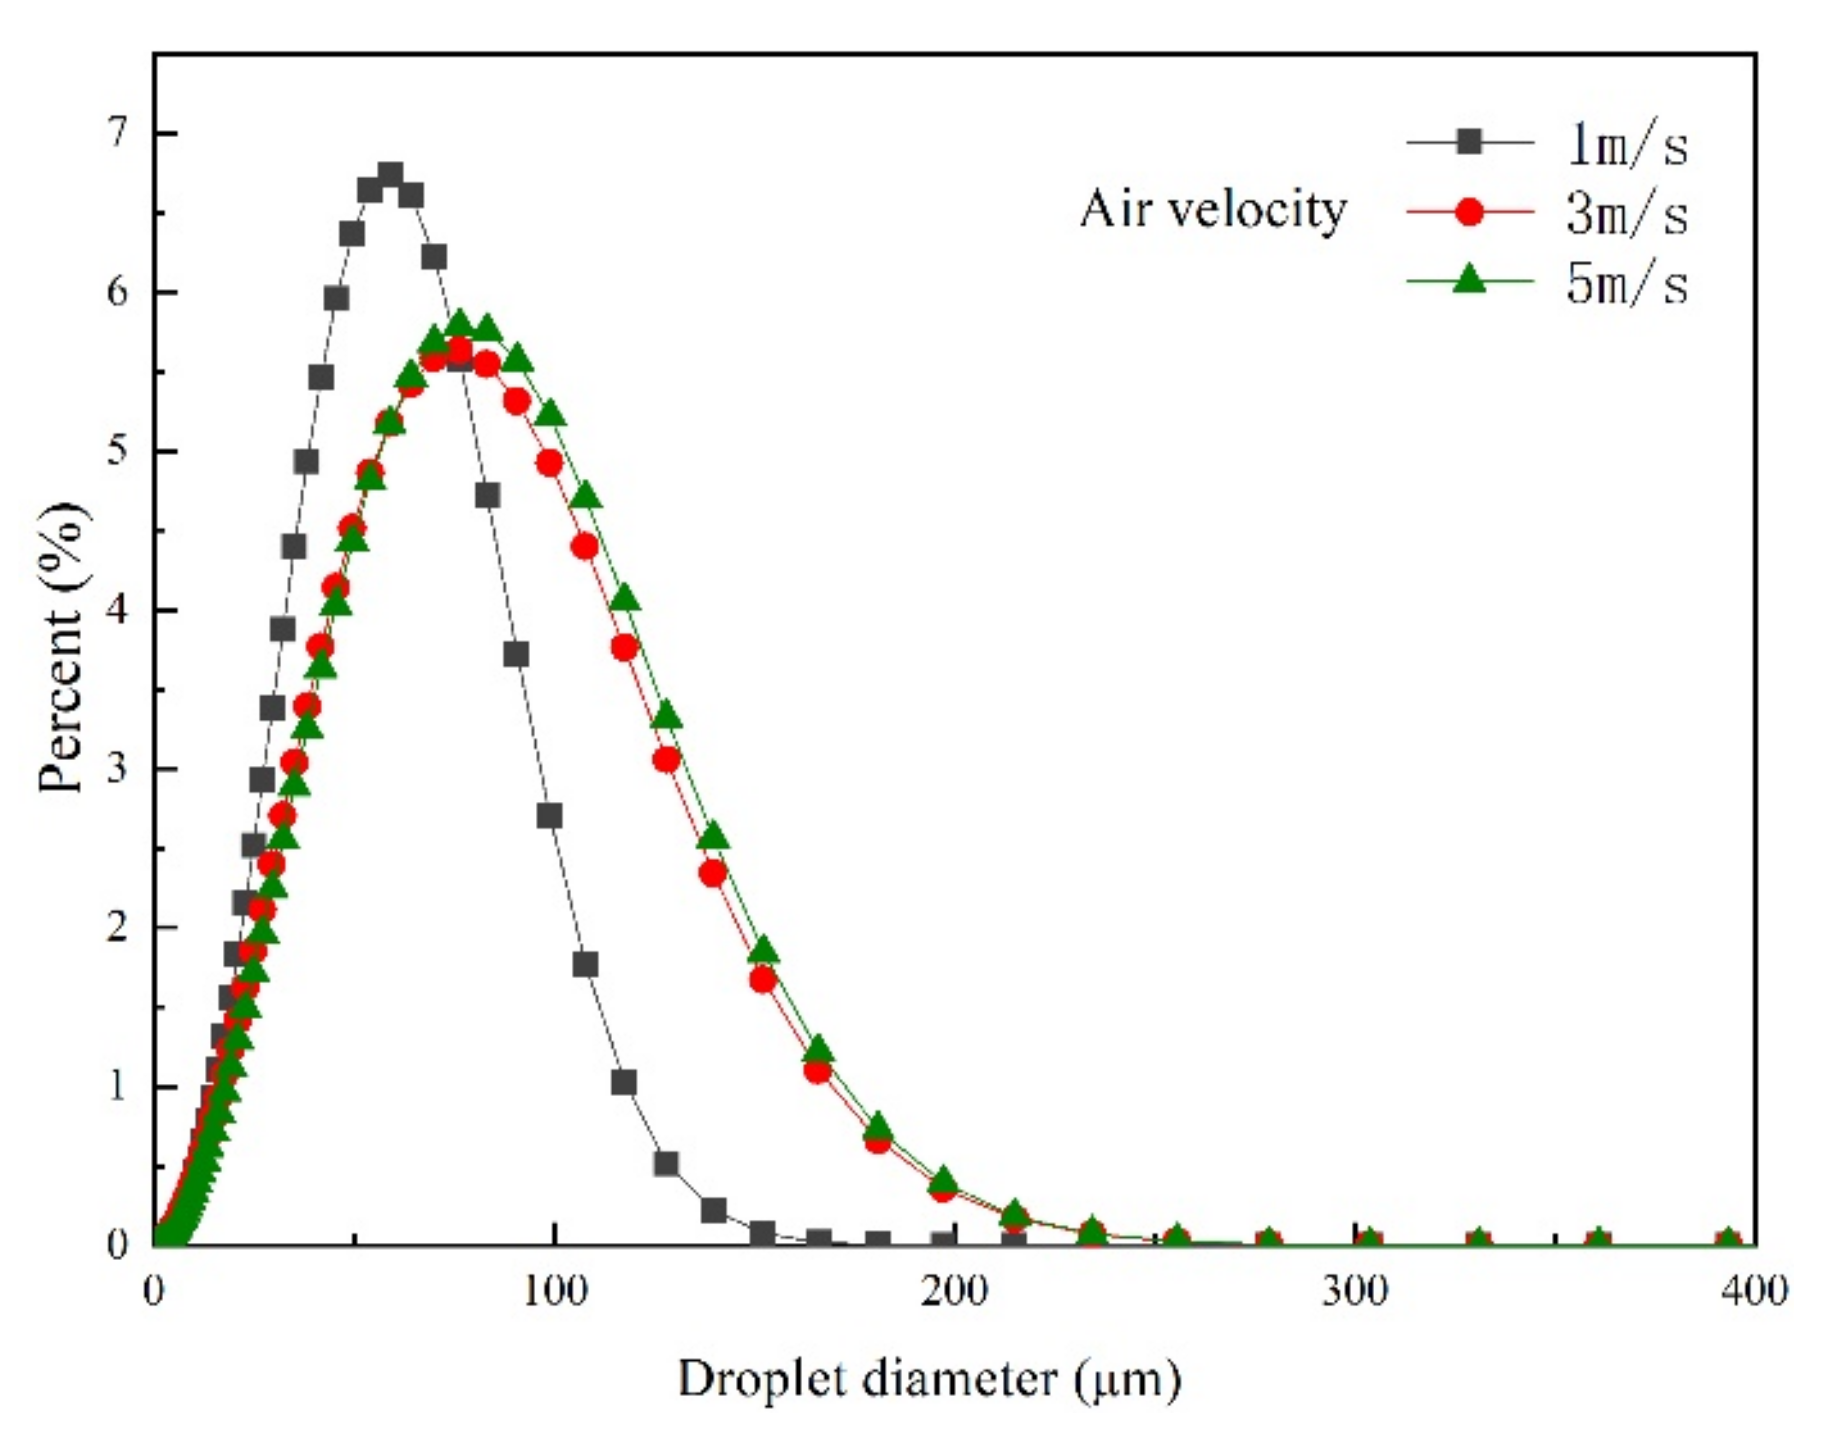
4.1.4. Effect of Air Velocity
4.2. Simulation Results
4.2.1. Comparison of Experimental and Numerical Results
4.2.2. Numerical Results of the Evaporation Rate
5. Concluding Remarks
Supplementary Materials
Author Contributions
Funding
Conflicts of Interest
Nomenclature
| droplet surface area (m2) | |
| drag force coefficient | |
| specific heat (J kg−1 K−1) | |
| droplet average diameter (μm) | |
| diffusion coefficient (m2 s−1) | |
| internal energy (J kg−1) | |
| drag force (N) | |
| gravity (N) | |
| g | acceleration of gravity (m s−2) |
| convective heat transfer coefficient (W m−2 K−1) | |
| mass transfer coefficient (m s−1) | |
| sensible enthalpy of species (J kg−1) | |
| diffusion flux of species (kg m−2 s−1) | |
| thermal conductivity of air (W m−1 K−1) | |
| latent heat of water vaporization (J kg−1) | |
| droplet mass (kg) | |
| Nusselt number | |
| pressure (pa) | |
| Prandtl number | |
| Reynolds number | |
| source term of energy (W m−3) | |
| source term of mass (kg m−3 s−1) | |
| source term of momentum (kg m−2 s−2) | |
| Schmidt number | |
| Sherwood number | |
| temperature (K) | |
| air temperature (K) | |
| droplet temperature (K) | |
| droplet velocity (m s−1) | |
| air velocity components (m s−1) | |
| mass fraction of species | |
| Greek symbols | |
| density (kg m−3) | |
| mean strain tensor (s−1) | |
| dynamic viscosity of air (kg m−1 s−1) | |
| viscous dissipation (W m−3) | |
References
- Jiang, B.; Xie, Y.; Xia, D.; Liu, X. A potential source for PM2.5: Analysis of fine particle generation mechanism in Wet Flue Gas Desulfurization System by modeling drying and breakage of slurry droplet. Environ. Pollut. 2019, 246, 249–256. [Google Scholar] [CrossRef] [PubMed]
- Shi, W.; Lin, C.; Chen, W.; Hong, J.; Chang, J.; Dong, Y.; Zhang, Y. Environmental effect of current desulfurization technology on fly dust emission in China. Renew. Sustain. Energy Rev. 2017, 72, 1–9. [Google Scholar] [CrossRef]
- Han, X.; Zhang, D.; Yan, J.; Zhao, S.; Liu, J. Process development of flue gas desulphurization wastewater treatment in coal-fired power plants towards zero liquid discharge: Energetic, economic and environmental analyses. J. Clean. Prod. 2020, 261. [Google Scholar] [CrossRef]
- Sanku, M.G.; Karlsson, H.K.; Hulteberg, C.; Wang, W.; Stallmann, O.; Karlsson, H.T. Kinetic Evaluation of Lime for Medium-Temperature Desulfurization in Oxy-Fuel Conditions by Dry Sorbent Injection. Energies 2019, 12, 2645. [Google Scholar] [CrossRef]
- Ma, S.; Chai, J.; Chen, G.; Wu, K.; Xiang, Y.; Wan, Z.; Zhang, J.; Zhu, H. Partitioning characteristic of chlorine ion in gas and solid phases in process of desulfurization wastewater evaporation: Model development and calculation. Environ. Sci. Pollut. Res. Int. 2019, 26, 8257–8265. [Google Scholar] [CrossRef]
- Ma, S.; Chai, J.; Wu, K.; Wan, Z.; Xiang, Y.; Zhang, J.; Fan, Z. Experimental and mechanism research on volatilization characteristics of HCl in desulfurization wastewater evaporation process using high temperature flue gas. J. Ind. Eng. Chem. 2018, 66, 311–317. [Google Scholar] [CrossRef]
- Shuangchen, M.; Jin, C.; Kai, W.; Yajun, X.; Zhongcheng, W.; Jingrui, Z. Experimental and model research on chloride ion gas–solid distribution in the process of desulfurization wastewater evaporation. RSC Adv. 2018, 8, 26283–26292. [Google Scholar] [CrossRef]
- Shuangchen, M.; Jin, C.; Gongda, C.; Weijing, Y.; Sijie, Z. Research on desulfurization wastewater evaporation: Present and future perspectives. Renew. Sustain. Energy Rev. 2016, 58, 1143–1151. [Google Scholar] [CrossRef]
- Godin, A. Pretreatment of liquid industrial streams by adsorption: Challenges and perspectives. Adsorpt. J. Int. Adsorpt. Soc. 2017, 23, 349–353. [Google Scholar] [CrossRef]
- Koralegedara, N.H.; Pinto, P.X.; Dionysiou, D.D.; Al-Abed, S.R. Recent advances in flue gas desulfurization gypsum processes and applications—A review. J. Environ. Manag. 2019, 251, 109572. [Google Scholar] [CrossRef] [PubMed]
- Gingerich, D.B.; Grol, E.; Mauter, M.S. Fundamental challenges and engineering opportunities in flue gas desulfurization wastewater treatment at coal fired power plants. Environ. Sci. Water Res. Technol. 2018, 4, 909–925. [Google Scholar] [CrossRef]
- Córdoba, P. Partitioning and speciation of selenium in wet limestone flue gas desulphurisation systems: A review. Fuel 2017, 202, 184–195. [Google Scholar] [CrossRef]
- Ma, Y.; Nie, Q.; Xiao, R.; Hu, W.; Han, B.; Polaczyk, P.A.; Huang, B. Experimental investigation of utilizing waste flue gas desulfurized gypsum as backfill materials. Constr. Build. Mater. 2020, 245. [Google Scholar] [CrossRef]
- Ren, C.; Wang, W.; Mao, Y.; Yuan, X.; Song, Z.; Sun, J.; Zhao, X. Comparative life cycle assessment of sulfoaluminate clinker production derived from industrial solid wastes and conventional raw materials. J. Clean. Prod. 2017, 167, 1314–1324. [Google Scholar] [CrossRef]
- Fu, J.; Hu, N.; Yang, Z.; Wang, L. Experimental study on zero liquid discharge (ZLD) of FGD wastewater from a coal-fired power plant by flue gas exhausted heat. J. Water Process Eng. 2018, 26, 100–107. [Google Scholar] [CrossRef]
- Li, C.; Li, G.; Zhang, S.; Wang, H.; Wang, Y.; Zhang, Y. Study on the pyrolysis treatment of HPF desulfurization wastewater using high-temperature waste heat from the raw gas from a coke oven riser. RSC Adv. 2018, 8, 30652–30660. [Google Scholar] [CrossRef]
- Bin, H.; Yang, Y.; Chunmin, Y.; Lin, Z.; Linjun, Y. Improving the electrostatic precipitation removal efficiency by desulfurized wastewater evaporation. RSC Adv. 2016, 6, 113703–113711. [Google Scholar] [CrossRef]
- Cristóbal, J.; Guillén-Gosálbez, G.; Jiménez, L.; Irabien, A. Optimization of global and local pollution control in electricity production from coal burning. Appl. Energy 2012, 92, 369–378. [Google Scholar] [CrossRef]
- Gude, V.G. Energy and water autarky of wastewater treatment and power generation systems. Renew. Sustain. Energy Rev. 2015, 45, 52–68. [Google Scholar] [CrossRef]
- Ma, S.; Chai, F.; Wu, W. The numerical simulation of flue gas desulphurization wastewater spray evaporation. Comput. Appl. Chem. 2016, 33, 47–53. [Google Scholar] [CrossRef]
- Deng, J.J.; Pan, L.M.; Chen, D.Q.; Dong, Y.Q.; Wang, C.M.; Liu, H.; Kang, M.Q. Numerical simulation and field test study of desulfurization wastewater evaporation treatment through flue gas. Water Sci. Technol. 2014, 70, 1285–1291. [Google Scholar] [CrossRef][Green Version]
- Feng, S.; Xiao, L.; Ge, Z.; Yang, L.; Du, X.; Wu, H. Parameter analysis of atomized droplets sprayed evaporation in flue gas flow. Int. J. Heat Mass Transf. 2019, 129, 936–952. [Google Scholar] [CrossRef]
- Zhang, Y.X.; Wang, X.; Zhang, H.D.; Liu, J.Y.; Luan, T. Numerical simulation of WFGD wastewater with atomizing and crystallization treatment. Energy Sources Part A-Recovery Util. Environ. Eff. 2020, 42, 1268–1285. [Google Scholar] [CrossRef]
- Shuang-chen, M.; Jin, C.; Jia-ning, C.; Kai, W.; Zhong-cheng, W.; Jing-rui, Z. Numerical simulation of bypass evaporation system treating FGD wastewater using high temperature flue gas. Environ. Technol. (UK) 2020, 41, 751–763. [Google Scholar] [CrossRef] [PubMed]
- Alkhedhair, A.; Gurgenci, H.; Jahn, I.; Guan, Z.; He, S. Numerical simulation of water spray for pre-cooling of inlet air in natural draft dry cooling towers. Appl. Therm. Eng. 2013, 61, 416–424. [Google Scholar] [CrossRef]
- Beji, T.; Zadeh, S.E.; Maragkos, G.; Merci, B. Influence of the particle injection rate, droplet size distribution and volume flux angular distribution on the results and computational time of water spray CFD simulations. Fire Saf. J. 2017, 91, 586–595. [Google Scholar] [CrossRef]
- Volkov, R.S.; Strizhak, P.A. Planar laser-induced fluorescence diagnostics of water droplets heating and evaporation at high-temperature. Appl. Therm. Eng. 2017, 127, 141–156. [Google Scholar] [CrossRef]
- Sazhin, S.S. Advanced models of fuel droplet heating and evaporation. Prog. Energy Combust. Sci. 2006, 32, 162–214. [Google Scholar] [CrossRef]
- Chu, F.; Xiao, G.; Yang, G. Mass transfer characteristics and energy penalty analysis of MEA regeneration process in packed column. Sustain. Energy Fuels 2021, 5, 438–448. [Google Scholar] [CrossRef]
- Jen, T.C.; Li, L.J.; Cui, W.Z.; Chen, Q.H.; Zhang, X.M. Numerical investigations on cold gas dynamic spray process with nano- and microsize particles. Int. J. Heat Mass Transf. 2005, 48, 4384–4396. [Google Scholar] [CrossRef]
- Hou, Y.; Tao, Y.; Huai, X.; Guo, Z. Numerical characterization of multi-nozzle spray cooling. Appl. Therm. Eng. 2012, 39, 163–170. [Google Scholar] [CrossRef]
- Chen, W.X.; Chong, D.T.; Yan, J.J.; Dong, S.C.; Liu, J.P. Numerical Investigation of Two-Phase Flow in Natural Gas Ejector. Heat Transf. Eng. 2014, 35, 738–745. [Google Scholar] [CrossRef]
- Bailey, A.G.; Balachandran, W.; Williams, T.J. The rosin-rammler size distribution for liquid droplet ensembles. J. Aerosol. Sci. 1983, 14, 39–46. [Google Scholar] [CrossRef]
- Li, T.; Pougatch, K.; Salcudean, M.; Grecov, D. Numerical modeling of an evaporative spray in a riser. Powder Technol. 2010, 201, 213–229. [Google Scholar] [CrossRef]
- Li, C.; Deng, T.; Wen, Z.; Tian, T.; Li, G.; Zhang, Y.; Li, Z. Evaporation experiment and numerical simulation study of desulfurization wastewater in high-temperature raw gas. Chem. Eng. Res. Des. 2019, 146, 117–129. [Google Scholar] [CrossRef]
- Tate, R.W. Some Problems Associated with the Accurate Representation of Droplet Size Distributions. In Proceedings of the 2nd International Conference on Liquid Atomization and Spray Systems, Madison, WI, USA, 20–24 June 1982. [Google Scholar]
- Panão, M.R.O.; Moreira, A.L.N. A real-time assessment of measurement uncertainty in the experimental characterization of sprays. Meas. Sci. Technol. 2008, 19. [Google Scholar] [CrossRef]
- Sureshkumar, R.; Kale, S.R.; Dhar, P.L. Heat and mass transfer processes between a water spray and ambient air—I. Experimental data. Appl. Therm. Eng. 2008, 28, 349–360. [Google Scholar] [CrossRef]
- Alkhedhair, A.; Jahn, I.; Gurgenci, H.; Guan, Z.; He, S.; Lu, Y. Numerical simulation of water spray in natural draft dry cooling towers with a new nozzle representation approach. Appl. Therm. Eng. 2016, 98, 924–935. [Google Scholar] [CrossRef]
- Tissot, J.; Boulet, P.; Labergue, A.; Castanet, G.; Trinquet, F.; Fournaison, L. Experimental study on air cooling by spray in the upstream flow of a heat exchanger. Int. J. Therm. Sci. 2012, 60, 23–31. [Google Scholar] [CrossRef]
- Panão, M.O.; Moita, A.S.; Moreira, A.L. On the statistical characterization of sprays. Appl. Sci. (Switzerland) 2020, 10, 6122. [Google Scholar] [CrossRef]
- Sun, Z.; Yang, L.; Chen, S.; Bai, L.; Wu, X. Promoting the removal of fine particles and zero discharge of desulfurization wastewater by spray-turbulent agglomeration. Fuel 2020, 270, 117461. [Google Scholar] [CrossRef]


| Air Pressure/MPa | Evaporation Rate/% | Evaporate Capacity/kg·s–1 |
|---|---|---|
| 0.1 | 60.5 | 0.00168 |
| 0.2 | 72.4 | 0.00201 |
| 0.3 | 47.9 | 0.00133 |
| Flow Rate/L·h–1 | Evaporation Rate/% | Evaporate Capacity/kg·s–1 |
|---|---|---|
| 5 | 78.3 | 0.00109 |
| 10 | 60.5 | 0.00168 |
| 15 | 50.8 | 0.00226 |
| Air Temperature/°C | Evaporation Rate/% | Evaporate Capacity/kg·s–1 |
|---|---|---|
| 30 | 28.6 | 0.00039 |
| 50 | 63.2 | 0.00087 |
| 70 | 78.3 | 0.00110 |
Publisher’s Note: MDPI stays neutral with regard to jurisdictional claims in published maps and institutional affiliations. |
© 2021 by the authors. Licensee MDPI, Basel, Switzerland. This article is an open access article distributed under the terms and conditions of the Creative Commons Attribution (CC BY) license (https://creativecommons.org/licenses/by/4.0/).
Share and Cite
Guo, H.; Wang, J.; Wu, J.; Du, X. Study on Spray Evaporation Treatment of Desulfurization Wastewater. Coatings 2021, 11, 418. https://doi.org/10.3390/coatings11040418
Guo H, Wang J, Wu J, Du X. Study on Spray Evaporation Treatment of Desulfurization Wastewater. Coatings. 2021; 11(4):418. https://doi.org/10.3390/coatings11040418
Chicago/Turabian StyleGuo, Huiqian, Jing Wang, Jiangbo Wu, and Xiaoze Du. 2021. "Study on Spray Evaporation Treatment of Desulfurization Wastewater" Coatings 11, no. 4: 418. https://doi.org/10.3390/coatings11040418
APA StyleGuo, H., Wang, J., Wu, J., & Du, X. (2021). Study on Spray Evaporation Treatment of Desulfurization Wastewater. Coatings, 11(4), 418. https://doi.org/10.3390/coatings11040418