1. Introduction
Fatigue cracking is one of the most frequent types of failure in asphalt mixtures [
1]. This phenomenon is related to the deterioration experienced by pavements because of the repeated application of loads with less magnitude than the maximum resistance of the materials forming them [
2]. However, fatigue is not only affected by the structural composition and intrinsic characteristics of the materials, but also by environmental factors that cause additional distresses, such as the thermal stresses entailed by the existence of oscillations in temperature [
3]. In the end, the combination of these conditions leads to the progressive cracking of the mixtures, which eventually results in their breaking.
This process is usually divided into three steps related to the creation of higher stresses around the location of cracks, which in turn cause their subsequent expansion [
4]. Hence, first is crack initiation, which involves a decrease in the dynamic modulus of the mixture. Then, cracks propagate to result in larger cracks due to the merger of those generated in the first instance. Finally, the last stage involves the rapid evolution of these macrocracks until they cause the breakage of the mixture.
As such, fatigue is associated with the service life of asphalt mixtures. In this sense, it is related to the concept of self-healing, which seeks to extend the lifetime of asphalt mixtures by including metal particles whose heating fluidizes bitumen to fill cracks caused by aging phenomena [
5]. Self-healing has evolved a lot in the past few years due to its potential to produce more economically and environmentally efficient asphalt mixtures, especially when adding metal by-products [
6]. This has resulted in a variety of studies where self-healing is tested in laboratory [
7,
8] and modeled using different numerical methods [
9,
10].
Some authors, such as Arabani and Mirabdolazimi (2011) [
11], conducted fatigue tests on asphalt mixtures containing waste iron powder, achieving an increase in their strength in comparison to conventional samples. These results were aligned with those obtained by Shafabakhsh and Ani (2015) [
12], whose investigation led to an improved fatigue life in asphalt mixtures with modified bitumen and steel slags as additives. However, these studies were only oriented to determine the contribution of metal particles to improving the resistance of asphalt mixtures, disregarding their healing potential.
Instead, several studies have focused on pairing the concepts of fatigue and self-healing to ensure the environmental sustainability of asphalt pavements. One of the first examples found in the literature was carried out by Kim et al. (2003) [
13], who evaluated the innate capacity of sand asphalt samples to heal during rest periods after fatigue tests. This approach is aligned with that presented by Yang et al. (2016) [
14], who checked the self-healing of asphalt by undertaking four-point fatigue tests with and without rest periods. Other authors have focused on the induced healing of asphalt mixtures. Hence, the healing effect of asphalt mixtures reinforced with steel wool after being subject to a four-point bending fatigue resistance test was addressed in Liu et al. (2012) [
15] and Liu et al. (2012) [
16]. Their conclusions coincided with those achieved by Menozzi et al. (2015) [
17], suggesting that the service life of asphalt concrete can be extended if induction heating is applied.
Considering the scope of these studies, a research gap was found in the evaluation of the fatigue behavior of self-healing asphalt mixtures including metal by-products. On the one hand, there are investigations devoted to the fatigue testing of asphalt mixtures containing waste by-products; however, they exclusively focused on the resistance of the mixtures whose design was not validated in terms of self-healing capacity. On the other hand, some studies did assess the fatigue response of asphalt mixtures designed for healing purposes. However, the inductors in these mixtures were virgin metal particles instead of by-products. In addition, fatigue tests were applied to deteriorate the specimens and then heal them via magnetic induction, without reaching their breakage point.
In this context, this research aimed at evaluating the fatigue response of asphalt mixtures containing metal by-products suitable for self-healing purposes. Thus, three types of mixtures were tested in laboratory, two of which included metal wastes to replace part of the aggregates and the filler. Then, a statistical analysis was conducted to determine whether the fatigue behavior of the experimental mixtures significantly differed from that of a conventional asphalt concrete.
2. Materials and Methods
A graphical summary of the steps taken to carry out this study is provided in
Figure 1. First was the design of three groups of asphalt mixtures, two of which included two shortlisted metal by-products because of their proven capacity for boosting self-healing. Then, a series of samples prepared from these mixtures were subject to fatigue tests to determine their damage characteristic curves. Finally, the results achieved in laboratory were examined with the support of descriptive and inferential statistics. Below is provided a more detailed description of these steps.
2.1. Asphalt Mixture Design
This study was framed in Spain, where the majority of warm mix asphalt production (69%) was in the form of surface courses in 2019. In turn, 81.2% of these surface courses was made of asphalt concrete during that year [
18]. As such, a dense asphalt concrete (AC-16) mixture including ophite as coarse aggregate and limestone as fine aggregate was dosed as a reference (REF). The experimental mixtures also contained metal by-products from sandblasting processes. These by-products were incorporated into the mixtures straightforwardly, without applying any previous treatment to facilitate their addition. This course of action was adopted to obtain a realistic vision of the viability of using metal wastes to replace virgin materials in asphalt mixtures.
In the case of the first group of experimental samples (SB1), the by-products (4.4%) stemmed from a sieving process and were used to replace part of the fine aggregates. The second group (SB2) included by-products from sieving and aspiration processes (7.9%), such that they performed as substitutes for both fine aggregates and filler. These two by-products were selected for testing due to their remarkable response in terms of self-healing and high waste content, respectively [
10].
Their healing potential was evaluated via a break-heal-break process through which asphalt mixtures containing metal wastes were subject to a three-point bending test and magnetic induction [
19]. The results of this experiment revealed that by-products stemming from sandblasting processes (SB1 and SB2) were especially suitable to perform as heating inductors.
Figure 2 depicts the texture of these sandblasting by-products depending on the process used for their extraction.
Given the differences in the extraction processes used to obtain the by-products, the dosage of the experimental mixtures was approached to match the particle size distribution curve of the reference samples (AC-16), instead of making it according to the weight or volume of their components [
19]. In other words, the AC-16 particle size distribution determined how much material might be added to the experimental mixtures without causing important deviations from the spindle. This enabled comparing the experimental samples with the reference mixture regardless of the amount of materials replaced by by-products in the former.
The percentage of bitumen was determined according to the Spanish Standard EN 13108-1 [
20], which establishes a minimum content of 4.5% in mixtures with aggregates with a density of 2.65 g/cm
3. Hence, the required bitumen content (
) for the mixtures was computed as a function of the density (
) of the aggregates and metal particles (when applicable), as shown in Equation (1).
Table 1 compiles the resulting ratios of bitumen in the mixtures, as well as the particle size distribution of their aggregates according to UNE-EN 933-2/1M:1999 [
21].
The groups to be tested in subsequent steps were combined in a mixer in the following order: coarse aggregates, fine aggregates along with by-products (when appropriate) and bitumen. After mixing these components in a drum for a minute, the filler was added, and the resulting mixture was blended during four additional minutes. The by-products were previously heated at 170 °C along with the fine aggregates and the filler to facilitate their distribution across the mixtures. Coarse aggregates were also heated at 170 °C before mixing, while this process was carried out at 155 °C in the case of the bitumen.
2.2. Laboratory Test
The asphalt concrete mixtures defined in the previous section were characterized using the Standard Method of Test for Determining the Damage Characteristic Curve of Asphalt Mixtures from Direct Tension Cyclic Fatigue Tests (AASHTO TP 107-14) [
22]. This test consists of applying repeated loads to cylindrical asphalt specimens until their failure. Such specimens must be prepared to result in a nominal maximum size aggregate less than or equal to 37.5 mm.
The output of the test is the damage characteristic curve, which stands for the relationship between the structural integrity and the amount of damage in a mixture. As such, it is calculated by relating the damage (S) and the pseudo secant modulus (C), whose values are represented in the form of a curve. Considering the viscoelastic properties of asphalt, the results of this test can be used to assess the fatigue of the samples tested.
The fatigue test was carried out on specimens cored from larger Superpave gyratory compacted samples. Given the design approach used, whereby the experimental mixtures (SB1 and SB2) were dosed to resemble the particle size distribution of the reference (REF), the air voids’ content was made constant for all three groups. To this end, the Superpave gyratory compactor was set to reach 8% air voids in the specimens.
This value decreased to 5% when the core was extracted and its top and bottom surfaces were cut to result in cylinders with 100 mm diameter and 130 mm height, as represented in
Figure 3a,b. In this sense, it is worth mentioning that the experimental mixture with the highest content of metal by-products (SB2) exhibited higher resistance to be cut, which caused greater abrasion on the saw, thereby hindering its application to these samples. Then, the specimens were glued and prepared (
Figure 3c) for the uniaxial fatigue test in the AsphaltQube machine designed by CONTROLS Group [
23], which led to their total breakage in some cases, as illustrated in
Figure 3d.
An example of the outputs derived from the test is provided in
Figure 4, including a graph of the number of cycles withstood by the samples according to the modulus and phase angle.
Figure 4 also includes the values of other parameters determined before running the test, such as the compliance factor (K), whose calculation was automated by the software associated with the machine from the peak-to-peak strain amplitude.
The fatigue test served to evaluate the traction-compression fatigue resistance of the mixtures, which were studied in subgroups of three specimens. A deformation of 300 microstrains was applied to test the first group. Based on the number of cycles resisted by this specimen, the values of deformation for the two other groups were determined to result in a curve representing the fatigue response of the mixtures in the most comprehensive possible manner. In the case of this research, these values corresponded to 250 and 350 microstrains. Overall, there were a total of nine samples per mixture, such that each value of deformation was used to test a subgroup of three specimens.
2.3. Statistical Analysis
A statistical analysis was performed to prove the suitability of replacing virgin materials with metal by-products in terms of fatigue resistance. This was accomplished by applying descriptive and inferential statistics.
Figure 5 summarizes the main statistical tests considered for the analysis of the results obtained in laboratory.
On the one hand, a descriptive analysis was conducted to explore and characterize the results derived from the laboratory [
24]. First, a descriptive statistical summary of the three groups of mixtures tested was carried out. This included a variety of statistical measures (mean, standard deviation, skewness, kurtosis, median, etc.), a histogram and a representation of the confidence intervals of the samples.
In addition, this summary also provided the results of the Anderson–Darling (A–D) test [
25], which determined whether the types of mixtures were normally distributed or not. The existence or absence of normality in the data was checked using the concept of
p-value, which represents the probability of rejecting the null hypothesis (H
0) when it is true [
26]. As opposed to the alternative hypothesis (H
1), H
0 indicated that the number of cycles resisted by the specimens of a group followed a normal distribution. The
p-value was compared with a significance level (α) of 0.05 [
27] to determine the probability of wrongly rejecting H
0.
Then, the degree of association between the values of deformation set for the fatigue test and the number of cycles resisted by the specimens was calculated using the Pearson’s correlation coefficient [
28]. In the case of this test, H
0 refers to the absence of a statistically significant correlation between microstrains and number of cycles. Therefore, the alternative hypothesis (H
1) can be accepted if the
p-value is below 0.05, indicating a statistically significant relationship.
To further explore the patterns of the results collected in laboratory, the Grubbs’ test was applied to detect the presence of outliers [
29]. This step is important to identify phenomena such as errors in the experiments, anomalous dispersion, etc. When referred to the Grubbs’ test, a
p-value below 0.05 enables accepting the alternative hypothesis (H
1), which denotes the presence of exactly one outlier.
Inferential statistics were used to extrapolate the results of the laboratory tests [
30]. In the context of this study, the application of inferential statistics was intended to demonstrate that asphalt mixtures including metal by-products can exhibit a fatigue behavior no worse than conventional ones.
Inferential statistics were used in the form of comparison tests to determine whether there was a statistically significant different between the fatigue resistance of reference (REF) and experimental (SB1 and SB2) mixtures. These tests can be parametric (ANOVA and Student’s t test) or non-parametric (Kruskal-Wallis, Mood’s Median and Mann-Whitney U tests) depending on whether the datasets under study were normally distributed and homoscedastic or not. Hence, one test or another was used depending on the number of groups to compare (2 or more than 2) and the characteristics of the data.
Homoscedasticity was evaluated through the Levene’s test, which is based on determining the deviation of the fatigue-related results from the median of values in the group to which they belong [
31]. If H
0 is accepted (
p-value > 0.05), then the dataset is homoscedastic. In case both assumptions were met, a one-way analysis of variance (ANOVA) [
32] and the Student’s
t test [
33] could be used to compare all three groups and each pair of groups, respectively. A
p-value ≤ 0.05 would suggest the existence of statistically significant differences in the fatigue response of the samples.
Non-parametric tests were used if any of the three datasets was found to violate either normality or homoscedasticity. The overall analysis of differences among the three groups required an additional verification in the case of non-parametric tests, since the Kruskal–Wallis [
34] or the Mood’s median [
35] tests are applicable depending on whether there are outliers in the data or not. Pairwise comparisons can be carried out using the Mann–Whitney U test [
36] in all cases.
3. Results and Discussion
A summary of the results obtained in laboratory is provided in
Table 2, including the number of cycles achieved by each specimen according to the microstrains considered. As mentioned in the description of the laboratory works, each group of samples was further divided into three subgroups, such that each of them was tested at a deformation level: 250, 300 and 350 microstrains. Below are presented and discussed the outputs derived from applying the statistical tests illustrated in
Figure 5 to these data.
3.1. Descriptive Analysis
To explore the characteristics of each group of samples, their descriptive statistical summary was produced as depicted in
Figure 6. The values of skewness and kurtosis were especially relevant, since they differed a lot for the mixtures with sandblasting by-products obtained from sieving and aspiration (SB2). On the one hand, its high value of skewness indicated that the right tail of the distribution was larger than the left one, so that the samples achieving a higher number of cycles were more separated from the mean in this group than in the others. On the other hand, its high value of kurtosis suggested a higher concentration of data around the mean. In the end, both measures pointed to the high variability exhibited by this type of mixture in terms of fatigue resistance.
As a validation step, the Pearson’s correlation coefficient between the microstrain levels considered and the number of fatigue cycles resisted by the samples before breaking was determined. When calculated for the three types of samples, the coefficient was −0.821 (p-value = 0.000), which suggested a strong negative and statistically significant correlation. This result is logical, since high displacements due to stress corresponded to a reduced number of cycles withstood by the samples. If this analysis was carried out separately, the results were −0.880 (p-value = 0.001), −0.919 (p-value = 0.000) and −0.734 (p-value = 0.024) for REF, SB1 and SB2, respectively.
Although it was high too, the strength of the association between both variables slightly decreased in the case of the mixtures with sandblasting by-products from sieving and aspiration processes (SB2). This was mainly due to the high dispersion in the performance of the samples tested for 250 microstrains, whose number of cycles ranged from 12,940 to 54,430. As indicated in
Figure 6, the results of the A-D test suggested that REF and SB1 were approximately normal. Instead, the
p-value associated with SB2 was below the significance level (0.05). As such, the Grubbs test was computed for the case that the second experimental mixture contained an outlier.
Figure 7 shows the results of applying this test to the three groups, which confirmed that the maximum number of cycles reached in SB2 was an outlier, since it was 2.29 standard deviations more than its mean (
p-value < 0.05). The reason behind this variability may lie in the different origins of the high content of waste present in this mixture (7.9%), which might be affecting the homogeneity of its dosage and, therefore, the consistency of results in terms of fatigue.
3.2. Inferential Analysis
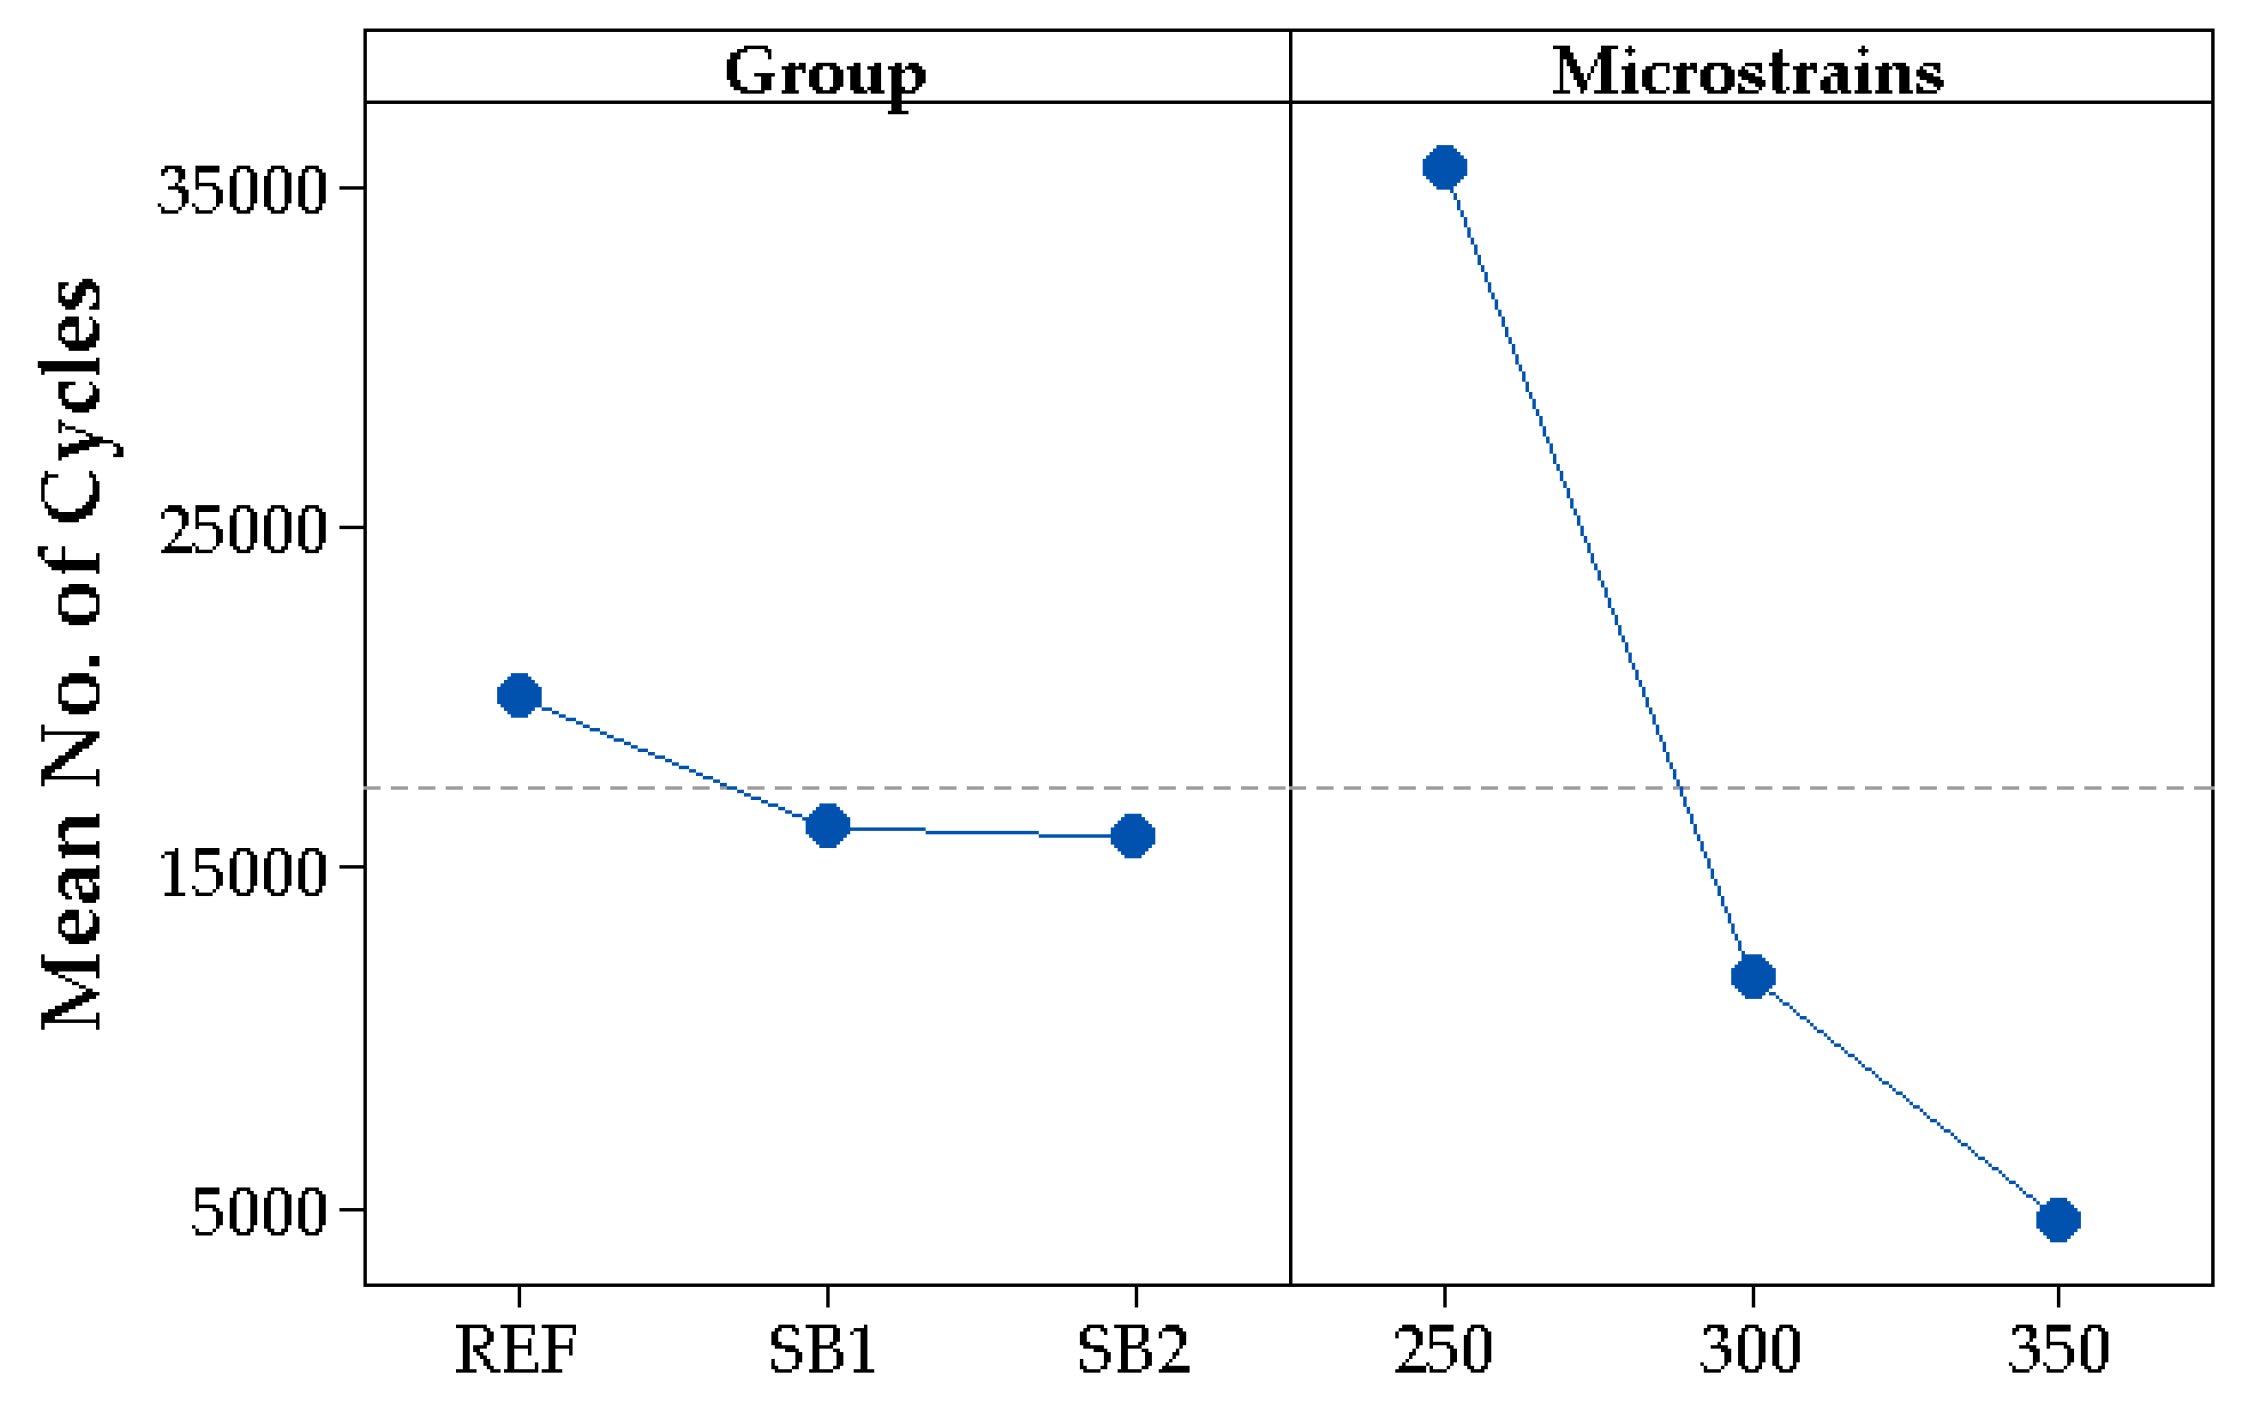
A main effects plot (
Figure 8) was prepared to examine how the mean of the response variable (number of cycles resisted by the specimens) was affected by the two main factors under consideration: the type of asphalt mixture (group) and the deformation (microstrains). Horizontal lines (parallel to the x axis) are interpreted as a signal of absence of influence of the factor on the response, and vice versa for vertical patterns. Hence,
Figure 8 reveals that deformation was relevant for the fatigue behaviour of the mixtures, especially in the case of 250 microstrains. The aspect of the left part of the plot suggests that the number of cycles reached in the tests might be similar for all the specimens regardless of the group they belonged to.
To confirm the inferences drawn from the main effects plot, the fatigue resistance of the three groups of samples was compared. To this end, the first step consisted of identifying the types of statistical tests that best fitted the characteristics of the dataset. These tests might be parametric or non-parametric depending on whether the distribution of the data resembled normal patterns or not.
Figure 4 shows the results of the Anderson–Darling test, which suggested that the samples belonging to the reference group were normally distributed (
p-value = 0.104); however, this assumption could not be guaranteed for those mixtures including steel wastes (
p-values < 0.050). This circumstance may indicate that the presence of wastes can hinder the symmetric distribution of values around the mean number of cycles withstood by the samples.
Under this premise, non-parametric tests must be used for subsequent analysis. Since there was an outlier in the second group of experimental mixtures (
Figure 7), the whole group of samples was assessed using the Mood’s median test (
Figure 5). The
p-value achieved in the test (>0.050) suggested that the differences among the fatigue resistance of the mixtures were not statistically significant, as shown in
Table 3. In other words, this result provided evidence of the viability of using industrial by-products for designing asphalt pavements in terms of fatigue resistance, since the performance of the experimental samples could not be concluded to be worse than that of the reference mixtures.
To further ratify the general trend of the results compiled in
Table 3, the Mann–Whitney U test was applied to compare the number of cycles resisted by each pair of asphalt mixture groups. The
p-values included in
Table 4, which were above the significance level in all cases (0.050), not only confirmed the absence of differences between the performance of experimental and reference samples (REF × SB1 and REF × SB2), but also the lack of influence of the process used to obtain wastes in the fatigue resistance of the mixtures (SB1 × SB2). Therefore, this inference was also promising in the sense of encouraging the testing of the fatigue response of asphalt mixtures including different wastes.
Overall, these results mean that the experimental mixtures tested have a similar fatigue behaviour to that of conventional asphalt. As such, they would be completely valid to withstand traffic loads if implemented in the field. However, high amounts of waste can lead to high dispersion in the results, especially in long tests (i.e., those with low values of deformation). This might be related to the heterogeneity caused by this high content of by-products, which in turn hinders the preparation of specimens and their uniformity for subsequent testing.
In this sense, checking how this heterogeneity may affect the results if conducting the analysis per strain level would also be of great interest. However, this breakdown was hindered by the limited number of replications available. In turn, this was a consequence of the difficulties found in acquiring larger amounts of metal by-products with analogous characteristics, since the sieving and aspiration processes leading to them caused great variations in their particle size distribution. This circumstance was ascertained by the receipt of new batches of SB1 and SB2 by-products that were discarded for fatigue testing due to their incompatibility with those included in the first consignment.
Still, this segmented analysis was carried out with the data available. Due to the very limited number of specimens per group and strain level, it was conducted for exploratory purposes only. To improve its relevance, the values corresponding to SB1 and SB2 were merged to increase the sample size of the experimental mixtures, which are susceptible to greater dispersion. Instead, REF is a conventional mixture whose fatigue behaviour can be expected to be rather homogeneous. The p-values derived from applying the Mann–Whitney U test for these two groups (REF × SB1_SB2) under the three strain levels (250, 300 and 350) were greater than 0.15 in all cases, which is above the significance level of 0.05. Although these results cannot be extrapolated beyond the boundaries of this study, they suggest that the fatigue response per strain level achieved by the experimental specimens would not significantly differ from that of the reference mixture either.
4. Conclusions
This research demonstrated the suitability of self-healing experimental mixtures including metal by-products to provide an analogous fatigue behavior to that expected in conventional asphalt pavements. The results leading to this inference were derived from a uniaxial fatigue test applied to three groups of asphalt mixtures (one conventional and two experimental). The use of descriptive and inferential statistical techniques revealed the absence of significant differences in the fatigue response of the experimental mixtures in relation to the conventional one.
The fact that the by-products included in the experimental mixtures were previously tested and validated in terms of self-healing guaranteed their complete functionality to be used in the field. However, the mixture containing a higher content of metal by-products (7.9%), whose origin stemmed from two different sources (sieving and aspiration), caused some difficulties when cutting and preparing it for testing. This was due to its heterogeneity, which resulted in a more disperse behavior in terms of number of cycles resisted.
Still, the coupling of the fatigue and self-healing potential of the experimental mixtures tested suggests that the use of industrial by-products is a sustainable approach to increase the lifetime of asphalt pavements. As such, demonstrating the functionality of these kinds of mixtures can help generalize the inclusion of metal wastes in pavement design. Given the massive presence of asphalt roads across the world, the benefits entailed by this course of action would not only increase their durability and limit traffic disruptions, but would also involve important contributions to the three Rs of the circular economy: reduce, reuse and recycle. In turn, this may lead to diverse economic and environmental benefits, such as new profit opportunities or fewer GHG emissions.
Despite the promising results obtained in this study, further research should explore testing higher number of mixtures with different combinations of metal by-products in terms of both type and content. This would not only enable obtaining more relevant findings according to the strain level applied, but also optimizing the fatigue resistance of self-healing asphalt mixtures through numerical models. Still, the results presented in this study provide evidence of the promising future and sustainability of self-healing technology, demonstrating how metal wastes can be valorized to both result in economic and environmental gains and extend the service life of asphalt pavements.


 ,
, 


