
Low-Cost Nanostructured Coating of Anodic Aluminium Oxide Synthesized in Sulphuric Acid as Electrolyte


Abstract

1. Introduction
2. Materials and Methods
2.1. Substrate Material
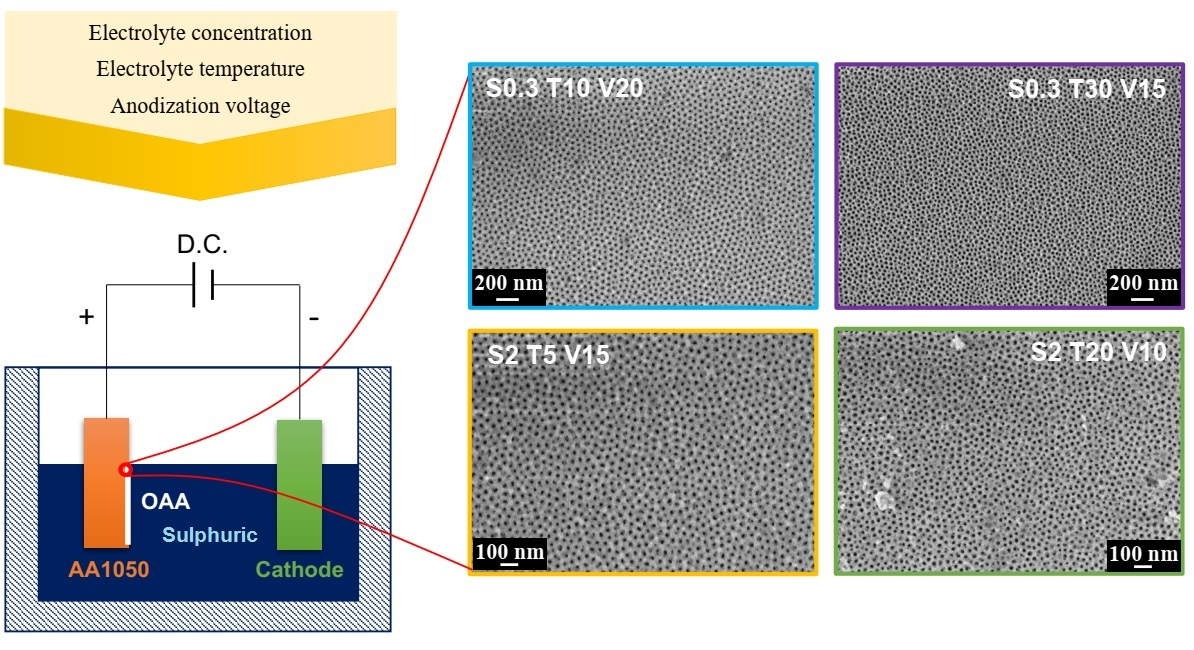
2.2. Synthesis of AAO Coatings
2.2.1. Pre-Treatment of the Substrate Surface
2.2.2. Anodic Oxidation
2.3. Morphological Characterization of Coatings
2.4. Statistic Analysis
3. Results and Discussion
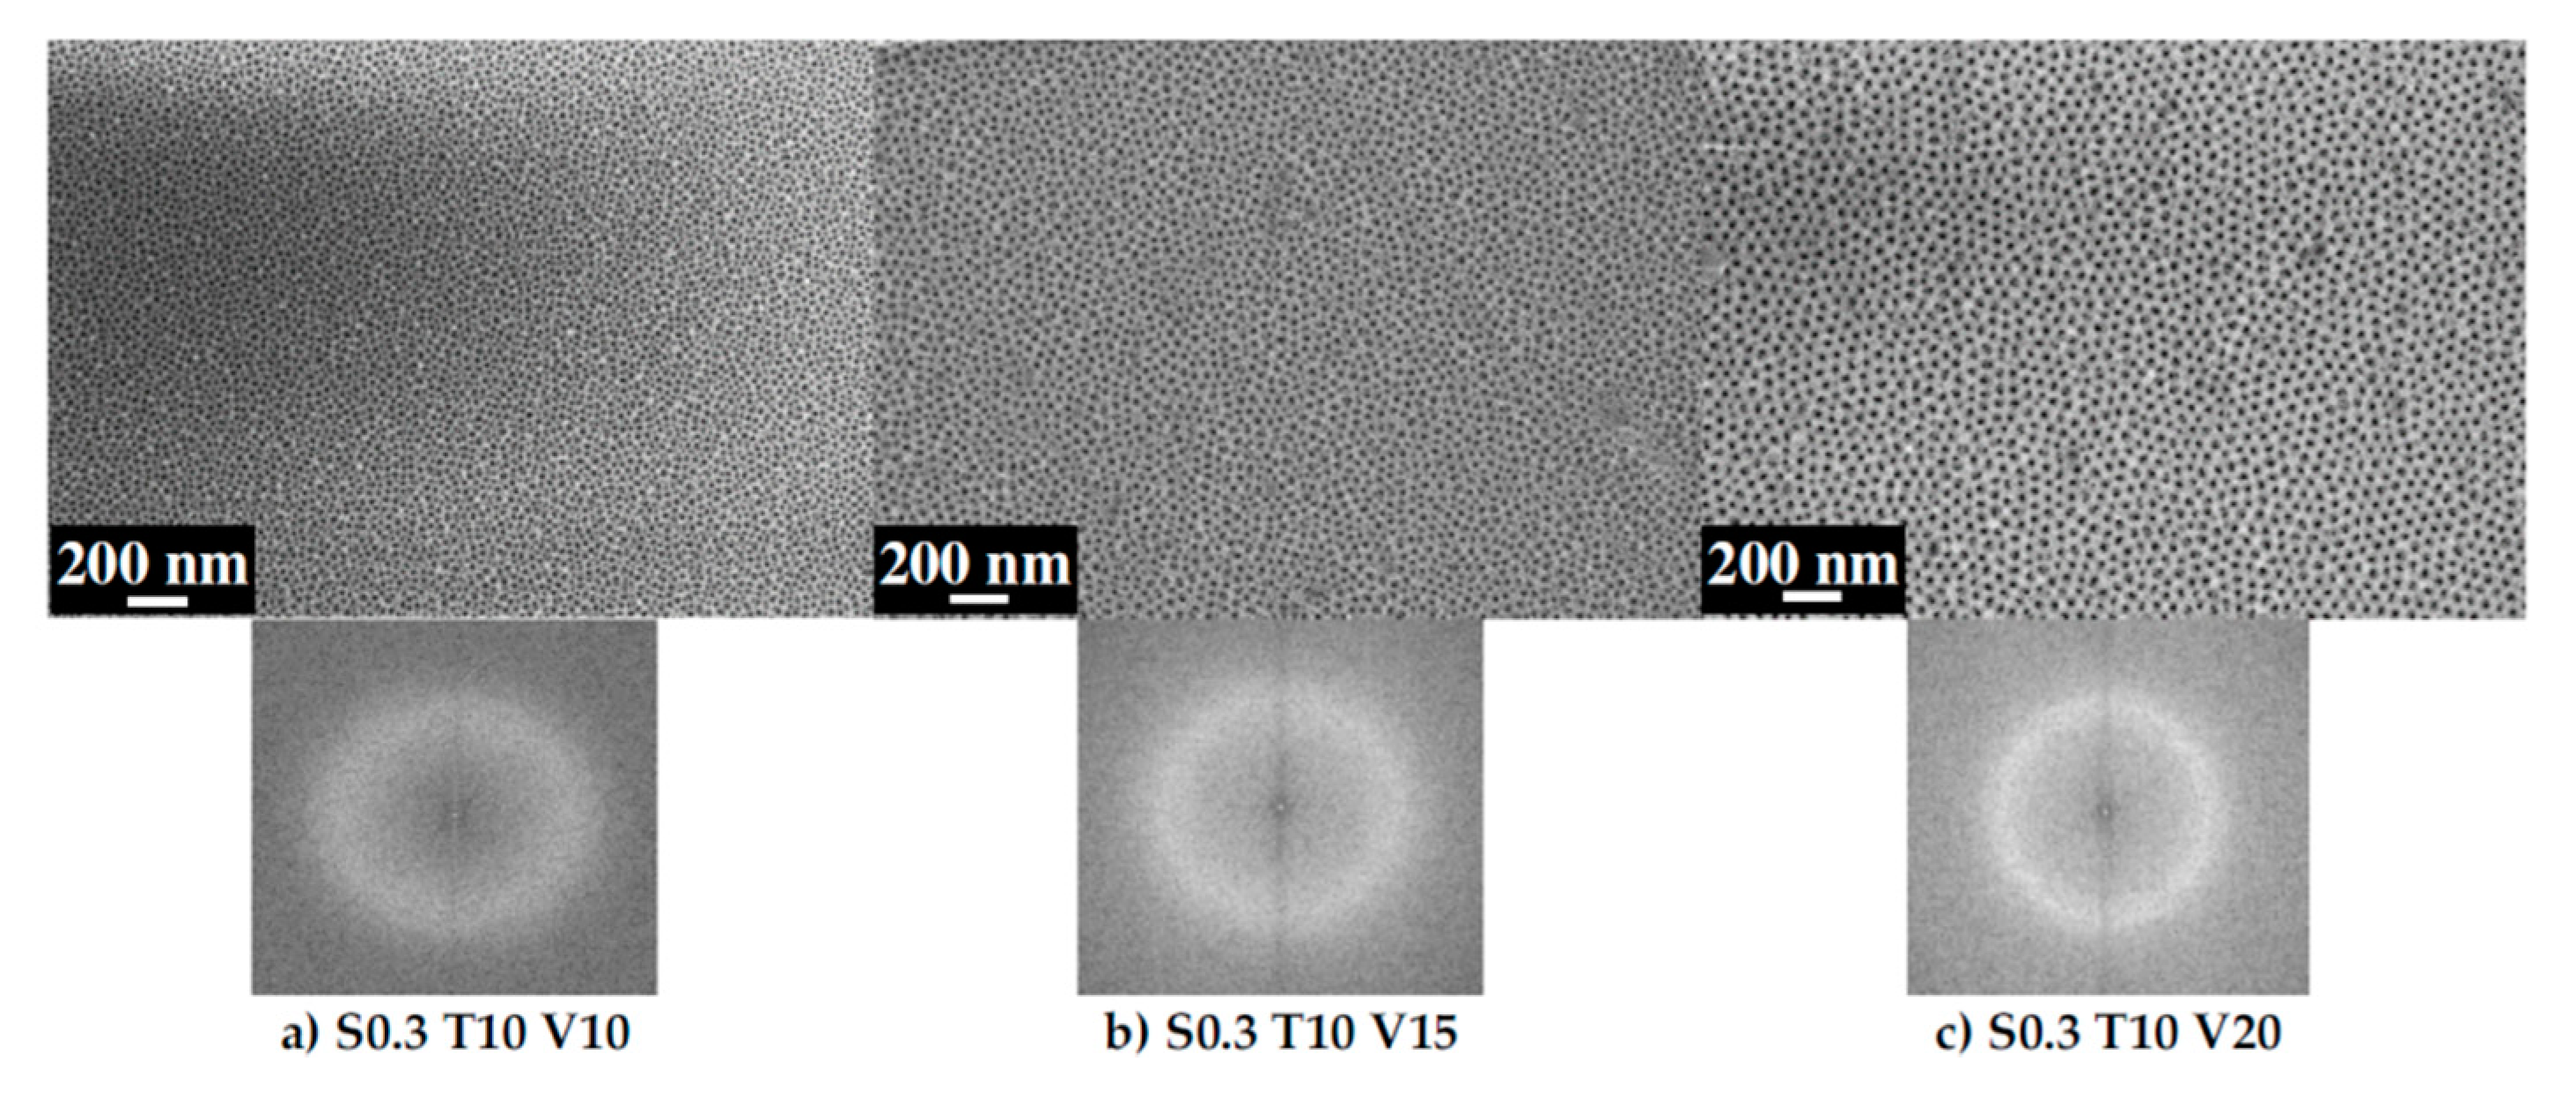
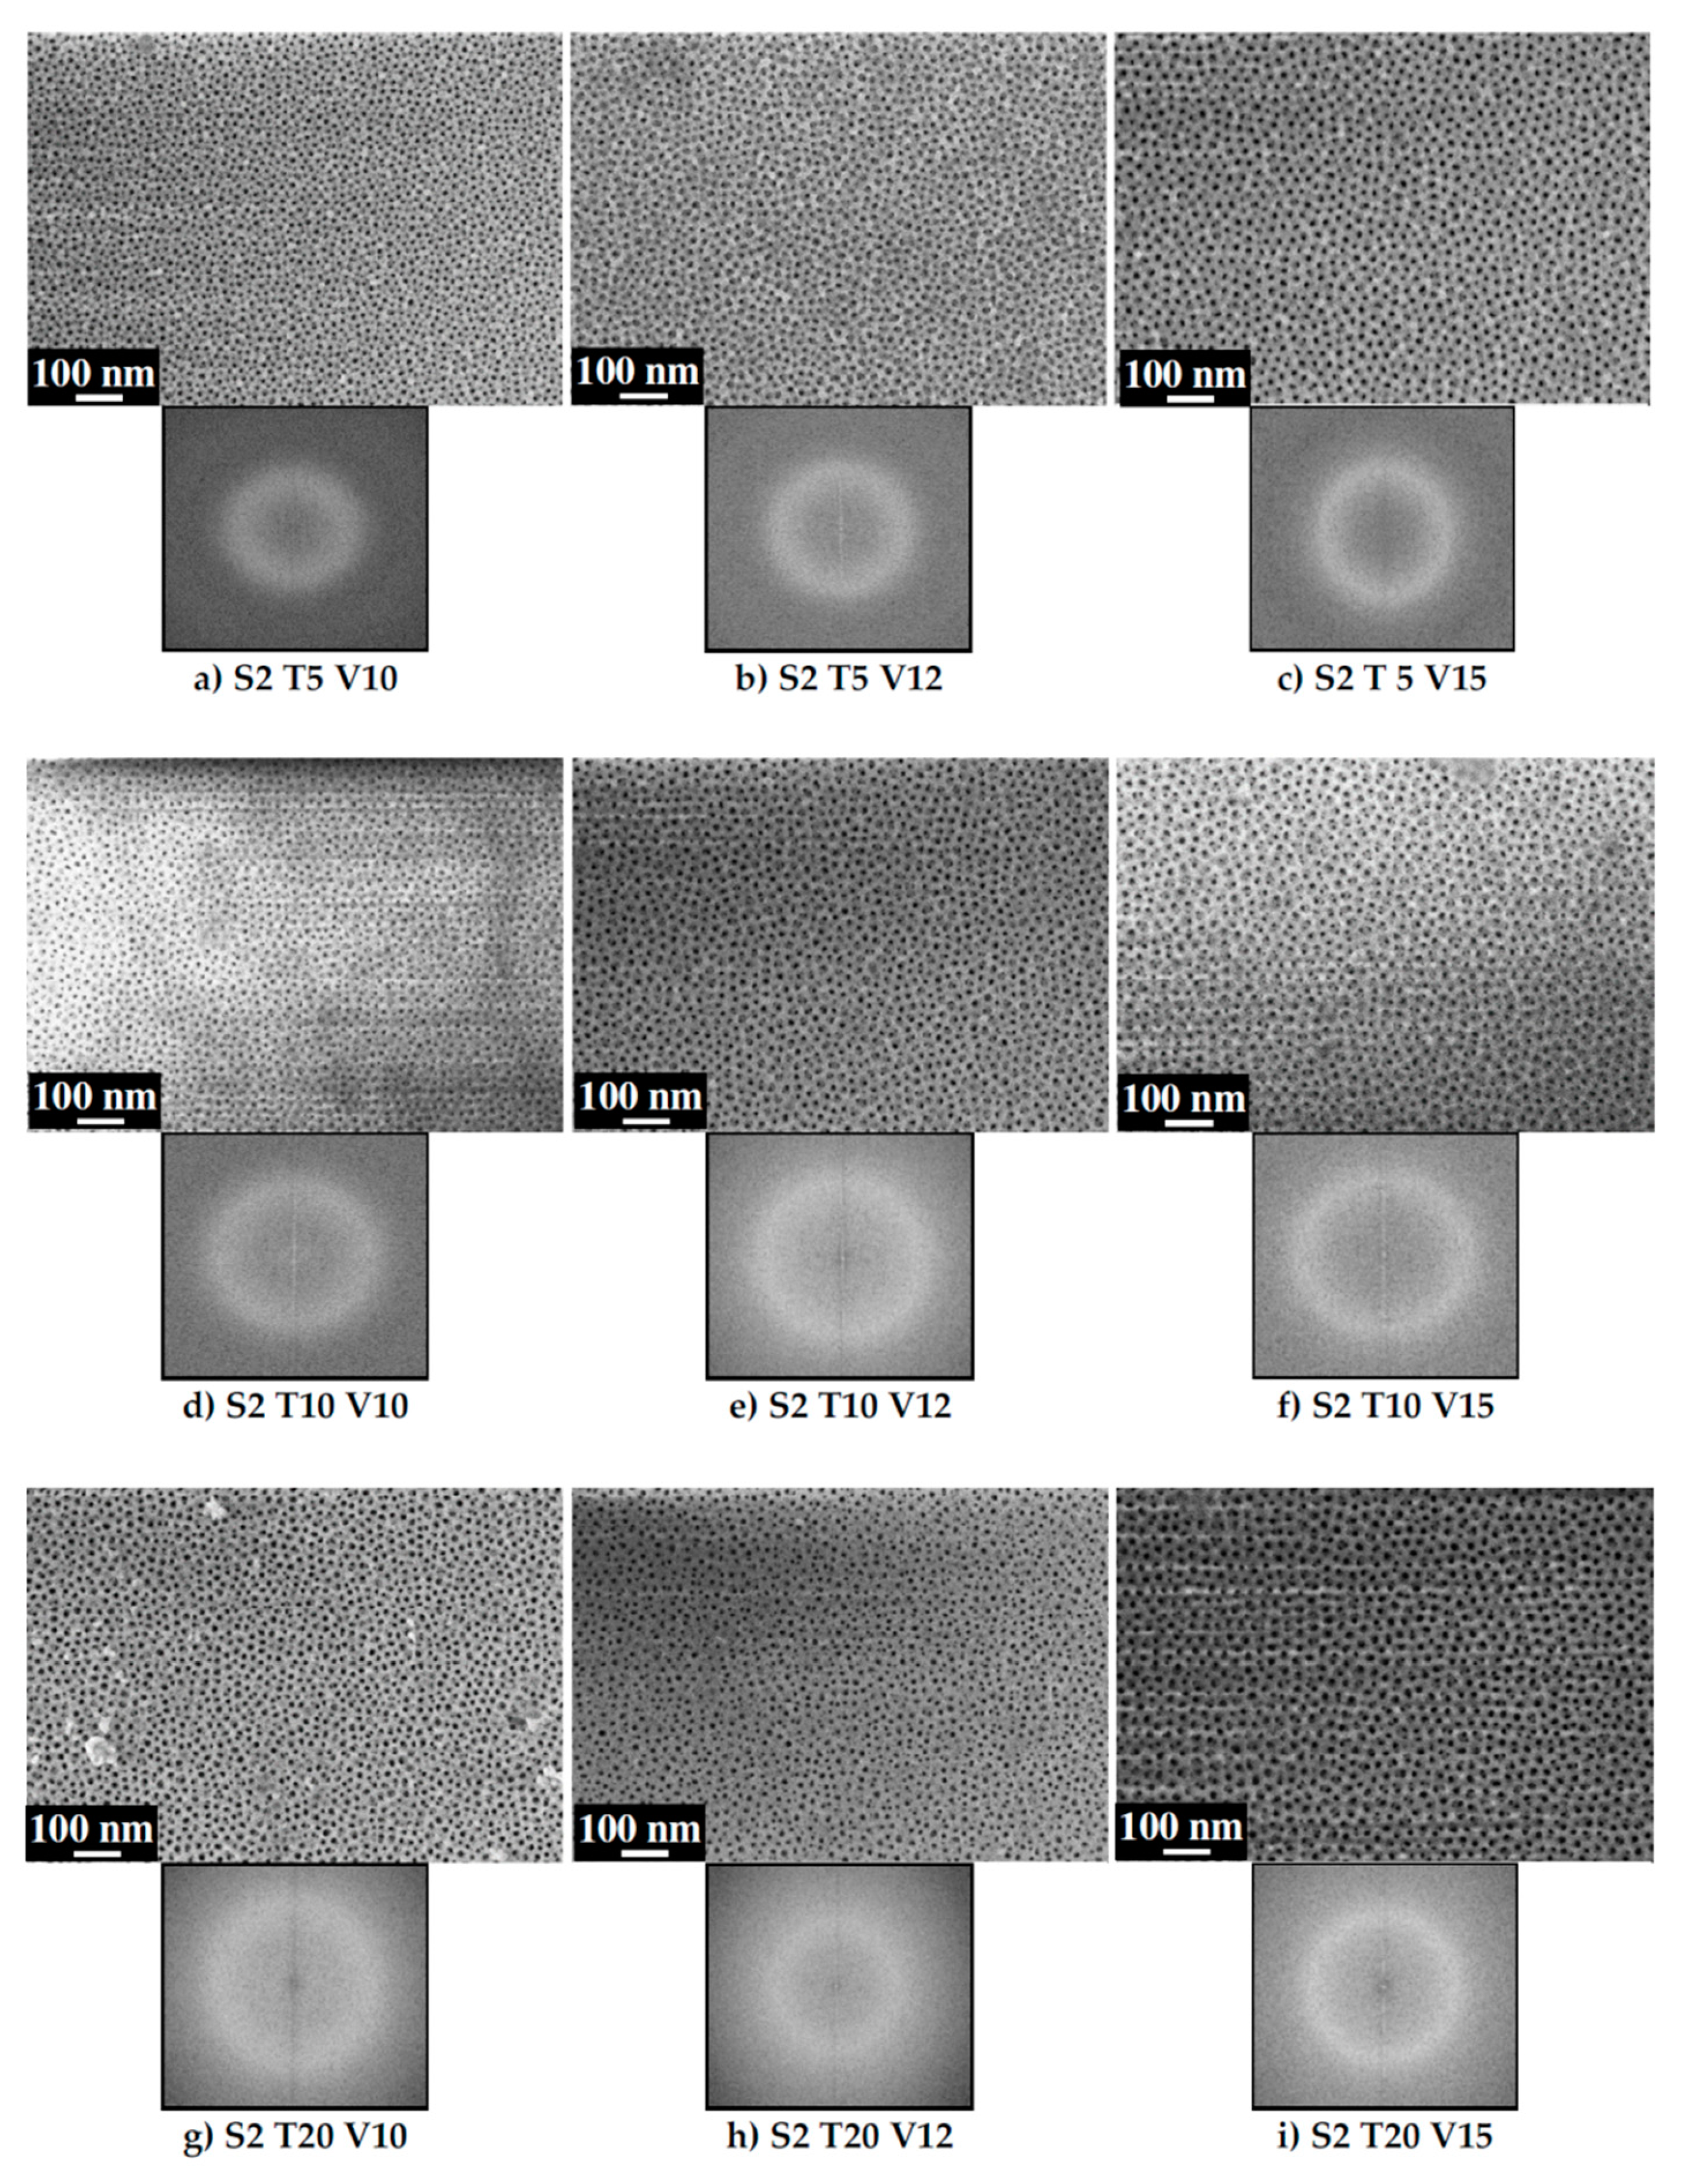
3.1. Ordering of the AAO Porous Film
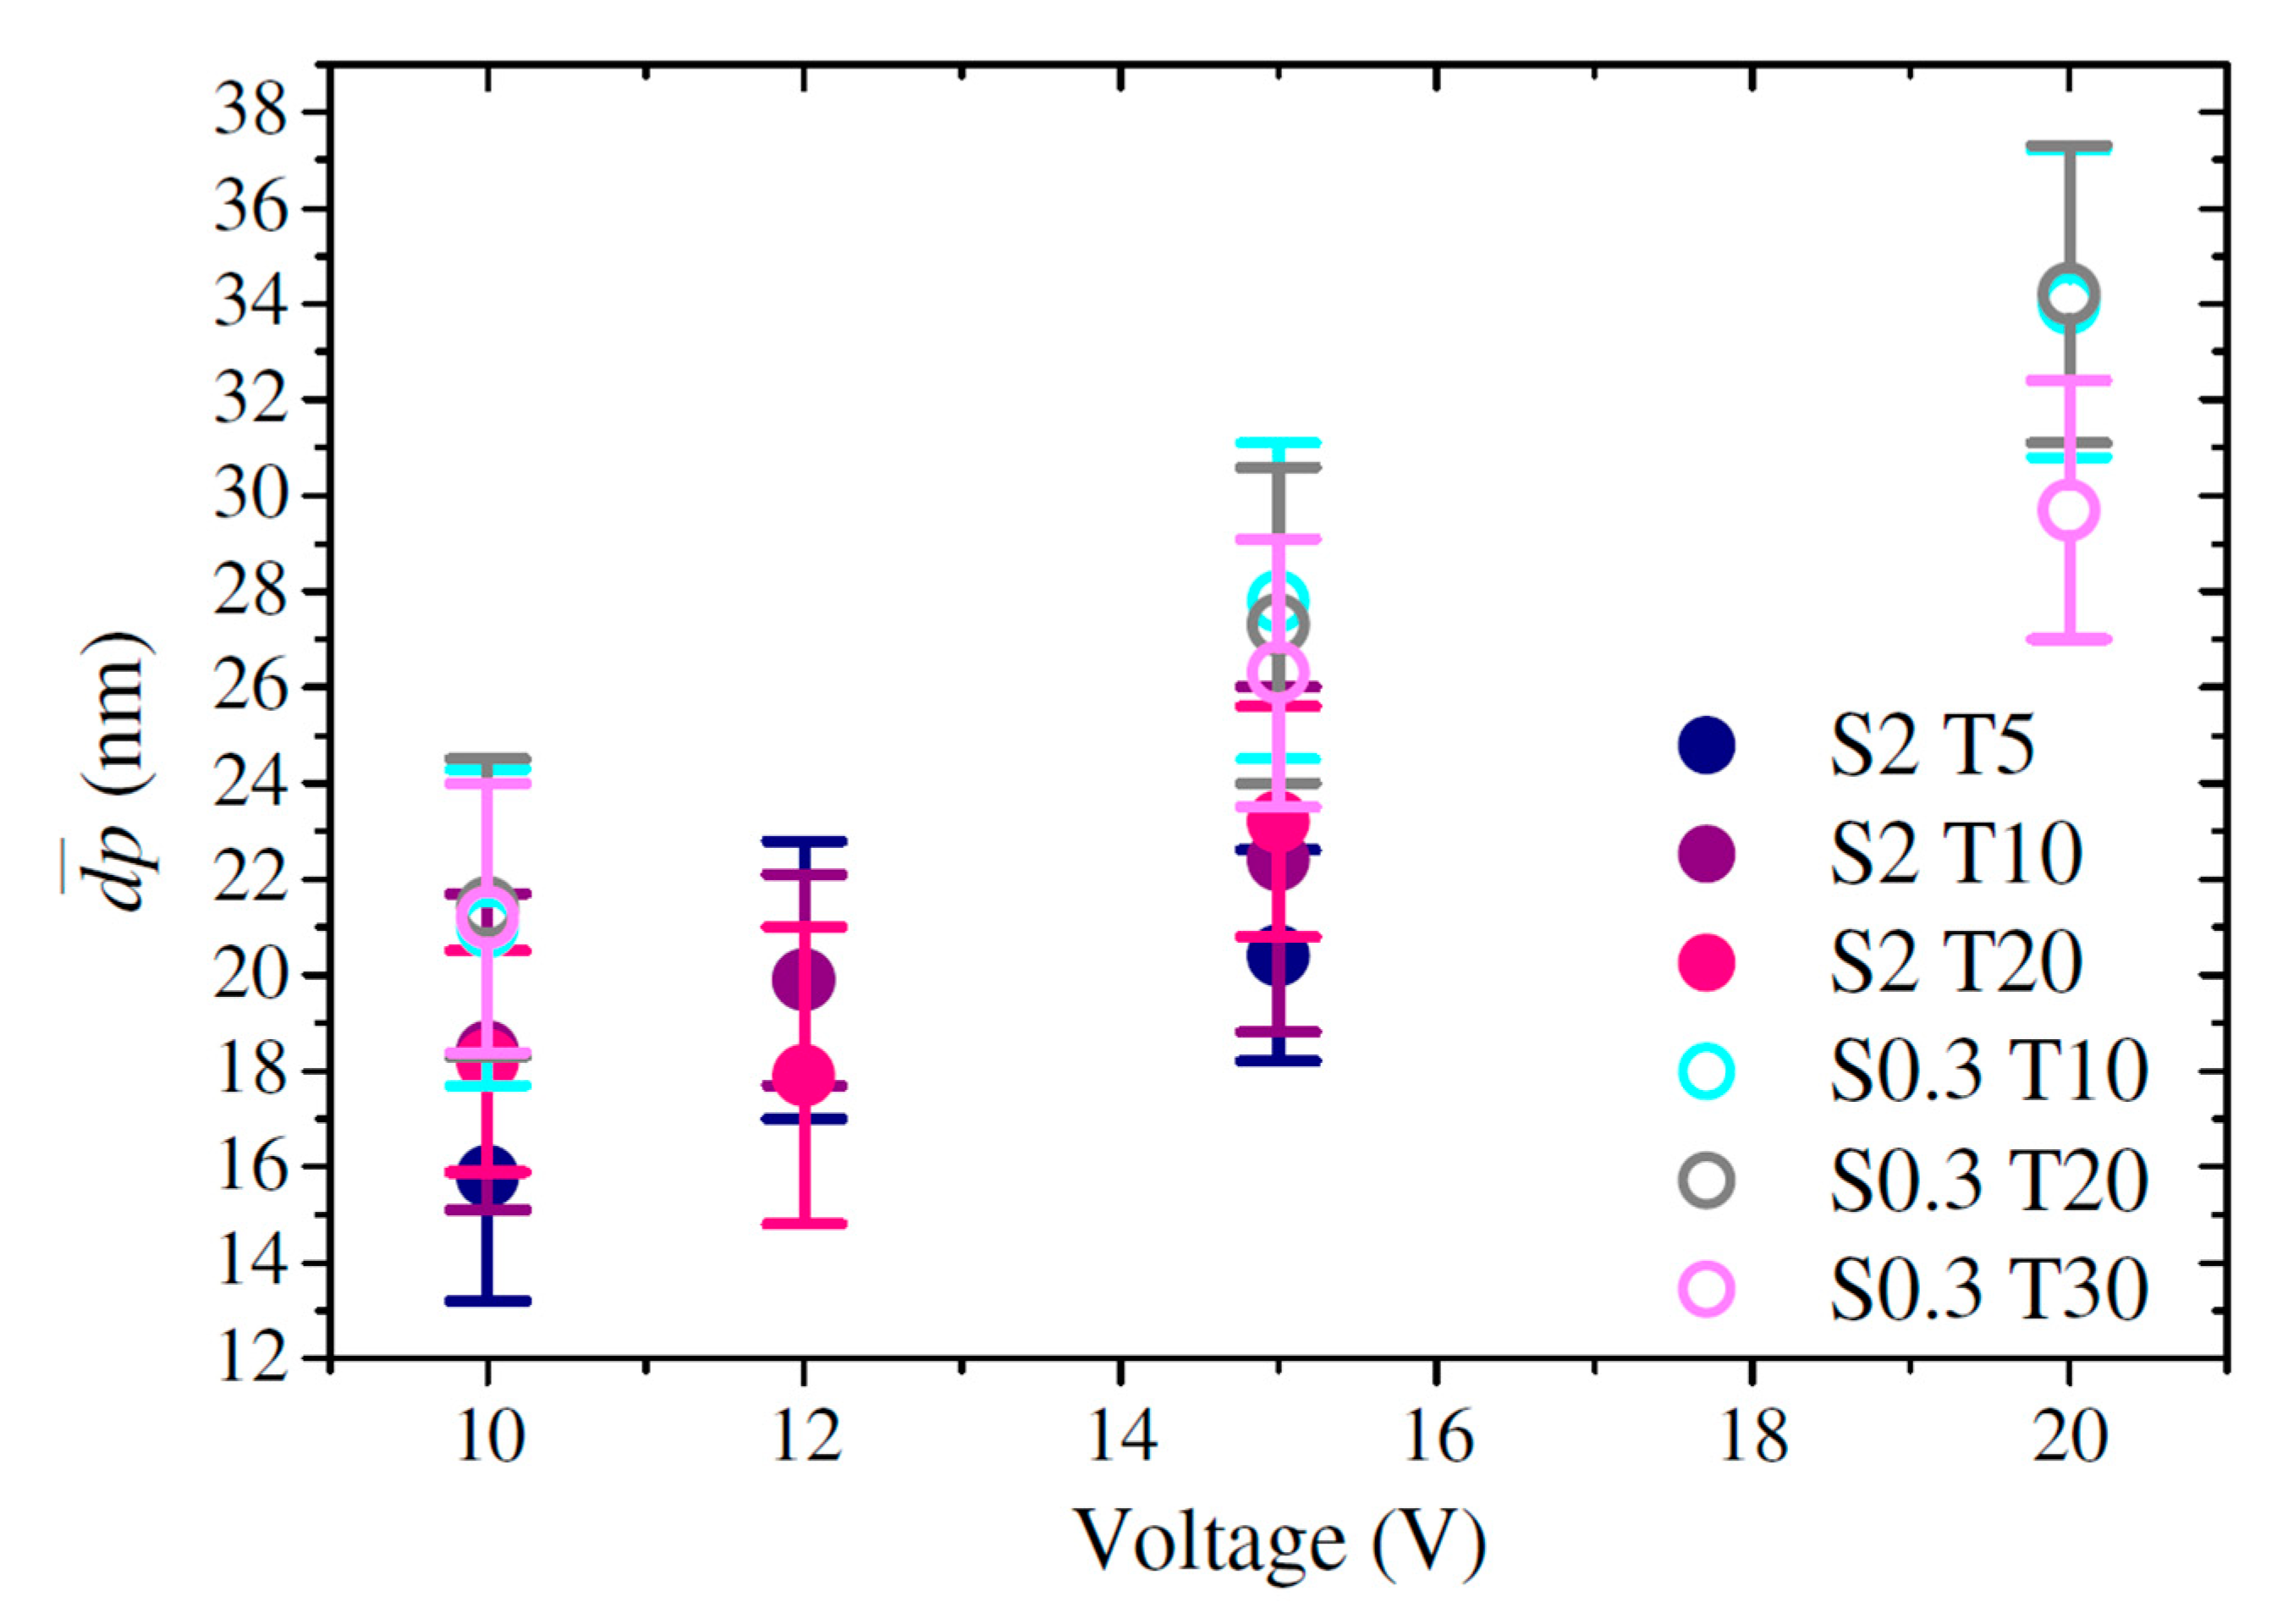
3.2. Pore Diameter
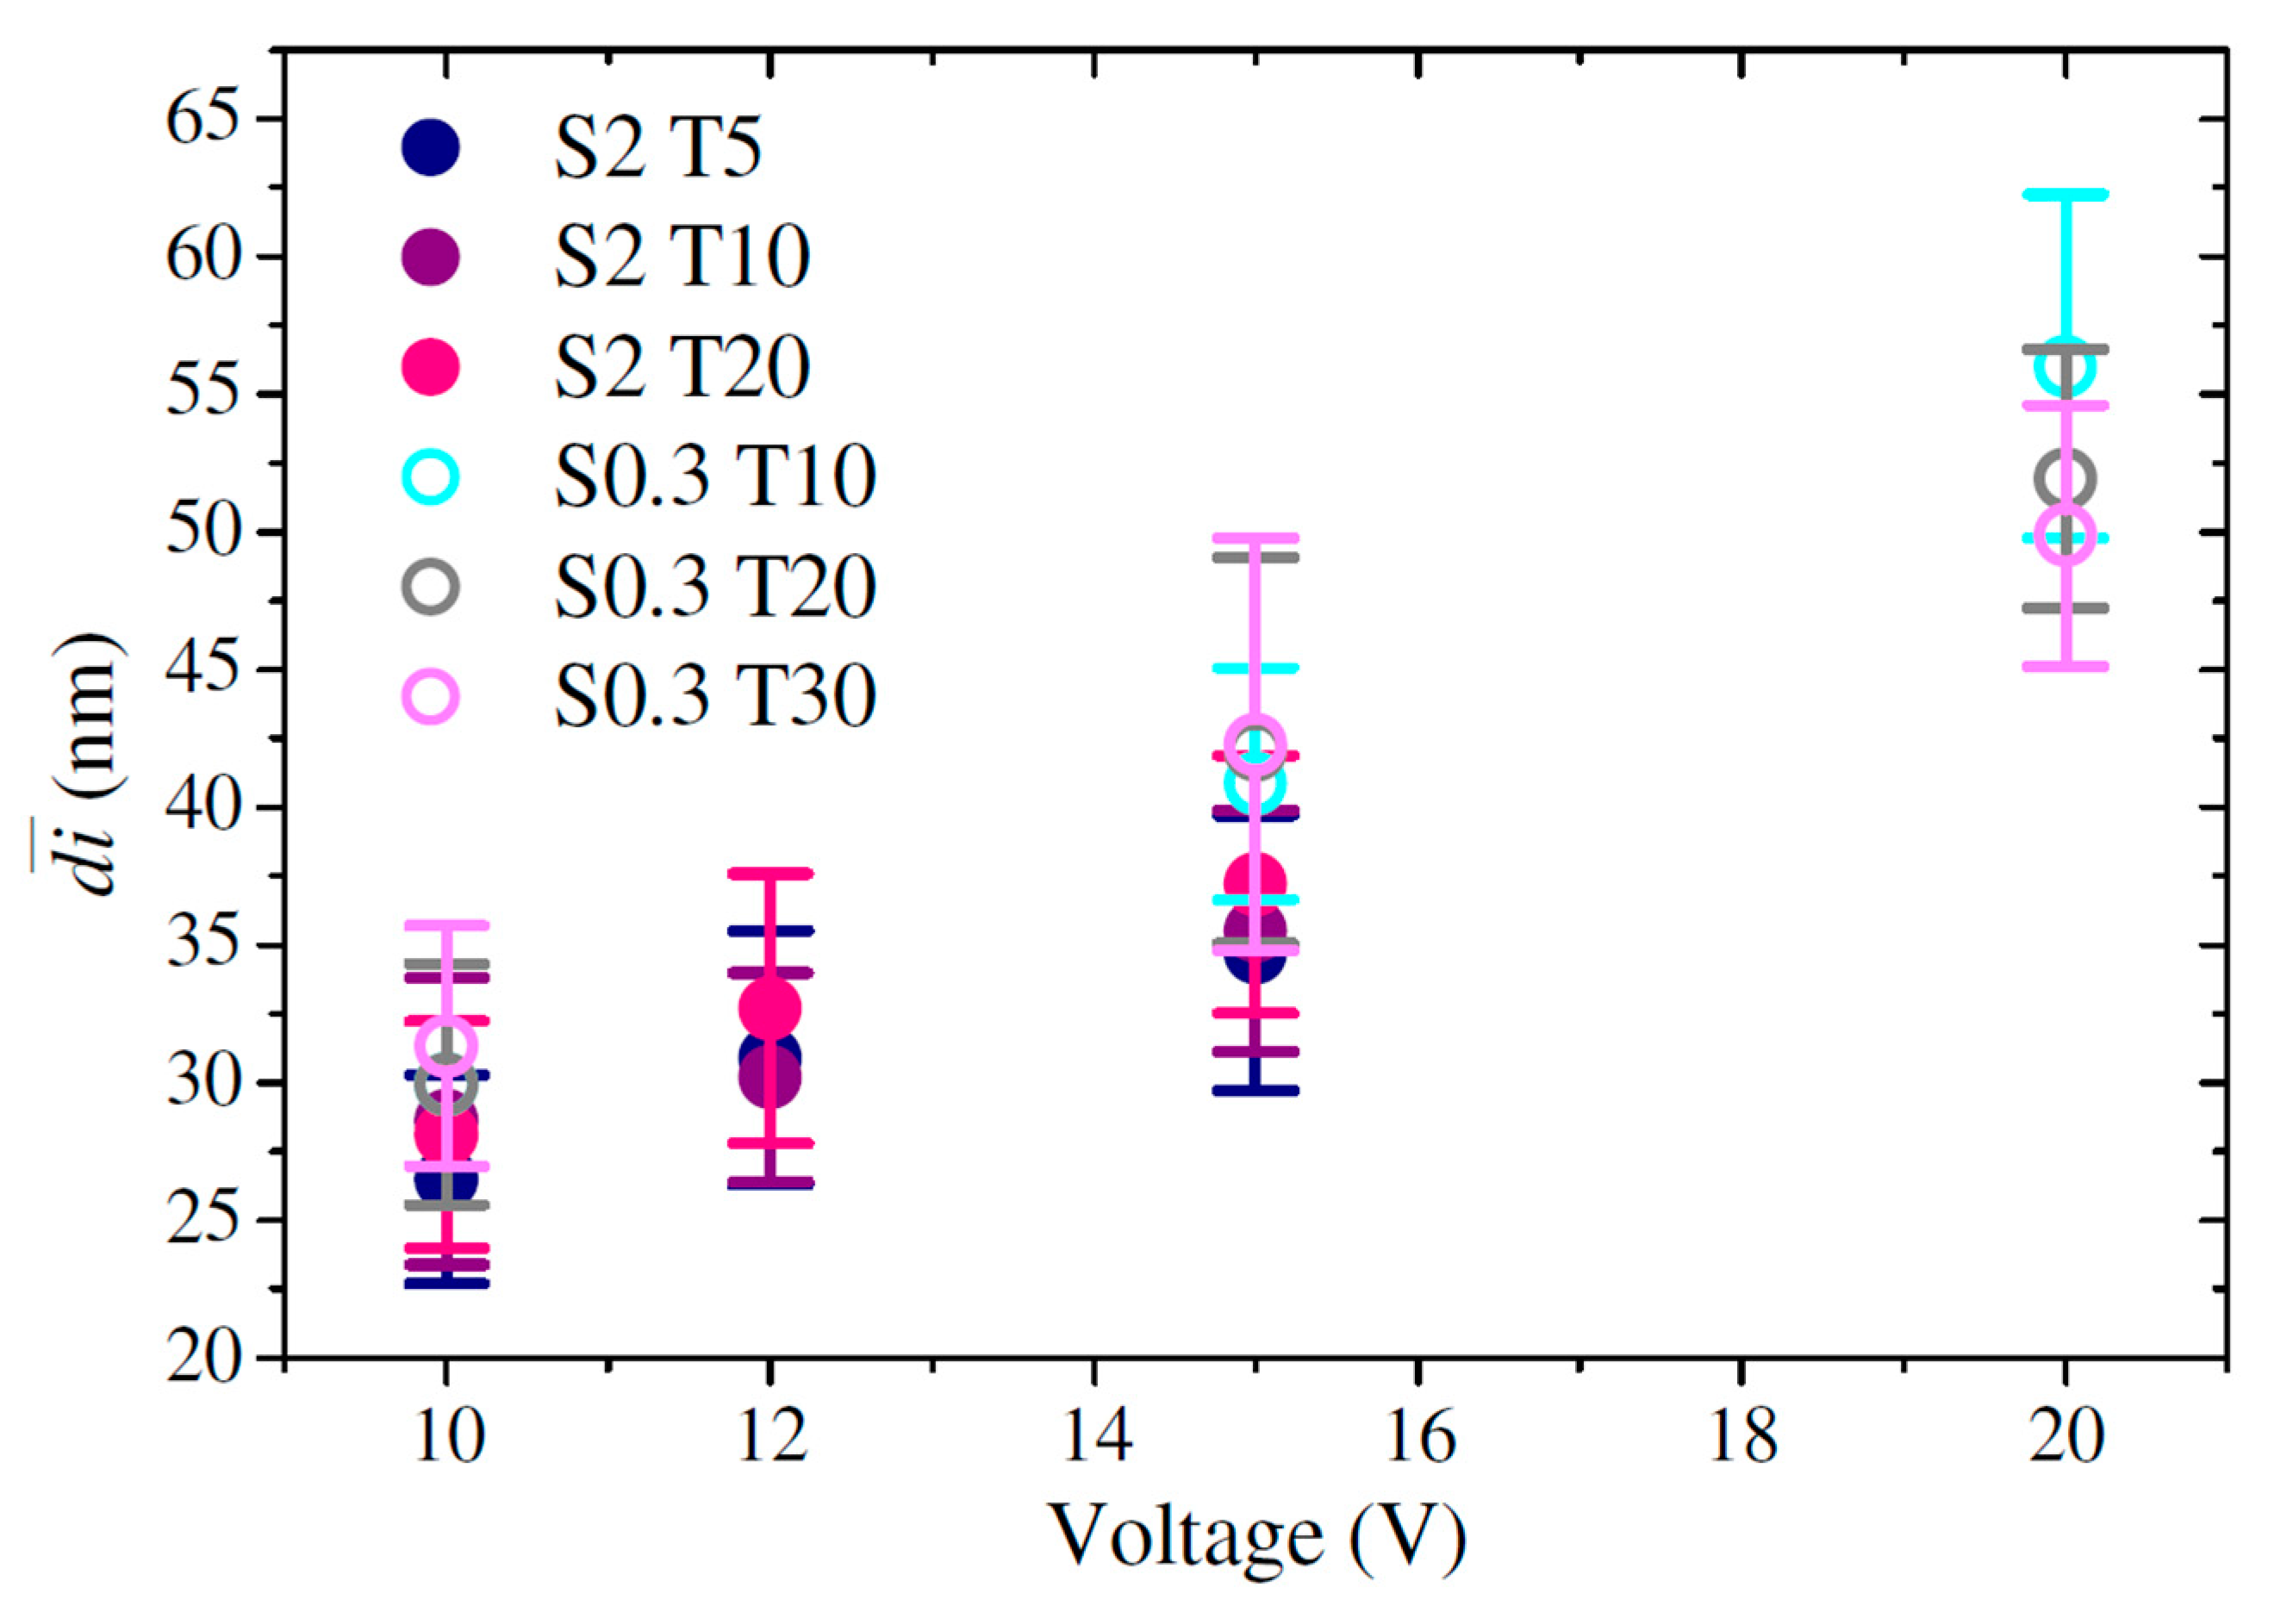
3.3. Interpore Distance
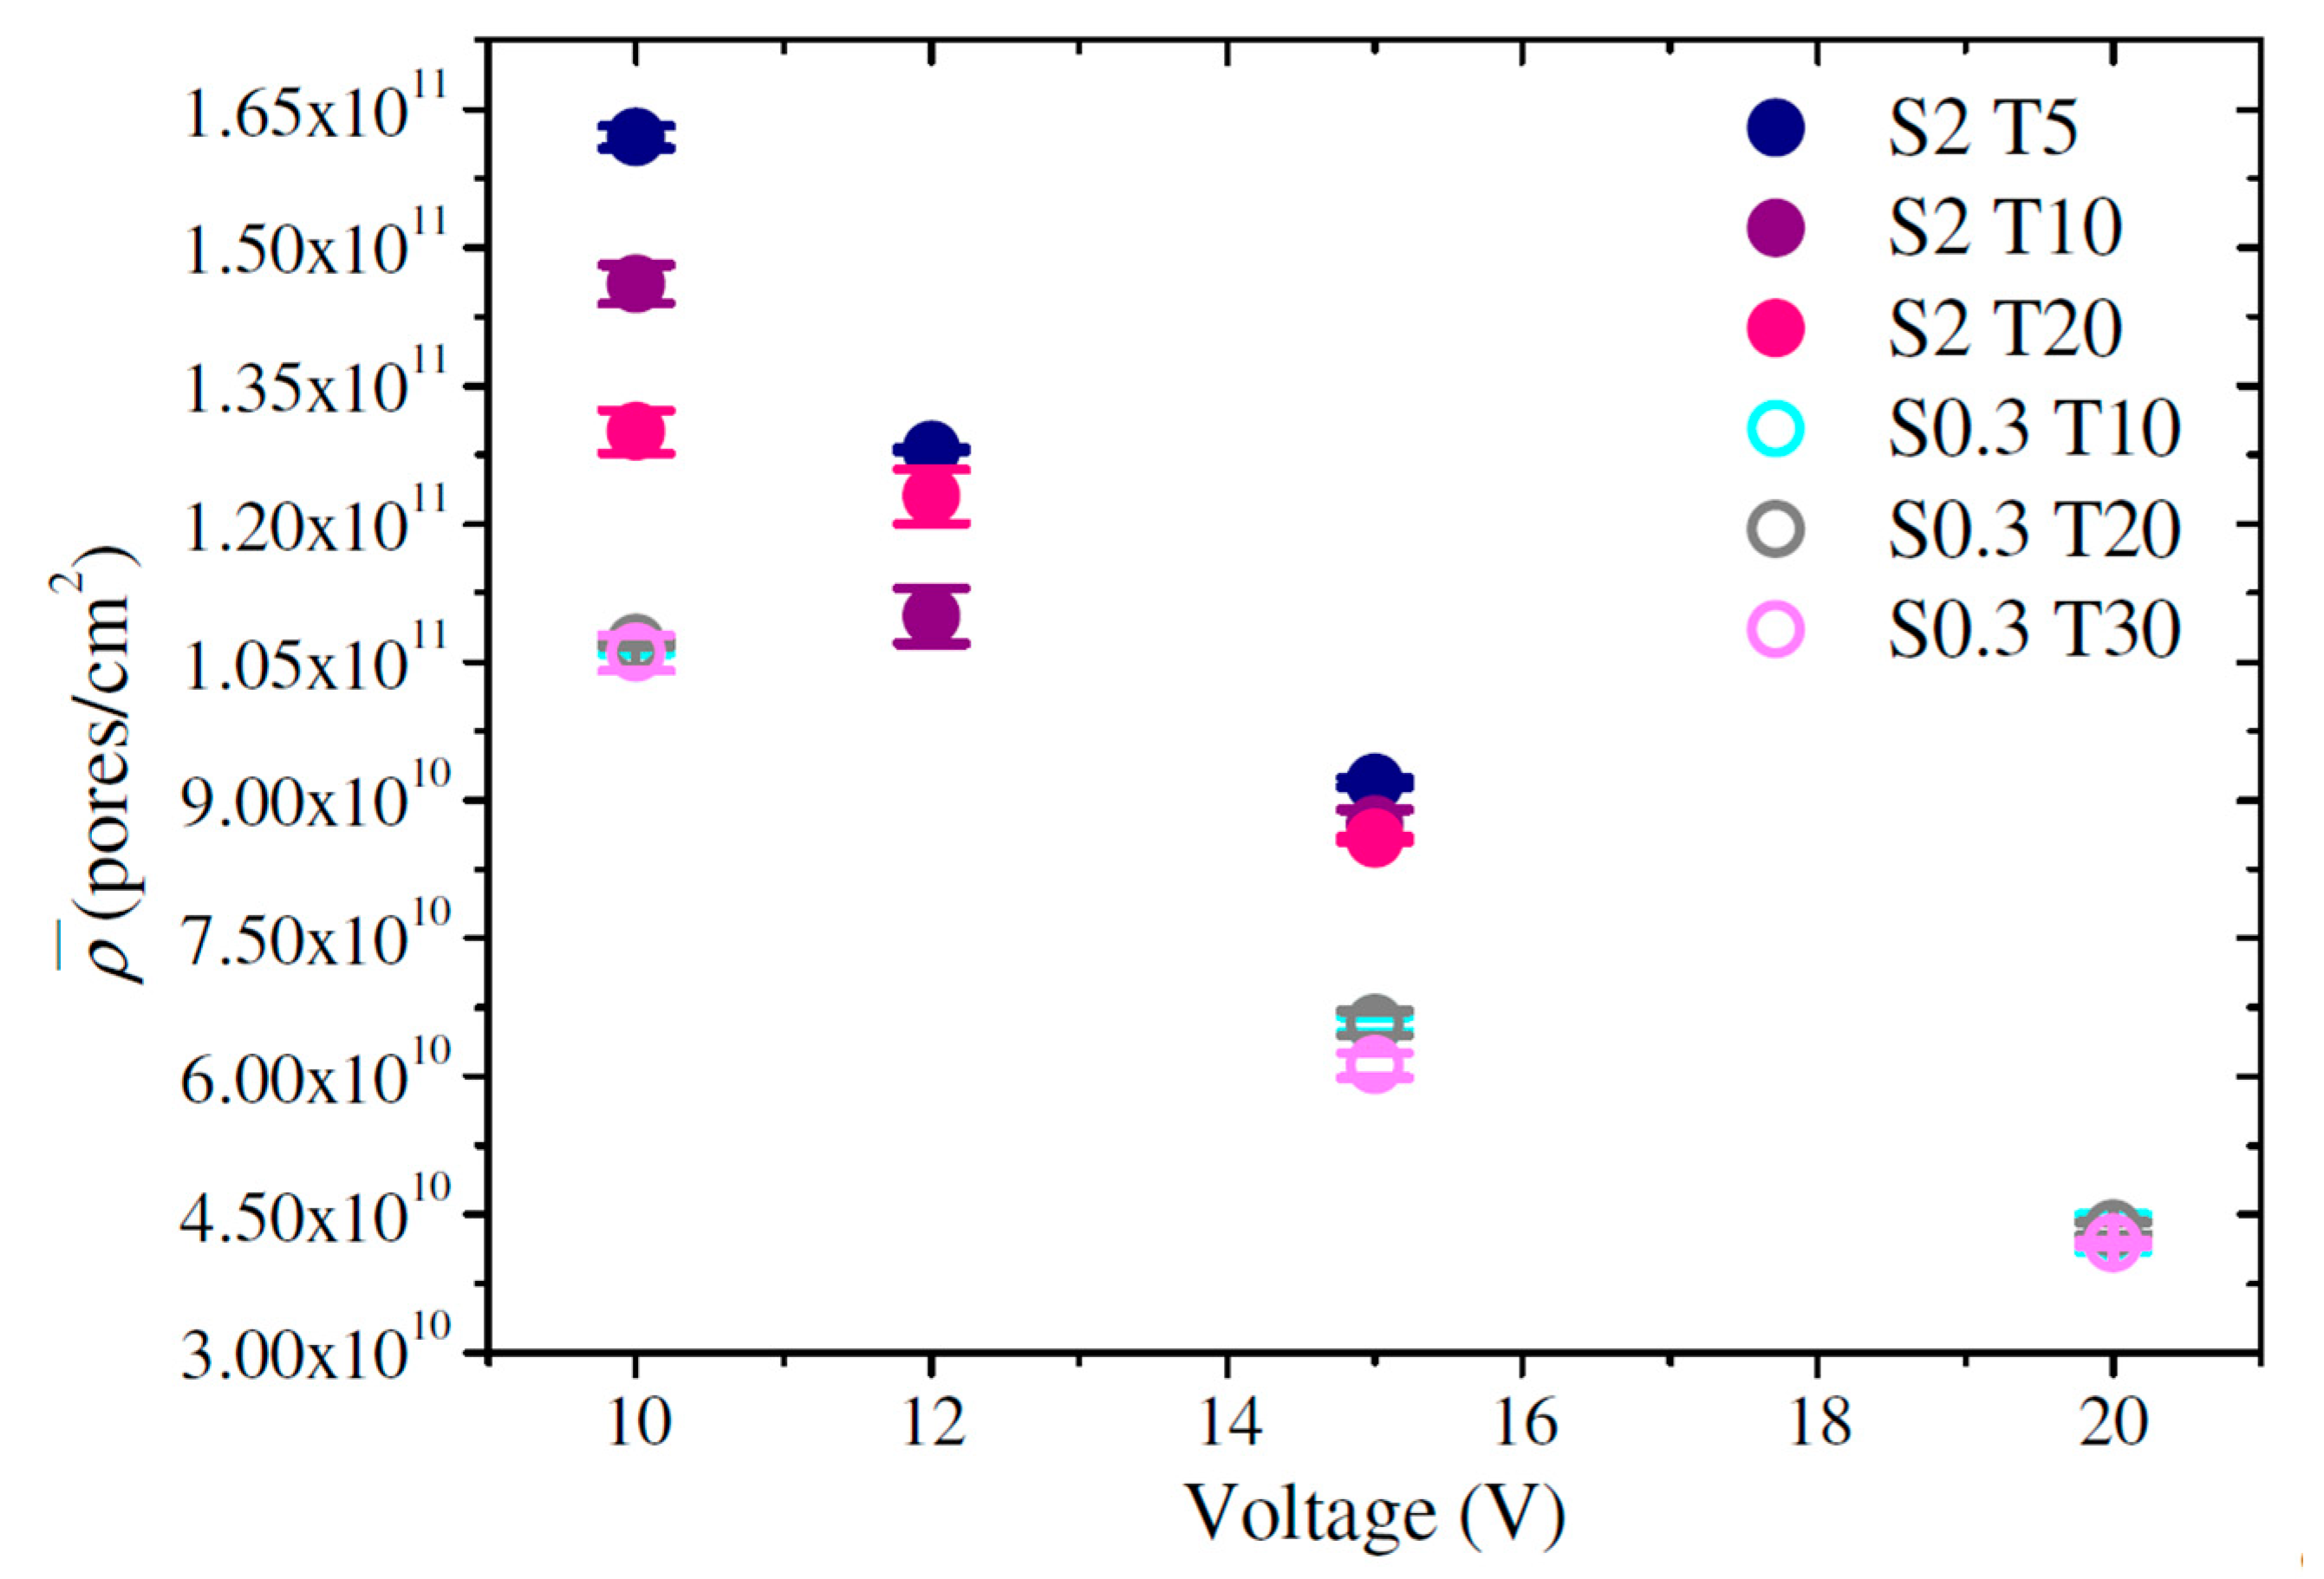
3.4. Pore Density
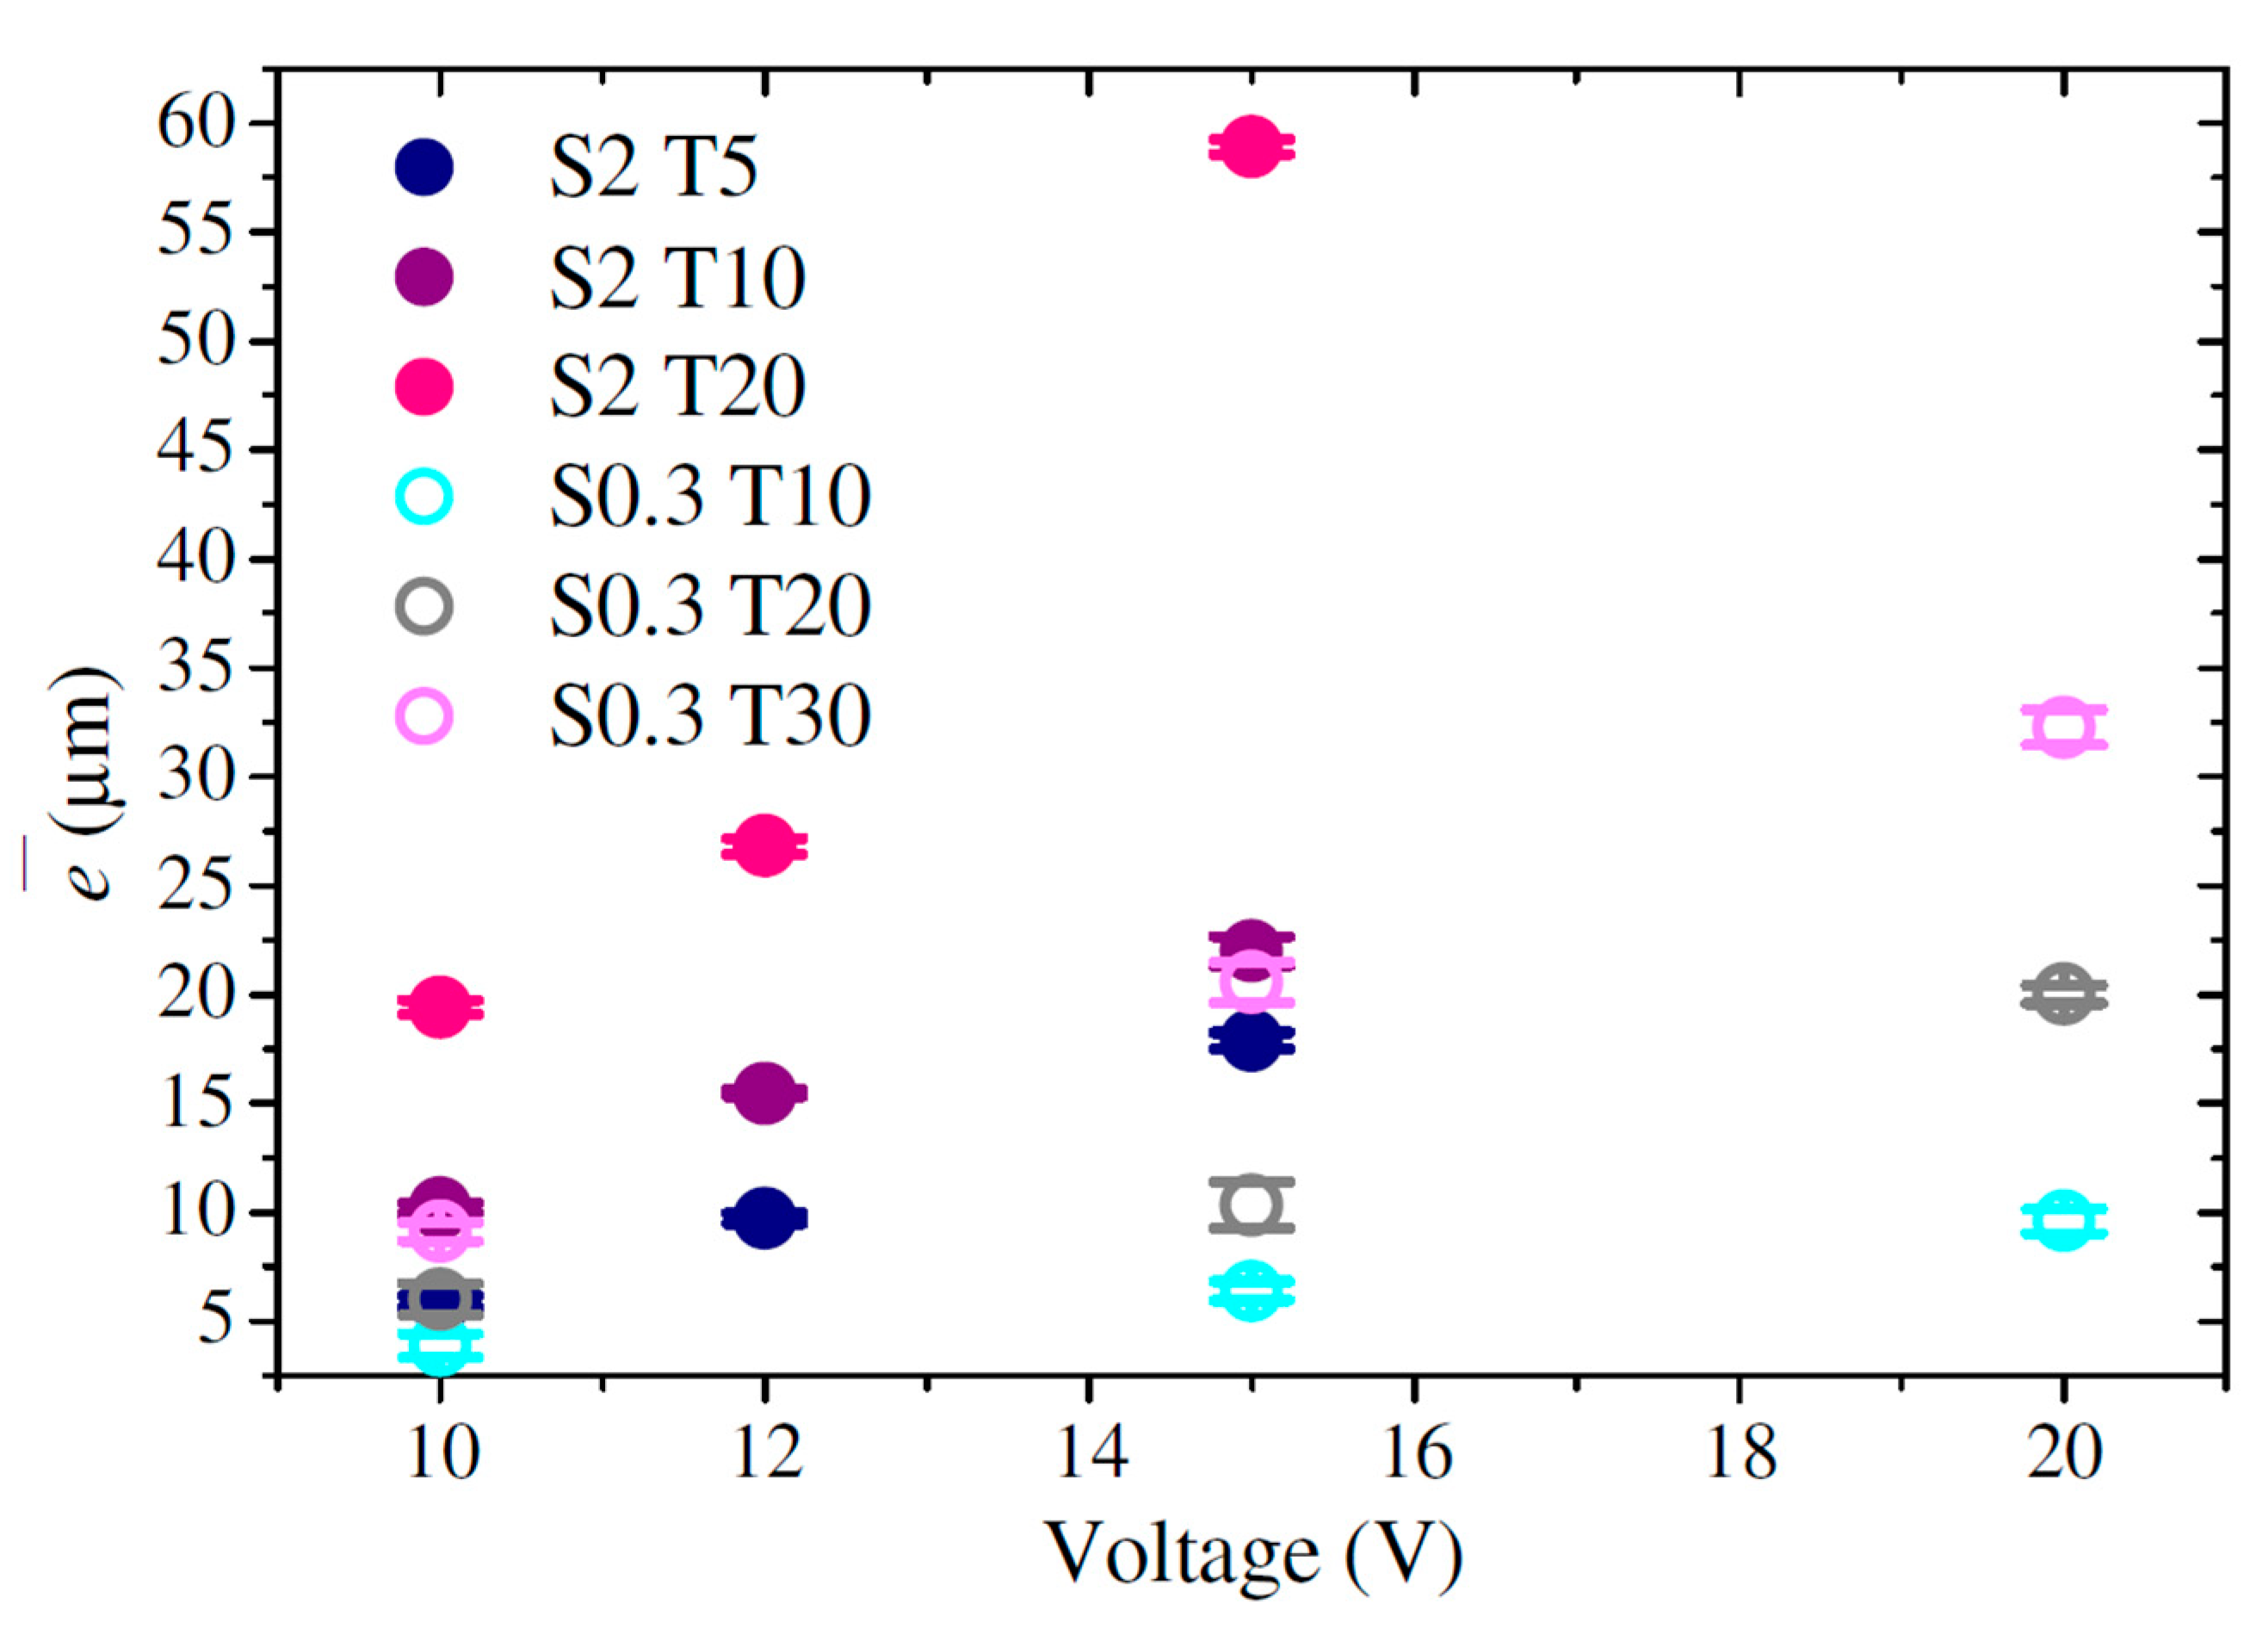
3.5. Thickness
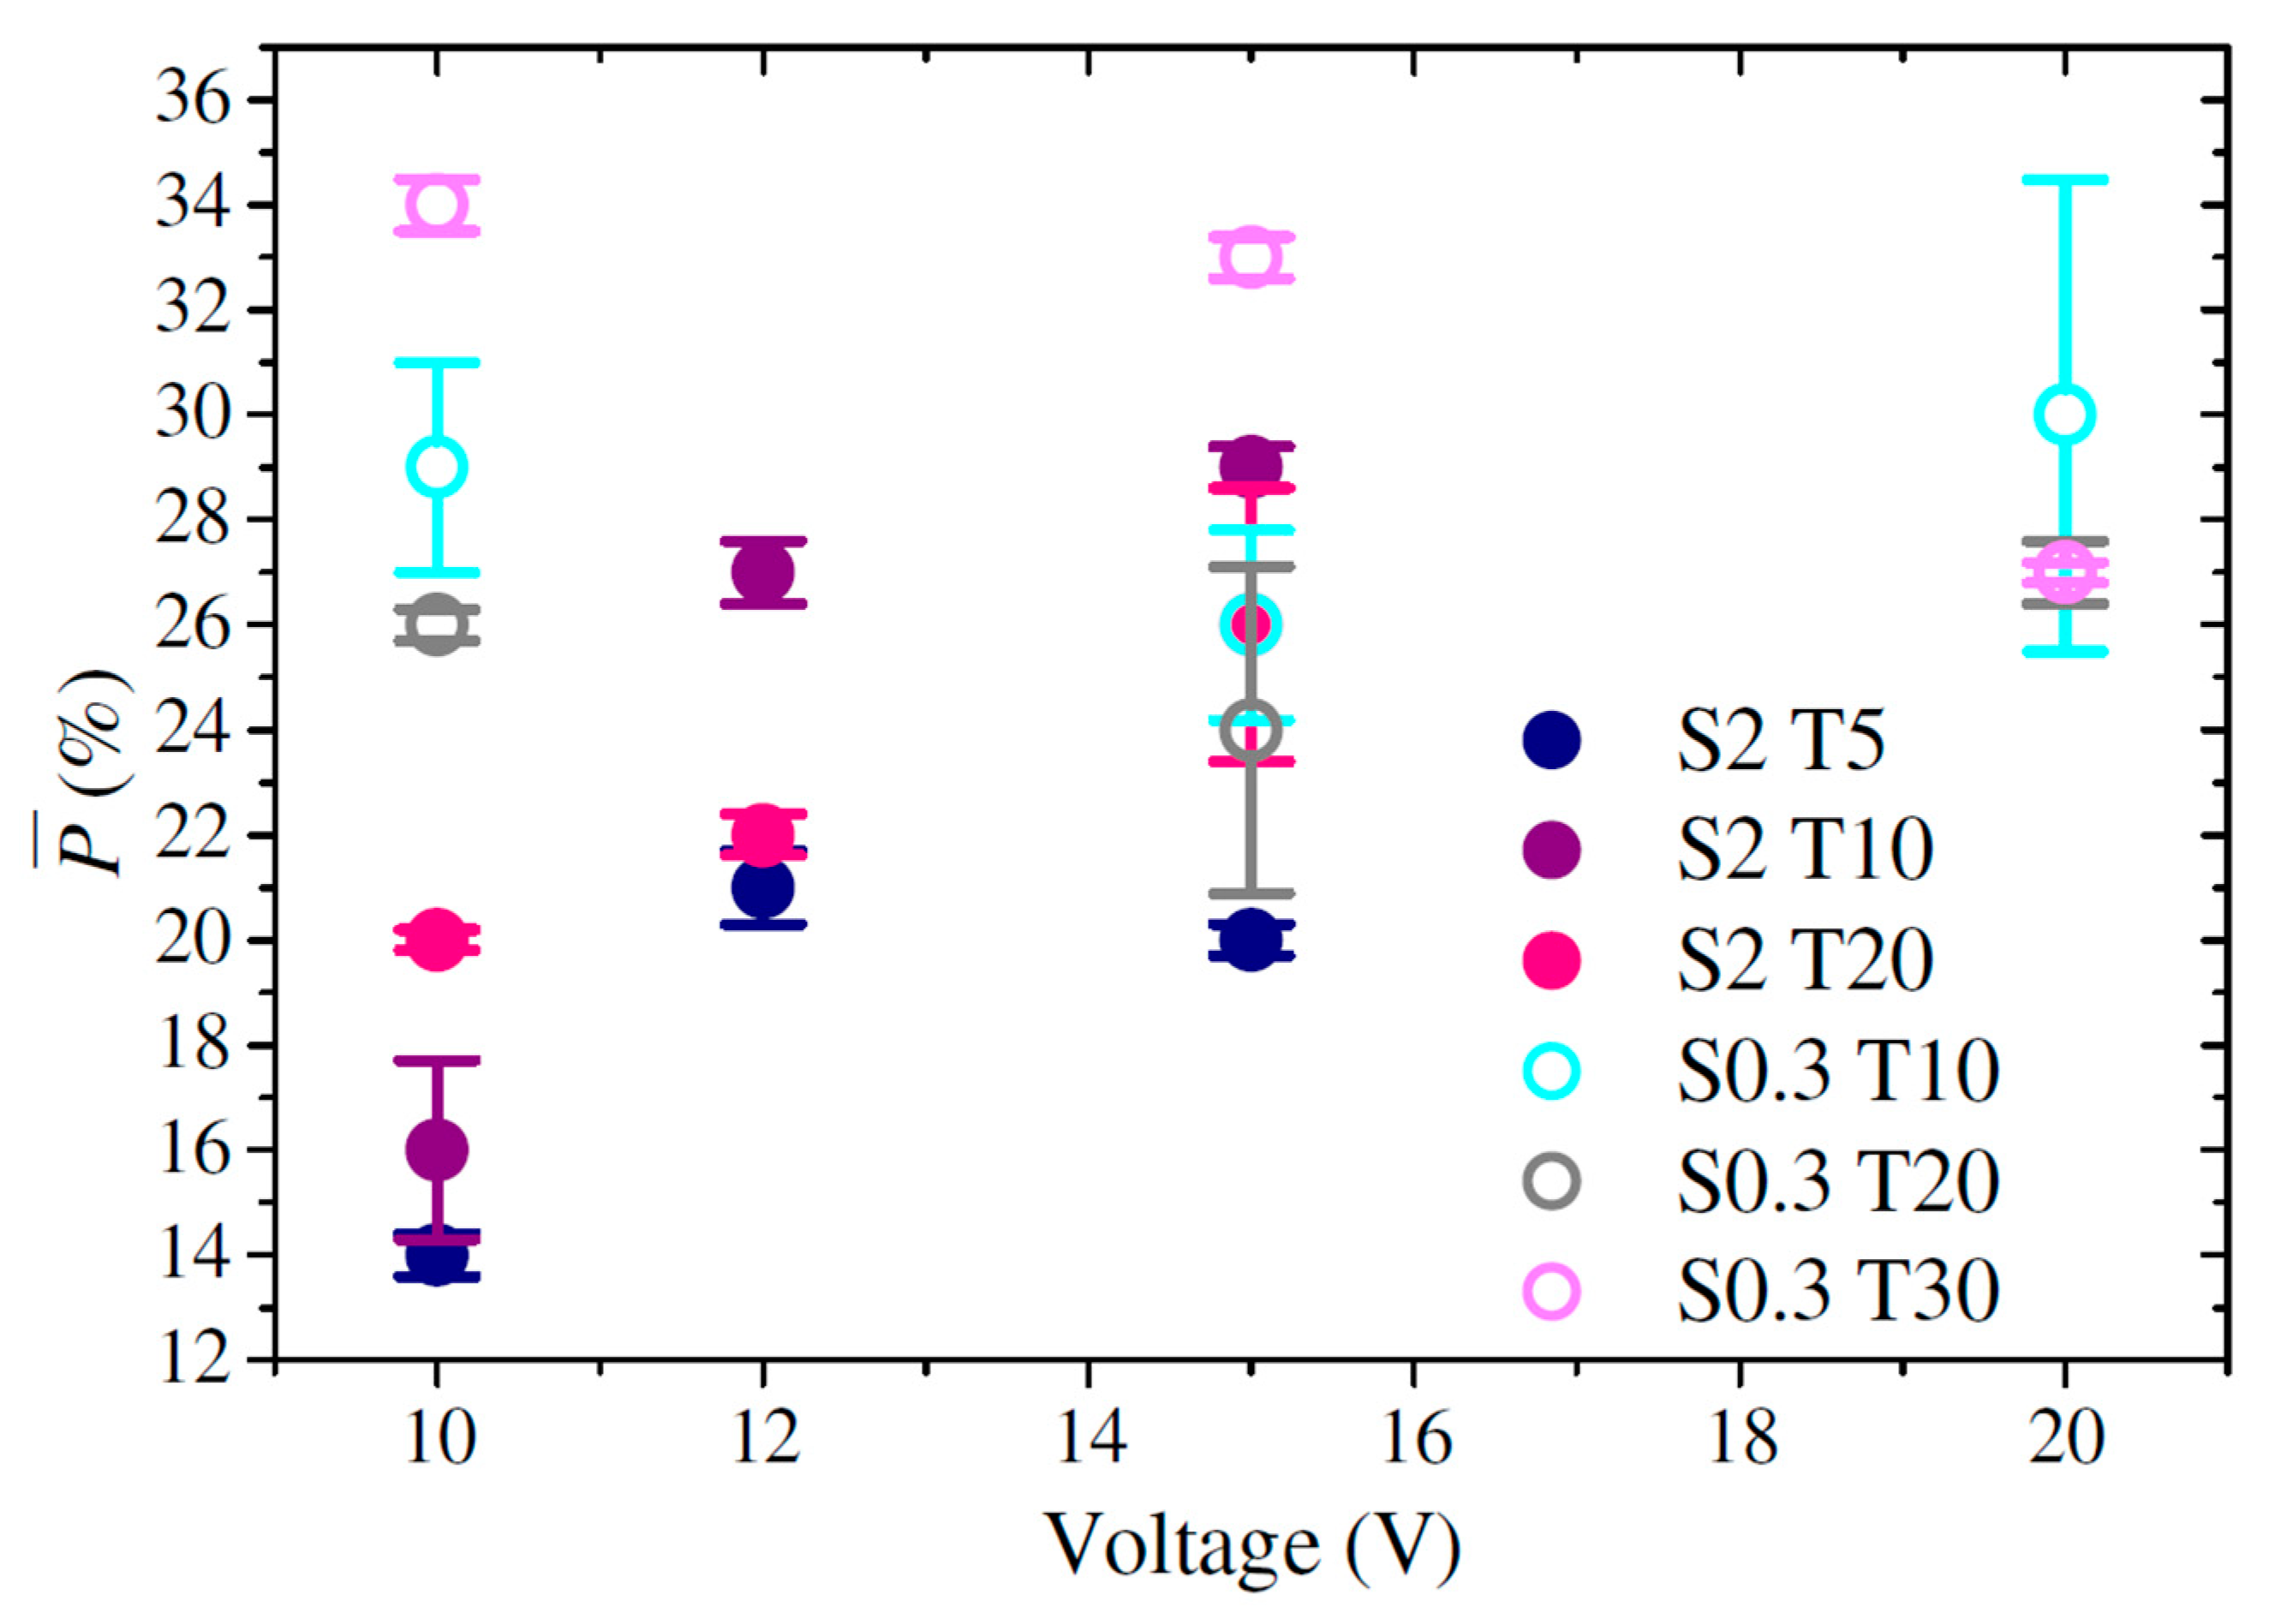
3.6. Porosity
4. Conclusions
Author Contributions
Funding
Institutional Review Board Statement
Informed Consent Statement
Data Availability Statement
Acknowledgments
Conflicts of Interest
References
- Sharma, V.P.; Sharma, U.; Chattopadhyay, M.; Shukla, V.N. Advance applications of nanomaterials: A review. Mater. Today-Proc. 2018, 5, 6376–6380. [Google Scholar] [CrossRef]
- Chu, S.Z.; Wada, K.; Inoue, S.; Isogai, M.; Yasumori, A. Fabrication of Ideally Ordered Nanoporous Alumina Films and Integrated Alumina Nanotubule Arrays by High-Field Anodization. Adv. Mater. 2005, 17, 2115–2119. [Google Scholar] [CrossRef]
- Jani, A.M.M.; Losic, D.; Voelcker, N.H. Nanoporous anodic aluminium oxide: Advances in surface engineering and emerging applications. Prog. Mater. Sci. 2013, 58, 636–704. [Google Scholar] [CrossRef]
- Tsangaraki-Kaplanoglou, I.; Theohari, S.; Dimogerontakis, T.; Wang, Y.M.; Kuo, H.H.; Kia, S. Effect of alloy types on the anodizing process of aluminum. Surf. Coat. Technol. 2006, 200, 2634–2641. [Google Scholar] [CrossRef]
- Santos, A.; Kumeria, T.; Losic, D. Nanoporous anodic aluminum oxide for chemical sensing and biosensors. Trends Anal. Chem. 2013, 44, 25–38. [Google Scholar] [CrossRef]
- Masuda, H.; Fukuda, K. Ordered metal nanohole arrays made by a two-step replication of honeycomb structures of anodic alumina. Science 1995, 268, 1466. [Google Scholar] [CrossRef] [PubMed]
- Sulka, G.D. Highly ordered anodic porous alumina formation by self-organized anodizing. In Nanostructured Materials in Electrochemistry; WILEY-VCH: Weinheim, Germany, 2008; Volume 1, pp. 1–11. [Google Scholar]
- Bai, A.; Hub, C.C.; Yang, Y.F.; Lin, C.C. Pore diameter control of anodic aluminum oxide with ordered array of nanopores. Electrochim. Acta 2008, 53, 2258–2264. [Google Scholar] [CrossRef]
- Chi, C.S.; Lee, J.H.; Kim, I.; Oh, H.J. Effects of microstructure of aluminum substrate on ordered nanopore arrays in anodic alumina. J. Mater. Sci. Technol. 2015, 31, 751–758. [Google Scholar] [CrossRef]
- Poinern, G.E.J.; Ali, N.; Fawcett, D. Progress in nano-engineered anodic aluminum oxide membrane development. Materials 2011, 4, 487–526. [Google Scholar] [CrossRef]
- Bruera, F.A.; Kramer, G.R.; Vera, M.L.; Ares, A.E. Synthesis and Morphological Characterization of Nanoporous Aluminum Oxide Films by Using a Single Anodization Step. Coatings 2019, 9, 115. [Google Scholar] [CrossRef]
- Montero-Moreno, J.M.; Sarret, M.; Müller, C. Influence of the aluminum surface on the final results of a two-step anodizing. Surf. Coat. Technol. 2007, 201, 6352–6357. [Google Scholar] [CrossRef]
- Wu, M.T.; Leu, I.C.; Hon, M.H. Effect of polishing pretreatment on the fabrication of ordered nanopore arrays on aluminum foils by anodization. J. Vac. Sci. Technol. B Microelectron. Nanometer Struct. Process. Meas. Phenom. 2002, 20, 776–782. [Google Scholar] [CrossRef]
- Wu, M.T.; Leu, I.C.; Hon, M.H. Growth characteristics of oxide during prolonged anodization of aluminum in preparing ordered nanopore arrays. J. Vac. Sci. Technol. B Microelectron. Nanometer Struct. Process. Meas. Phenom. 2004, 22, 2326–2332. [Google Scholar] [CrossRef]
- Bruera, F.A.; Kramer, G.R.; Vera, M.L.; Ares, A.E. Evaluation of surface pretreatment stages of Al 1050 to obtain nanostructured anodic films. Superlattices Microstruct. 2019, 130, 103–116. [Google Scholar] [CrossRef]
- Stępniowski, W.J.; Nowak-Stępniowska, A.; Presz, A.; Czujko, T.; Varin, R.A. The effects of time and temperature on the arrangement of anodic aluminum oxide nanopores. Mater. Charact. 2014, 91, 1–9. [Google Scholar] [CrossRef]
- Sulka, G.D.; Stepniowski, W.J. Structural features of self-organized nanopore arrays formed by anodization of aluminum in oxalic acid at relatively high temperatures. Electrochim. Acta 2009, 54, 3683–3691. [Google Scholar] [CrossRef]
- Li, A.P.; Müller, F.; Birner, A.; Nielsch, K.; Gösele, U. Fabrication and microstructuring of hexagonally ordered two-dimensional nanopore arrays in anodic alumina. Adv. Mater. 1999, 11, 483–487. [Google Scholar] [CrossRef]
- Masuda, H. Self-Ordering of Cell Arrangement of Anodic Porous Alumina Formed in Sulfuric Acid Solution. J. Electrochem. Soc. 1997, 144, L127. [Google Scholar] [CrossRef]
- Kashi, M.A.; Ramazani, A. The effect of temperature and concentration on the self-organized pore formation in anodic alumina. J. Phys. D Appl. Phys. 2005, 38, 2396. [Google Scholar] [CrossRef]
- Jessensky, O.; Müller, F.; Gösele, U. Self-organized formation of hexagonal pore arrays in anodic alumina. Appl. Phys. Lett. 1998, 72, 1173–1175. [Google Scholar] [CrossRef]
- Nasirpouri, F.; Abdollahzadeh, M.; Almasi, M.J.; Parvini-Ahmadi, N. A comparison between self-ordering of nanopores in aluminium oxide films achieved by two- and three-step anodic oxidation. Curr. Appl. Phys. 2009, 9, S91–S94. [Google Scholar] [CrossRef]
- Han, X.Y.; Shen, W.Z. Improved two-step anodization technique for ordered porous anodic aluminum membranes. J. Electroanal. Chem. 2011, 655, 56–64. [Google Scholar] [CrossRef]
- Hurtado, M.J.; Capitán, M.J.; Alvarez, J.; Fatás, E.; Herrasti, P. The Anodic Oxidation of Aluminum: Fabrication and Characterization. Port. Electrochim. Acta 2007, 25, 153–162. [Google Scholar] [CrossRef]
- Na, H.C.; Sung, T.J.; Yoon, S.H.; Hyun, S.K.; Kim, M.S.; Lee, Y.G.; Shin, S.H.; Choi, S.M.; Yi, S. Formation of unidirectional nanoporous structures in thickly anodized aluminum oxide layer. Trans. Nonferr. Met. Soc. China 2009, 19, 1013–1017. [Google Scholar] [CrossRef]
- Pardo-Saavedra, D.C.; Londoño-Calderón, C.L.; Menchaca-Nal, S.; Pampillo, L.G.; Martínez García, R.; Socolovsky, L.M. Morfological study of pore widening process in anodized alumina films. Anal. AFA 2013, 25, 68–71. [Google Scholar] [CrossRef]
- Zaraska, L.; Sulka, G.D.; Szeremeta, J.; Jaskuła, M. Porous anodic alumina formed by anodization of aluminum alloy (AA1050) and high purity aluminum. Electrochim. Acta 2010, 55, 4377–4386. [Google Scholar] [CrossRef]
- Londoño Calderón, C.L.; Menchaca Nal, S.; Pardo Saavedra, D.C.; Silveyra, J.; Socolovsky, L.M.; Pampillo, L.G.; Martínez García, R. Low cost fabrication of porous anodic alumina: A comparative study of the morphology produced by one- and two-steps of anodization. Matéria 2016, 21, 677–690. [Google Scholar]
- Bruera, F.A.; Kramer, G.R.; Vera, M.L.; Ares, A.E. Evaluation of the influence of synthesis conditions on the morphology of nanostructured anodic aluminum oxide coatings on Al 1050. Surf. Interfaces 2020, 18, 100448. [Google Scholar] [CrossRef]
- Belwalkar, A.; Grasing, E.; Van Geertruyden, W.; Huang, Z.; Misiolek, W.Z. Effect of processing parameters on pore structure and thickness of anodic aluminum oxide (AAO) tubular membranes. J. Membr. Sci. 2008, 319, 192–198. [Google Scholar] [CrossRef] [PubMed]
- Sulka, G.D.; Parkoła, K.G. Temperature influence on well-ordered nanopore structures grown by anodization of aluminium in sulphuric acid. Electrochim. Acta 2007, 52, 1880–1888. [Google Scholar] [CrossRef]
- Vojkuvka, L.; Marsal, L.F.; Ferré-Borrull, J.; Formentin, P.; Pallarés, J. Self-ordered porous alumina membranes with large lattice constant fabricated by hard anodization. Superlattices Microstruct. 2008, 44, 577–582. [Google Scholar] [CrossRef]
- Schneider, C.A.; Rasband, W.S.; Eliceiri, K.W. NIH Image to ImageJ: 25 years of image analysis. Nat. Methods 2012, 9, 671–675. [Google Scholar] [CrossRef] [PubMed]
- Sulka, G.D.; Parkoła, K.G. Anodising potential influence on well-ordered nanostructures formed by anodisation of aluminium in sulphuric acid. Thin Solid Films 2006, 515, 338–345. [Google Scholar] [CrossRef]
- O’Sullivan, J.P.; Wood, G.C. The Morphology and Mechanism of Formation of Porous Anodic Films on Aluminium. Proc. R. Soc. Lond. A 1970, 317, 511–543. [Google Scholar]
- Nielsch, K.; Choi, J.; Schwirn, K.; Wehrspohn, R.B.; Gösele, U. Self-ordering regimes of porous alumina: The 10 porosity rule. Nano Lett. 2002, 2, 677–680. [Google Scholar] [CrossRef]
- Hwang, S.K.; Jeong, S.H.; Hwang, H.Y.; Lee, O.J.; Lee, K.H. Fabrication of Highly Ordered Pore Array in Anodic Aluminum Oxide. Korean J. Chem. Eng. 2002, 19, 467–473. [Google Scholar] [CrossRef]
- Ebihara, K.; Takahashi, H.; Nagayama, M. Interpretation of the voltage-current characteristics observed when anodizing aluminum in acid solutions. Kinzoku Hyomen Gijutsu 1984, 35, 205–209. [Google Scholar]
- Wood, G.C.; O’Sullivan, J.P. The anodizing of aluminium in sulphate solutions. Electrochim. Acta 1970, 15, 1865–1876. [Google Scholar] [CrossRef]
- Myung, N.V.; Lim, J.; Fleurial, J.-P.; Yun, M.; West, W.; Choi, D. Alumina nanotemplate fabrication on silicon substrate. Nanotechnology 2004, 15, 833. [Google Scholar] [CrossRef]


| Morphological Parameter | Adjustment Equation | |
|---|---|---|
| (1) | ||
| (2) | ||
| (3) | ||
| (4) | ||
| (5) | ||
| (6) | ||
| (7) | ||
| (8) | ||
| (9) | ||
| (10) | ||
| (11) |
| Sample | (poros/cm2) | (µm) | (%) | ||
|---|---|---|---|---|---|
| S0.3 T10 V10 | 21.0 ± 3.3 | 29.9 ± 4.4 | 1.1 × 10¹¹ ± 1.2 × 10⁸ | 3.9 ± 0.55 | 28.7 ± 2.0 |
| S0.3 T10 V15 | 27.8 ± 3.3 | 40.9 ± 4.2 | 6.6 × 10¹⁰ ± 7.7 × 10⁸ | 6.4 ± 0.45 | 26.0 ± 1.8 |
| S0.3 T10 V20 | 34.0 ± 3.2 | 56.0 ± 6.2 | 4.3 × 10¹⁰ ± 2.1 × 10⁹ | 9.6 ± 0.55 | 29.8 ± 4.5 |
| S0.3 T20 V10 | 21.4 ± 3.1 | 29.9 ± 4.4 | 1.1 × 10¹¹ ± 3.7 × 10⁸ | 6.0 ± 0.71 | 26.1 ± 0.3 |
| S0.3 T20 V15 | 27.3 ± 3.3 | 42.1 ± 7.0 | 6.6 × 10¹⁰ ± 1.4 × 10⁹ | 10.3 ± 1.06 | 23.5 ± 3.1 |
| S0.3 T20 V20 | 34.2 ± 3.1 | 51.9 ± 4.7 | 4.4 × 10¹⁰ ± 6.7 × 10⁸ | 20.0 ± 0.41 | 27.2 ± 0.6 |
| S0.3 T30 V10 | 21.2 ± 2.8 | 31.3 ± 4.4 | 1.1 × 10¹¹ ± 2.0 × 10⁹ | 9.1 ± 0.4 | 34.0 ± 0.5 |
| S0.3 T30 V15 | 26.3 ± 2.8 | 42.3 ± 7.5 | 6.1 × 10¹⁰ ± 1.4 × 10⁹ | 20.6 ± 1.0 | 32.6 ± 0.4 |
| S0.3 T30 V20 | 29.7 ± 2.7 | 49.9 ± 4.7 | 4.2 × 10¹⁰ ± 3.1 × 10⁸ | 32.3 ± 0.8 | 27.5 ± 0.2 |
| S2 T5 V10 | 15.8 ± 2.6 | 26.5 ± 3.8 | 1.6 × 10¹¹ ± 1.2 × 10⁹ | 5.9 ± 0.2 | 14.0 ± 0.4 |
| S2 T5 V12 | 19.9 ± 2.9 | 30.9 ± 4.6 | 1.3 × 10¹¹ ± 2.2 × 10⁸ | 9.7 ± 0.2 | 21.0 ± 0.7 |
| S2 T5 V15 | 20.4 ± 2.2 | 34.7 ± 5.0 | 9.2 × 10¹⁰ ± 4.5 × 10⁸ | 17.9 ± 0.4 | 19.9 ± 3.0 |
| S2 T10 V10 | 18.4 ± 3.3 | 28.6 ± 5.2 | 1.5 × 10¹¹ ± 2.1 × 10⁹ | 10.2 ± 0.2 | 16.3 ± 1.7 |
| S2 T10 V12 | 19.9 ± 2.2 | 30.2 ± 3.8 | 1.1 × 10¹¹ ± 3.0 × 10⁹ | 15.5 ± 0.1 | 27.1 ± 0.6 |
| S2 T10 V15 | 22.4 ± 3.6 | 35.5 ± 4.4 | 8.7 × 10¹⁰ ± 1.7 × 10⁹ | 22.0 ± 0.7 | 28.9 ± 0.4 |
| S2 T20 V10 | 18.2 ± 2.3 | 28.1 ± 4.1 | 1.3 × 10¹¹ ± 2.3 × 10⁹ | 19.4 ± 0.3 | 20.3 ± 0.2 |
| S2 T20 V12 | 17.9 ± 3.1 | 32.7 ± 4.9 | 1.2 × 10¹¹ ± 2.9 × 10⁹ | 26.8 ± 0.4 | 21.6 ± 0.4 |
| S2 T20 V15 | 23.2 ± 2.4 | 37.2 ± 4.7 | 8.6 × 10¹⁰ ± 2.5 × 10⁸ | 58.9 ± 0.3 | 25.7 ± 2.6 |
| Morphological Parameter | Adjustment Equation | Adjustment Parameters | |||||
|---|---|---|---|---|---|---|---|
| (1.1) | −0.75 | 0.10 | 1.62 | - | - | 98.86 | |
| (2.1) | - | - | 1.68 | - | - | 98.71 | |
| (3.1) | −0.70 | 0.14 | 2.55 | - | - | 99.55 | |
| (4.1) | - | - | 2.66 | - | - | 99.45 | |
| (5.1) | 2.13 × 10¹⁰ | 1.97 × 10⁸ | - | 1.04 × 10¹³ | - | 93.25 | |
| (6.1) | 2.10 × 10¹⁰ | - | - | 1.08 × 10¹³ | - | 93.27 | |
| (7.1) | 5.58 | 0.55 | 0.22 | - | - | 31.00 | |
| (8.1) | 10.07 | −0.73 | −0.64 | - | 0.12 | 54.18 | |
| (9.1) | 6.64 | - | - | - | 0.05 | 50.68 | |
| (10.1) | 1.12 | 0.45 | 1.17 | - | - | 95.07 | |
| (11.1) | - | 0.43 | 1.28 | - | - | 95.19 | |
Publisher’s Note: MDPI stays neutral with regard to jurisdictional claims in published maps and institutional affiliations. |
© 2021 by the authors. Licensee MDPI, Basel, Switzerland. This article is an open access article distributed under the terms and conditions of the Creative Commons Attribution (CC BY) license (http://creativecommons.org/licenses/by/4.0/).
Share and Cite
Bruera, F.A.; Kramer, G.R.; Vera, M.L.; Ares, A.E. Low-Cost Nanostructured Coating of Anodic Aluminium Oxide Synthesized in Sulphuric Acid as Electrolyte. Coatings 2021, 11, 309. https://doi.org/10.3390/coatings11030309
Bruera FA, Kramer GR, Vera ML, Ares AE. Low-Cost Nanostructured Coating of Anodic Aluminium Oxide Synthesized in Sulphuric Acid as Electrolyte. Coatings. 2021; 11(3):309. https://doi.org/10.3390/coatings11030309
Chicago/Turabian StyleBruera, Florencia A., Gustavo R. Kramer, María L. Vera, and Alicia E. Ares. 2021. "Low-Cost Nanostructured Coating of Anodic Aluminium Oxide Synthesized in Sulphuric Acid as Electrolyte" Coatings 11, no. 3: 309. https://doi.org/10.3390/coatings11030309
APA StyleBruera, F. A., Kramer, G. R., Vera, M. L., & Ares, A. E. (2021). Low-Cost Nanostructured Coating of Anodic Aluminium Oxide Synthesized in Sulphuric Acid as Electrolyte. Coatings, 11(3), 309. https://doi.org/10.3390/coatings11030309