Article

Experimental Analysis of Reinforcement Rust in Cement under Corrosive Environment

1
Architectural Engineering Institute, Jinhua Polytechnic, Jinhua 321000, China
2
School of Civil and Environmental Engineering, Ningbo University, Ningbo 315000, China
3
School of Architecture Engineering, Qingdao Agricultural University, Qingdao 266109, China
*
Author to whom correspondence should be addressed.
Coatings 2021, 11(2), 241; https://doi.org/10.3390/coatings11020241
Submission received: 12 January 2021 / Revised: 1 February 2021 / Accepted: 7 February 2021 / Published: 18 February 2021
(This article belongs to the Special Issue Interface and Surface Modification for Durable Concretes)

Abstract

:
In this work, the microstructure characteristics of corrosion products of reinforcement under a corrosive environment with chloride, carbonation and the combination of chloride-carbonization were studied by x-ray photoelectron spectroscopy (XPS) and scanning electron microscopy/energy spectroscopy (SEM-EDX). The results indicate that the outside of the passivation film reacts with the cement slurry to produce Fe–SiO4 in all three corrosive environments. The inner side is not completely corroded. The morphology of the corrosion is different in the three environments. In a chloride environment, corrosion products have obvious cracks, and the local layered structure is dense. In a carbonation environment, the surface of the steel corrosion shows a uniform granular structure and loose texture. With the combination of chloride and combination, the surface of the structural layer of steel corrosion was uneven and accompanied by protrusions, cracking and spalling occurred. The composition of the corrosion substances in the three corrosion environments are mainly composed of FeO, Fe3O4, Fe2O3 and Fe–SiO4. The content of iron oxide increases from a chloride salt, carbonization to the composite environment, indicating that the corrosion degree intensifies successively.

1. Introduction

The corrosion of steel bars is considered to be the main factor affecting the durability and mechanical performance of concrete [1]. Steel corrosion leads to crack propagation in concrete [2,3] and reduces the seismic performance of the structures [4]. Both carbonization and chloride ion corrosion is considered to be the main causes of steel corrosion [5]. The rising concentration of CO2 due to the greenhouse effect increase the likelihood of steel corrosion [6]. During carbonization, CO2 reduces the pH value of the pore solution, causing the steel to be corroded due to the instability of the surface passivation film. Chloride permeation is the main cause of steel corrosion in the marine environment [7]. Chloride ions cause corrosion of steel bars by damage to the passivation film on the surface of the steel [8]. The reinforced concrete structures in the marine atmosphere and melting salt environment will be affected by both carbonization and chlorine salt [9]. In the interaction of carbonization and chloride ions, chloride ions can accelerate the corrosion of steel bars in concrete [10]. Carbonization affects the chloride diffusivity [11]. Meanwhile, it reduces the amount of solidified chloride ions and increases the number of free chloride ions [12]. Thus, carbonation accelerates chloride ion transport [13] and result in thinner passive film in steel [14]. Aperador et al. [15] used open-circuit potential monitoring, polarization resistance measurements and electrochemical impedance spectroscopy to evaluate the corrosion behavior of steel bars under chloride ion corrosion and carbonization. Nguyen T T H et al. [16] proposed a modeling strategy for simulating the corrosion of steel bars caused by carbonization in the atmospheric environment and explored the effect of the gradual formation of corrosion products on the concrete/concrete interface during the cracking of the concrete cover. Ye CQ et al. [17] used EIS, LPR, etc. and found that with the increase of chloride in the concrete simulation pore solution, the steel capacitor ring and polarization resistance decreased, and the MnS inclusions on the steel surface played a leading role in the initiation of pitting corrosion. Most of the research related to steel corrosion focuses on the influence of the corrosive environment on the corrosion mechanism and behavior of bare steel. Numerical and experimental methods are employed to analyze the reorganization of physical microstructures on the binding effect of chloride and carbonation [18,19]. X-ray photoelectron spectroscopy (XPS) is currently used to analyze the corrosion process of steel in concrete under erosive conditions [20,21]. In contrast, most of them are analyzed in simulated pore solutions [22,23,24]. Research on the microstructure and composition of steel corrosion in cement under the real carbonization and chloride corrosion environments have not been reported.
Based on XPS and scanning electron microscopy/energy spectroscopy (SEM-EDX), this paper focuses on the microstructure and composition of rust in steel chloride, carbonation and chloride-carbonation composites in real cement paste. The analysis was carried out to investigate the corrosion mechanism of steel bars under chloride and carbonization, which provided a theoretical basis for the durability and service life of reinforced concrete structures.

2. Materials and Methods

2.1. Raw Material and Mixing Ratio

The steel specimen was an HPB235 grade round bar with a diameter of 8 mm that was cut into a disc with a thickness of 2 mm. Its surface oxide scale was removed by immersing in 10% ammonium citrate solution for 3–5 days. After removal, it was rinsed with water, dried with a towel, and then baked in an oven at approximately 100 °C for 10 min. After the steel specimens were polished with sandpaper, the surface oil was removed with absolute ethanol. The specimens were sealed with plastic wrap after inspection without rust marks. The cement was ordinary Portland cement with a strength rating of 42.5. Deionized water and analytically pure NaCl were used. The test specimen of this experiment was unified into a cement paste specimen with a water–cement ratio of 0.3. The specimen size of cement paste was 40 mm × 40 mm × 160 mm. The schematic diagram of the specimen is shown in Figure 1.
Three types of corrosive environments were simulated using a carbonization tank and incorporating sodium chloride into the cement paste specimen. (1) The most severe chlorine salt corrosion environment in coastal cities, that is, the slurry was mixed with 0.5% NaCl (accounting for cement quality). (2) Completely carbonized corrosion environment. (3) Composite corrosion environment under complete carbonization and 0.5% chlorine salt content (accounting for cement quality). The mixing ratios of the test specimens are shown in Table 1. Six test specimens were prepared for each set of mixing ratios, and three of them were selected for the carbonization test. A cement paste test specimen was poured into a steel triple mold with a size of 40 mm × 40 mm × 160 mm, and three steel wafers of φ 8 mm × 2 mm specification were placed in the third equinox position in each test specimen as shown in Figure 1.

2.2. Specimen Maintenance and Treatment

After all the cement paste samples were poured, the mold was removed after 24 h of curing. According to the “Standards for Testing Methods of Mechanical Properties of Ordinary Concrete” (GB/T 50081-2002), the specimens were placed under standard curing conditions for maintenance, in which the curing age is 28 d, the curing temperature is 20 ± 2 °C, and the humidity is above 95%. Then, the two bottom surfaces of the specimen were sealed with epoxy resin adhesive to ensure that the specimen was two-dimensional carbonization.
The specimens carbonized in a carbonization tank with a carbon dioxide concentration of 20 ± 3%, a temperature of 20 ± 5 °C, and a humidity of 70 ± 5%. The carbonation depth of the specimens was measured by the following methods: the samples were taken out every 7 days to test the carbonization depth once they were put in the carbonation tank. Each specimen was cut along the transverse, and the pulp powder on the surface was blown off with a leather tube. The phenolphthalein reagent was sprayed on the section, and the carbonation depth was measured with a vernier caliper after standing for color development. At approximately 21 d, the test specimens were basically carbonized. To ensure its complete carbonization, the time was extended to 28 d, and after complete carbonization, curing was continued under standard conditions.
Specimens used to analyze the environment of carbonation and composite were cured in a carbonation tank with the above parameters for 12 months. Specimens used to analyze the environment of chloride were cured in the curing room for 12 months with the same humidity and temperature, excluding CO2 concentration. The 12-month cleaned specimens without carbonization and the specimens that were completely carbonized and cured for one year were cleaved, and the cement slurry on the surface of the removed steel discs was wiped clean with 1 mol/L dilute hydrochloric acid for chemical treatment. The magnetic sample was demagnetized in advance to avoid the influence of the magnetic field, rinsed with Ar deionized water and acetone, blown dry with argon and then sent to scanning electron microscopy and X-ray energy spectroscopy (SEM-EDX) analysis and X-ray photoelectron spectroscopy (XPS) analysis.

2.3. Test Methods

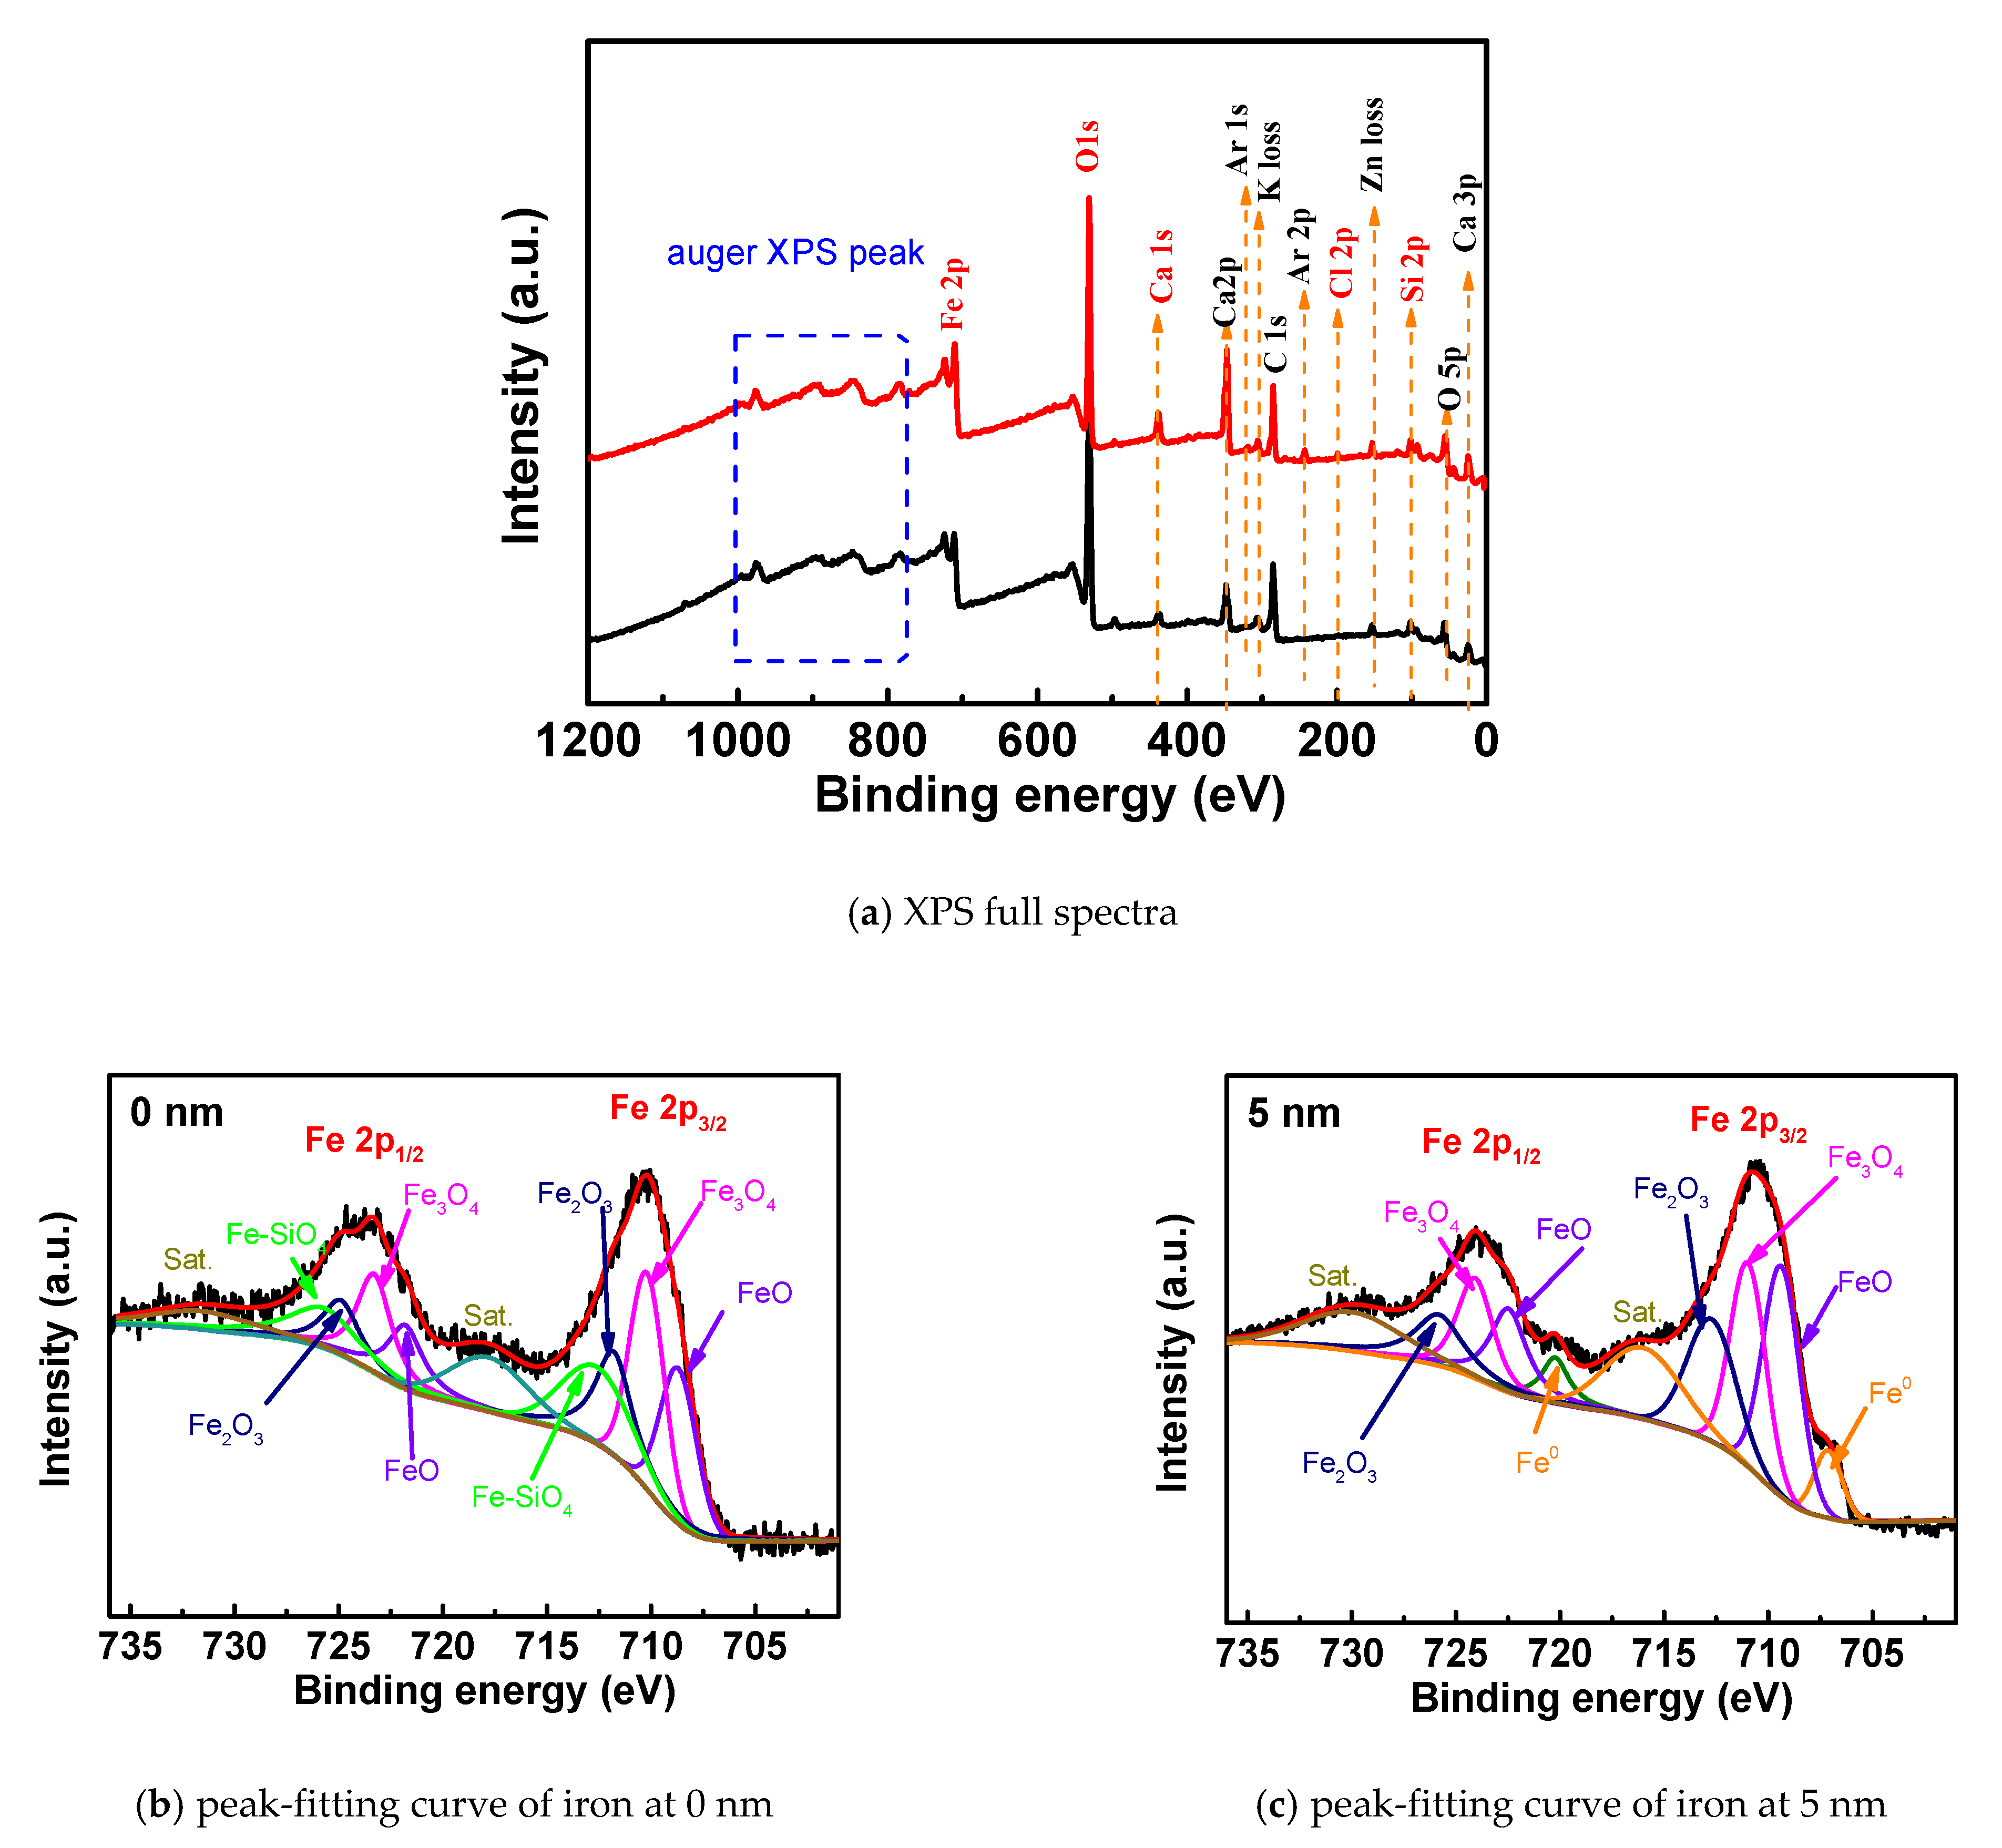
2.3.1. X-ray Photoelectron Spectroscopy

Axis ultraDLD X-ray photoelectron spectroscopy (Shimadzu Co., Ltd., Nagoya, Japan) was used to scan the steel disc in chloride, carbon and composite erosion environments, and the chemical composition and chemical state of the elements on the steel surface were analyzed. The test results were analyzed using CasaXPS2.2.16 software [25]. First, the scan results were analyzed; that is, the full spectrum analysis of each element was performed first to obtain the content of each element. Then, the peak of the Fe2p narrow region of the iron element XPS spectrum was subjected to a peak-fitting process to obtain various products of iron, and the relative contents of the respective products were obtained. In addition, an offset of the binding energy occurred during the test, and a charge correction was required to correct the binding energy of the test instrument by adsorbing carbon of 284.6 eV as a standard.

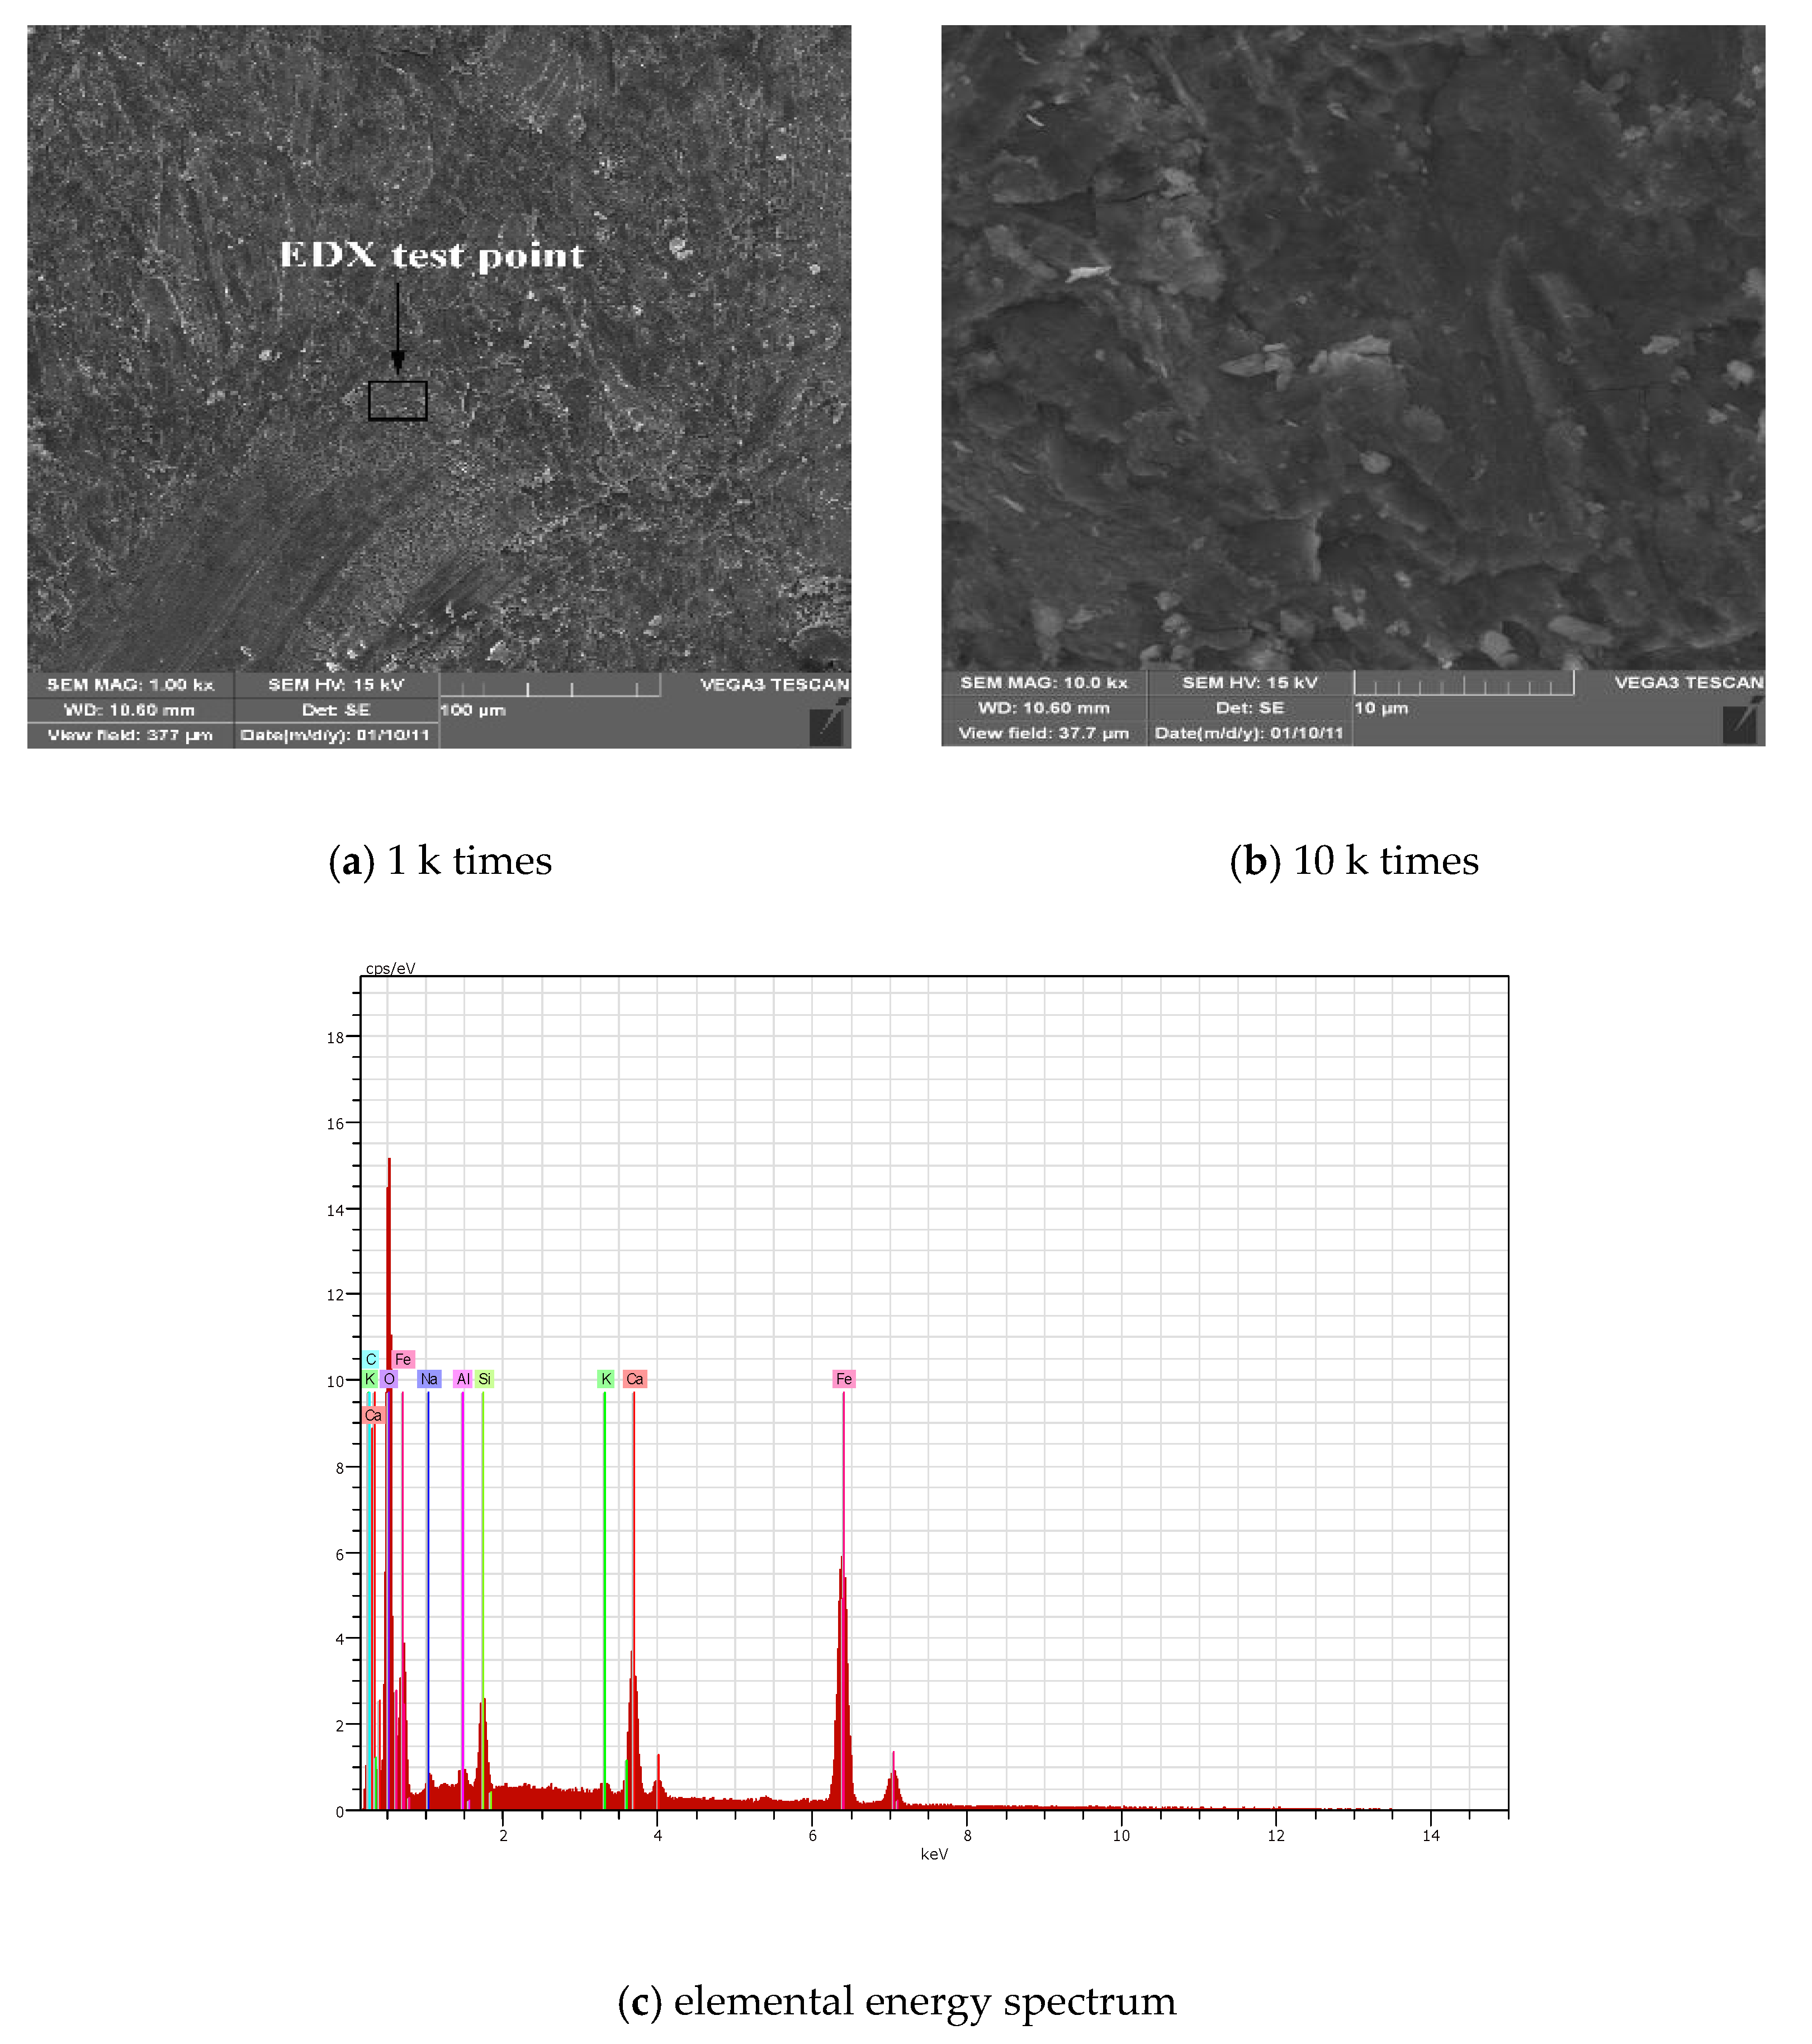
2.3.2. Scanning Electron Microscopy/Energy Spectrum Analysis (SEM-EDX)

This test uses SU-70 (HITACHI Co., Ltd., Tokyo, Japan) field emission scanning electron microscopy and micro-sample injection equipment. The equipment mainly scanned the surface of the steel disc through different scanning magnifications to observe the morphology of the steel after corrosion. At the same time, the energy-dispersive X-ray spectrometer was used to determine the element content of the surface of the steel corrosion on the basis of the X-ray wavelength of different element characteristics, and the results were analyzed in combination with the electron microscope scanning results.

3. Results and Discussion

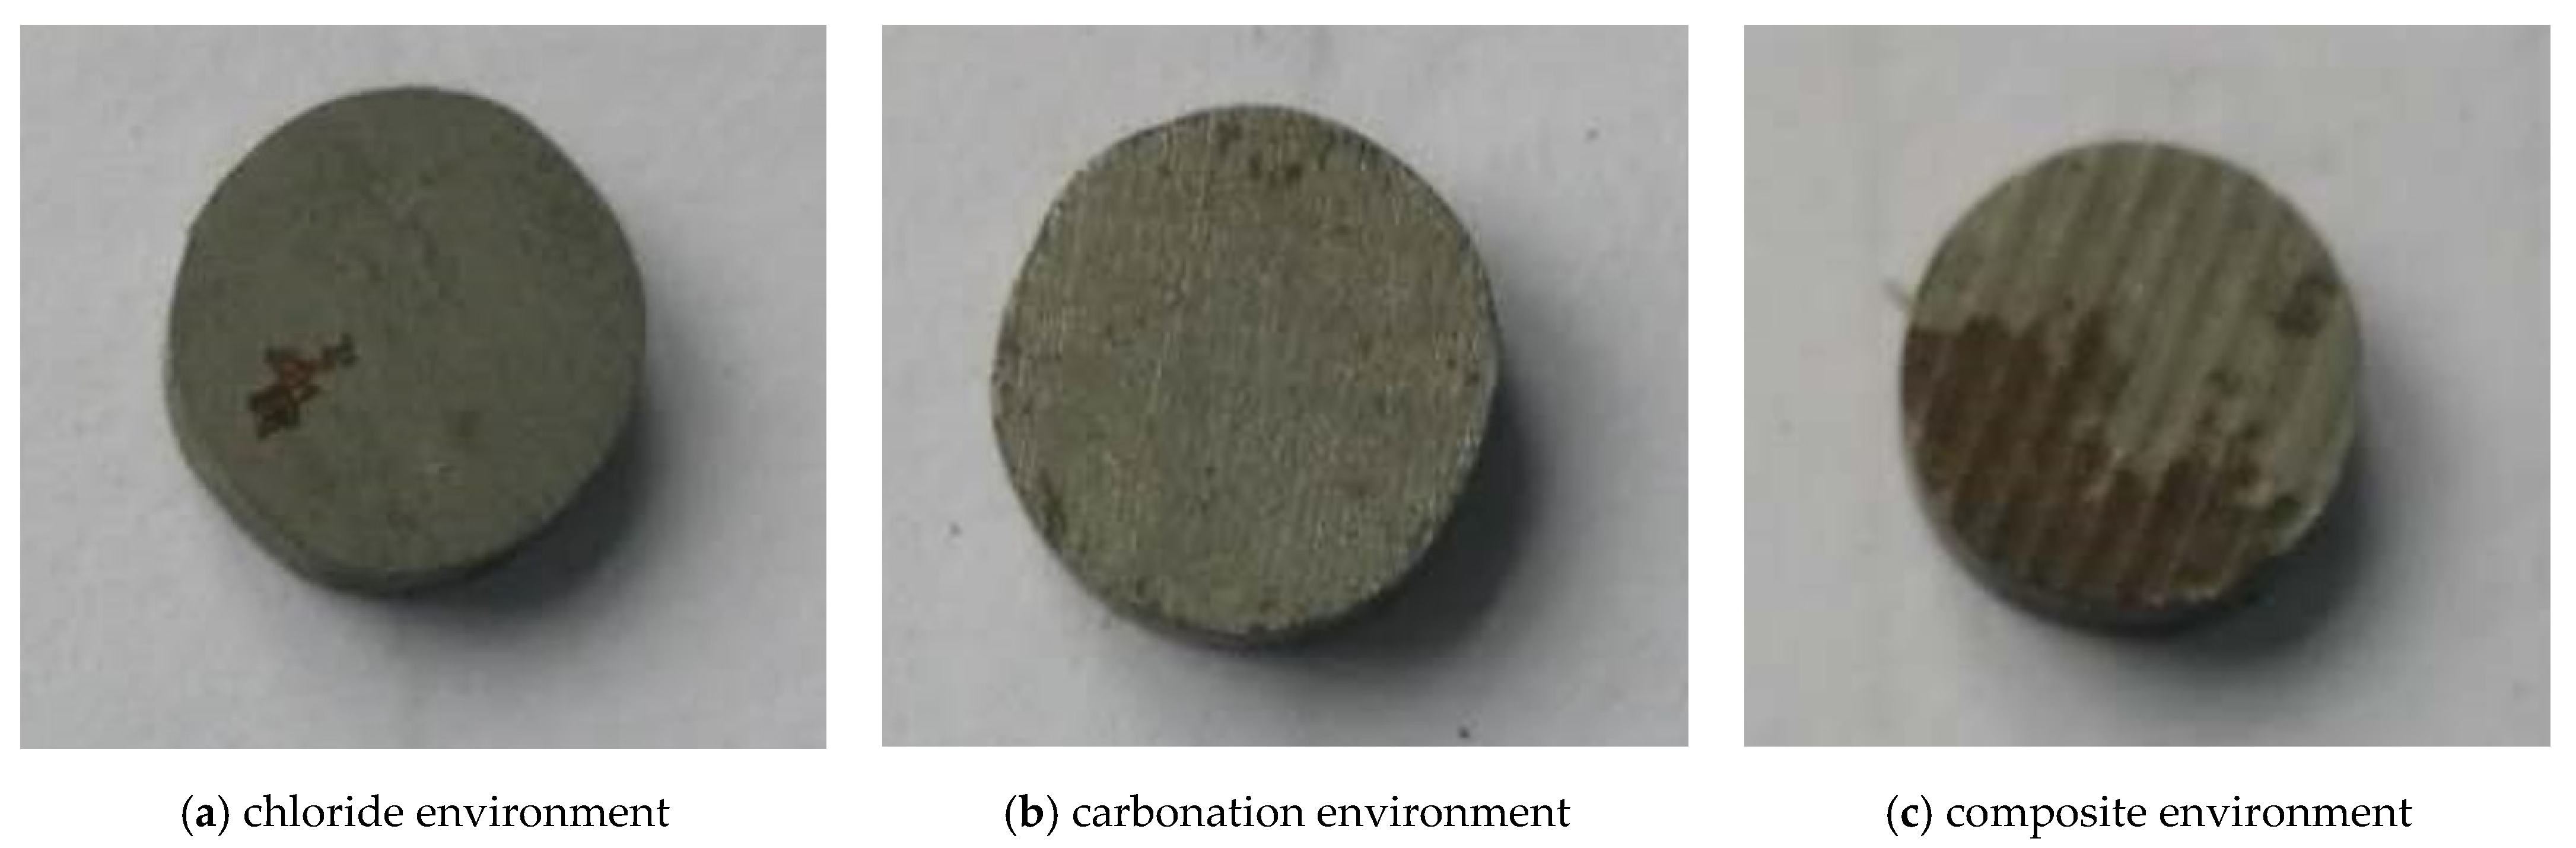
3.1. Analysis of Macroscopic Corrosion Characteristics in Corrosive Environment

After curing for one year in two environments, the three specimens were split, and the steel plate samples were taken out. The changes in their morphology were observed and analyzed to preliminarily determine the corrosion state. Under carbonization, chlorine salt erosion and composite conditions, the steel wafers all appeared corrosion, as shown in Figure 2. In the chloride environment, small pieces of reddish-brown rust unevenly appeared on the surface of the steel wafer, and the pitting corrosion effect was obvious. In the carbonation environment, the grayish-brown rust is evenly distributed on the whole surface with few amount. Under the composite environment of chloride and carbonation, the surface of the steel wafer becomes uneven. The rust is large and appears to fall off. The hardness of the steel bar is reduced.

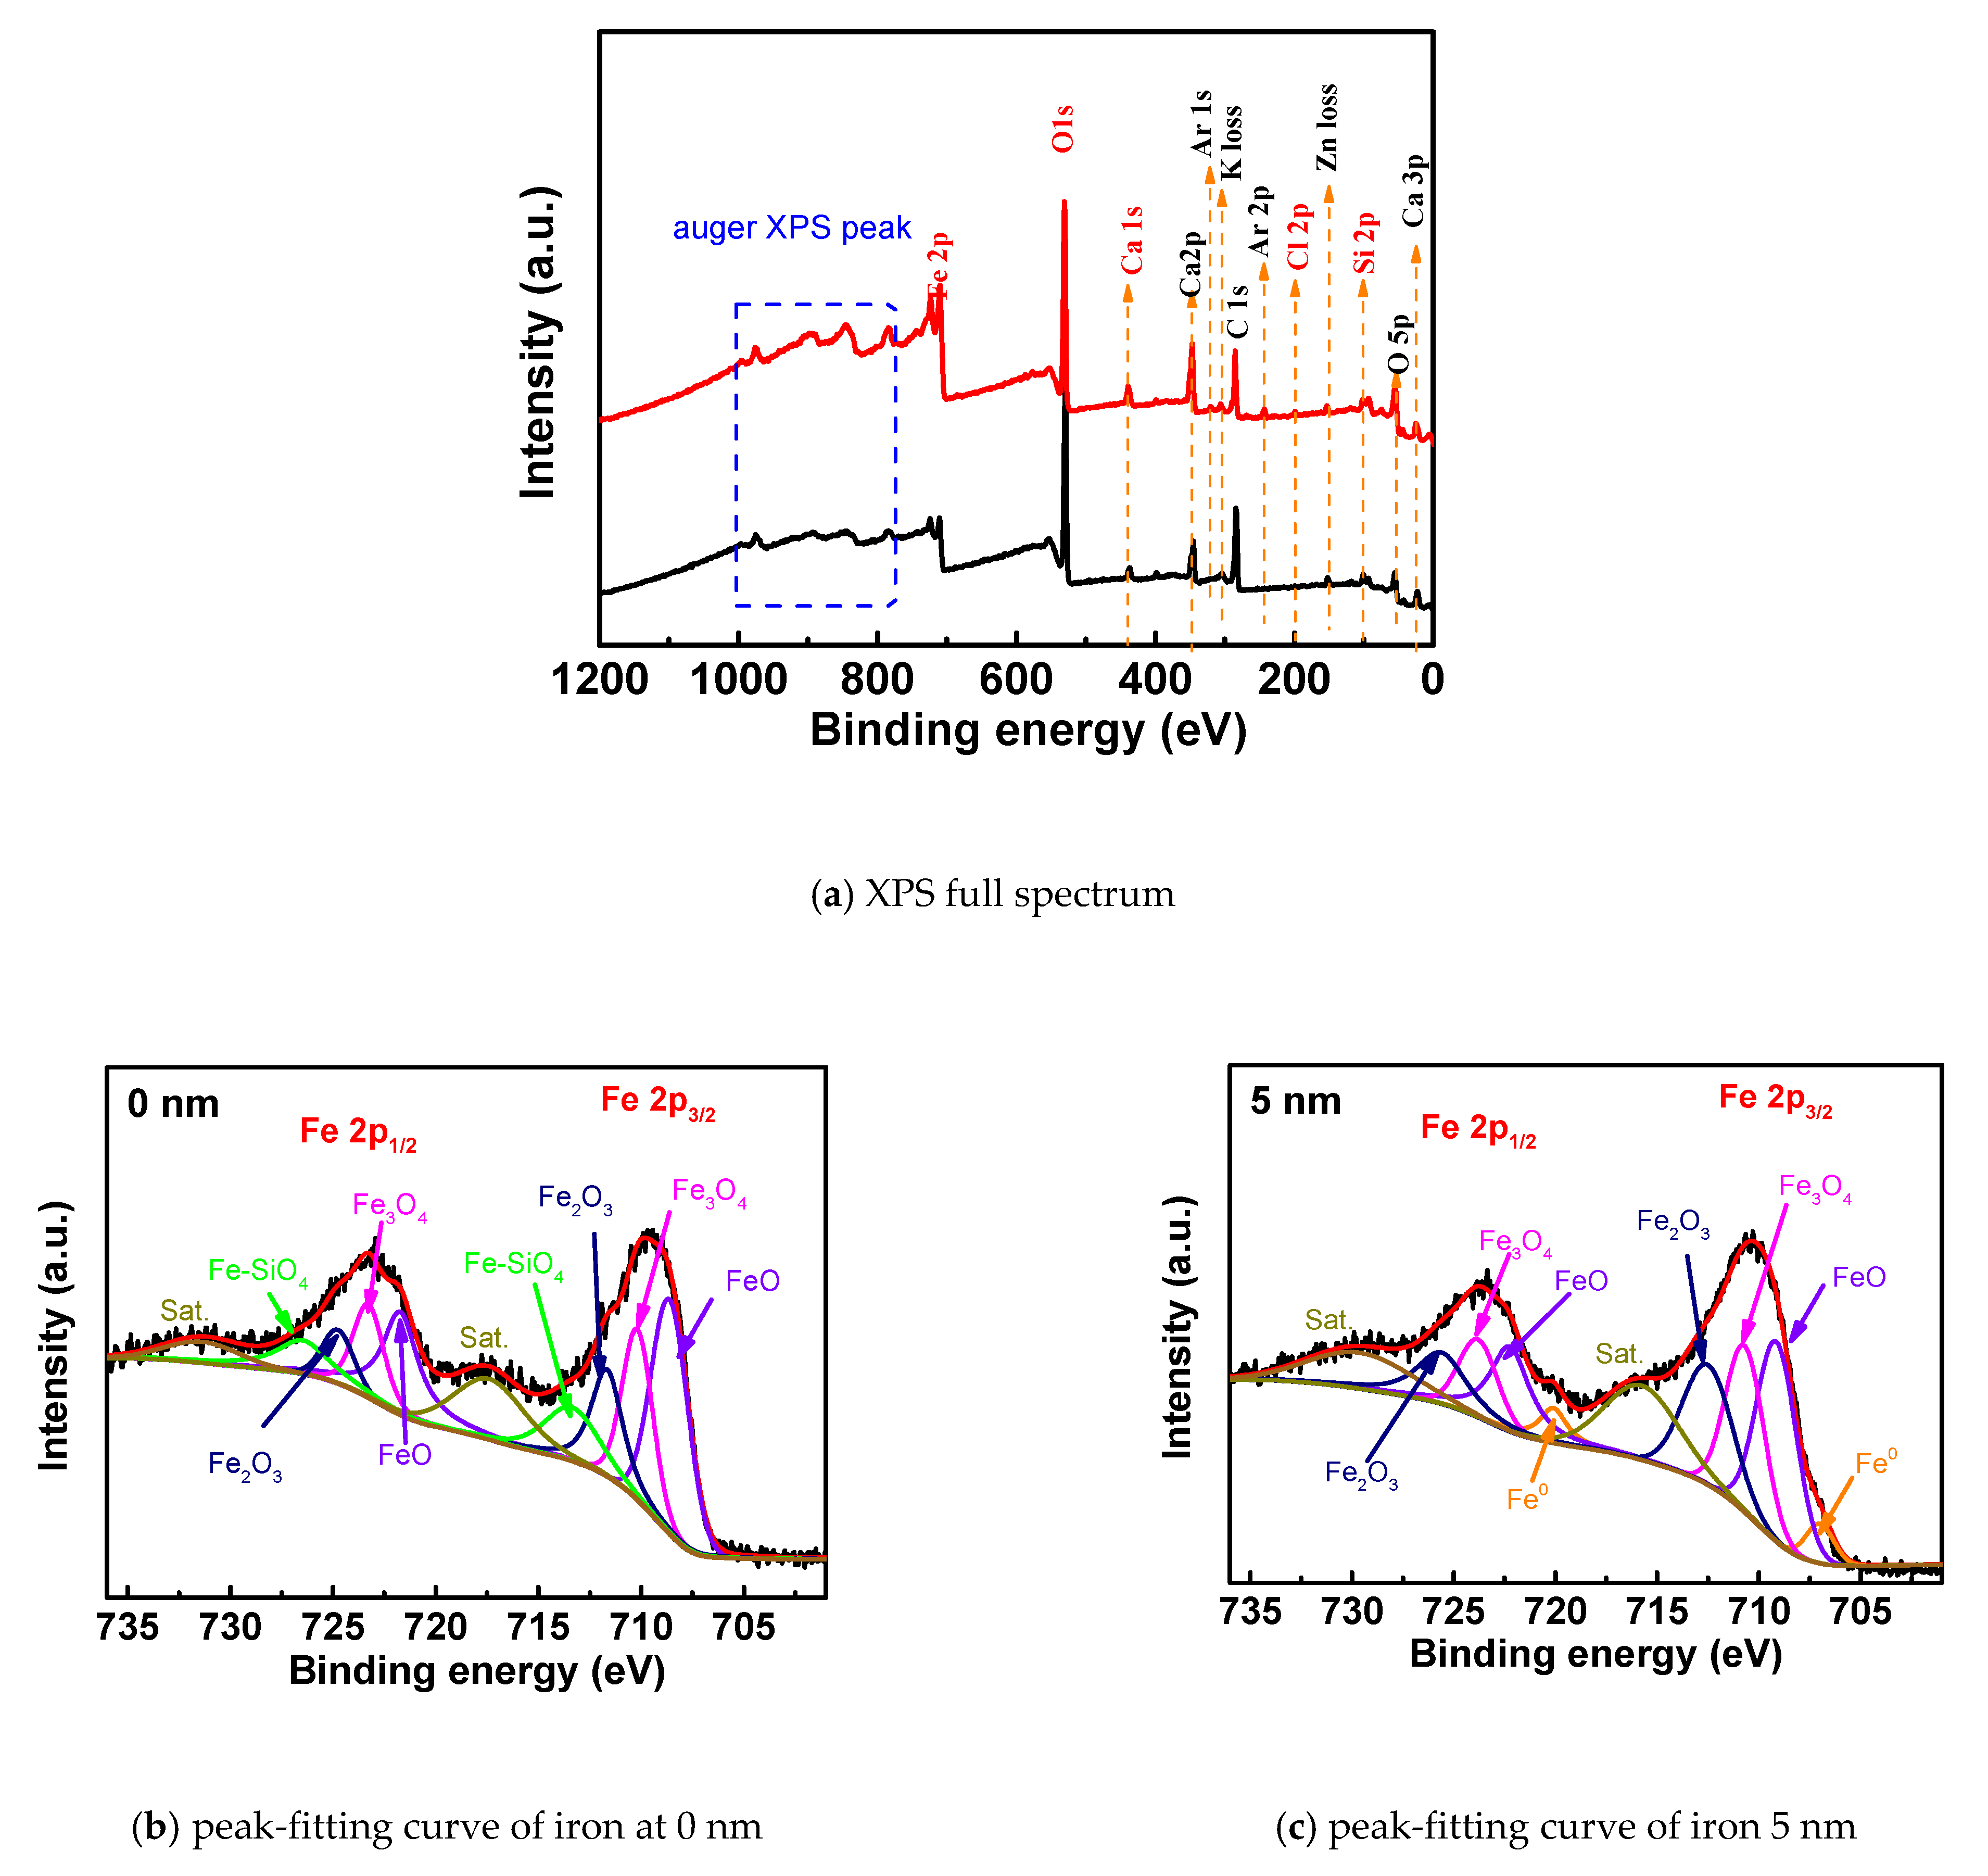
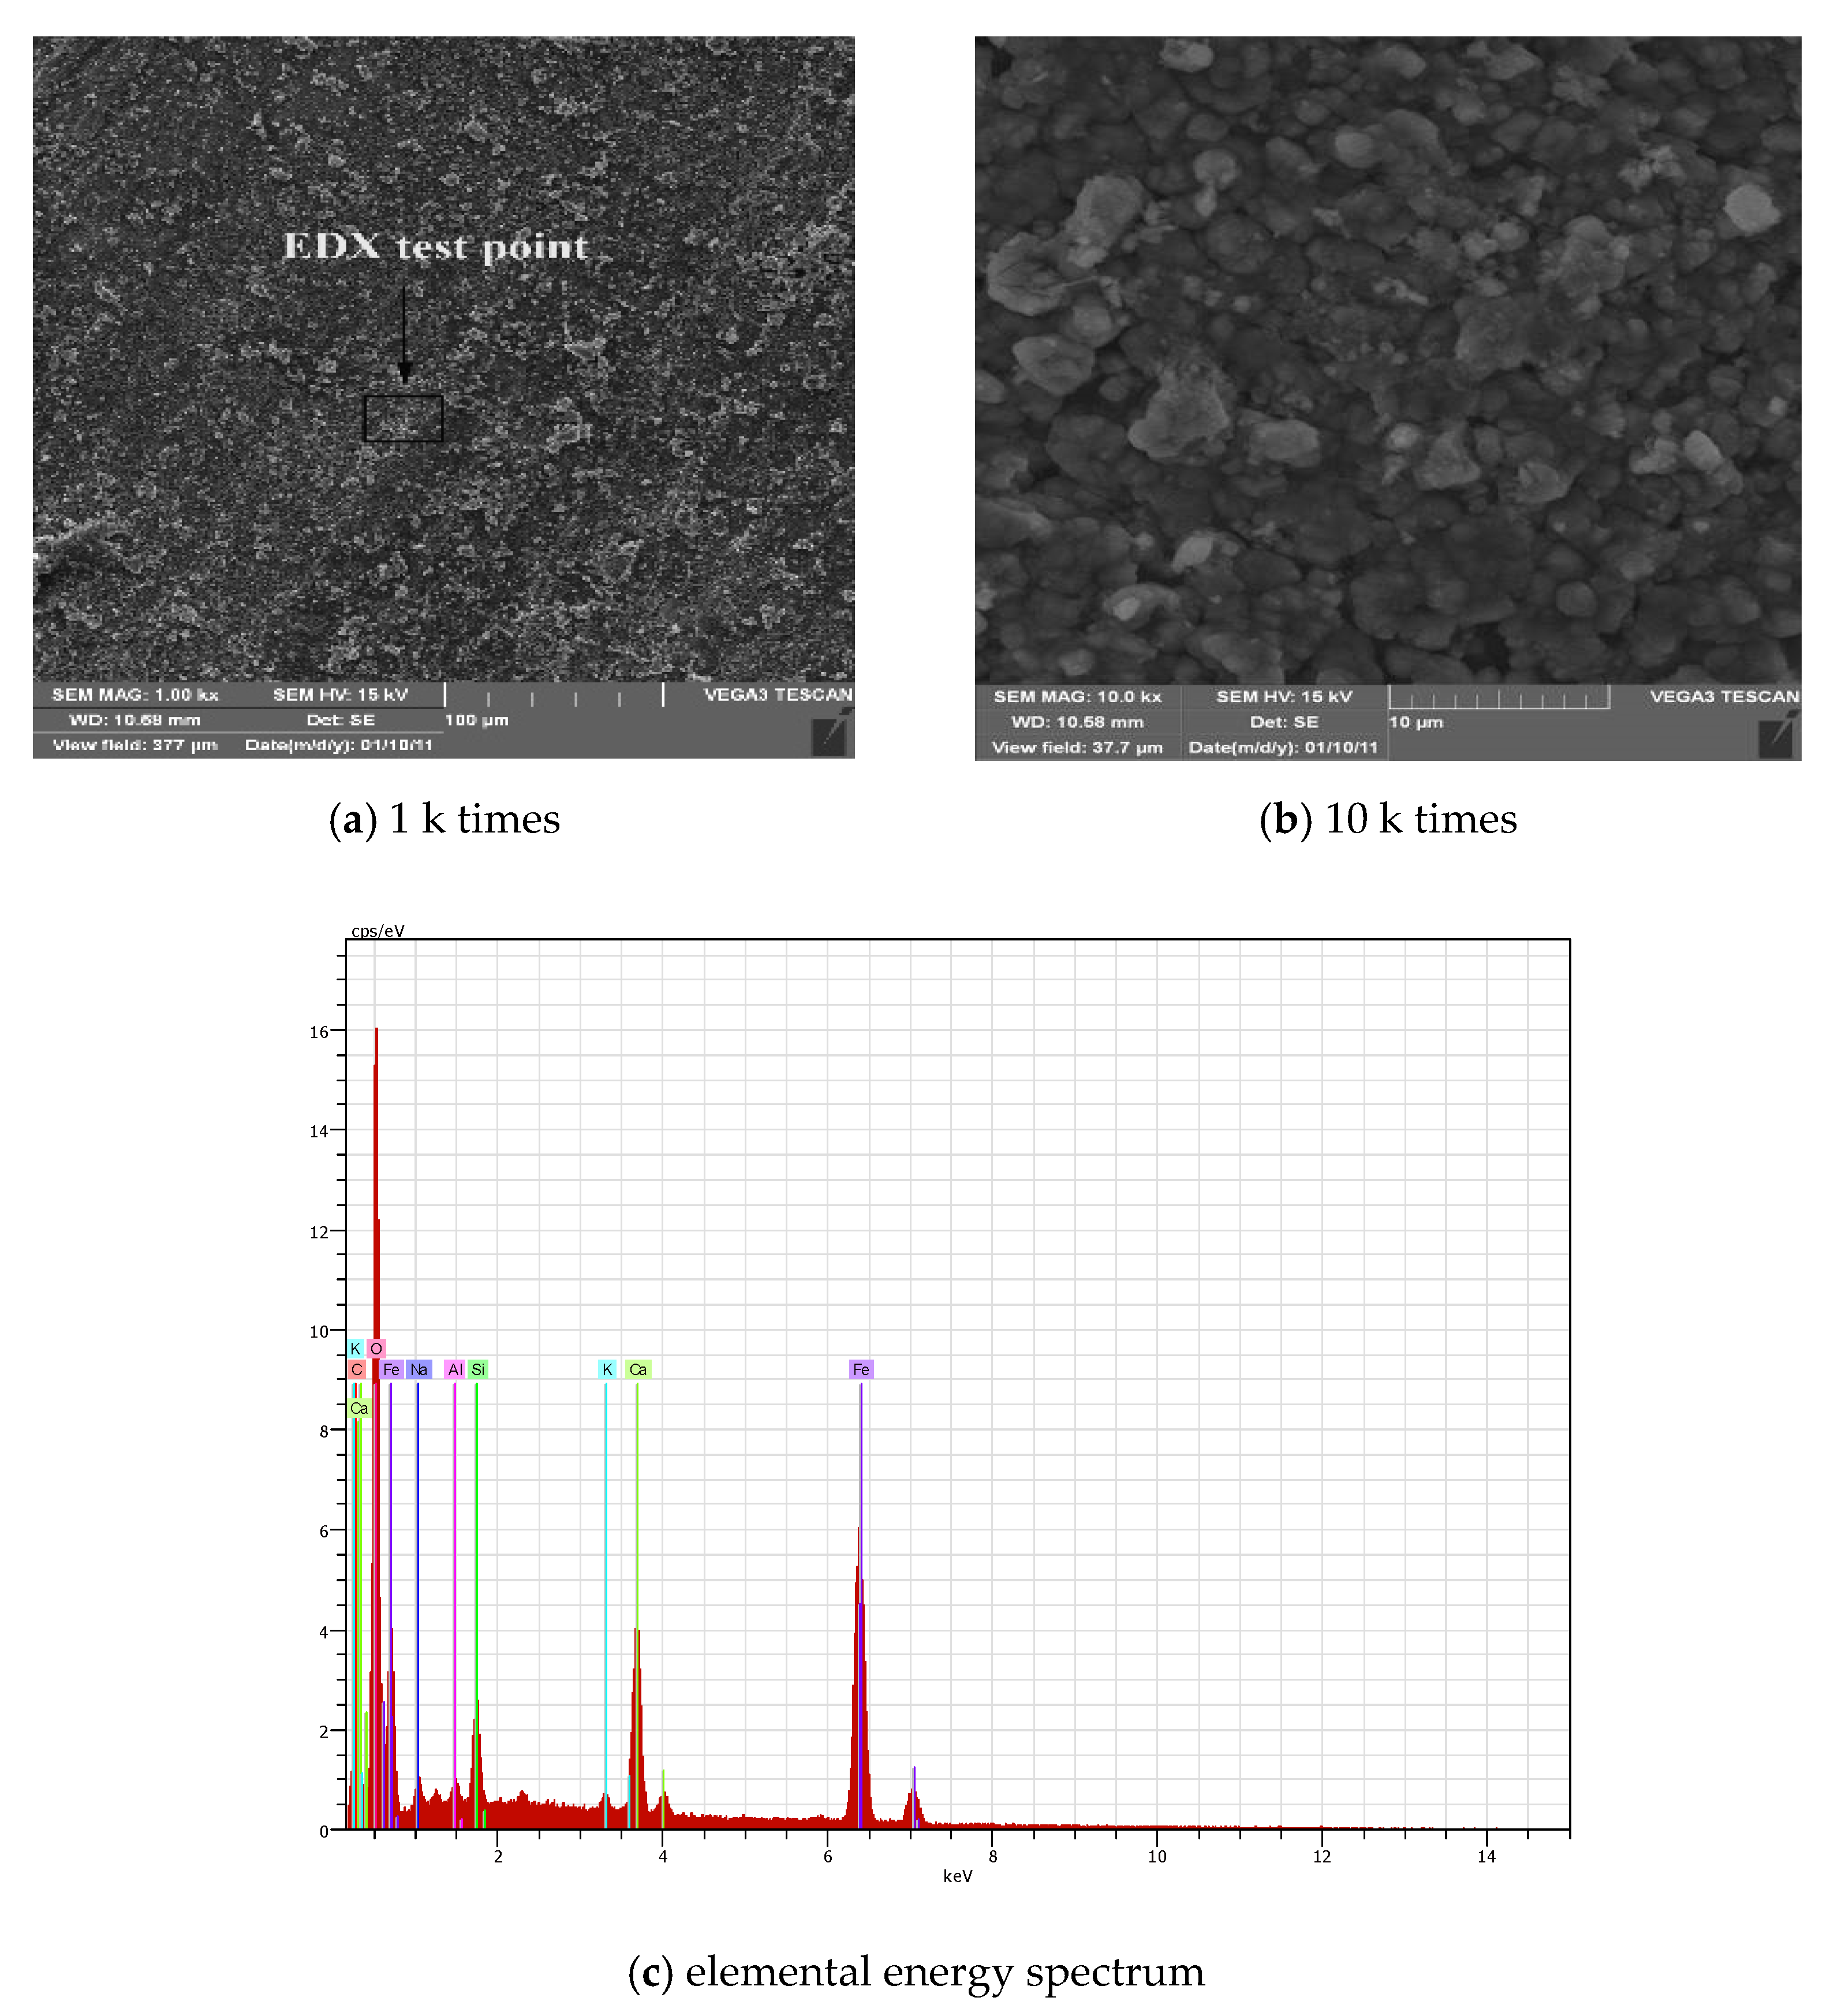
3.2. Analysis of Micro-Corrosion Components of Steel Bars under Chloride Corrosion

Figure 3a shows the full-spectrum line spectra of XPS of steel rust under the condition of 0.5% chloride salt. The main elements on the surface of steel corrosion products are oxygen, iron, calcium, silicon, chlorine and carbon, and the contents of iron, oxygen, carbon, and calcium are relatively high. This aspect shows that the corrosion products on the surface of steel bars are mainly iron oxides. The main components of steel bars are carbon and iron. On the other hand, the high carbon content may also be caused by the contact of carbon dioxide in the air on the surface of steel bars. Due to the migration of chloride ions, rust has some chloride element.
Figure 3b,c show the peak-fitting curves of the iron element XPS of the rust at 0 nm and 5 nm when the chlorine salt content is 0.5%, and the relative content of the corresponding compound is shown in Table 2. It can be seen from the spectrum that the peak curve of Fe2p can be fitted with 10 peak curves. The corresponding iron compounds at 0 nm are FeO, Fe3O4, Fe2O3 and Fe–SiO4. After quantitative analysis, the corresponding contents are 19.6%, 26.4%, 18.3% and 20.9%, respectively. Iron compounds at 5 nm are Fe, FeO, Fe3O4 and Fe2O3. Moreover, the content of the compound at 5 nm is 8%, 26.7%, 24.5% and 20.5%, respectively. The oxide content of iron at 5 nm and the ratio of Fe3+/Fe2+ are lower than 0 nm, indicating that the degree of corrosion and oxidation of the outside of the passivation film is higher than the inside of the passivation film. At the same time, at the surface of rust, the iron compound is mainly composed of Fe–SiO4 formed by the reaction of the free Fe transformed by the passivation film and the cementitious cement material. The formation of the double salt has been explained in related research [26,27]. The content of iron oxide is the highest in the corrosion, including Fe3O4 (Fe3+, Fe2+), Fe2O3 and FeO (Fe2+). It is in accordance with the result of [28]. Although present in the corrosive environment of chloride salt, FeCl2 products are rarely present in the compound because the electrochemical reaction is the cause of steel bar corrosion caused by chloride ions. Chloride ions combine with Fe2+ to form FeCl2, which is unstable and easily decomposed. After decomposition, chloride ions continue to combine to transport new Fe2+, while the original Fe2+ is oxidized to form iron oxide. When the oxygen is sufficient, the iron ions in the oxide are present as Fe3+, and when insufficient, they are present as Fe2+.
Figure 4a,b shows the SEM scans of the surface of the steel bar with a chloride concentration of 0.5%. From Figure 4a, it can be seen that the surface of the steel bar is flat and slightly convex, indicating that the surface of the steel bar was slightly rusted and covered with a layer of rust; Figure 4b shows an image magnified 10 k times. The surface of the latter shows obvious bumps. It can be seen that there are obvious cracks and local delamination, indicating that the steel bars are rusted due to chloride salt. This leads to the expansion of the volume and the occurrence of cracks. Figure 4c is an elemental energy spectrum corresponding to the corrosion of the steel surface. The main elements scanned are oxygen, iron, calcium and silicon. According to the analysis of Table 3 and the previous XPS analysis, the main product of the corrosion is iron oxide, which causes the structure of the steel to become loose and the rust resistance to decrease.

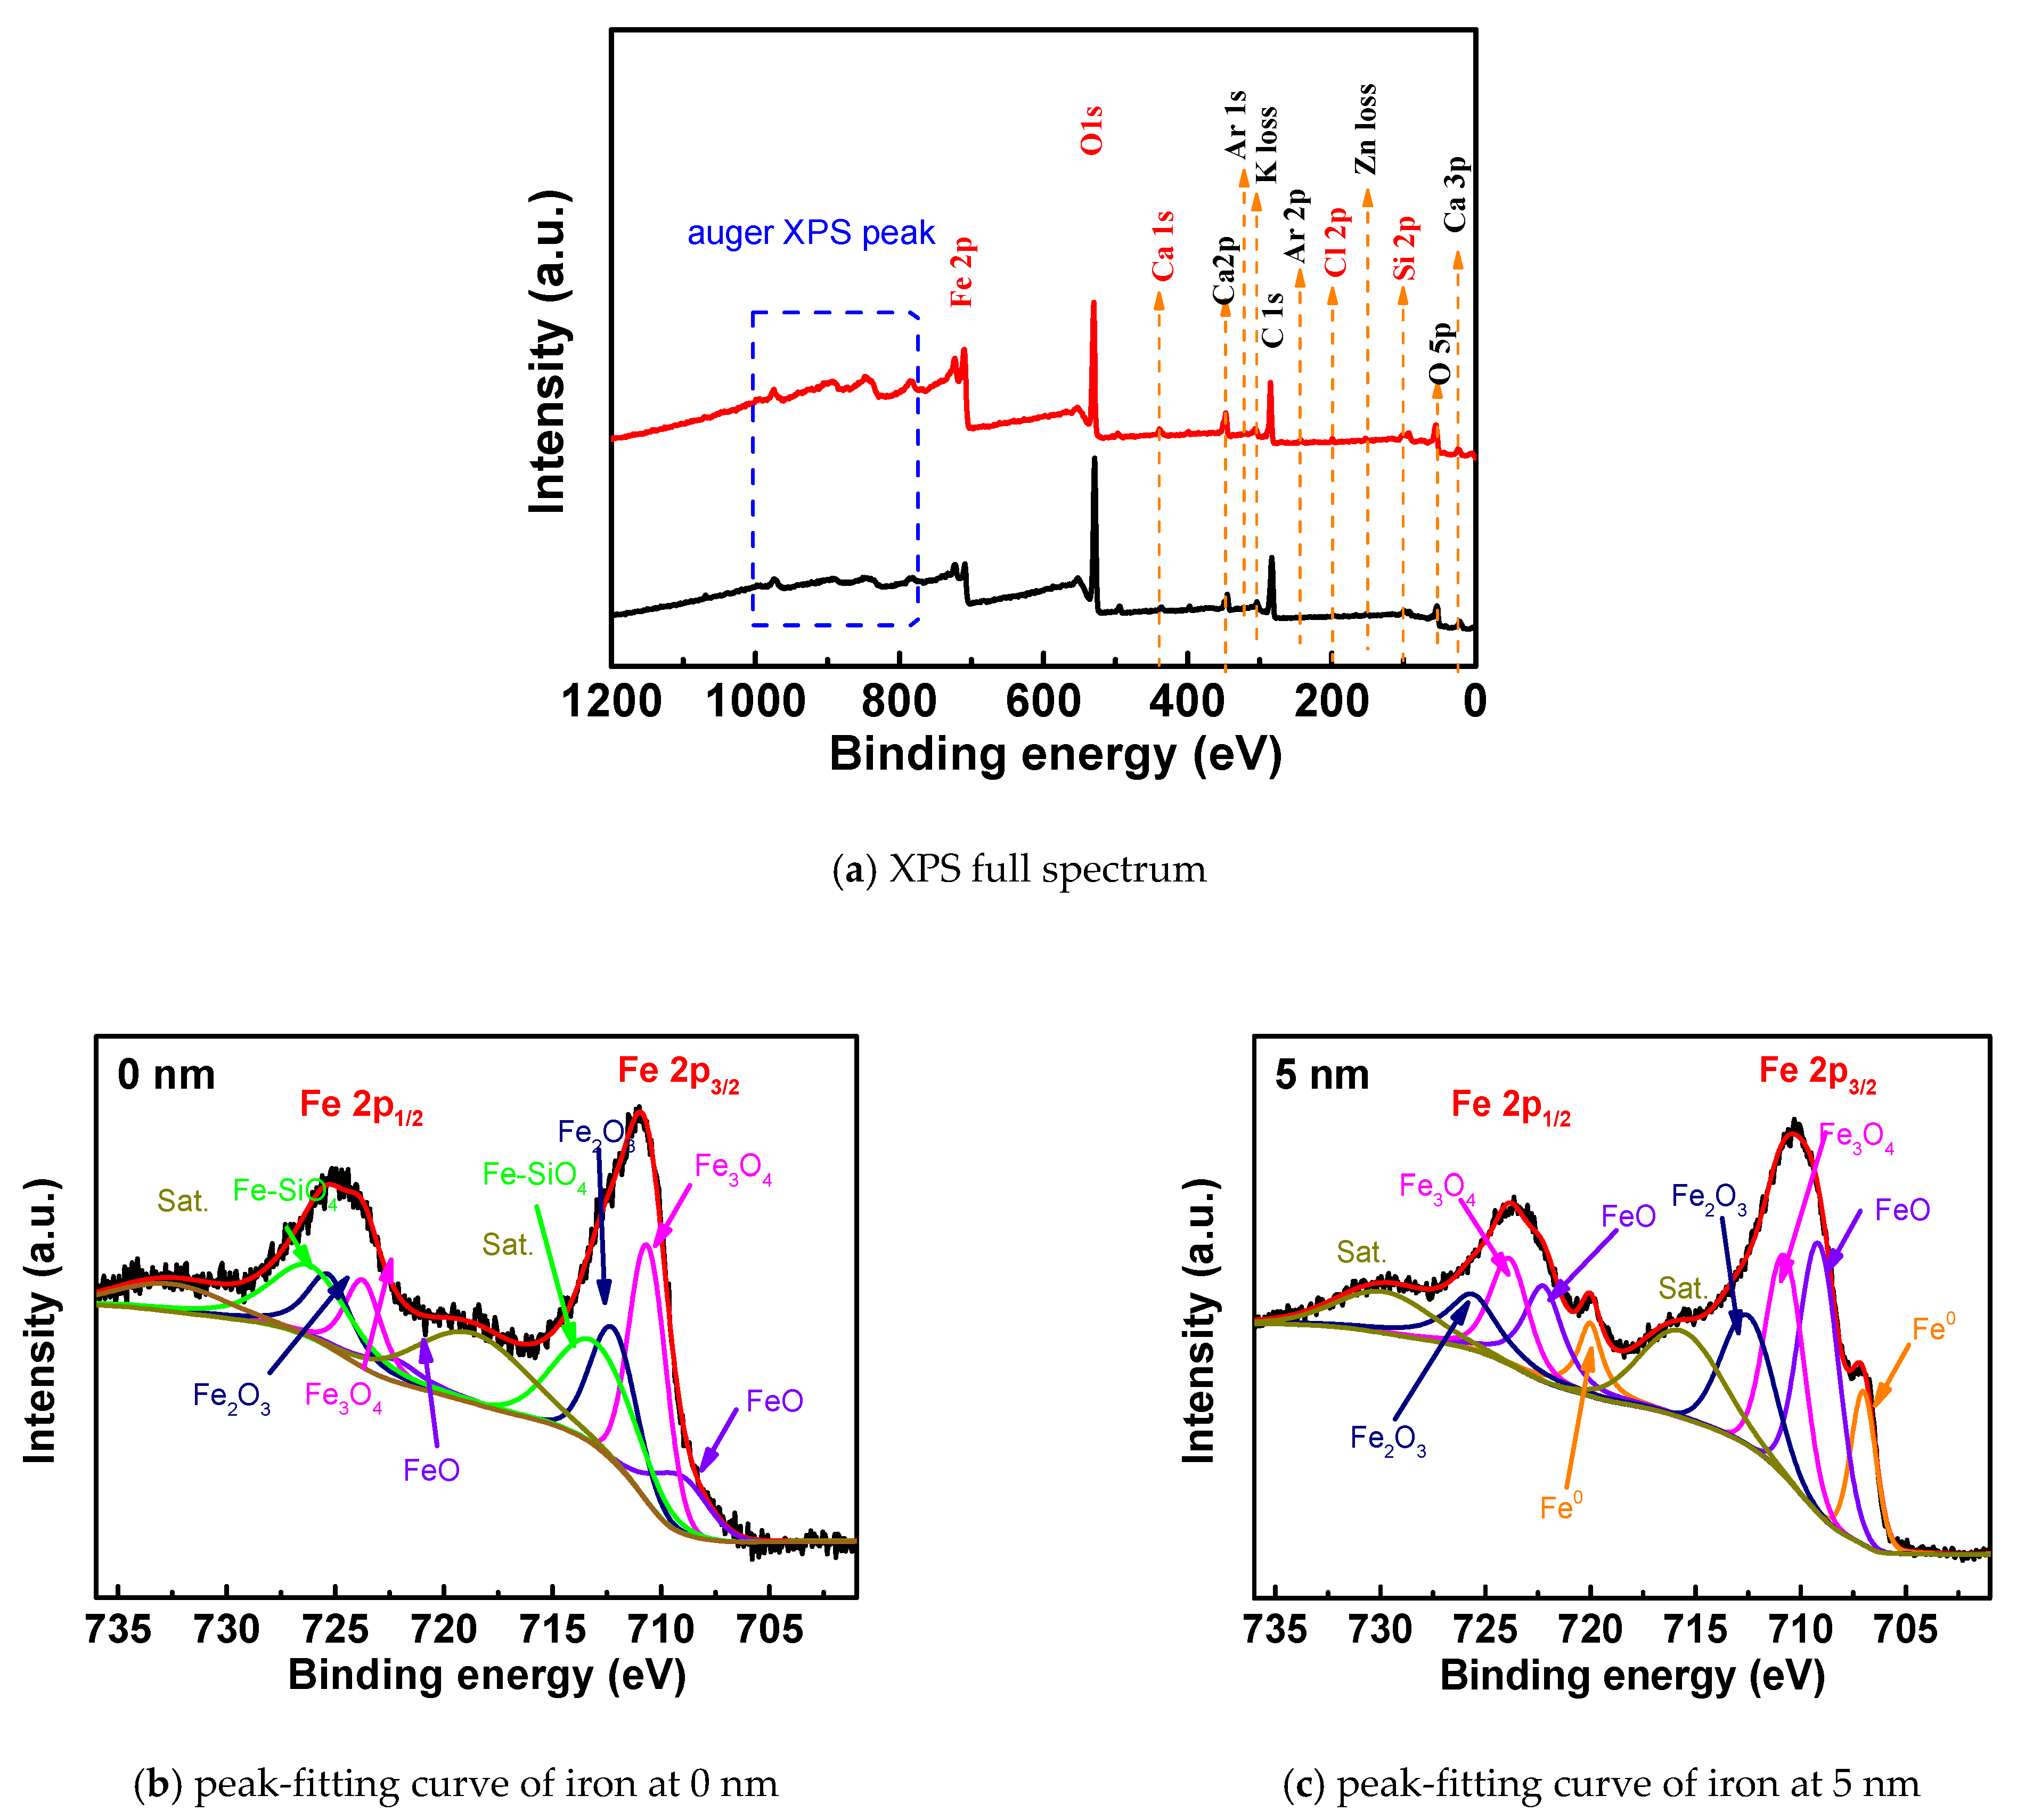
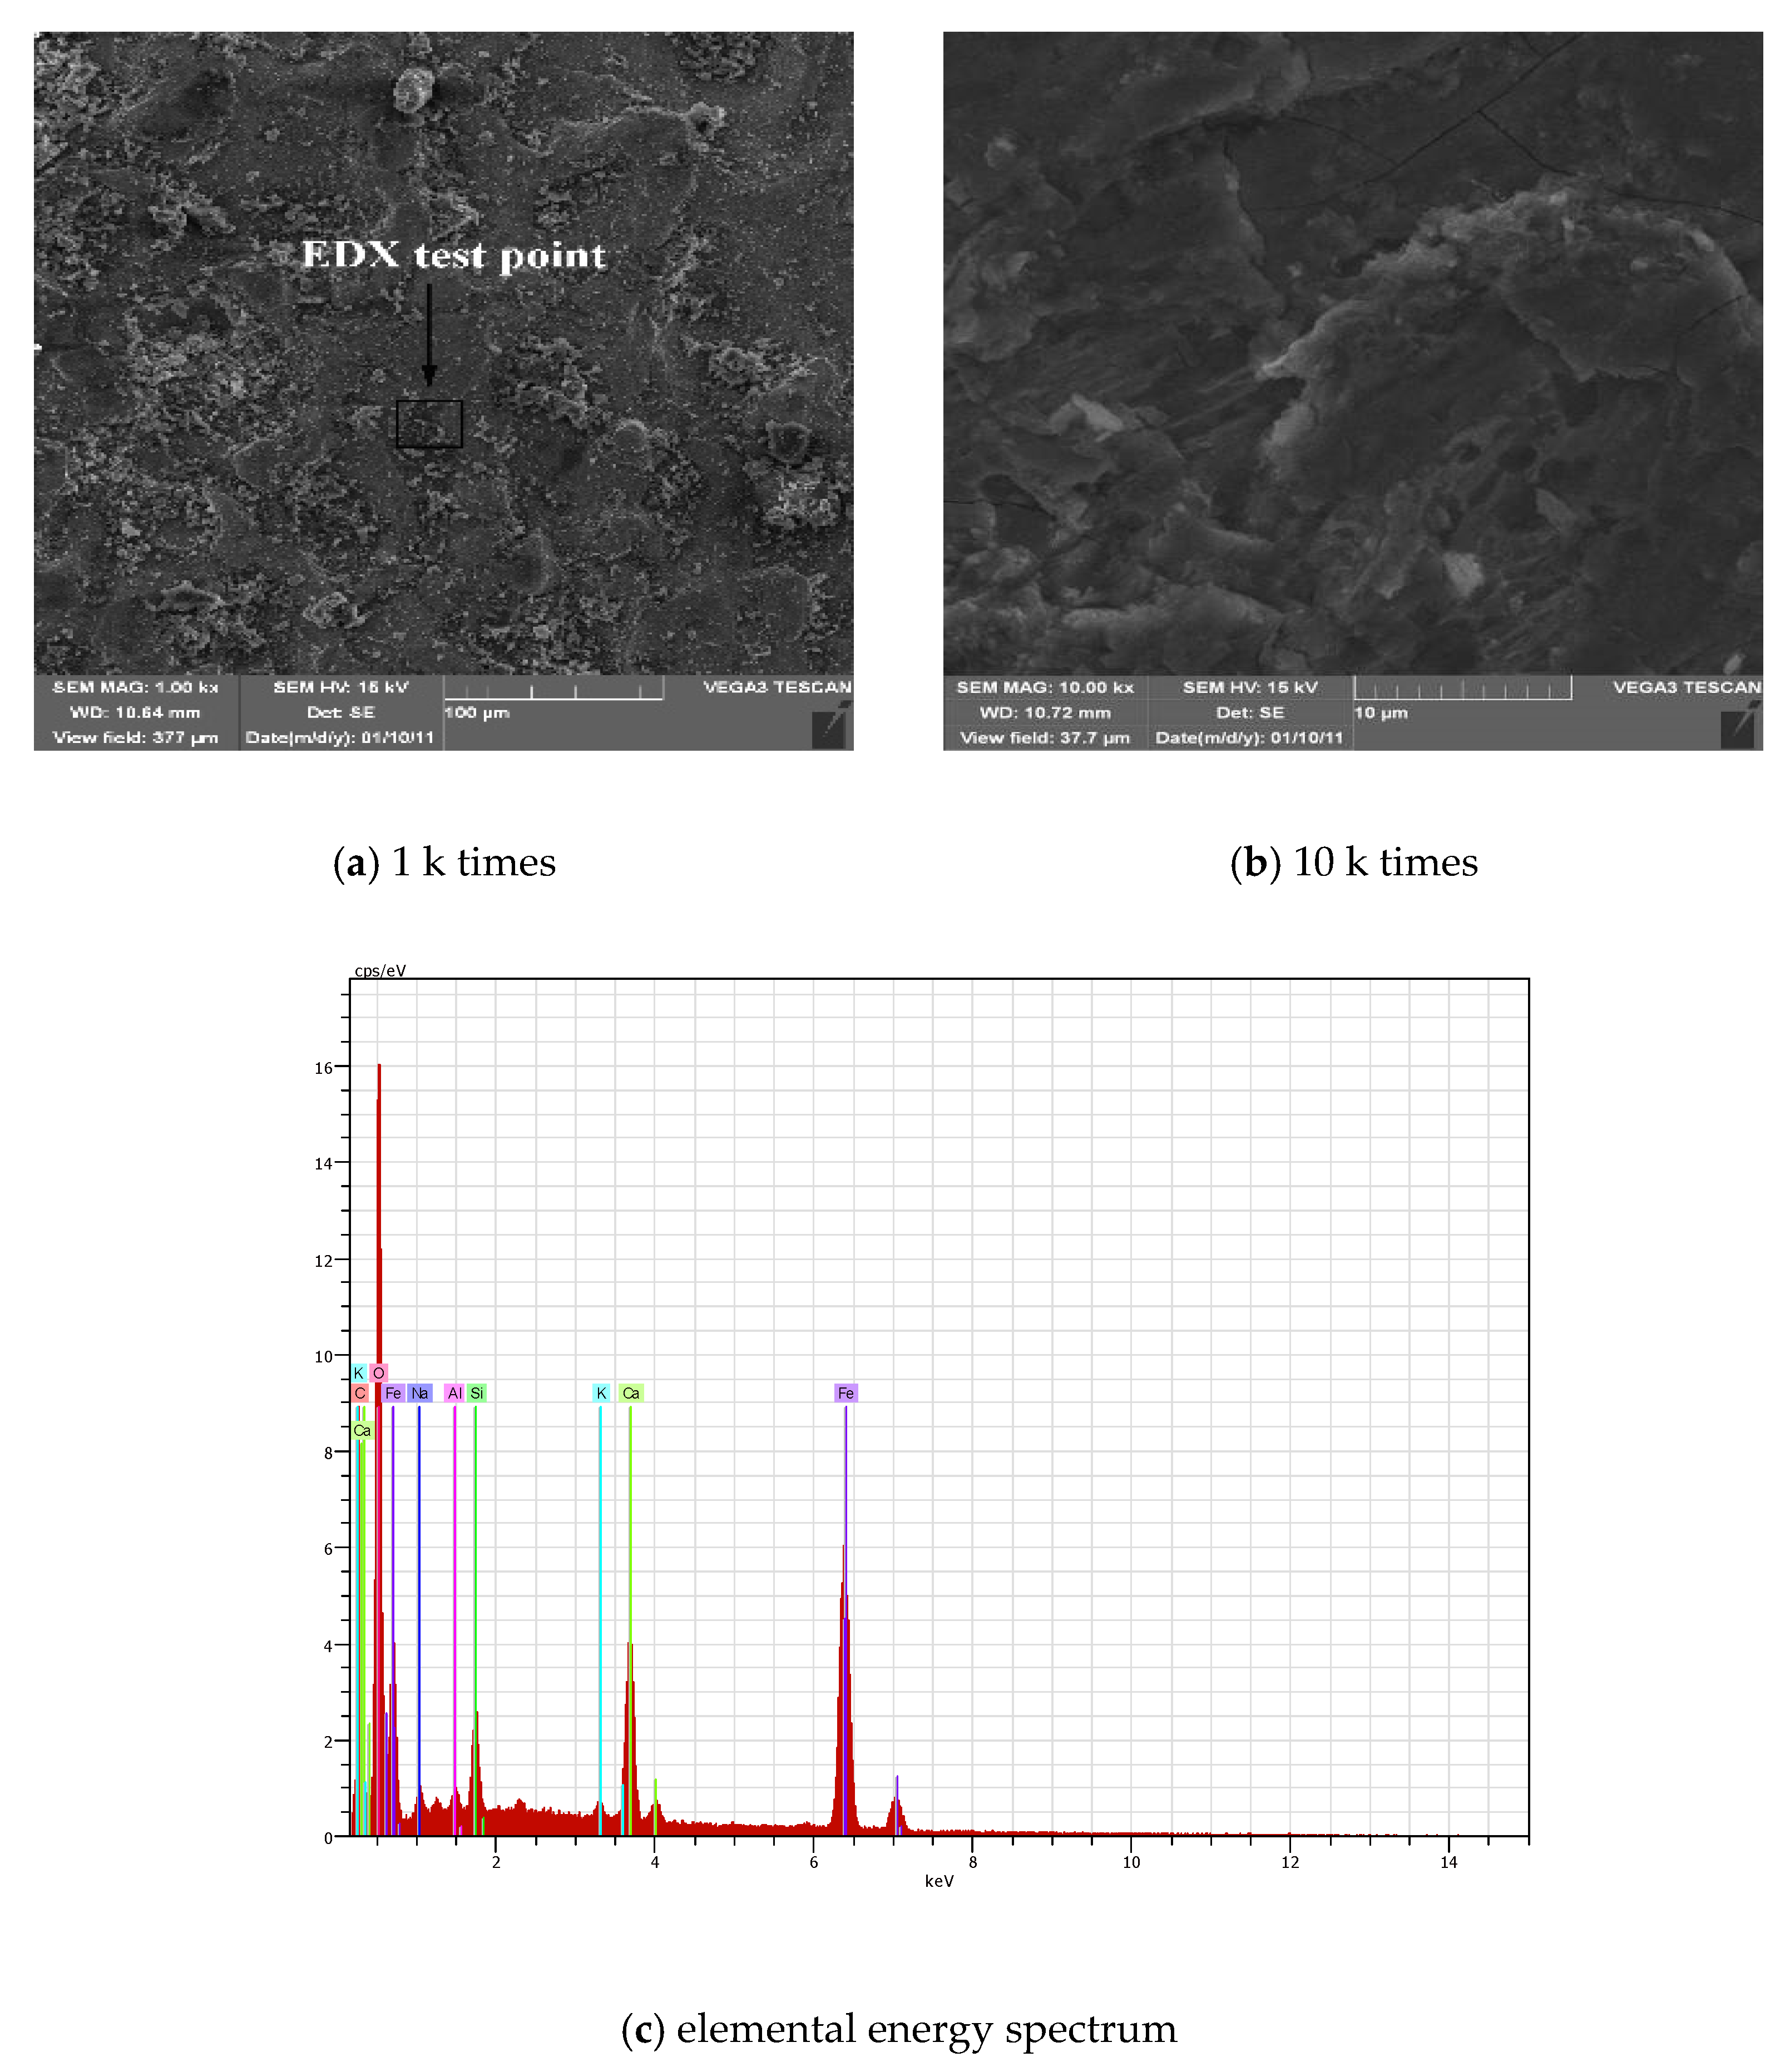
3.3. Analysis of Micro-Corrosion Components of Steel Bars under Carbonation Corrosion

Figure 5a shows the XPS full-scan line under carbonization corrosion. The main elements on the surface of the rust are oxygen, iron, calcium, silicon and carbon, and the contents of iron, oxygen, carbon and calcium are relatively high. Compared with the chloride salt attack conditions, except for chlorine, the other main elements are similar in content. The presence of calcium and silicon may be due to the two elements in the double salt formed by the reaction.
Figure 5b,c is the peak-fitting maps of the iron XPS peaks at 0 nm and 5 nm from the surface of the rust under carbonization, respectively. Table 4 shows the relative contents of the corresponding compounds after complete carbonization. It can be seen from the spectrum that the peak curve of Fe2p can be fitted with 10 peak curves. The corresponding iron compounds at 0 nm are FeO, Fe3O4, Fe2O3 and Fe–SiO4. After quantitative analysis, the corresponding content was 34.10%, 21.1%, and 14.8%. The corresponding compounds at 5 nm are the same, and the contents are 29%, 21.6% and 21.7%, respectively, besides Fe of 5.9%. Fe–SiO4 only exists at 0 nm, and there is an iron elemental substance at 5 nm, indicating that the site is not completely rusted. Compared with the corrosion environment of chloride salt, the composition of steel rust under carbonization is mostly iron oxide content, mainly including Fe3O4 and FeO. This confirms the findings of [29]. This is because, in the carbonization environment, the intrusion of carbon dioxide reduces the pH of the cement pore solution, causing the invading oxygen and water to chemically react with the iron in the steel bar, thereby causing macro-current corrosion at the passivation film. Compared with the 0.5% chloride salt attack, the proportion of iron oxides in the products increased significantly, and the content of double salt formed by the reaction of cementitious materials decreased significantly, indicating that the degree of corrosion of steel bars under full carbonization conditions is greater than that under the chloride salt.
Figure 6a,b show electron micrographs of the rusted surface of the steel bar under carbonization. When the electron microscope image is enlarged by 1 k times, the surface of the steel corrosion is loose and porous, the whole surface is relatively uniform, and there is no local large protrusion or depression, indicating that the corrosion is more uniform under carbonization. When the electron microscope image is enlarged to 10 k times, the corrosion pattern is significantly different from that caused by chloride salt erosion. The surface of the steel bar is uniformly attached with particulate matter, the pore structure is obvious, and the texture becomes loose and porous. In the rust caused by corrosion of chloride salt, the microstructure is mainly layered, and obvious cracks appear. Figure 6c shows an elemental energy spectrum corresponding to the corrosion of the steel surface. As seen from Table 5, the composition of the rust is still dominated by iron oxides, and some of the silica is contained, which may be caused by the cement paste particles attached to the surface of the steel disc.

3.4. Analysis of Micro-Corrosion Components of Steel Bars under Composite Corrosion

Figure 7a shows the XPS full-scan line diagrams in the case of chloride and carbon composite corrosion. The main elements on the surface of steel corrosion are oxygen, iron, calcium, silicon, chlorine and carbon, among which the contents of iron, oxygen, carbon and calcium are relatively high. The main elements are similar to the main elements of steel corrosion caused by the corrosion of chloride salts. Although the corrosive components in different corrosive environments are iron oxides, the specific composition content is different.
Figure 7b,c show the XPS peak-fitting maps of the iron elements of the steel bar at 0 nm and 5 nm from the surface under the combined corrosion conditions, respectively. Table 6 shows the relative content of the corresponding compounds after composite corrosion. It can be seen from the spectra that the two peaks of Fe2p can be fitted with 10 peak curves. The corresponding iron compounds at 0 nm are FeO, Fe3O4, Fe2O3 and Fe–SiO4. After quantitative analysis, the corresponding content was 8.9%, 24.2%, 19.4% and 28%. The iron compounds at 5 nm are Fe, FeO, Fe3O4 and Fe2O3. The contents are corresponding to 11.5%, 27%, 23% and 24.3%, respectively. The difference between the 0 nm and 5 nm rust components on the surface of the rust is small. The outside of the passivation film reacts with the cement slurry to form Fe–SiO4. Compared with single-factor corrosion conditions, the relative content of iron oxides in chloride and carbonized composite corrosion conditions is the highest. The corrosion degree is relatively high for the three conditions. When the steel bars are corroded, FeO and Fe2O3 on the surface of the passivation film are induced to lose iron to form iron ions. After the passivation film is destroyed, it becomes unstable, and the surface becomes loose and porous. In addition, the Fe element produces Fe2+ under the action of chloride ions, and the oxygen and water in the intrusion test specimen are oxidized to become Fe3+. Therefore, the corrosion product of the steel bar contains FeO, which also includes Fe2O3.
Figure 8a,b show SEM images of steel corrosion in the case of chloride salt and carbonized composite corrosion. Figure 8a is an SEM image magnified 1 k times the surface of the steel bar. It is easy to see that the surface is uneven and cracks are present, accompanied by protrusions and layered substances, indicating that the original steel passivation film is corroded and destroyed, and chloride ions were penetrated into the steel bars, causing corrosion of the steel bar. Figure 8b is an SEM image showing the surface of the steel bar magnified 10 k times. It is easy to see that there are obvious cracks on the surface of the steel bar. Since chloride ions, water, oxygen and carbon dioxide in the carbonized environment can be accelerated into the test specimen through tiny cracks and loose structures, the corrosion rate of the steel bar is significantly improved compared with the single factor corrosion condition. The surface of the steel bar produces more rust, which in turn makes the cracks increasingly larger, and eventually, the lamellar rust is cracked and peeled off. Combined with the results of the energy spectrum analysis of Figure 8c and Table 7, it can be seen that compared with the single chloride salt and carbonized corrosion environment, the oxide content of iron in the complex corrosion environment is significantly increased, and the degree of corrosion is significantly improved. This is consistent with the results of the XPS component analysis described earlier. This indicates the combination of chloride and carbonation contributes to the breakdown of passivation film, which is consistent with [30].

4. Conclusions

  • In all three corrosive environments, the outside of the passivation film reacts with the cement slurry to produce Fe–SiO4. Fe can be detected in the inner side of the passivation film, indicating that the inner side is not completely corroded;
  • The morphology of the corrosion is different in the three environments. In a chloride environment, corrosion products have obvious cracks, and the local layered structure is dense. The rusting process is accompanied by the expansion of the steel volume. In a carbonation environment, the surface of the steel corrosion is relatively uniform, and the structure has no local large protrusions or depressions, showing a uniform granular structure and loose texture. With the combination of chloride and combination, the surface of the structural layer of steel corrosion was uneven and accompanied by protrusions and layered materials, the delamination phenomenon was obvious, cracking and spalling occurred, and the local cracking range and size increased;
  • The composition of the corrosion substances in the three corrosion environments is the same, and the content is different. They are mainly composed of FeO, Fe3O4, Fe2O3 and Fe–SiO4. The content of iron oxide increases from chloride salt carbonization to composite environment, indicating that the corrosion degree intensifies successively;
  • The present findings show that the corrosion degree is the strongest under the composite environment of carbonization and chloride salt. Subsequent work will focus on the expansion effect of corrosion products on cement-based materials and the crack evolution in this environment.

Author Contributions

Writing—original draft preparation, investigation, data curation, X.L.; investigation, writing—review and editing, conceptualization, validation, J.L.; methodology, visualization, J.W.; data processing, H.W. All authors have read and agreed to the published version of the manuscript.

Funding

This research was funded by the National Natural Science Foundation of China (51778302, 51878360), Natural Science Foundation of Zhejiang Province (LQ20E080011), Ningbo Science and Technology Project (202002N3117), Jinhua Science and Technology Research Project (2019-4-167, 2019-4-172, 2019-1-036).

Institutional Review Board Statement

Ethical review and approval were waived for this study, due to studies not involving humans or animals.

Informed Consent Statement

Informed consent was obtained from all subjects involved in the study.

Data Availability Statement

Data is contained within the article.

Conflicts of Interest

The authors declare no conflict of interest.

References

  1. Geng, W.C.; Zhang, P.; Li, D.; Liu, Z.L.; Zhao, T.J. Application and current status of reinforcement corrosion monitoring in concrete. Concrete 2018, 2, 150–153. [Google Scholar] [CrossRef]
  2. Chen, E.; Leung, C.K.Y. A coupled diffusion-mechanical model with boundary element method to predict concrete cover cracking due to steel corrosion. Corros. Sci. 2017, 126, 180–196. [Google Scholar] [CrossRef]
  3. Lu, C.; Yuan, S.; Liu, R. Experimental and probabilistic analysis of time to corrosion-induced cover cracking for marine reinforced concrete structures. Corros. Eng. Sci. Tech. 2017, 52, 124–133. [Google Scholar] [CrossRef]
  4. Chen, X.X.; Niu, D.T. Seismic response analysis of corroded reinforced concrete frame. Xi’an Arch. Technol. Nat. Sci. Ed. 2018, 50, 361–367. [Google Scholar]
  5. Xu, C.; Wang, C.K.; Jin, W.L. Interaction between chloride ion erosion and carbonization in concrete. J. Build. Mater. 2011, 14, 376–380. [Google Scholar] [CrossRef]
  6. Stewart, M.G.; Wang, X.; Nguyen, M.N. Climate change impact and risks of concrete infrastructure deterioration. Eng. Struct. 2011, 33, 1326–1337. [Google Scholar] [CrossRef]
  7. Li, Z.; Jin, Z.Q.; Shao, S.S.; Xu, X. A Review on Reinforcement Corrosion Mechanics and Monitoring Techniques in Concrete in Marine Environment. Mater. Rev. A Rev. Pap. 2018, 32, 4170–4181. [Google Scholar] [CrossRef]
  8. Zhang, P.; Liu, Z.; Wang, Y.; Yang, J.; Han, S.; Zhao, T. 3D neutron tomography of steel reinforcement corrosion in cement-based composites. Constr. Build. Mater. 2018, 162, 561–565. [Google Scholar] [CrossRef]
  9. Niu, D.T.; Sun, C.T. Study on Interaction of Concrete Carbonation and Chloride Corrosion. Chin. Ceram. Soc. 2013, 41, 1094–1099. [Google Scholar] [CrossRef]
  10. Song, X.F.; Zhang, X.Y.; Gao, R. Corrosion Behavior of Steel Embedded in Concrete under Interaction of Carbonization and Chloride Ion. J. Build. Mater. 2014, 17, 892–895. [Google Scholar] [CrossRef]
  11. Abbas, S.A.; Rafiq, M.I.; Tsioulou, O. Combined impact of carbonation and crack width on the Chloride Penetration and Corrosion Resistance of Concrete Structures. Cem. Concr. Comp. 2021, 115, 1–28. [Google Scholar] [CrossRef]
  12. Wang, H.; Zhang, A.L.; Zhang, L.C.; Liu, J.Z.; Han, Y.; Wang, J.M. Research on the influence of carbonation on the content and state of chloride ions and the following corrosion resistance of steel bars in cement paste. Coatings 2020, 10, 1071. [Google Scholar] [CrossRef]
  13. Malheiro, R.; Games, A.; Meira, G.; Amorim, M.T.; Castro, J. Effect of coupled deterioration by chloride and carbonation on chloride ions transport in concrete. RILEM Tech. Lett. 2020, 5, 56–62. [Google Scholar] [CrossRef]
  14. Shi, J.J.; Wu, M.; Ming, J. Degradation effect of carbonation on electrochemical behavior of 2304 duplex stainless steel in simulated concrete pore solutions. Corros. Sci. 2020, 177. [Google Scholar] [CrossRef]
  15. Aperador, W.; Cortes, J.; Carrillo, J. Corrosion of Reinforcing Bars Astm A706 in Self-Compacting Concrete Subjected to Chloride Attack and Carbonation. Adv. Mater. Res. 2014, 1016, 315–319. [Google Scholar] [CrossRef]
  16. Nguyen, T.T.H.; Bary, B.; De Larrard, T. Coupled carbonation-rust formation-damage modeling and simulation of steel corrosion in 3D mesoscale reinforced concrete. Cem. Concr. Res. 2015, 74, 95–107. [Google Scholar] [CrossRef]
  17. Ye, C.Q.; Hu, R.G.; Dong, S.G.; Zhang, X.J.; Pan, J.S. EIS analysis on chloride-induced corrosion behavior of reinforcement steel in simulated carbonated concrete pore solutions. J. Electroanal. Chem. 2013, 688, 275–281. [Google Scholar] [CrossRef]
  18. Shen, X.H.; Jiang, W.Q.; Hou, D.S.; Hu, Z.; Yang, J.; Liu, F.Q. Numerical study of carbonation and its effect on chloride binding in concrete. Cem. Concr. Com. 2019, 104. [Google Scholar] [CrossRef]
  19. Li, C.; Chen, Q.; Wang, R.L.; Wu, M.X.; Jiang, Z.W. Corrosion assessment of reinforced concrete structures exposed to chloride environments in underground tunnels: Theoretical insights and practical data interpretations. Cem. Concr. Com. 2020, 112. [Google Scholar] [CrossRef]
  20. Ghods, P.; Isgor, O.B.; Bensebaa, F.; Kingston, D. Angle-resolved XPS study of carbon steel passivity and chloride-induced depassivation in simulated concrete pore solution. Corros. Sci. 2012, 58, 159–167. [Google Scholar] [CrossRef]
  21. Liu, J.P.; Chen, C.C.; Cai, J.S.; Cui, G. 1,3-Bis-dibutylaminopropan-2-ol as inhibitor for reinforcement steel in chloride-contaminated simulated concrete pore solution. Mater. Corros. 2013, 64, 1075–1081. [Google Scholar] [CrossRef]
  22. Cao, F.T.; Wei, J.; Dong, J.; Ke, W. The Corrosion Inhibition Effect of Phytic Acid on 20SiMn Steel in Simulated Carbonated Concrete Pore Solution. Corros. Sci. 2015, 100, 365–376. [Google Scholar] [CrossRef]
  23. Verbruggen, H.; Terryn, H.; Graeve, I.D. Inhibitor evaluation in different simulated concrete pore solution for the protection of steel rebars. Constr. Build. Mater. 2016, 124, 887–896. [Google Scholar] [CrossRef]
  24. Li, X.Z.; Liu, J.Z.; Wang, J.M.; Geng, J.D. Microstructure of passive film on steel in synthetic concrete pore solution in presence chloride and nitrite. Int. J. Electrochem. Sci. 2019, 14, 8624–8638. [Google Scholar] [CrossRef]
  25. Chen, L.F. Comparative Study on the Microstructure and the Volume Expansion Ratio of Corrosion Product under Different Corrosion Environments. Master’s Thesis, Shenzhen University, Shenzhen, China, 2016. [Google Scholar]
  26. Otieno, M.B.; Beushausen, H.D.; Alexander, M.G. Modelling corrosion propagation in reinforced concrete structures—A critical review. Cem. Concr. Comp. 2011, 33, 240–245. [Google Scholar] [CrossRef]
  27. Wang, Q.; Wang, D.Q.; Chen, H.H. The role of fly ash microsphere in the microstructure and macroscopic properties of high-strength concrete. Cem. Concr. Comp. 2017, 83, 125–137. [Google Scholar] [CrossRef]
  28. Hu, J.Y.; Cao, S.A.; Xie, J.L. EIS study on the corrosion behavior of rusted carbon steel in 3% NaCl solution. Anti-Corros. Methods Mater. 2013, 60, 100–105. [Google Scholar] [CrossRef]
  29. Poyet, S.; Dridi, W.; Hostis, V.; Meinel, D. Microstructure and diffusion coefficient of an old corrosion product layer and impact on steel rebar corrosion in carbonated concrete. Corros. Sci. 2017, 125. [Google Scholar] [CrossRef]
  30. Zhang, S.H.; Hou, L.F.; Du, H.Y.; Wei, H.; Liu, B.S.; Wei, Y.H. A study on the interaction between chloride ions and CO2 towards carbon steel corrosion. Corros. Sci. 2020, 167. [Google Scholar] [CrossRef]
Figure 1. View of the reinforced wafer’s position.
Coatings 11 00241 g001
Figure 2. Corrosion state of steel wafers under different conditions.
Coatings 11 00241 g002
Figure 3. XPS full-spectrum and iron peak-fitting curves of rust under chloride corrosion.
Coatings 11 00241 g003
Figure 4. SEM-EDX diagrams of rust under corrosion of chloride salt.
Coatings 11 00241 g004
Figure 5. XPS full spectra and iron peak-fitting curves of rust under carbonization corrosion.
Coatings 11 00241 g005
Figure 6. SEM-EDX diagrams of rust under carbonization corrosion.
Coatings 11 00241 g006
Figure 7. XPS full spectra and iron element fitting curves of rust under compound corrosion.
Coatings 11 00241 g007
Figure 8. SEM-EDX diagrams of rust under compound corrosion conditions.
Coatings 11 00241 g008
Table 1. Mixing ratio of cement paste.
Cement/gWater/gCl-/%NaCl/g
535.35160.6100
0.54.41
Table 2. XPS peak-fitting data of Fe elements on the surface of steel rust (c(Cl-) = 0.5%).
DepthComponentsPosition
/(eV)
Area
/(eV)2
Half Width
/mV
Relative Content
Respectively (%)
Relative Content
(%)
0 nmFeO709.127062.0512.319.6
722.216272.057.3
0 nmFe3O4710.636031.9616.426.4
723.722171.9610.0
0 nmFe2O3712.226792.1212.118.3
725.313902.126.2
0 nmFe–SiO4713.026974.0012.220.9
726.119274.008.7
0 nmSat.718.221534.449.714.8
731.911255.705.1
5 nmFe0707.117301.584.28
720.217331.583.8
5 nmFeO709.377582.0717.926.7
722.438512.078.8
5 nmFe3O4710.966252.0115.424.5
724.039772.019.1
5 nmFe2O3712.755852.7612.920.5
725.833242.767.6
5 nmSat.716.050024.3311.520.3
729.938625.618.8
Table 3. Energy spectrum analysis of elemental content of rust when the concentration of Cl- is 0.5%.
ElementUnn. C/wt %Norm. C/wt %Atom. C/at %CompoundComp. C
Oxygen23.8025.4051.41FeO0.00
Iron56.5260.3234.9857.61
Silicon2.933.133.60SiO26.69
Calcium8.208.757.07CaO12.24
Potassium0.510.550.45K2O0.66
Sodium1.201.281.80Na2O1.72
Carbon0.000.000.00-0.00
Aluminum0.540.580.68Al2O31.09
Table 4. XPS peak-fitting data of Fe elements on the rust surface under carbonization corrosion.
DepthComponentsPosition (eV)AreaHalf-WidthRelative Content
Respectively (%)
Relative Content
(%)
0 nmFeO709.142802.1120.734.1
722.227792.1113.4
0 nmFe3O4710.527571.7513.321.1
723.616211.757.8
0 nmFe2O3712.221791.8110.514.8
725.39001.814.3
0 nmFe–SiO4713.017383.138.314.7
726.213463.136.4
0 nmSat.718.423644.0511.415.3
731.78104.243.9
5 nmFe0707.08521.612.65.9
720.110791.613.3
5 nmFeO709.159912.3118.229
722.235662.3110.8
5 nmFe3O4710.748172.2314.621.6
723.823162.237.0
5 nmFe2O3712.544992.8913.621.7
725.626402.898.1
5 nmSat.715.743804.2813.322.8
729.627875.968.5
Table 5. Energy spectrum analysis of the element content of rust under carbonization corrosion.
ElementUnn. C/wt %Norm. C/wt %Atom. C/wt %CompoundComp. C
Oxygen26.0228.1252.40FeO0.00
Iron46.3350.0726.7366.42
Silicon6.827.387.83SiO215.78
Calcium6.216.714.99CaO9.38
Sodium3.193.454.47Na2O4.65
Carbon0.000.000.00-0.00
Aluminum0.830.901.00Al2O31.70
Table 6. XPS peak-fitting data of Fe on the surface of steel corrosion under composite corrosion.
DepthComponentsPosition (eV)AreaHalf Width
/mV
Relative Content
Respectively (%)
Relative Content
(%)
0 nmFeO709.117212.985.78.9
722.29862.983.2
0 nmFe3O4710.651652.0017.124.2
723.721172.007.1
0 nmFe2O3712.134222.4611.319.4
725.224062.468.1
0 nmFe–SiO4713.044914.3114.928
726.139094.3113.1
0 nmSat.718.642416.0314.219.5
732.016055.785.3
5 nmFe0707.047681.406.911.5
720.031651.404.6
5 nmFeO709.112,5272.2118.327
722.259762.218.7
5 nmFe3O4710.799132.1514.523
723.857312.158.5
5 nmFe2O3712.579582.9314.824.3
725.650232.939.5
5 nmSat.715.682684.541114.2
729.848325.283.2
Table 7. Energy spectrum analysis of the elemental content of rust under compound conditions.
ElementUnn. C/wt %Norm. C/wt %Atom. C/wt %CompoundComp. C
Oxygen24.3325.3851.09FeO0.00
Iron55.8758.5333.7575.30
Silicon2.632.763.16SiO25.91
Calcium9.8510.328.29CaO14.44
Potassium0.580.610.50K2O0.74
Sodium1.601.672.34Na2O2.26
Carbon0.000.000.00-0.00
Aluminum0.690.720.86Al2O30.19
Publisher’s Note: MDPI stays neutral with regard to jurisdictional claims in published maps and institutional affiliations.

