Article

Modeling of Poly(methylmethacrylate) Viscous Thin Films by Spin-Coating

Department of Chemistry, University of Rhode Island, Kingston, RI 02881, USA
*
Author to whom correspondence should be addressed.
Coatings 2021, 11(2), 198; https://doi.org/10.3390/coatings11020198
Submission received: 18 January 2021 / Revised: 30 January 2021 / Accepted: 3 February 2021 / Published: 9 February 2021
(This article belongs to the Special Issue Functional Thin Films: Synthesis, Properties, and Applications)

Abstract

:
A predictive film thickness model based on an accepted equation of state is applied to the spin-coating of sub-micron poly(methylmethacrylate) viscous thin films from toluene. Concentration effects on density and dynamic viscosity of the spin-coating solution are closely examined. The film thickness model is calibrated with a system-specific film drying rate and was observed to scale with the square root of spin speed. Process mapping is used to generate a three-dimensional design space for the control of film thickness.

1. Introduction

In this work, we report methods for the controlled deposition of poly(methylmethacrylate) (PMMA) coatings on glass slides. Owing to its high transparency, PMMA is often chosen as an optical substrate, so control of polymer film thickness is critical to determining the optical thickness, which, for example, can influence sensor efficiency and performance [1]. When used as a substrate for fluorophores, PMMA has been demonstrated to increase the stability of the fluorophore against both thermal and photo degradation [2]. Coatings are applied by spin-coating, a common process for the repeatable deposition of films of uniform thickness and surface roughness. Toluene is frequently used as solvent to dissolve PMMA in fundamental spin-coating studies [3,4,5]. The PMMA–toluene solution is miscible at all concentrations and has relatively weak solvent–solute interactions [6,7,8]. Newtonian fluid behavior has been demonstrated with linear shear stress and shear rates over a large concentration range [9].
In our previous studies of sensors composed of a fluorophore deposited on a polymer substrate [10], the thickness of the polymer layer was an important parameter in the sensor performance. In that study, the polymer thicknesses were thinner than typical, a few hundred nanometers, on the order of the wavelength of the light used. The previous studies examined polymer solutions of dilute to medium concentrations and thin films up to a few microns in thickness. The focus of this study is to analyze materials and fluid properties for process mapping of a predictive spin-coating model for depositing sub-micron polymer layers.

2. Materials and Methods

Glass microscope slides (~1 mm thick) were cut into 37.5 mm × 25 mm sections. Slides were cleaned and treated by submersion in ethanol (EtOH, 95%, Pharmco-Aaper, Brookfield, CT, USA), followed by 15 min of sonication, then rinsed with purified water, submerged in purified water, sonicated for an additional 15 min, and dried under N2.
Atactic PMMA (Mw~120,000, Polydispersity index 2.0–2.4) was obtained from Sigma-Aldrich and used without further purification. A 20 g/dL stock solution was prepared in toluene (Honeywell, HPLC grade, Smithfield, RI, USA). The polymer stock solution was sonicated for 8 h with intermittent shaking to ensure full solvation. The resulting solution was optically clear. Dilutions ranging from 0.75 to 10.00 g/dL were prepared directly from the stock.
The dynamic viscosity of the polymer solutions was measured with cylindrical spindles and a Brookfield DV2T spring-torque rotational viscometer (Middleboro, MA, USA) at a shear rate of 200 s−1. Sample temperature was measured by a thermocouple attached to the sample chamber and maintained at 20.0 °C.
A Laurell Technologies spin-coater was used for spin-coating films. An ultra-thin PMMA film was applied to the glass slides in dry conditions (<20% relative humidity) by depositing a 250 µL aliquot of polymer solution in the center of a slide and then spin-coating for 45 s, accelerating at 1080 s−2, and with a maximum rotation speed in the range of 400 to 8000 RPM. Spin-coating was carried out under a constant flow of dry N2 and films were air dried for 15 min and then transferred to an oven set at 60 °C for 2 min to facilitate residual solvent removal.
Fourier transform infrared (FTIR) spectra were obtained with a Perkin Elmer Spectrum 100 (Waltham, MA, USA) fitted with a diamond ATR crystal. Background and sample spectra were collected with 128 scans and a resolution of 4 cm−1.
Thermal mass loss experiments were performed with a TA Instruments (New Castle, DE, USA) thermogravimetric analyzer (TGA). Static evaporation rate ( ω = 0) investigations were conducted in open cylindrical aluminum pans (20 μL capacity, 5 mm diameter). Samples were held isothermally at an ambient temperature. Dry compressed air was used to purge the balance and sample at a flow rate of 25 mL/min. A second investigation for polymer characterization was conducted with open aluminum sample pans (80 μL). Samples were first equilibrated at 30 °C and then heated to 500 °C at a rate of 10 °C/min. Dry nitrogen was used to purge the balance and sample at flow rates of 40 and 30 mL/min, respectively.
Reflection spectra of polymer films in the range of 400–900 nm were acquired with a Filmetrics F40 microscope thin film analyzer (Fairport, NY, USA) using a tungsten–halogen light source. PMMA thin film optical constants for the refractive index, n, and absorption coefficient, k, were obtained from the literature [11]. Spectral fitting and film thickness calculations were performed with Filmeasure software (version 7.18.6). Examples of spectra and fits are given in Figure S1. Transmittance spectra of polymer films were collected with a Perkin Elmer Lambda 1050 UV/Vis spectrometer (Waltham, MA, USA). The slit width and integration time were set at 2 nm and 0.20 s, respectively. Wavelengths generated from tungsten–halogen and deuterium lamps were collected in the 1100 to 300 nm range.

3. Results

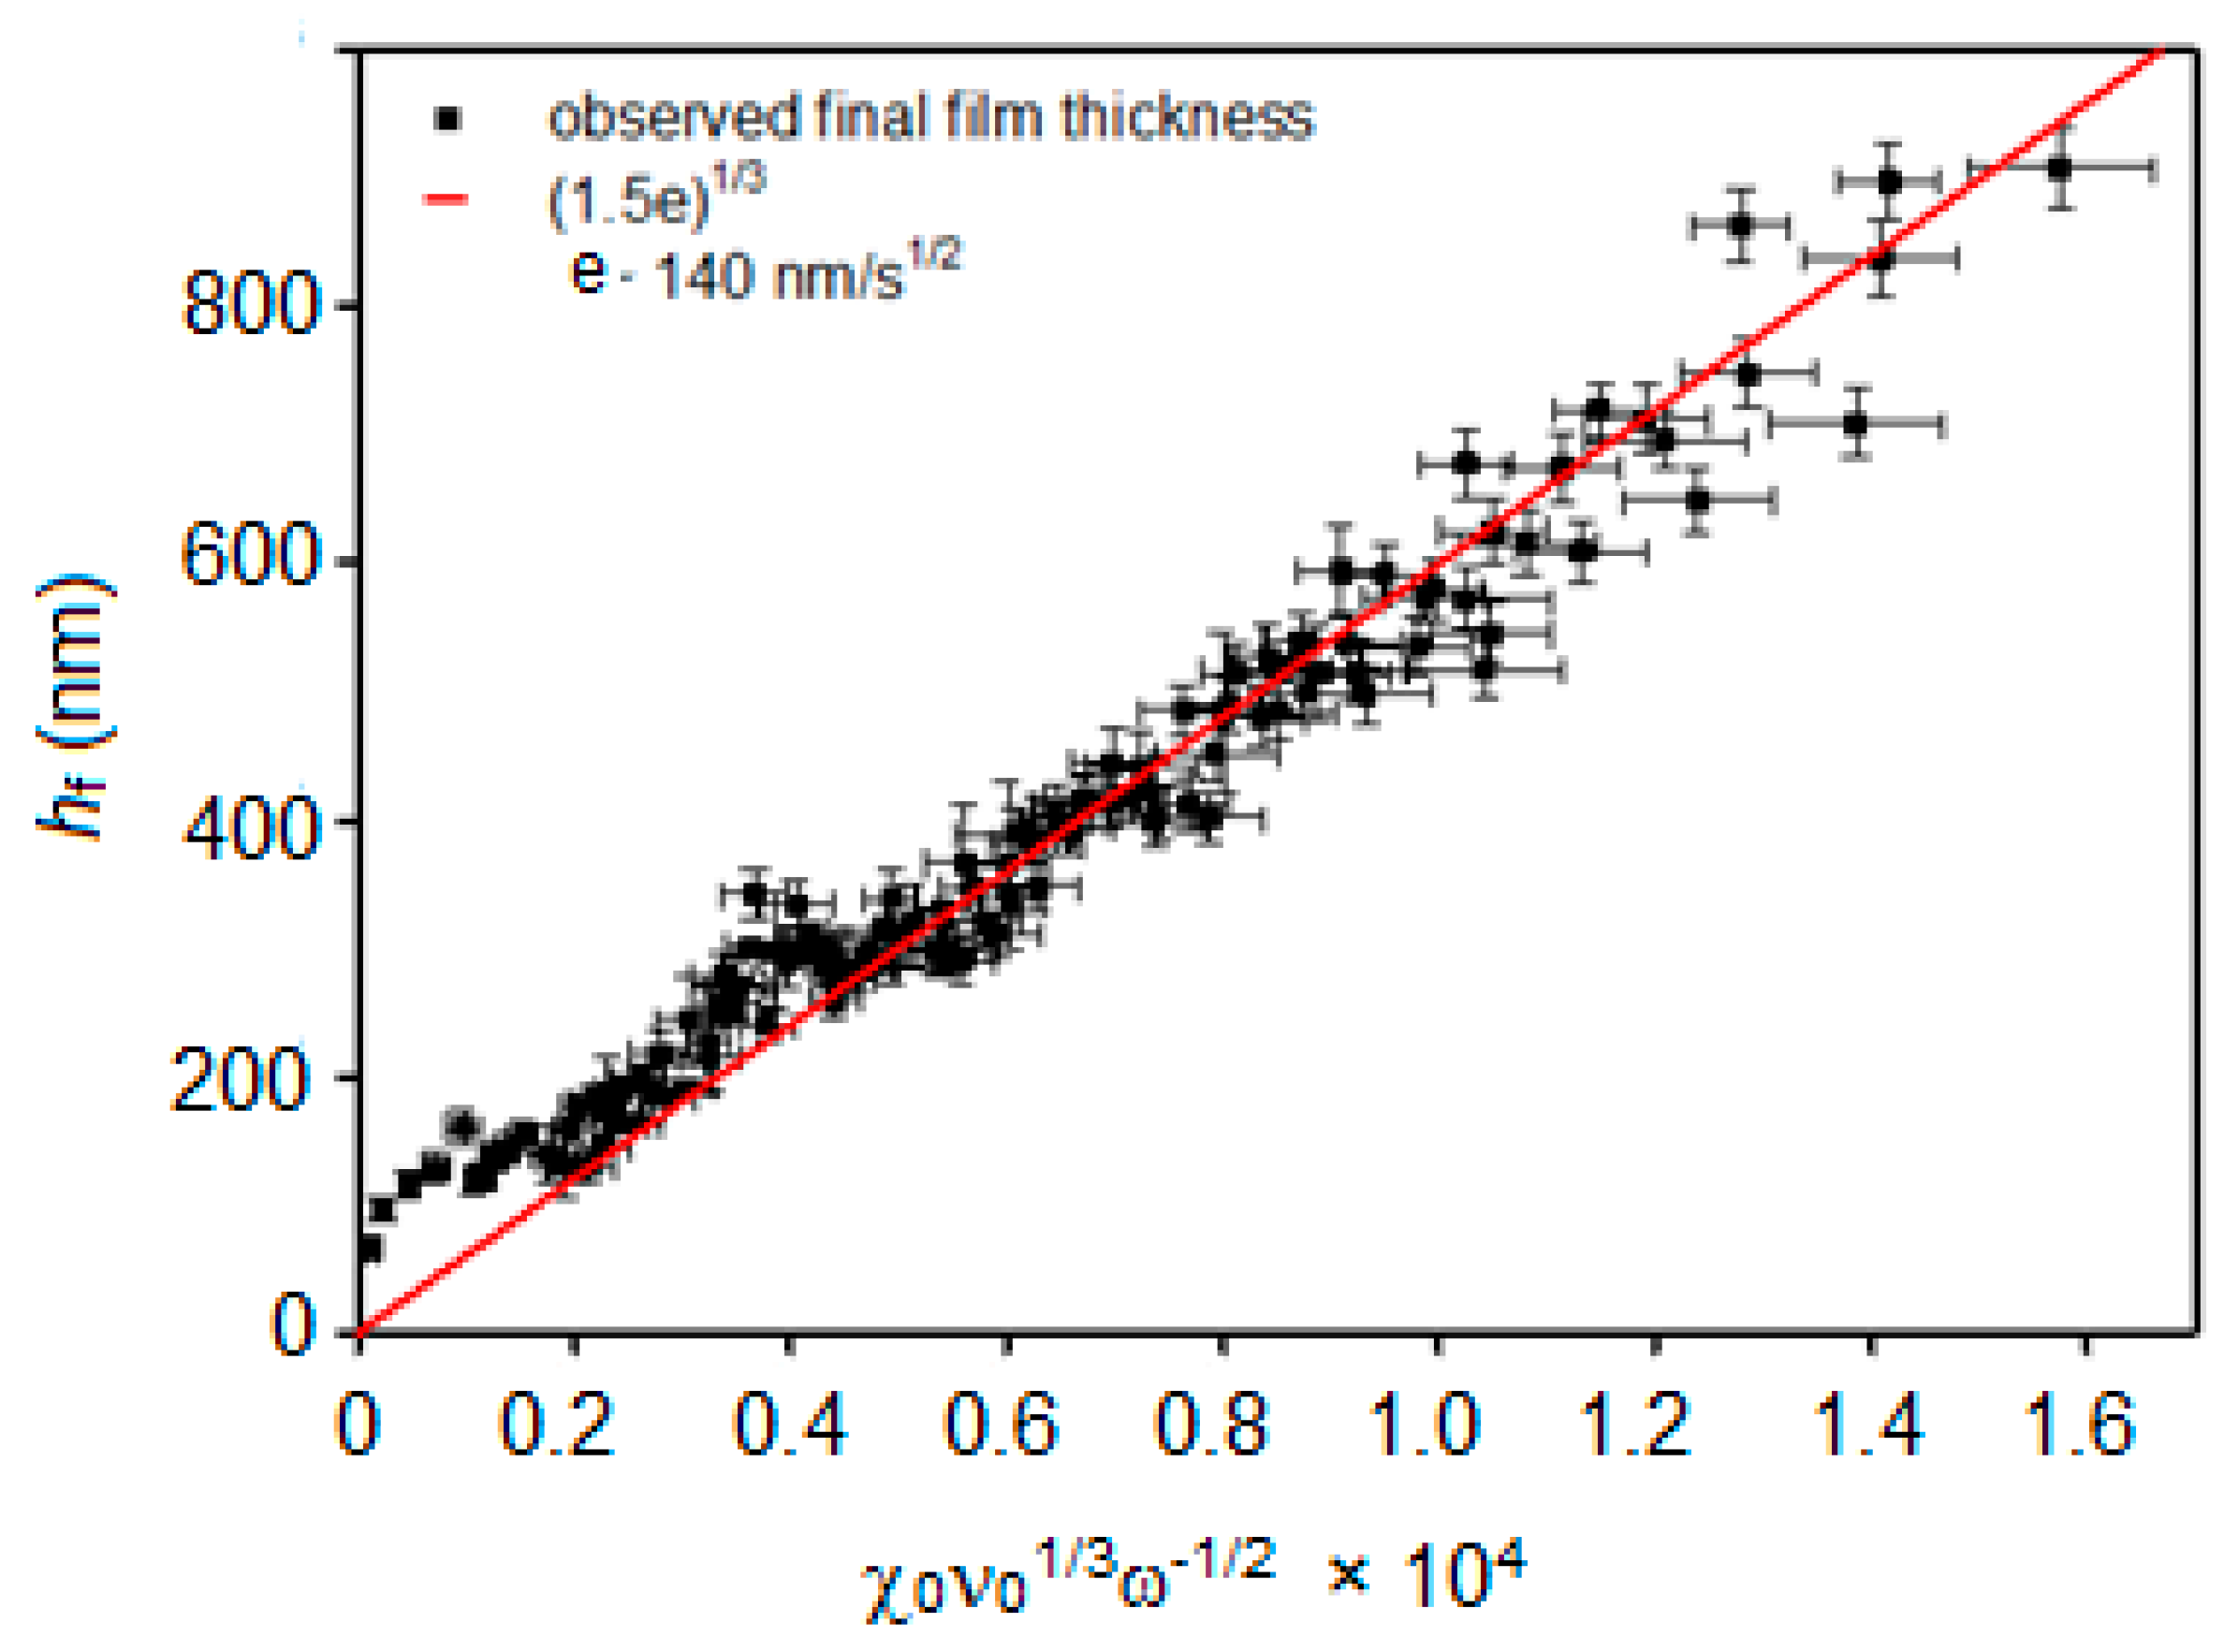
3.1. Spin-Coating Theory

Foundations for the spin-coating model were laid by Emslie, Bonner, and Peck in their study of hydrodynamic flow of a non-volatile Newtonian fluid [12]. They proposed that influence from gravitational and Coriolis acceleration could be neglected when the thinning fluid possesses a disproportionate viscosity to thickness ratio and is rotated at speeds of 100 RPM or more. With these conditions met, fluid thinning could be described as a force balance between viscous drag and rotational acceleration dependent upon radial and hydrodynamic forces, as described by the parameter:
K = ω2/3ν
where K is the force parameter, ω is rotational velocity and ν is kinematic viscosity. Meyerhofer adapted this approach to incorporate a volatile solvent [13]. Considerations were provided for evaporation and fluid dynamics while assuming a lubrication approximation (no slip due to sufficient substrate wetting) and negligible impacts from surface tension or substrate acceleration. Viscous film thinning is described as a two-stage sequential domination of hydrodynamic and evaporative forces. Initial fluid thinning is directed by radial outflow and continues until solute enrichment reaches a critical point where fluid viscosity retards flow and solvent evaporation becomes the dominant force. The final stages of film formation continue at a constant evaporation rate until a solid film has formed. From the transition point onward, the contributions to thinning due to radial outflow are negligible in comparison to evaporation.
The rate of film thinning per unit area was described by
dh/dt = −2Kh3E
where h is the vertical thickness of the fluid. The parameter E was proposed for evaporation and captures an observed scaling of the static evaporation rate, e, by rotation speed:
E = eω−½
Haas reported that the rate of solvent evaporation is reliant on solvent partial pressure. Solvent mass transfer to the vapor phase is inhibited by diffusion within the film at low partial pressure and resisted by the saturated environment above the film at high partial pressure. The evaporation rate is a static system-specific parameter that encompasses solvent vapor pressure effects and diffusivity into the overlying gas [14].
Using high speed imaging techniques, Danglad-Flores refined Meyerhofer’s models and proposed a first-order approach to quantitative predictions of final film thickness [3]. This simple method requires only a few initial fluid properties, spin speed, and a calibration experiment to determine the system-specific evaporation rate.
hf = (3e/2)1/3χooo)1⁄3 × ω−½
where hf is the final dry film thickness, χo is the polymer mass fraction, ηo is the dynamic viscosity, and ρo is the density, all at pre-spinning conditions.
Solution density and viscosity properties are closely related to polymer concentration. The viscous behavior of the polymer solutions can be described with the reduced specific viscosity, ηred:
ηred = (ηos − 1)/c
where ηo is the initial viscosity of the polymer solution, ηs is the viscosity of the pure solvent, and c is the concentration of the polymer in the spin-coating solution. Dynamic viscosity relates to the solution concentration per the Martin equation [15]:
ηred = [η] × ecKH × [η]
where [η] is intrinsic viscosity and KH is Huggin’s viscosity constant. The value of KH is expected to be near 0.4, which is the reciprocal of the Einstein–Stokes constant in an ideal dilute solution where the probability of interactions between polymer chains is negligible. Matsuoka and Cowman have reported a systematic overestimation of KH during analysis of high molecular weight compounds at low concentrations [16]. This error has been attributed to straight line approximations, which can be accommodated for by restricting KH to 0.4 ± 0.1. The application of Equation (6) is limited to dilute through to medium concentrated solutions. The deviation at higher concentrations is associated with interactions from overlapping polymer coils. Matsuoka and Cowman [16] propose that the viscous behavior arising from polar, ionic, and hydrogen bonding interactions can be better approximated by expanding Equation (6) into a Taylor series:
η red     [ η ]   ×   i   =   0   ( c K H   ×   [ η ] ) i / i ! .  
A conservative approximation of entanglement effects is made by truncating expansion after the third term [15].

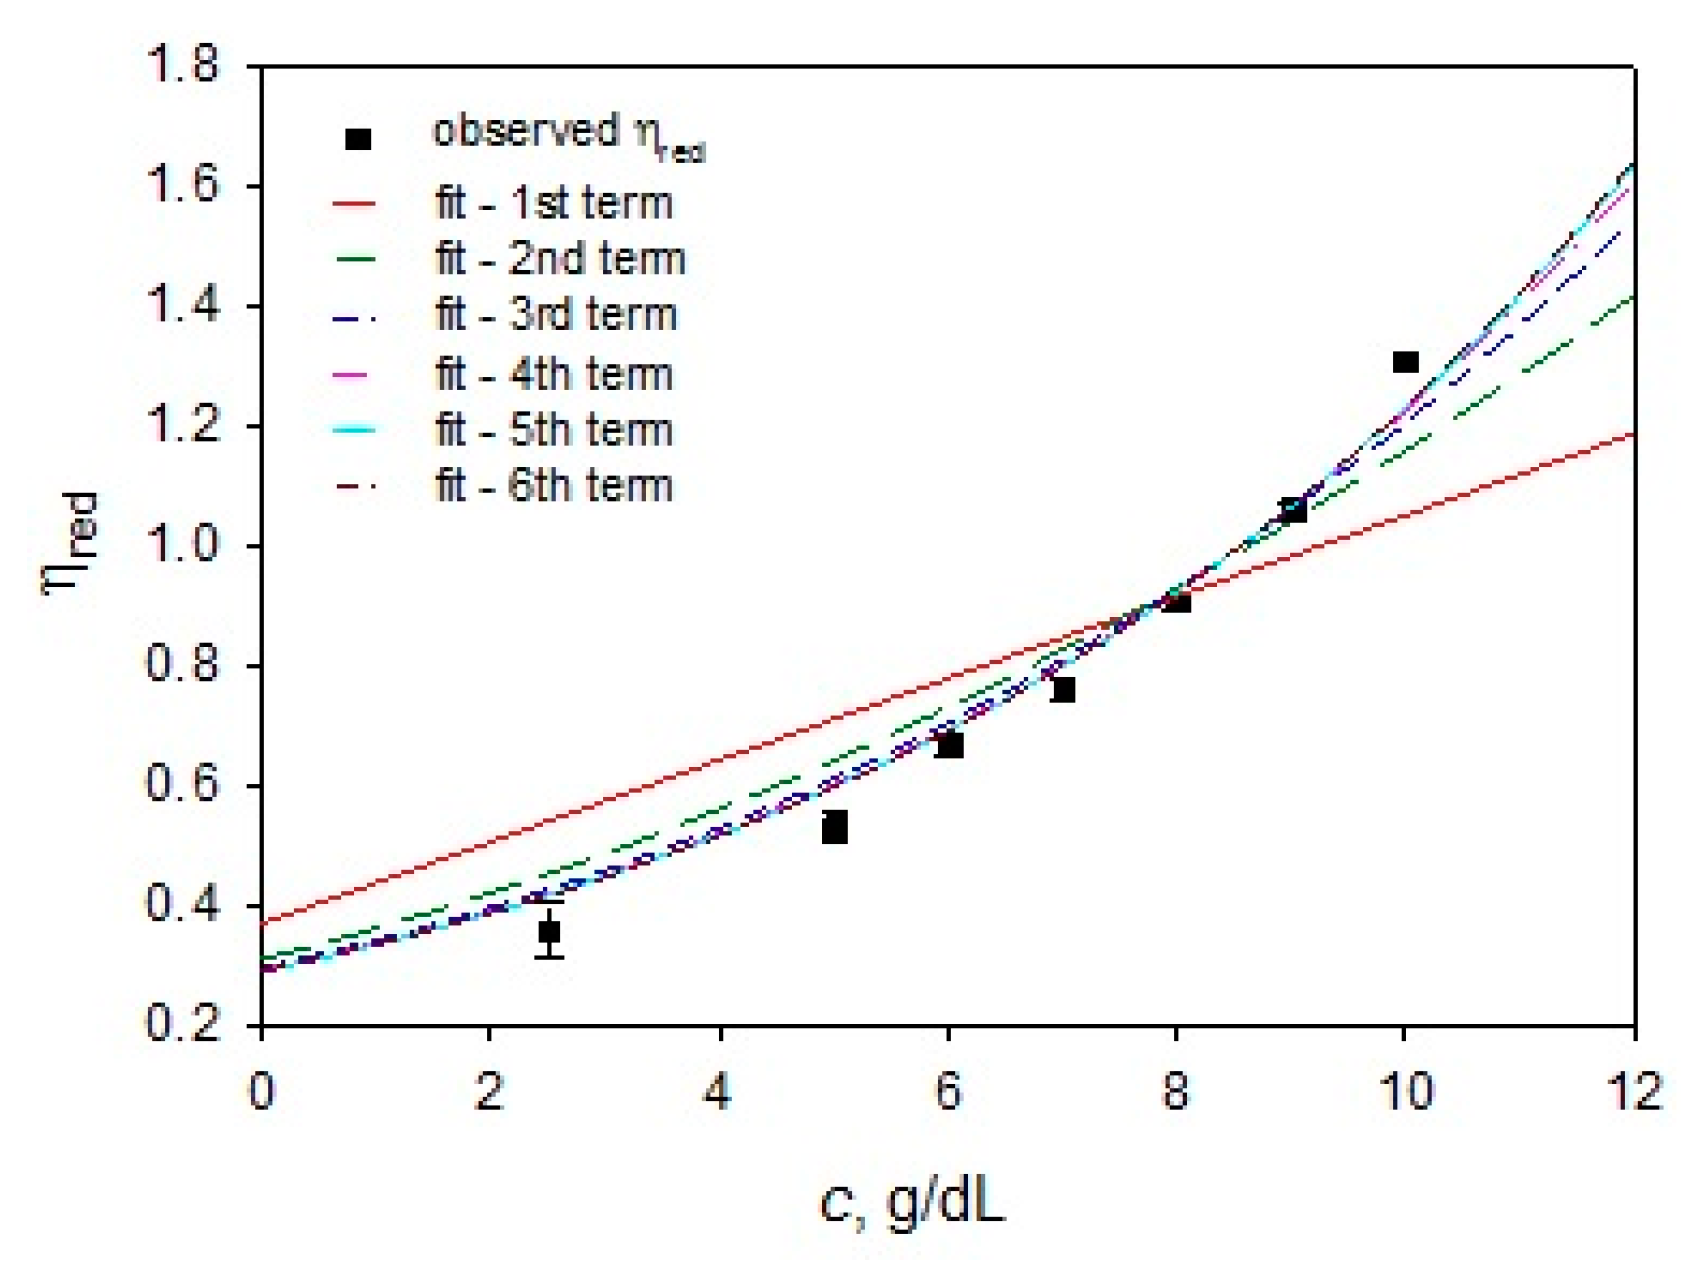
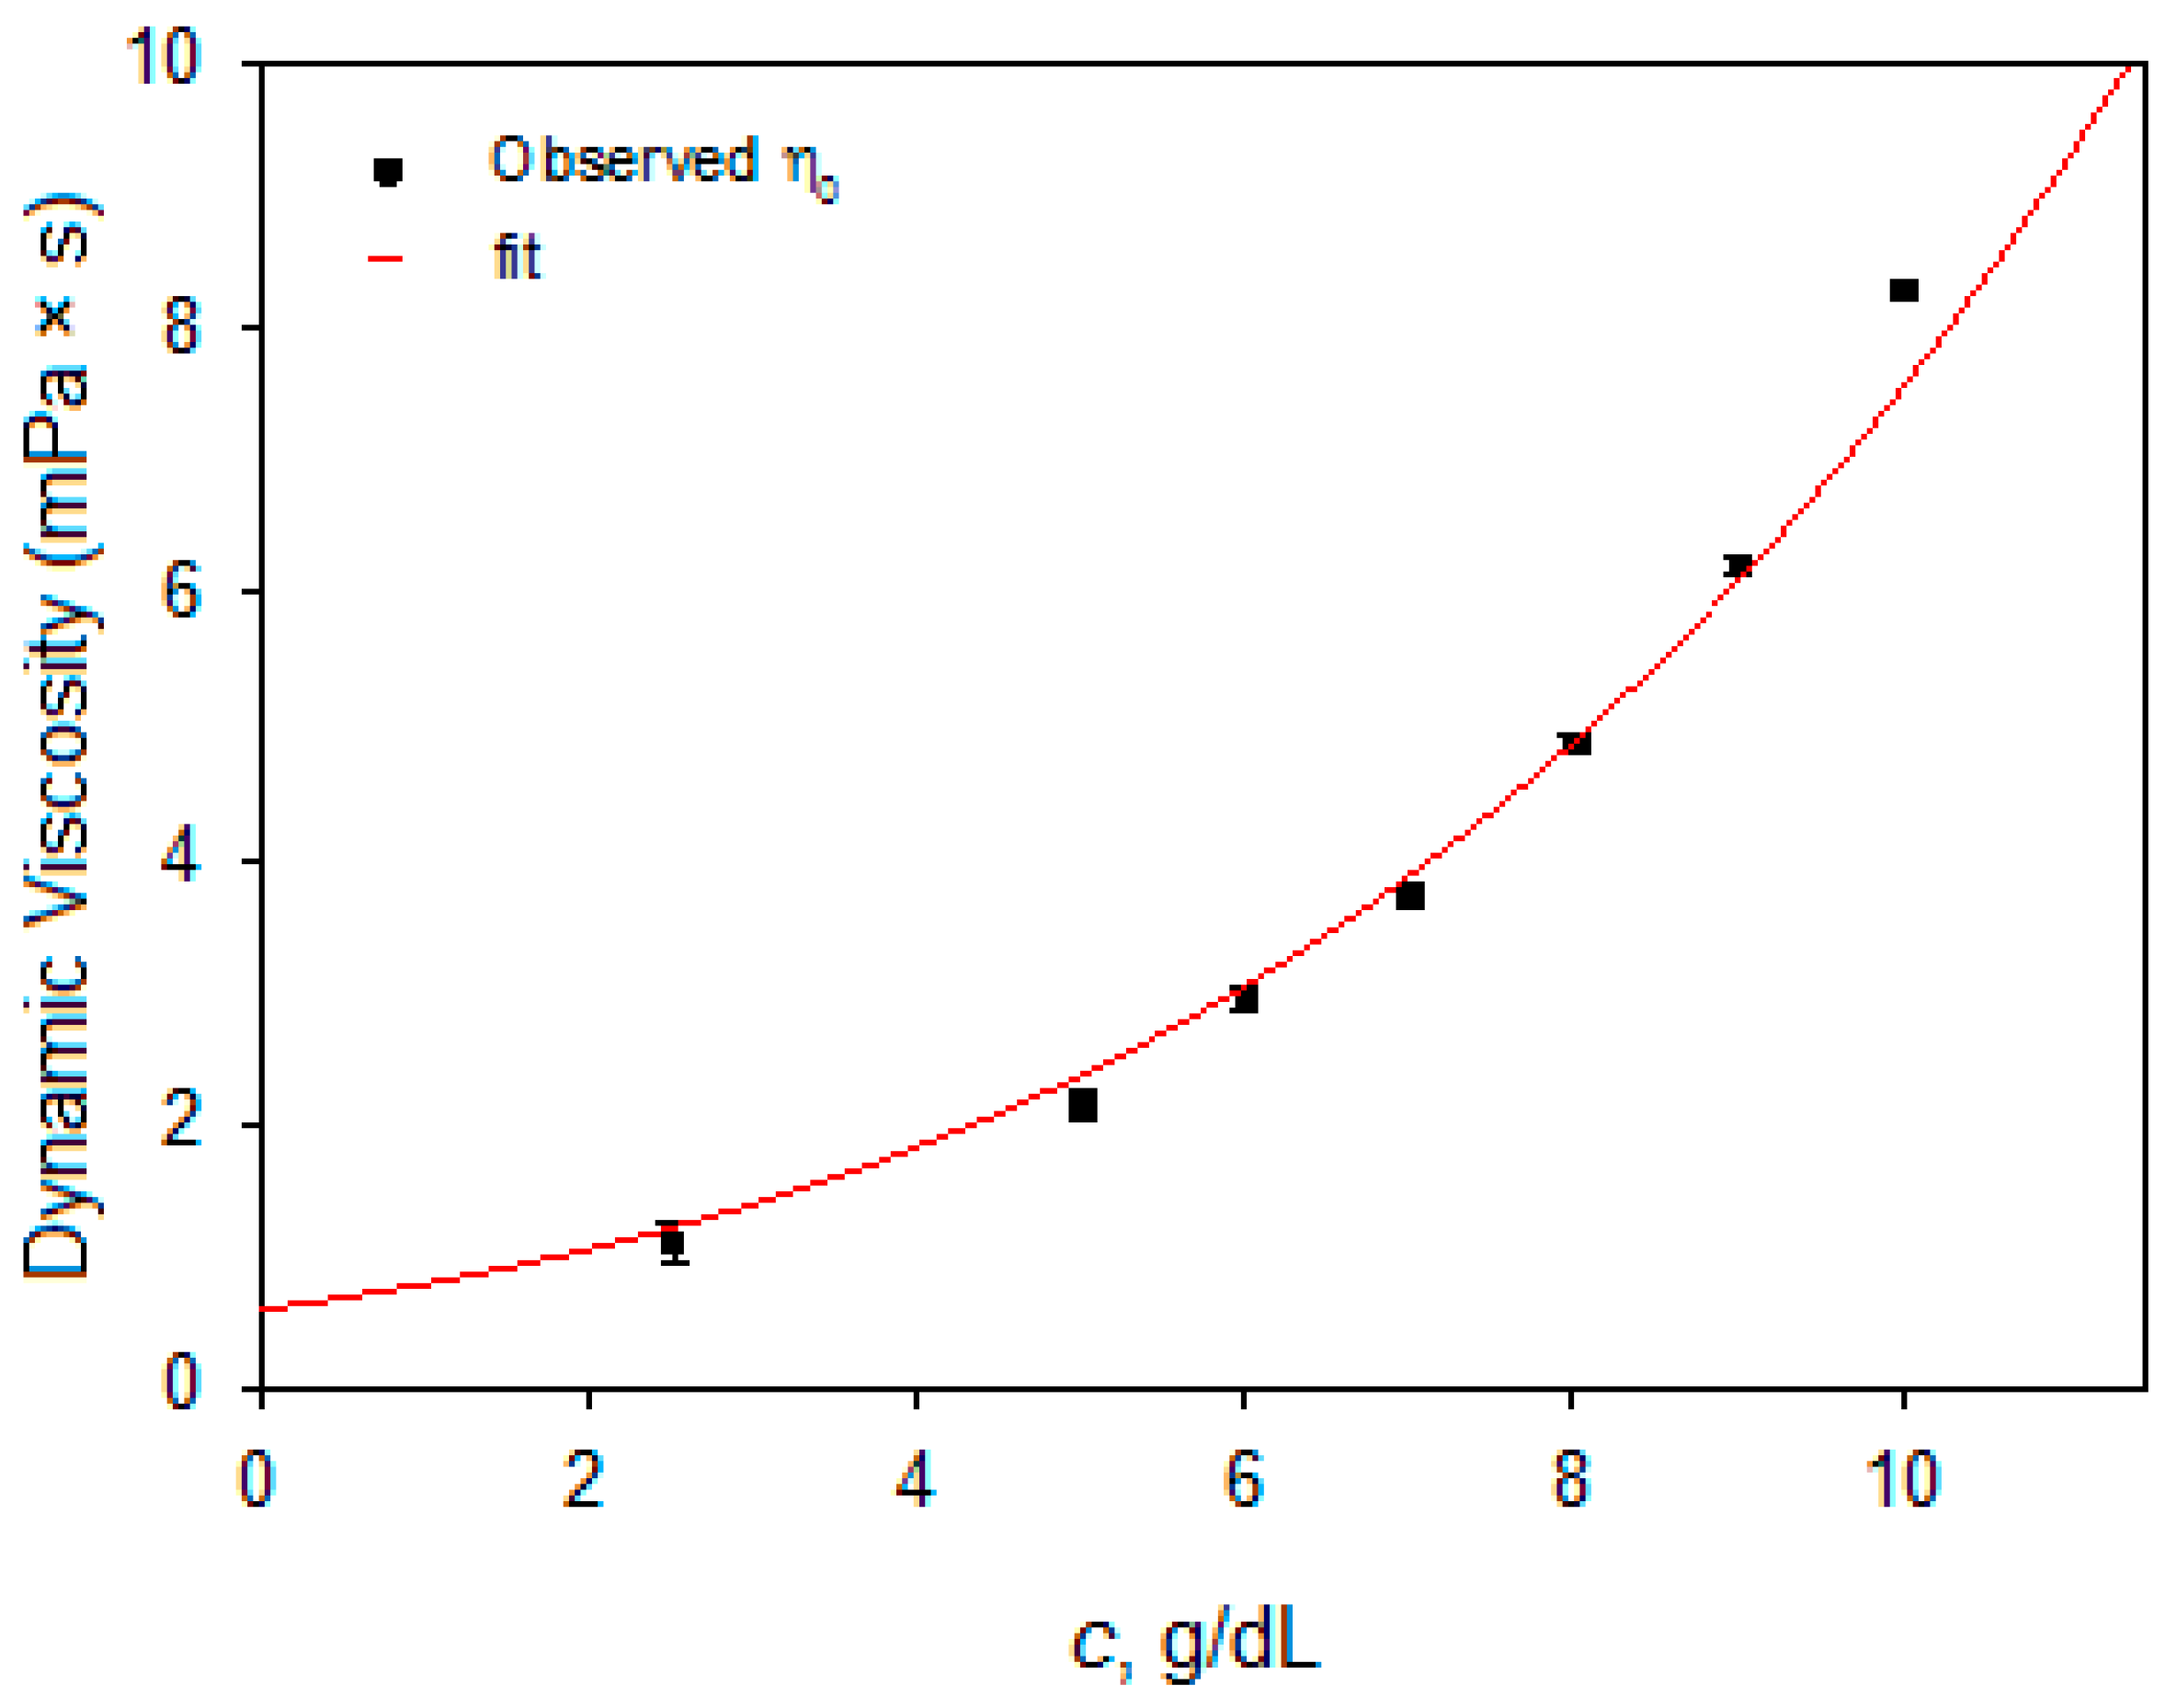
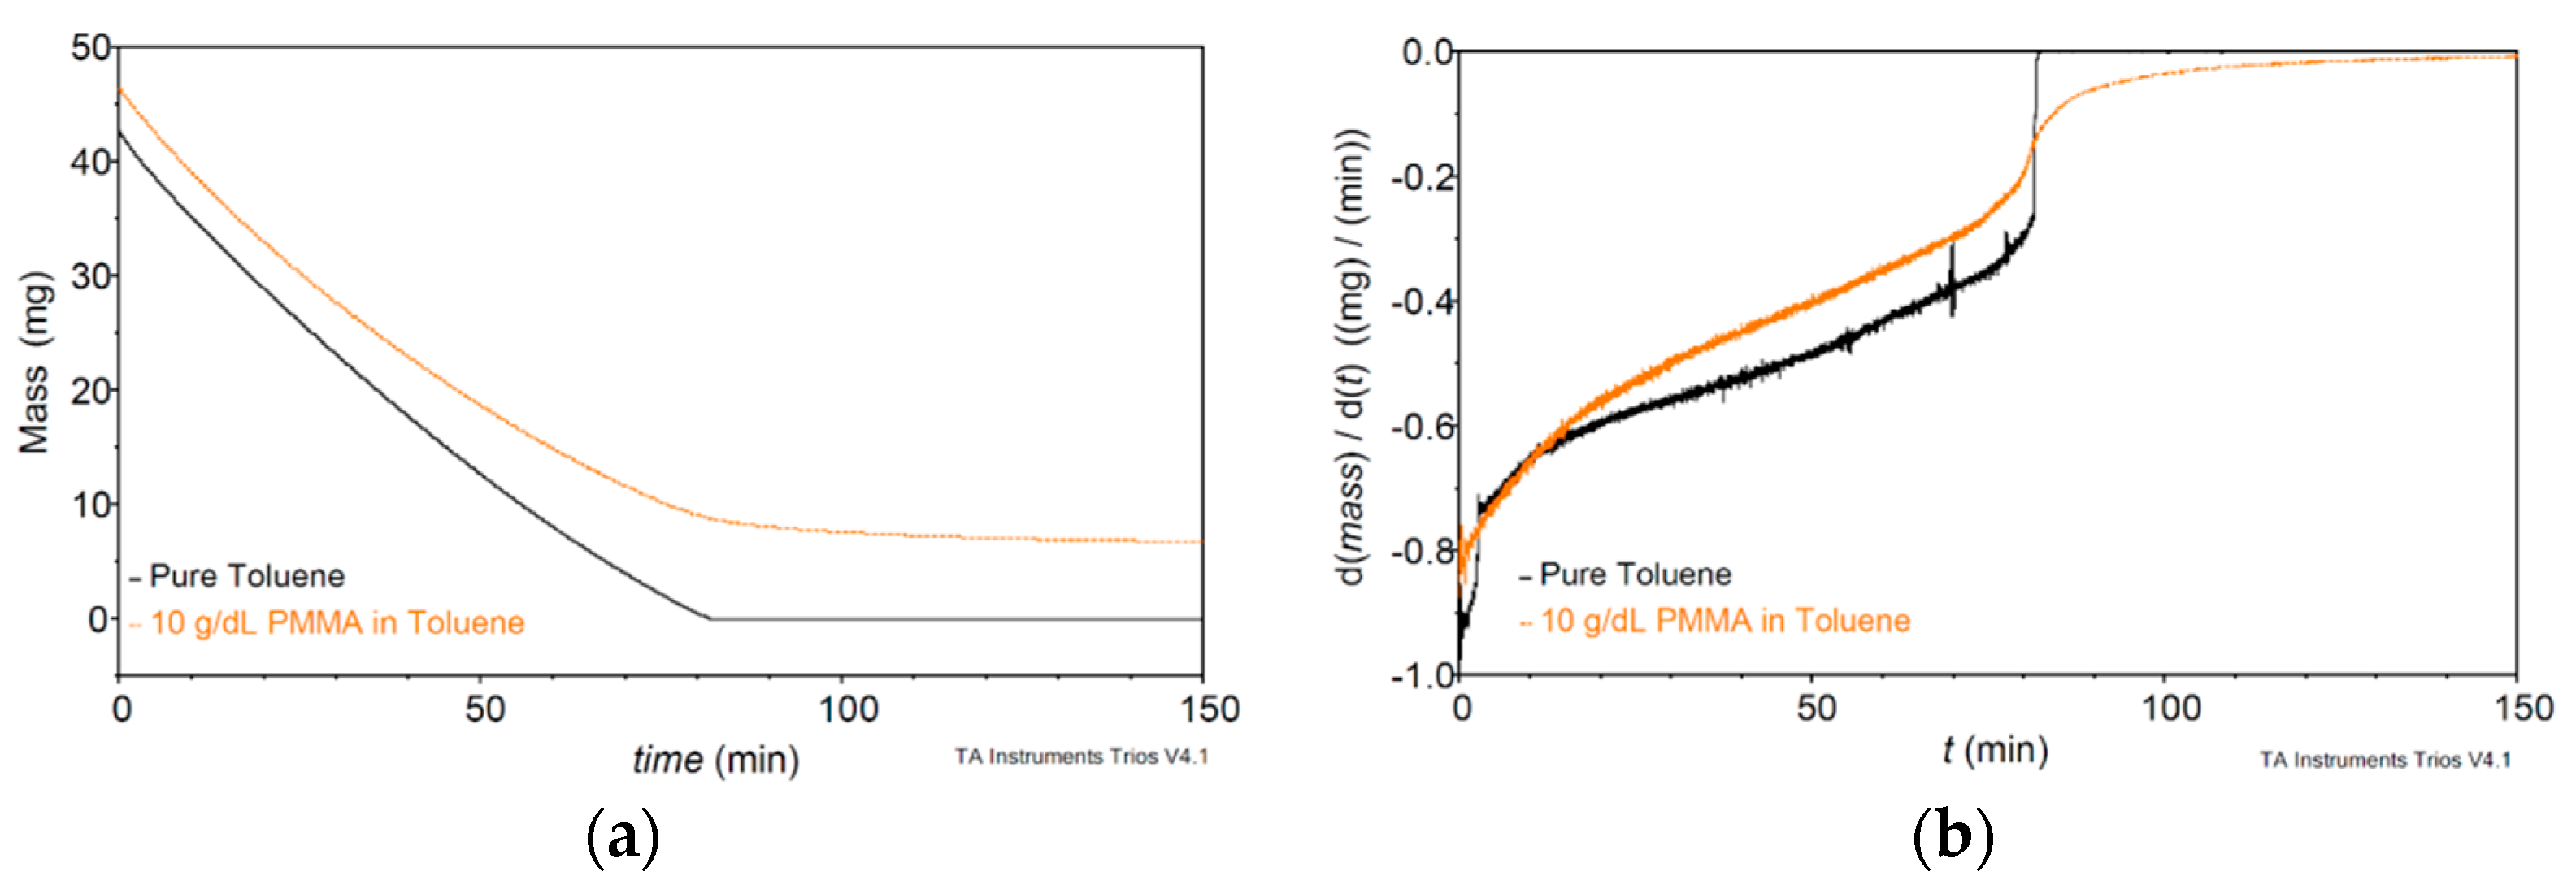
3.2. PMMA Solution Characterization

Polymer solutions were prepared at concentrations ranging from 0.125 to 20.0 g/dL and were observed to be clear and free flowing. Optical transparency for all solutions was identical to the pure solvent. Polymer mass fraction and solution density determinations were conducted at an ambient temperature of 20 °C. Both mass fraction and density increased linearly with polymer concentration. The relationship between polymer mass fraction and concentration is described by:
χ ο = 1.12 × 10 2 c
The relationship between solution density and concentration is described by:
ρs = 2.94c + ρsol
where ρsol is the density of the pure solvent. For both regressions, the coefficient of determination R2 was greater than 0.999.
The dynamic viscosity of fluids was observed between 1.13 and 8.31 mPa·s. Viscosity measurements were taken at constant shear rates of 200 s−1 for semi-dilute polymer to moderately concentrated solutions (2.5 to 10.0 g/dL). Solution viscosity was observed to increase exponentially with polymer concentration.
Figure 1 shows a Huggin’s plot of reduced specific viscosity versus concentration. Nonlinear regression by Equation (7) was found to converge by the sixth term ( [ η ] = 0.292 ± 0.031, K H = 0.500 ± 0.101,). Potentially due to differences in fractional polydispersity [17] or systematic fitting errors [16], a wide range of literature values have been reported for [ η ] and K H combinations [18]. For this reason, experimental intrinsic viscosity determinations were compared to estimations made with the Mark–Houwink equation:
[η] = KMHMwα
where Mw is PMMA molecular weight and KMH and α are the Mark–Houwink coefficients. Calculations were made with reported Mark–Houwink coefficients [19,20,21] and the results are listed in Table 1. Experimentally determined intrinsic viscosity for PMMA is also shown in Table 1 and is in good agreement with estimates calculated from literature values. Limitations of the fitting regression are observed by the assignment of K H at the upper limit which was implemented to avoid erroneous straight line approximations [16]. When the fitting was performed without variable constraints, K H and [ η ] converged near ~0.7 and ~0.18 dL/g, respectively. The higher than expected K H suggests that the solution rheology may be impacted by undetermined polymer–solvent dynamics or synergistic effects.
Figure 2 shows a plot between dynamic viscosity and concentration. This relationship is fit reasonably well by Equation (7) truncated at the third term (R2 = 0.97, error: ±0.34) with the largest deviations occurring at the highest concentrations.
A theoretical examination of solvent–polymer interactions can be approached by Hansen’s three-component solubility parameter, Ra:
R a = [ 4 ( δ D 2 δ D 1 ) 2 + ( δ P 2 δ P 1 ) 2 + ( δ H 2 δ H 1 ) 2 ] 1 2
where the three solubility parameters are: δD, dispersion; δP, polar; and δH, hydrogen bonding. Table 2 displays the parameters for PMMA and toluene [22,23]. Hansen solubility parameter (HSP) theory describes relative energy difference (RED) as the ratio of HSP distance, Ra, to the interaction radius, Ro. Solubility is expected when RED < 1 and partial solubility when RED is at unity. For PMMA in toluene, Ra = 10.7 (from Equation (11)) and Ro = 11.1 [24]. While the calculated RED value of 0.96 correctly predicts full solubility, it suggests relatively weak solute–solvent interactions. The degree of variance between individual solubility parameters describes interactions as mainly dispersion–van der Waals forces, with some polar interactions, and relatively little hydrogen bonding.
Thermogravimetry was used to screen for a solute effect on the evaporation rate. A slow flow of purged N2 was used to facilitate solvent vapor removal without encouraging convection. Figure 3 shows the mass loss curves and the static evaporation rates (ω = 0) of toluene and of a 10.0 g/dL polymer solution. The two mass loss curves are very similar for the first twenty minutes of drying. Beginning at around 20 min of drying, when PMMA is approximately χ ≈ 0.2, the polymer solution begins to dry slower than the pure solvent. The initial vertical thinning rate is 590 nm/s. As time goes on, the polymer solution evaporation rate decreases to 195 nm/s at around 85 min (χ ≈ 0.8) when the rate of evaporation in the polymer solution is strongly suppressed. In contrast, pure toluene evaporates steadily through depletion.
Solvent evaporation is controlled by diffusivity within the film and solvent partial pressure above the film. The observed decrease in evaporation rate over time contrasts with the expected constant evaporation rates that have been reported for the spin-coating process [4,25]. It is likely that surface tension effects help shape evaporation rates. The slow removal of toluene in the final stages of film formation may be indicative of a solvent mass transfer being diffusion rate limited in the enriched polymer environment.
The derivative TGA plots give the evaporation rates directly. The evaporation rate of the polymer solution at concentrations less than 0.2χ are nearly identical to the pure solvent. Evaporation rates are slightly reduced at polymer concentrations less than 0.8χ. Significantly slower evaporation rates are observed at the final stages of polymer enrichment and may be correlated with a glass transition. The observed constant decrease in evaporation rates is possibly a solvent retention effect caused by interactions with the sample container walls.

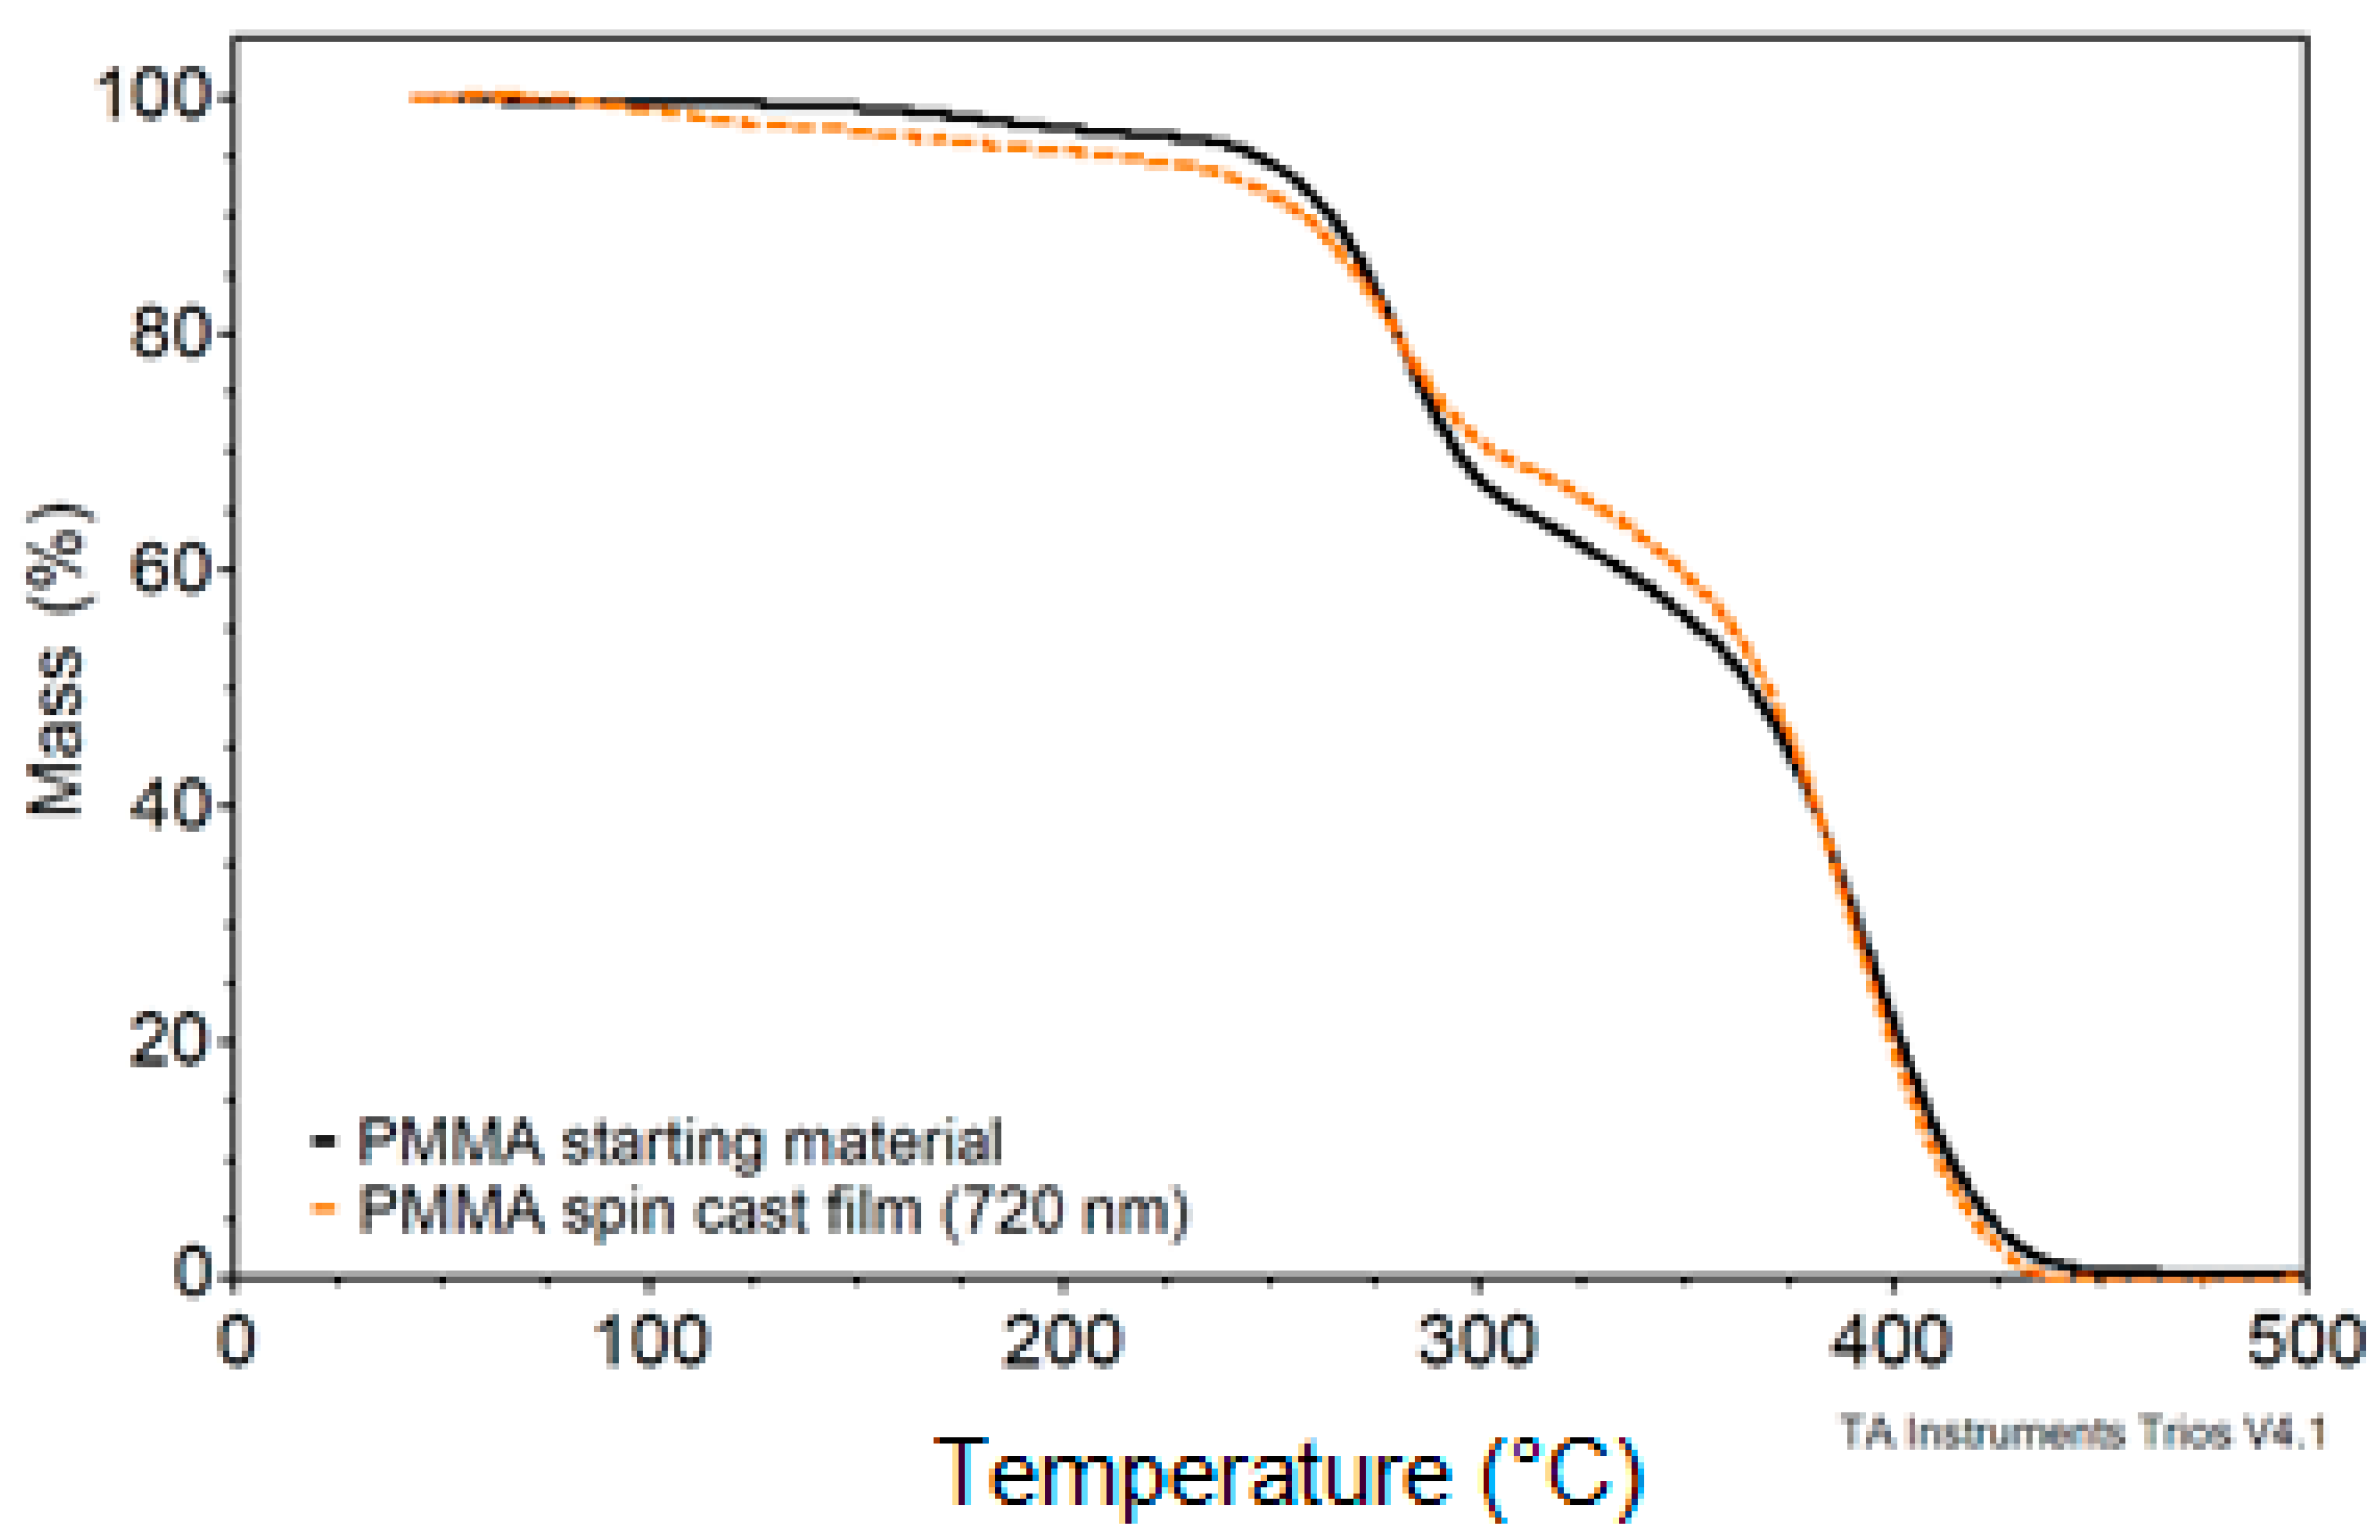
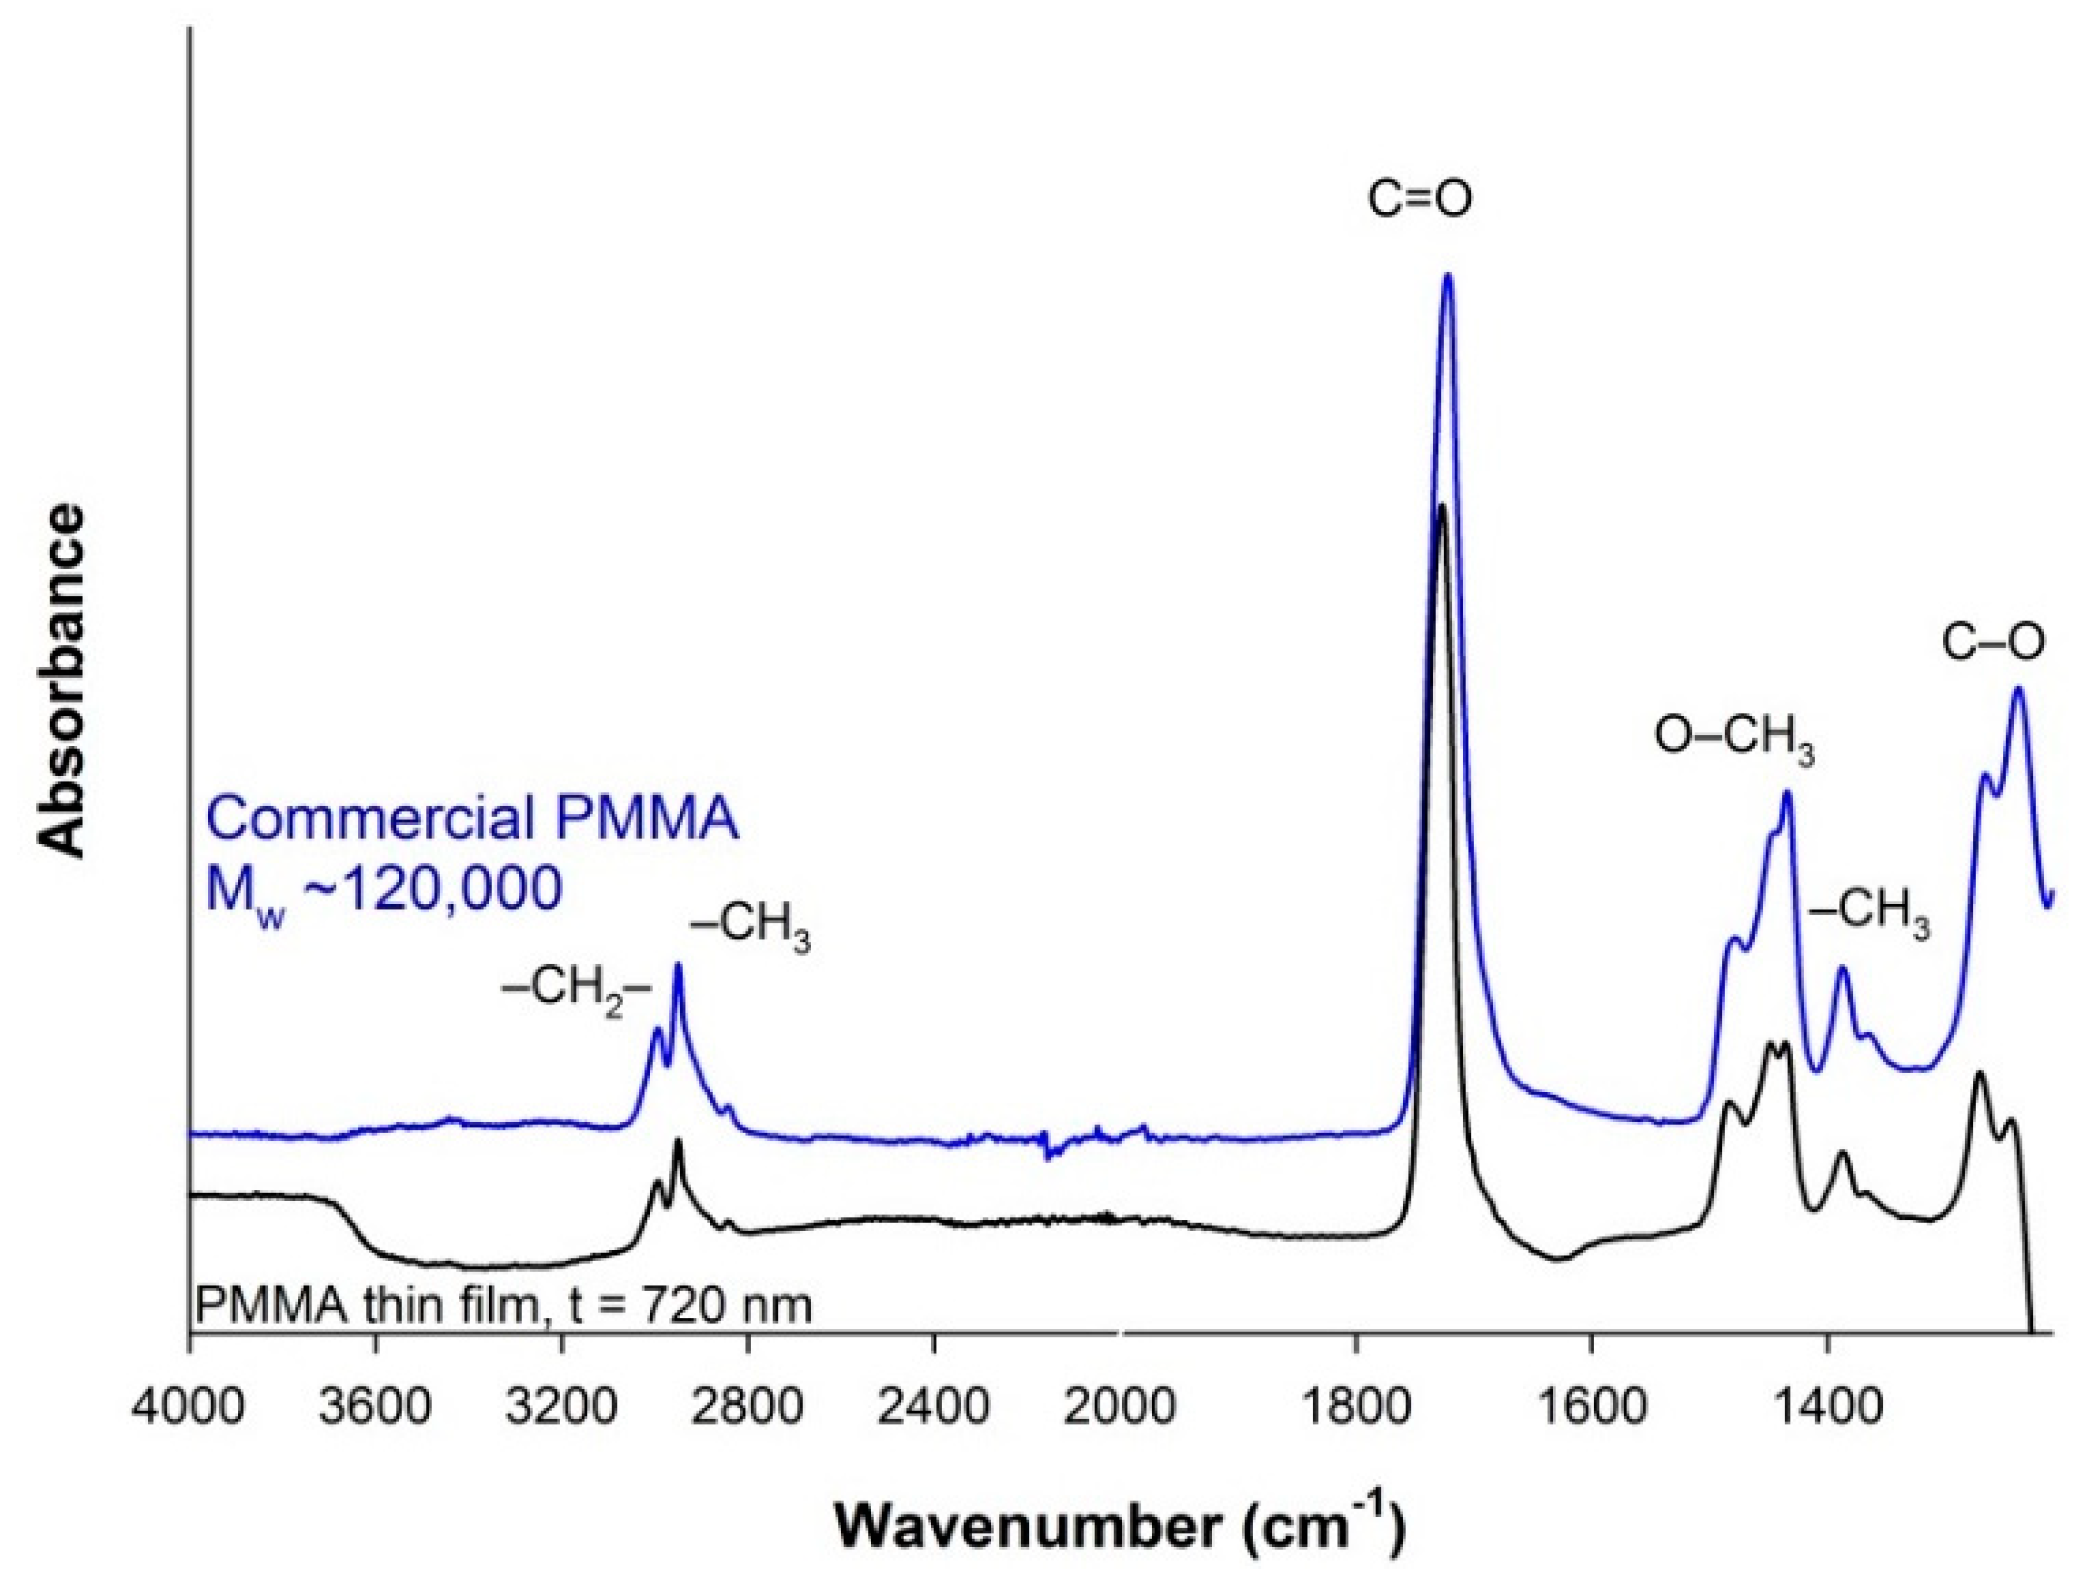
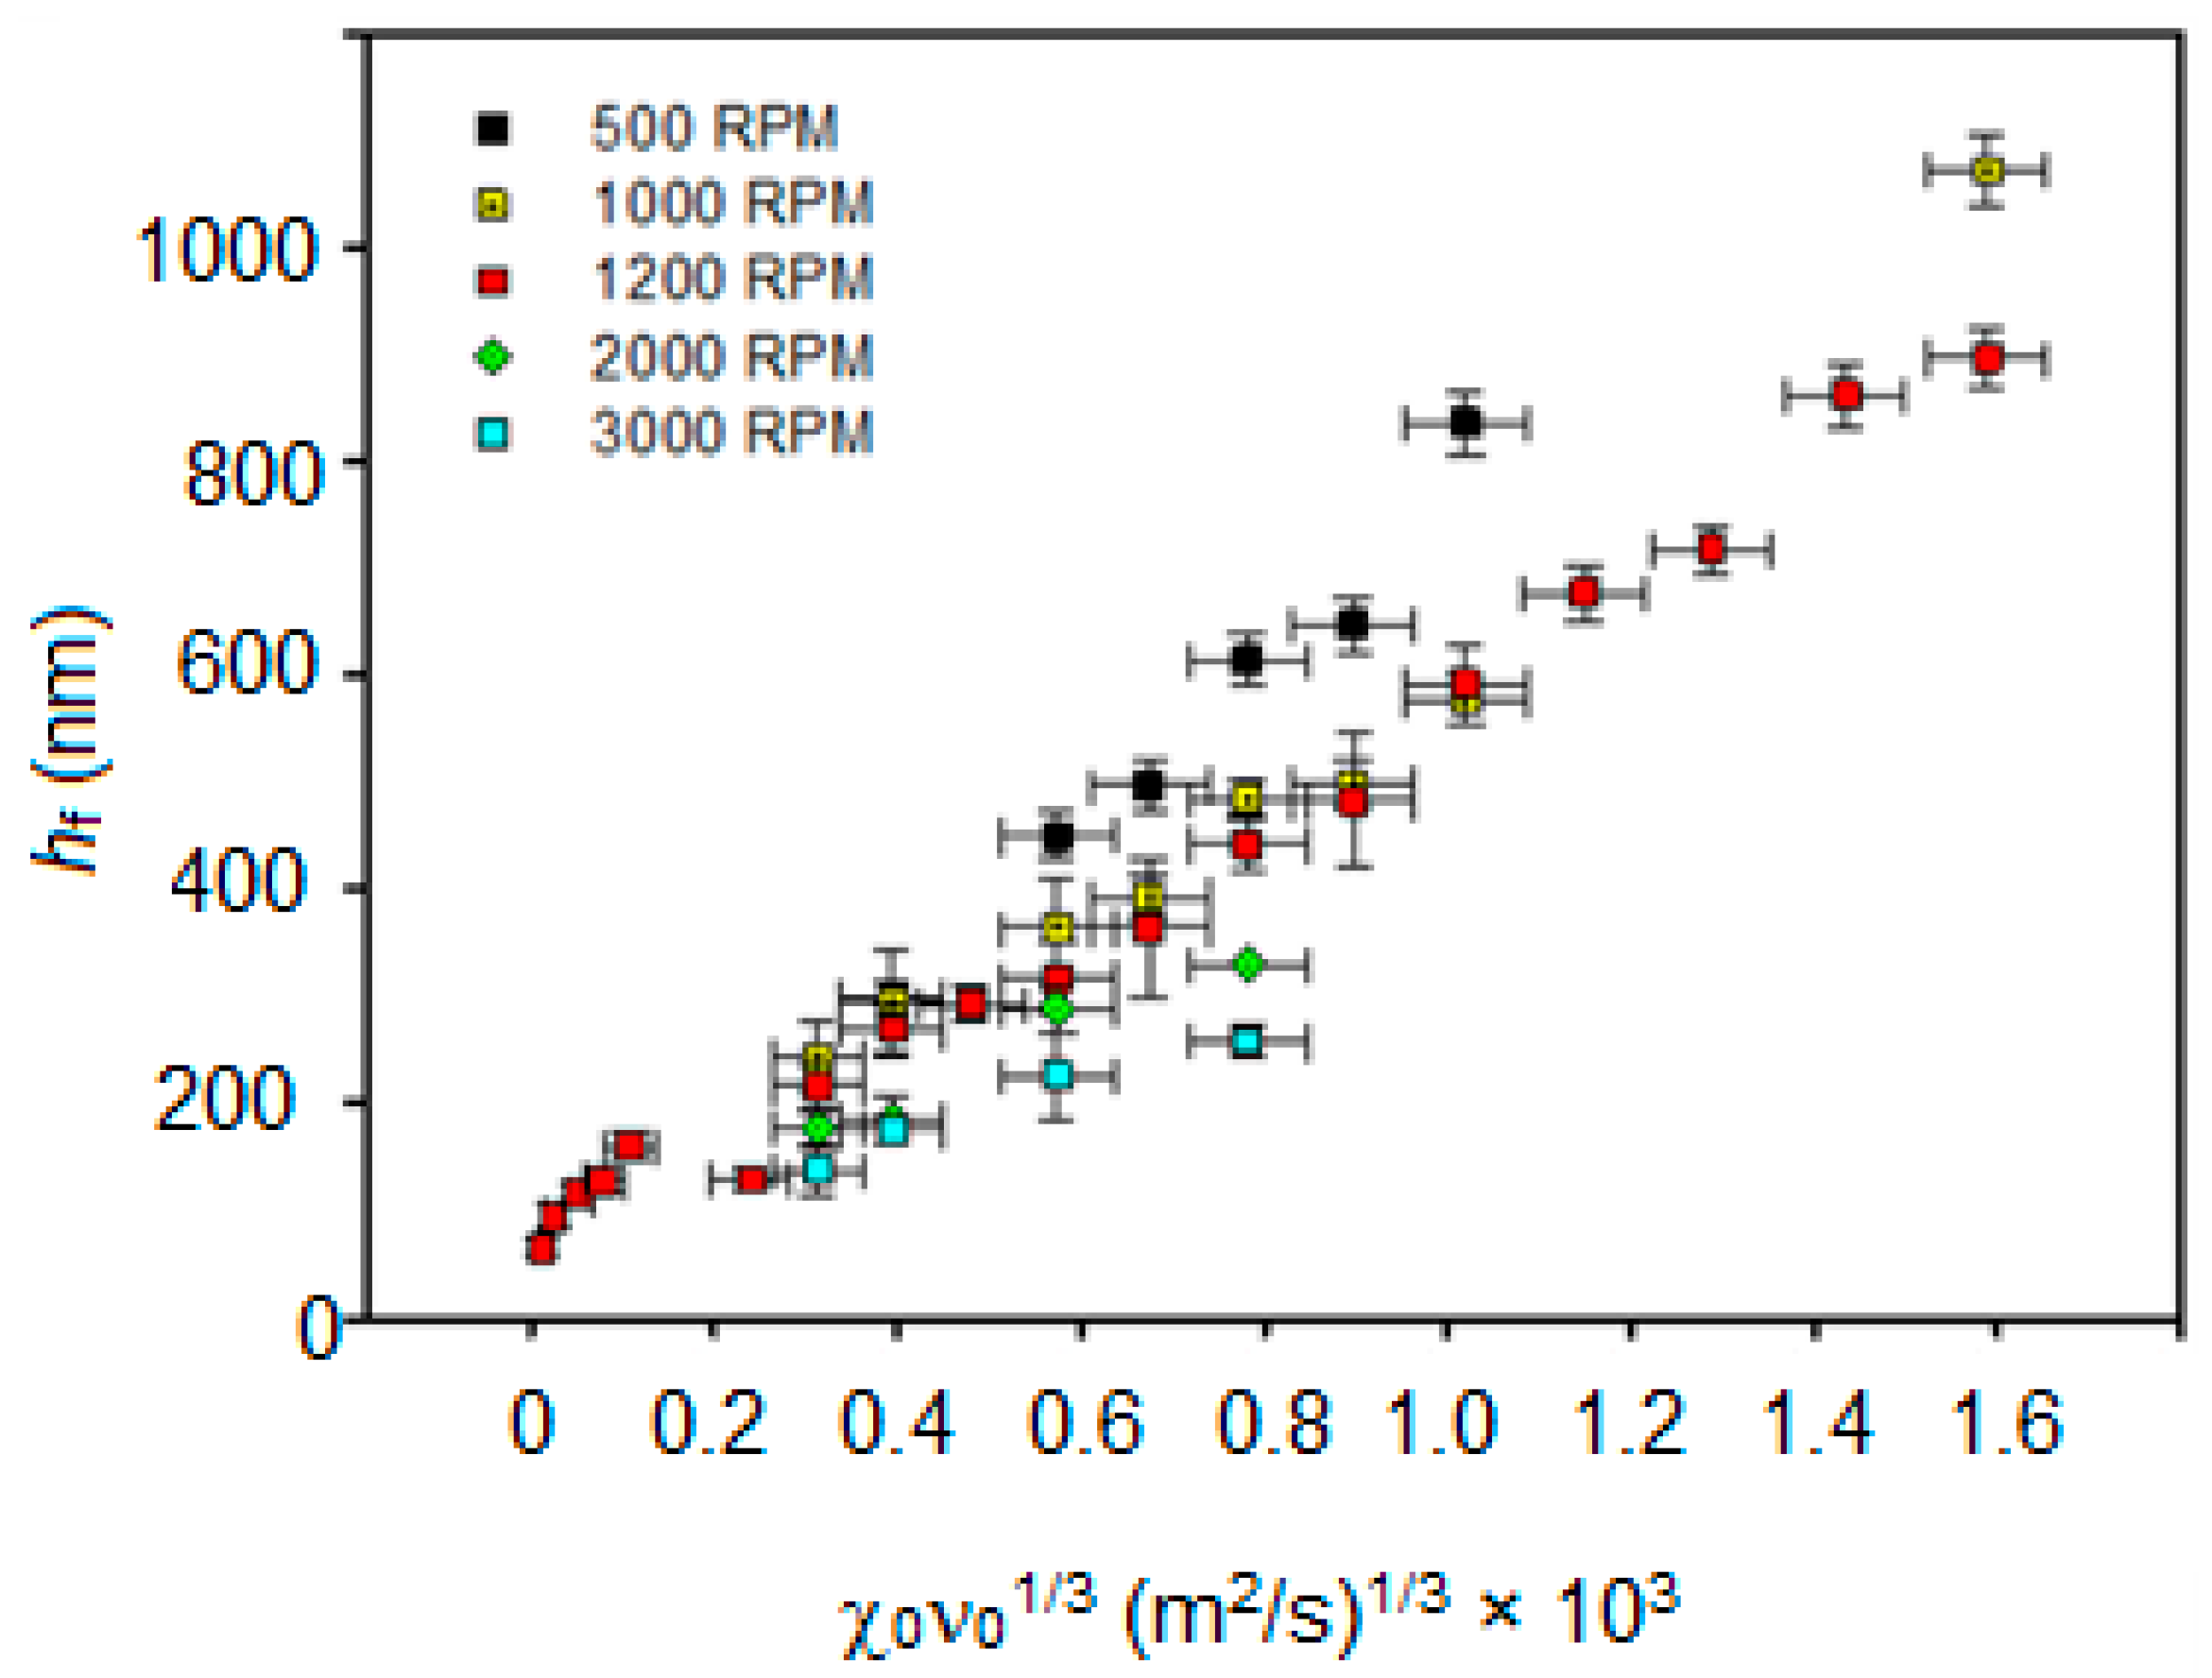
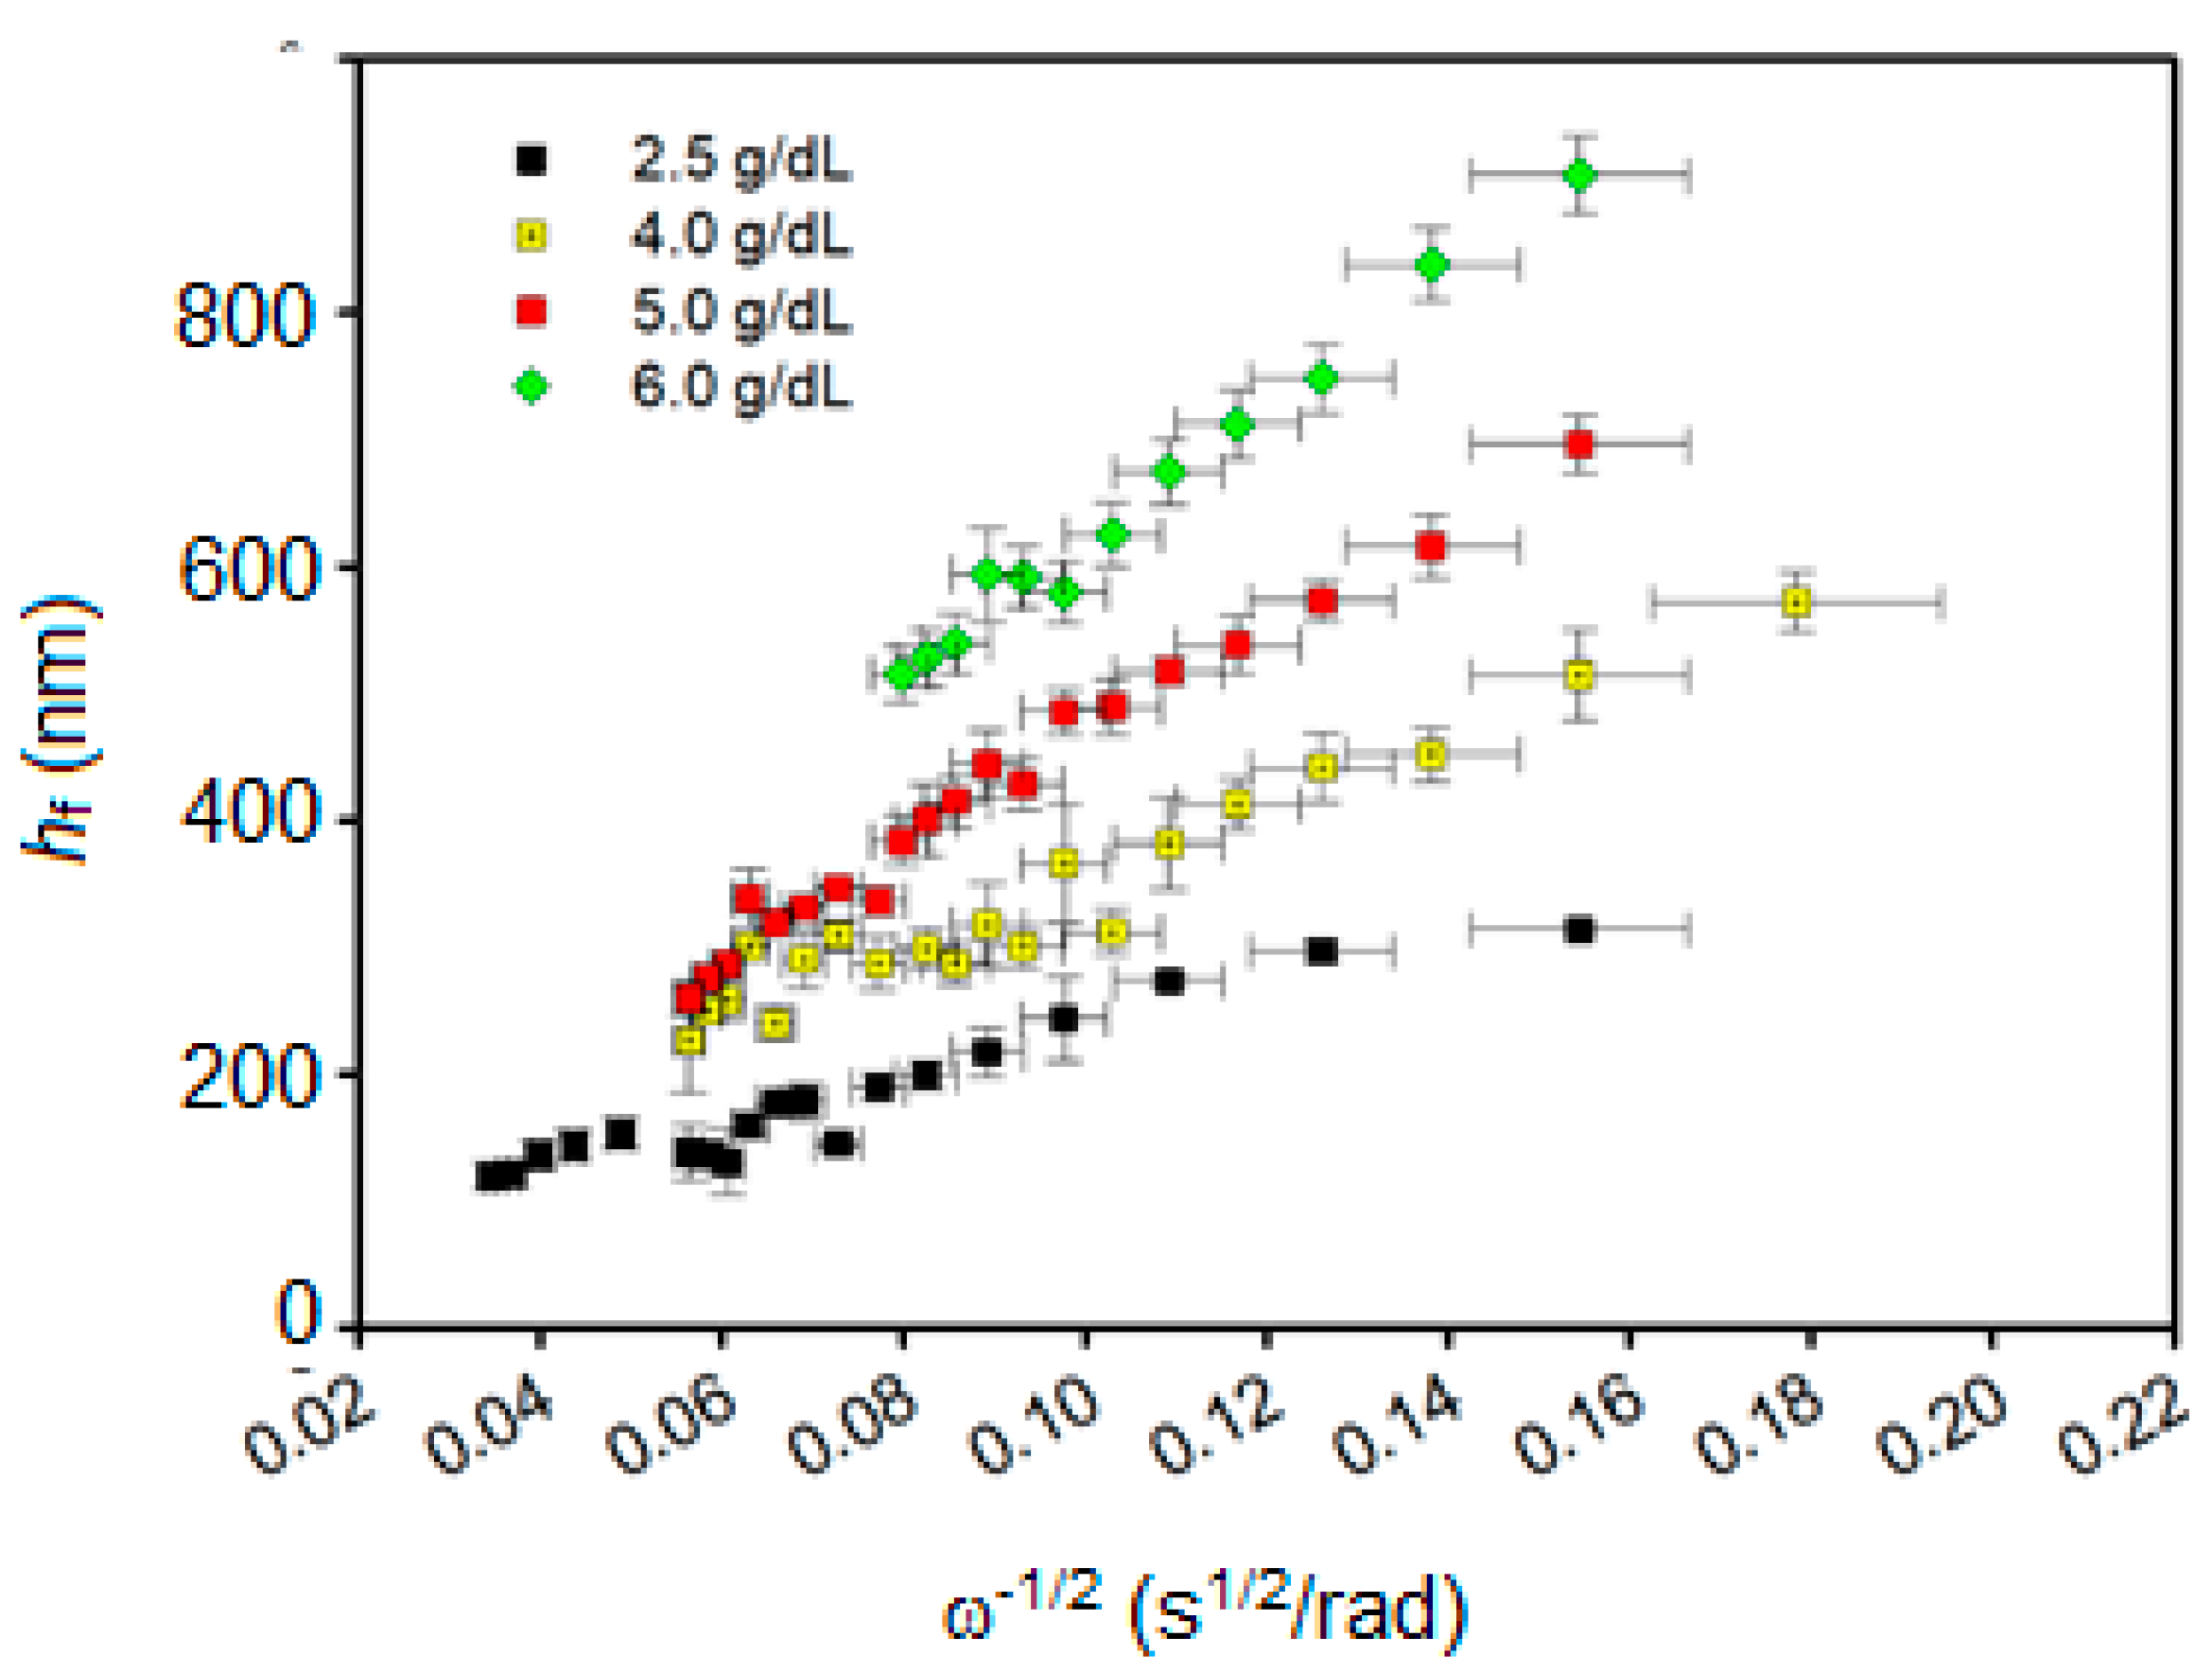
3.3. PMMA Thin Film Characterization

TGA and FTIR were measured on both the PMMA starting material and final dried film to verify that no chemical changes occurred. Figure 4 shows mass loss associated with thermal decomposition occurring between an ambient temperature and 500 °C. An initial mass loss is observed near 153 °C and followed by a larger mass loss near 260 °C, in agreement with previous reports [26,27,28]. These two mass loss stages are generally associated with depolymerization, starting from head-to-head linkages and unsaturated vinyl ends. The third and largest mass loss shown near 370 °C is often associated with a methoxycarbonyl side group scission and random scissions of the main chain. Highly similar thermal behavior is observed for both samples, which suggests that the bulk chemical properties of the polymer were not affected by the spin-coating process. The small differences associated with the spin-cast film can be attributed to loss of residual solvent.
Additional chemical characterization of bulk and spin-cast polymer was carried out by FTIR analysis. Figure 5 overlays the infrared absorbance spectra of the two samples from 4000 to 1200 cm−1. The observed absorbance bands for methyl, carbonyl, and ester stretching modes at ~2900, ~1700, and ~1450 cm−1 have also been reported in the literature for PMMA as a bulk substance and thin film [7,17,29]. The FTIR spectra of the bulk material and the 720 nm spin-cast film are similar, consistent with the TGA results.
The conclusion is that the thin films cast from a toluene solution at room temperature have the same chemical and molecular weight properties as the pre-processing powder. This conclusion is also supported by the weak solvent–solute interactions predicted by the Hansen solubility parameters.
Polymer film thickness was measured using the thin film interference fringing patterns from both transmission (UV–Vis) and reflectance (Vis) spectra. Film thicknesses ranged from 65 nm to 1 μm and the transmission and reflectance determinations were in agreement to within 5%. A minimum of three locations on each film were measured and the variation across the film was less than 5%. The polymer layer thickness was varied using both the rotation rate and the solution concentration and the measured thicknesses agreed with a previous report [10].
Owing to the high molecular weight of the polymer, film thickness is largely dictated by spin-coating parameters related to the transport of the solution over the substrate. The reported thicknesses are averages since the films have measurable roughness that will be addressed in detail in a forthcoming manuscript. The primary and secondary factors with the largest impact on film thickness are initial solution concentration and spin speed [12,13,30]. Figure 6 shows the final film height as a function of combined concentration and viscosity variables from Equation (4). At a given spin speed, the final film thickness increases linearly as a function of the fluid properties given by χ 0 ( η 0 / ρ 0 ) 1 / 3 . Figure 7 plots final film height against spin speed, as given in Equation (4). At a given initial concentration, the final film thickness also increases linearly with the inverse square root of spin speed. Comparisons of slopes in Figure 6 and Figure 7 imply that changes in solution concentration have a greater impact on film thickness than changes in angular velocity.
Figure 8 combines the two previous plots, as given in Equation (4), to determine the static evaporation rate, e. The slope of the fit line is (3e/2)1/3, giving e = 140 nm/s½. The evaporation rate under spinning conditions is then found to be ω   × 140   nm/s½, which is somewhat less than ω × 180 nm/s½ reported in similar studies [3,25]. Possible reasons for this difference may be related to the temperature or the vapor phase composition. As would be expected, the spinning significantly increases the evaporation rate compared to the static evaporation found from the open pan (195 to 570 nm/s).
Figure 9 shows a contour plot of film thicknesses as a function of solution concentration and spin speed experimental variables. The predictive model is reasonable for thickness estimations. This plot is a design space for the selection of polymer solution and spin speed combinations that are likely to generate films of a specified thickness, while each contour represents films of similar mean thickness.

4. Conclusions

A predictive model for the thickness of sub-micron PMMA thin films by spin-coating from toluene has been generated. The bulk chemical properties of the polymer were demonstrated to be unaffected by the solvation and coating processes. Static solvent evaporation, at zero shear film thinning, was demonstrated to deviate from evaporation of pure solvent, beginning at ~0.2χ. Solvent evaporation in the polymer solution was observed to be strongly suppressed from ~0.8χ onward. Surface tension effects may help shape the evaporation rate. Coating solution fluid properties were modeled to polymer concentration. Because solution properties significantly impact film thickness only during hydrodynamic thinning, relationships between solution properties were limited to concentrations up to 10 g/dL. Process mapping was used to generate a three-dimensional design space for control of film thickness.

Supplementary Materials

The following are available online at https://www.mdpi.com/2079-6412/11/2/198/s1, Figure S1: Reflection spectra of PMMA films with fits. (A): 168 nm thick PMMA film with fit (red line). The nonuniformity of the fit is ±19 nm and the goodness of fit is 0.9444. (B): 292 nm thick PMMA film with fit (red line). The nonuniformity of the fit is ±23 nm and the goodness of fit is 0.9666. (C): 302 nm thick PMMA film with fit (red line). The nonuniformity of the fit is ±114 nm and the goodness of fit is 0.9700. (D): 443 nm thick PMMA film with fit (red line). The nonuniformity of the fit is ±69 nm and the goodness of fit is 0.9538. (E): 581 nm thick PMMA film with fit (red line). The nonuniformity of the fit is ±56 nm and the goodness of fit is 0.9304. (F): 686 nm thick PMMA film with fit (red line). The nonuniformity of the fit is ±14 nm and the goodness of fit is 0.9258. (G): 722 nm thick PMMA film with fit (red line). The nonuniformity of the fit is ±29 nm and the goodness of fit is 0.8792.

Author Contributions

Conceptualization, N.C. and M.C.; methodology, N.C. and M.C.; software, N.C. and M.C.; validation, N.C. and M.C.; formal analysis, N.C. and M.C.; investigation, N.C. and M.C.; resources, W.B.E.; data curation, N.C. and M.C.; writing—original draft preparation, N.C.; writing—review and editing, M.C. and W.B.E.; visualization, N.C. and M.C.; supervision, W.B.E.; project administration, W.B.E.; funding acquisition, N.C. and W.B.E. All authors have read and agreed to the published version of the manuscript.

Funding

This research was funded by Rhodes Pharmaceuticals L.P. and by the U.S. Department of Homeland Security’s Science and Technology Directorate. The views and conclusions contained in this document are those of the authors and should not be interpreted as necessarily representing the official views and policies, either expressed or implied, of Rhodes Pharmaceuticals L.P. or any of its affiliates, or the U.S. Department of Homeland Security.

Institutional Review Board Statement

Not applicable.

Informed Consent Statement

Not applicable.

Data Availability Statement

The data presented in this study are available in article.

Conflicts of Interest

The authors declare no conflict of interest.

References

  1. Lalova, A.; Todorov, R.; Malinowski, A.J. Optical properties of thin PMMA films for sensor application. Bulg. Chem. Commun. 2015, 47, 29–34. [Google Scholar]
  2. Martínez, V.M.; Arbeloa, F.L.; Prieto, J.B.; Arbeloa, I.L. Characterization of rhodamine 6G aggregates intercalated in solid thin films of laponite clay. 2 fluorescence spectroscopy. J. Phys. Chem. B 2005, 109, 7443–7450. [Google Scholar] [CrossRef]
  3. Danglad-Flores, J.; Eickelmann, S.; Riegler, H. Deposition of polymer films by spin casting: A quantitative analysis. Chem. Eng. Sci. 2018, 179, 257–264. [Google Scholar] [CrossRef]
  4. Mouhamad, Y.; Mokarian-Tabari, P.; Clarke, N.; Jones, R.A.L.; Geoghegan, M. Dynamics of polymer film formation during spin coating. J. Appl. Phys. 2014, 116, 123513. [Google Scholar] [CrossRef]
  5. Bistac, S.; Schultz, J. Study of solution-cast films of PMMA by dielectric spectroscopy: Influence of the nature of the solvent on α and β relaxations. Int. J. Adhes. Adhes. 1997, 17, 197–201. [Google Scholar] [CrossRef]
  6. Hall, D.B.; Underhill, P.; Torkelson, J.M. Spin coating of thin and ultrathin polymer films. Polym. Eng. Sci. 1998, 38, 2039–2045. [Google Scholar] [CrossRef]
  7. Patra, N.; Barone, A.C.; Salerno, M. Solvent effects on the thermal and mechanical properties of poly(methyl methacrylate) casted from concentrated solutions. Adv. Polym. Technol. 2011, 30, 12–20. [Google Scholar] [CrossRef]
  8. Van Dyk, J.W.; Frisch, H.L.; Wu, D.T. Solubility, solvency, and solubility parameters. Ind. Eng. Chem. Prod. Res. Dev. 1985, 24, 473–478. [Google Scholar] [CrossRef]
  9. Vashishtha, S.R.; Chand, N.; Hashmi, S.A.R. Morphology of PS/PMMA blends and their solution rheology. Indian J. Chem. Technol. 2002, 9, 316–323. [Google Scholar]
  10. Zhang, H.Q.; Euler, W.B. Detection of gas-phase explosive analytes using fluorescent spectroscopy of thin films of xanthene dyes. Sens. Actuators B. Chem. 2016, 225, 553–562. [Google Scholar] [CrossRef]
  11. Penzkofer, A.; Drotleff, E.; Holzer, W. Optical constants measurement of single-layer thin films on transparent substrates. Opt. Commun. 1998, 158, 221–230. [Google Scholar] [CrossRef]
  12. Emslie, A.G.; Bonner, F.T.; Peck, L.G. Flow of a viscous liquid on a rotating disk. J. Appl. Phys. 1958, 29, 858–862. [Google Scholar] [CrossRef]
  13. Meyerhofer, D. Characteristics of resist films produced by spinning. J. Appl. Phys. 1978, 49, 3993–3997. [Google Scholar] [CrossRef] [Green Version]
  14. Haas, D.E.; Quijada, J.N.; Picone, S.J.; Birnie, D.P., III. Effect of solvent evaporation rate on skin formation during spin coating of complex solutions. In Sol-Gel Optics V; Dunn, B.S., Pope, E.J.A., Schmidt, H.K., Yamane, M., Eds.; SPIE: Bellingham, WA, USA, 2000; pp. 280–284. [Google Scholar] [CrossRef] [Green Version]
  15. Weissberg, S.G.; Simha, R.; Rothman, S. Viscosity of dilute to moderately concentrated polymer solutions. J. Res. Natl. Bur. Stand. 1951, 47, 298–314. [Google Scholar] [CrossRef]
  16. Matsuoka, S.; Cowman, M.K. Equation of state for polymer solution. Polymer 2002, 43, 3447–3453. [Google Scholar] [CrossRef]
  17. Patrone, E.; Bianchi, U. Viscosity-molecular weight relationships for low molecular weight polymers. II. poly(vinyl acetate) and poly(methyl methacrylate). Die Makromol. Chem. 1966, 94, 52–59. [Google Scholar] [CrossRef]
  18. Brandrup, J.; Immergut, E.H.; Grulke, E.A.; Abe, A.; Bloch, D.R.; Wiley, J.; Chichester, N.Y.; Brisbane, W.; Toronto, S. Polymer Handbook, 4th ed.; Wiley-Interscience: Hoboken, NJ, USA, 1999. [Google Scholar]
  19. Cohn-Ginsberg, E.; Fox, T.; Mason, H. Properties of dilute polymer solutions II: Light scattering and viscometric properties of solutions of conventional polymethyl methacrylate. Polymer 1962, 3, 97–109. [Google Scholar] [CrossRef]
  20. Moore, W.R.; Fort, R.J. Viscosities of dilute solutions of polymethyl methacrylate. J. Polym. Sci. Part A Gen. Pap. 1963, 1, 929–942. [Google Scholar] [CrossRef]
  21. Matsuda, H.; Yamano, K.; Inagaki, H. Styrene-methyl acrylate copolymers and acrylate homopolymers in solution. J. Polym. Sci. Part A-2 Polym. Phys. 1969, 7, 609–633. [Google Scholar] [CrossRef]
  22. Yamamoto, H. Hansen Solubility Parameter(HSP)-HSP Application Note #2. 2009. Available online: https://pirika.com/NewHP/PirikaE/polymer-solvent.html (accessed on 28 December 2020).
  23. Hansen, C.; Hansen, K. Solubility parameter prediction of the barrier properties of chemical protective clothing. In Performance of Protective Clothing: Second Symposium; ASTM International: West Conshohocken, PA, USA, 1988; pp. 197–208. [Google Scholar] [CrossRef]
  24. Hansen, C.M. Hansen Solubility Parameters: A User’s Handbook, 2nd ed.; CRC Press: Boca Raton, FL, USA, 2007. [Google Scholar]
  25. Mokarian-Tabari, P.; Geoghegan, M.; Howse, J.R.; Heriot, S.Y.; Thompson, R.L.; Jones, R.A.L. Quantitative evaluation of evaporation rate during spin-coating of polymer blend films: Control of film structure through defined-atmosphere solvent-casting. Eur. Phys. J. E 2010, 33, 283–289. [Google Scholar] [CrossRef]
  26. Gałka, P.; Kowalonek, J.; Kaczmarek, H. Thermogravimetric analysis of thermal stability of poly(methyl methacrylate) films modified with photoinitiators. J. Therm. Anal. Calorim. 2014, 115, 1387–1394. [Google Scholar] [CrossRef] [Green Version]
  27. Ferriol, M.; Gentilhomme, A.; Cochez, M.; Oget, N.; Mieloszynski, J.L. Thermal degradation of poly(methyl methacrylate) (PMMA): Modelling of DTG and TG curves. Polym. Degrad. Stab. 2003, 79, 271–281. [Google Scholar] [CrossRef]
  28. Kashiwagi, T.; Inaba, A.; Brown, J.E.; Hatada, K.; Kitayama, T.; Masuda, E. Effects of weak linkages on the thermal and oxidative degradation of poly(methyl methacrylates). Macromolecules 1986, 19, 2160–2168. [Google Scholar] [CrossRef]
  29. Peng, J.; Yang, F.; Chiang, D.; Lee, S. Kinetics of field-induced surface patterns on PMMA. Langmuir 2016, 32, 4602–4609. [Google Scholar] [CrossRef] [PubMed]
  30. Chapman, M.; Mullen, M.; Novoa-Ortega, E.; Alhasani, M.; Elman, J.F.; Euler, W.B. Structural evolution of ultrathin films of rhodamine 6G on glass. J. Phys. Chem. C 2016, 120, 8289–8297. [Google Scholar] [CrossRef]
Figure 1. Huggin’s plot of reduced specific viscosity versus polymer concentration. Nonlinear regression by series expansion of Equation (7) and parameters converged by the sixth term for [η] = 0.292 ± 0.031 and K H = 0.500 ± 0.101 (R2 = 0.96). Lines for the first six term expansions of Equation (7) have been plotted. Vertical error bars are presented for all points.
Coatings 11 00198 g001
Figure 2. Dynamic viscosity as a function of spin-coating solution concentration. The fit line was determined by combining Equation (5) with Equation (7) (truncated at the third term) and solving for η0, with R2 = 0.973 and standard error ± 0.34.
Coatings 11 00198 g002
Figure 3. (a): TGA thermogram showing isothermal evaporation of pure toluene and a 10 g/dL PMMA–toluene solution under N2 purge. Both solutions were monitored until dry. The residue mass in the 10 g/dL PMMA curve represents the dried polymer. (b): Derivative TGA thermogram of solvent and polymer solution at ambient temperature with respect to polymer mass fraction.
Coatings 11 00198 g003
Figure 4. TGA thermogram of bulk PMMA and spin-cast film at 10 °C/min; 10.95 mg of PMMA powder and 0.28 mg of spin-cast film were used in the measurements.
Coatings 11 00198 g004
Figure 5. FTIR spectra of bulk PMMA and spin-cast film collected in ATR mode with a diamond crystal. The thin film was not removed from the glass substrate prior to measuring spectra, which limited the spectral range to 1200 cm−1 due to the strong silicate absorbance from the glass substrate.
Coatings 11 00198 g005
Figure 6. Film thickness as a function of the casting solution properties, per Equation (4). χo is the polymer concentration (mass fraction) and ν0 is the kinematic viscosity. Error bars are the standard deviation of at least 3 measurements per point.
Coatings 11 00198 g006
Figure 7. Scatter plot of spin speed contribution to film thickness. Scatter plot of final film height by spin speed scaled by Equations (1)–(4). Error bars are the standard deviation of at least 3 measurements per point.
Coatings 11 00198 g007
Figure 8. Film thickness as a function of deposition parameters, Equation (4). The slope of the linear fit (red line) gives the static evaporation rate, e. Error bars are the standard deviation of at least 3 measurements per point.
Coatings 11 00198 g008
Figure 9. Contour plot of thickness as a function spin speed and solution concentration.
Coatings 11 00198 g009
Table 1. Poly(methylmethacrylate) (PMMA) intrinsic viscosity estimated from Mark–Houwink parameters. Intrinsic viscosity estimates determined from Equation (10). Coefficients, KMH and a, were obtained from studies that utilized different analytical techniques. Presented results and referenced studies were performed at comparable temperatures.
[η] (dL/g)MMH (10−3 mL/g)αT (°C)MeasurementReference
0.292 ± 0.03120Viscositythis work
0.287.00.7130Viscosity[20]
0.338.120.7125Osmometry[21]
0.277.790.69725light scattering[19]
Table 2. Hansen solubility parameters for PMMA and toluene. Data from Refs. [22,23].
MaterialδD (MPa)½δP (MPa)½δH (MPa)½
PMMA19.744.9211.5
Toluene18.01.42.0
Publisher’s Note: MDPI stays neutral with regard to jurisdictional claims in published maps and institutional affiliations.

