Article

PLGA Coatings and PLGA Drug-Loading Coatings for Cardiac Stent Samples: Degradation Characteristics and Blood Compatibility

1
The Second Affiliated Hospital of Heilongjiang University of Chinese Medicine, Harbin 150001, China
2
College of Mechanical Science and Engineering, Northeast Petroleum University, Daqing 163318, China
3
School of Mechatronics Engineering, Qiqihar University, Qiqihar 161006, China
*
Author to whom correspondence should be addressed.
Coatings 2021, 11(11), 1427; https://doi.org/10.3390/coatings11111427
Submission received: 28 October 2021 / Revised: 10 November 2021 / Accepted: 15 November 2021 / Published: 22 November 2021
(This article belongs to the Special Issue State-of-the-Art on Coatings Research in Asia)

Abstract

:
PLGA (Poly lactic-co-glycolic acid) and PLGA drug-loading coatings were prepared on 316 L stainless steel by electrostatic spray deposition (ESD). The surface morphology, three-dimensional morphology, and crystal structures of the coatings were observed by scanning electron microscopy (SEM), atomic force microscopy (AFM), and X-ray diffraction (XRD). Thermal properties, molecular weight, and coating composition were studied by differential scanning calorimetry (DSC), gel permeation chromatography (GPC), and NMR. The degradation behaviors of the coatings were studied by mass changes, relative molecular mass and distributions, polymer compositions, thermal properties, and surface morphologies. The blood compatibilities of the coatings were investigated by platelet adhesion testing and dynamic coagulation times. SEM results indicated the drug-loading coating with 33% RAPA had the smoothest and most compact morphology. Addition of RAPA decreased the Tg of the PLGA coating, accompanied by partial crystallization that slowed the degradation rate of the drug-loaded coating. Microscopically, the morphology of the PLGA drug-loaded coating was coarser than the PLGA coating. The average surface roughness values of line and surface scannings were 16.232 nm and 39.538 nm, respectively. The surface of the drug-loading coating was micro uneven, and the macro smooth and micro multiphase separation structure helped improve its blood compatibility.

1. Introduction

Heart disease is one of the primary threats to human health. Currently, approximately one million patients worldwide receive percutaneous coronary angioplasty (PTCA) every year [1]. However, the incidence of restenosis after implantation reaches nearly 34%, and restenosis has become the main factor restricting the development of PTCA [2,3,4]. The preparation of the drug coating on the stent surface inhibits the transition proliferation of smooth muscle cells through drug sustained release, which has become an effective method for the treatment of restenosis [5,6,7,8]. Poly lactic-co-glycolic acid (PLGA) has shown broad applicability as a drug carrier because of its reliable safety, excellent biocompatibility, and controllable biodegradability. It biodegrades readily and serves as a good carrier for drug-eluting stents. Generally, the drug stents used in clinic are mainly rapamycin and paclitaxel. Rapamycin (RAPA) has become one of the main drugs fighting stent restenosis because of its wide safe dosage range, selective inhibition of cell proliferation, reduction of local vascular cytokine production, and inhibition of inflammatory cell activation [9,10]. The well-known drug paclitaxel exhibits a wide spectrum of anti-tumor effects, but it increases the risk of arterial wall necrosis and aneurysm formation with long-term presence in the vascular wall. Therefore, RAPA is an ideal drug for depositing on 316 L stainless steels.
At present, polymer carrier coatings on vascular stent surfaces are prepared by dip coating, but that polymer coating suffers from defects such as winding, blocking, and non-uniformity [11,12]. Electrostatic spray deposition (ESD) uses high pressure to crack the polymer solution into fine droplets that adsorb to the substrate surface using a strong electric field to obtain uniform and smooth coatings. This method sees broad utilization in machinery, chemical industry, electronic information, micro medical devices, medical information, and others [13,14,15]. Olga et al. [16] applied PLGA to drug-eluting stent coatings and found that PLGA effectively inhibited the growth of granulation tissue. Qi et al. [17] prepared a gelatin GNS/CTS (gelatin nanospheres/chitosans) composite coating on a WE43 substrate by electrophoretic deposition and found the degradation rates of the coating were lower than the matrix metal. Liu et al. [18] discovered that rapamycin drug-coated double stents more effectively regulate the levels of serum adiponectin, GDF-15, and Cys-C in patients with true coronary bifurcation lesions. Khalil et al. [19] demonstrated that the drug coating had higher biocompatibility and lower cytotoxicity.
Although there are many investigations on the preparation of drug-loading coatings, the service life and application effect of these coatings are restricted to the release characteristics of the drugs. In addition, the feasibility of biomedical molecular polymers and their application in the medical field are mainly determined by their biocompatibility and degradation characteristics. The application of ESD technology in the preparation of coatings on the surface of vascular stents has not been reported. Therefore, a PLGA drug-loading coating was prepared using ESD with 316 L stainless steel as the support for coatings, PLGA 75/25 as the carrier, and RAPA as the drug; the surface morphology, degradation characteristics, and blood compatibility of the coating were investigated in order to provide a theoretical basis for the study of drug-loading coating stent.

2. Experimental Method

2.1. Preparation

The drug-loading coating was subjected to the following preparation procedures: (i) The 316 L medical stainless-steel sample (Φ10 mm × 2 mm) was successively placed in acetone, ethanol, and distilled water for ultrasonic cleaning for 20 min after polishing, and dried in a vacuum oven at 80 °C for 24 h. (ii) PLGA75/25 was dissolved in 1,4-dioxane to prepare a uniform solution, and RAPA was dissolved in that solution to prepare the paint. (iii) The stainless-steel substrate was grounded into electrical neutral through a conductor. The paint was injected into the coating container of the electrostatic spraying device, and the coating container was connected to a high-pressure pump that sent the pressurized paint to the nozzle of a spray gun through a delivery pipe. Once the paint traveled through the nozzle, it immediately depressurized, expanded violently, and atomized into small droplets; these were discharged by the electrostatic generator and charged to form an electrostatic field between the nozzle and the vascular support. The charged coating adsorbed to the stainless-steel surface and formed a uniform coating via the combination of electric field gravity and high-voltage thrust.

2.2. Morphology and Thermal Property Test

The surface morphology of the coating was observed by scanning electron microscopy (SEM, JSM-5600LV, Japan, JEOL). The three-dimensional morphology of the coating surface was observed by atomic force microscopy (AFM, Solver Nano, Russia, NT-MDT), and the average surface roughness of the coating was analyzed by line and surface scanning. The phase structure of the coating sample was observed by X-ray diffraction (XRD-6000, Japan, JEOL) using Cu k (λ = 1.5406 Angstroms) radiation. Scans were recorded from 5–50° at an operating target voltage of 40 kV, a tube current of 30 mA, and a scan step of 0.02°. The composition of the copolymer was determined by 1H-NMR (INOVA-400M, Varian, Palo Alto, CA, USA), in which tetramethylsilane was used as the internal standard and CDCl3 as the solvent. The relative molecular mass of the polymer was calculated by gel permeation chromatography (GPC-220, PL, London, UK), THF was used as the eluent (flow rate of 1.0 mL/min), and a test temperature of 40 °C with polystyrene as the standard sample. The thermal properties of the copolymer were measured by differential scanning calorimetry (DSC-822E, Toledo, OH, USA), and nitrogen was the carrier gas (flow rate 30 mL/min) at a heating rate of 10 °C/min. The mass of the sample was weighed by electronic balance (EB-ME5, Sartorius, Göttingen, Germany).

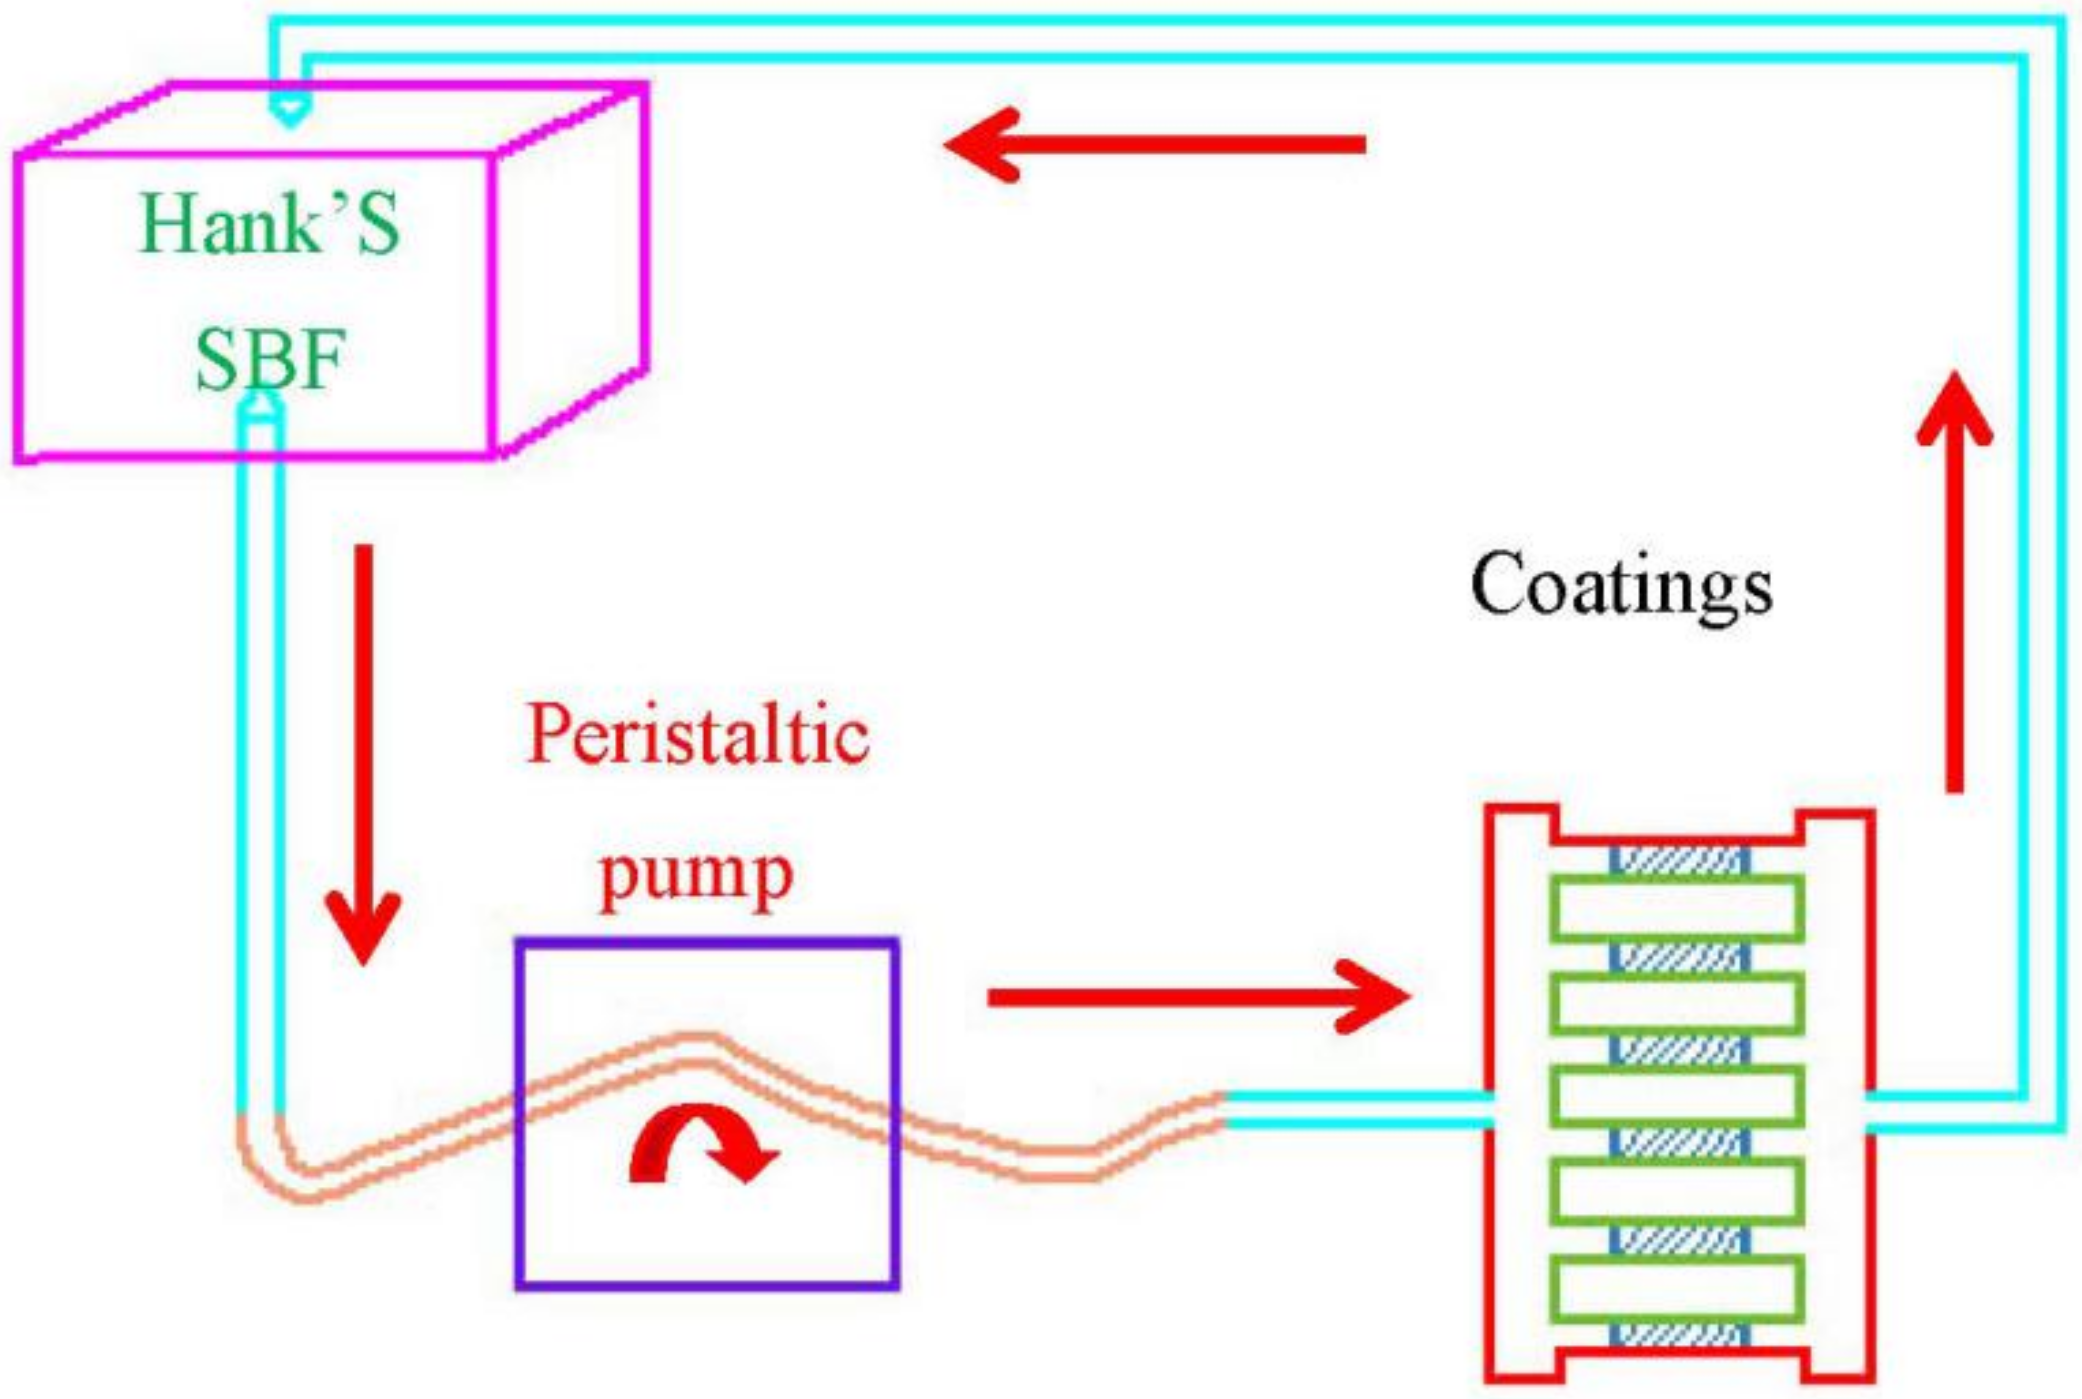
2.3. Degradation Characteristics

Figure 1 shows the dynamic degradation process of PLGA drug-loading coating. The sample was placed in the dynamic system and the solution was Hank’s simulated body fluid at 37 °C. The speed of the dynamic circulation device was controlled by a peristaltic pump, and the speed of the peristaltic pump was adjusted so the flow rate of the simulated body fluid equaled that of blood in the normal human coronary artery at a flow rate of 20 cm/s. The sample was removed and washed with deionized water three times for about 10 min. After vacuum drying to constant weight at room temperature (25 °C), it was used for characterization and analysis.

2.4. Platelet Adhesion Test

Fresh anticoagulant human blood was centrifuged at 3600 r/min for 20 min, and the upper platelet-rich plasma was used to make a platelet solution. The samples were placed in the dynamic system. In order to simulate the flow rate of the human coronary artery, the flow rate of the peristaltic pump was set at 60 r/min. The coated samples were soaked in a platelet solution for 1 h, then rinsed with a normal saline solution and fixed with a 2.5% glutaraldehyde solution. They were dehydrated with alcohol and dealcoholized with isoamyl acetate. After drying at the critical point and spraying silver, the morphology of samples was observed by SEM, and then cytometry was used for the cell adhesion rate.

2.5. Dynamic Coagulation Time

A certain amount of anticoagulant human blood (5 mL) was deposited on the coated sample surface, and an appropriate amount of CaCl2 solution was added by a micro sampler and gently stirred with the needle of the microsyringe. After standing for a predetermined time (10, 20, 30, 40, 50, or 60 min), the coated samples were placed in 30 mL of distilled water. Non-coagulated blood cells will have hemolytic reactions, while free hemoglobin will distribute evenly in distilled water. The concentration of hemoglobin was measured by spectrophotometry (wavelength 545 nm) and characterized by solution absorbance.

3. Results and Discussion

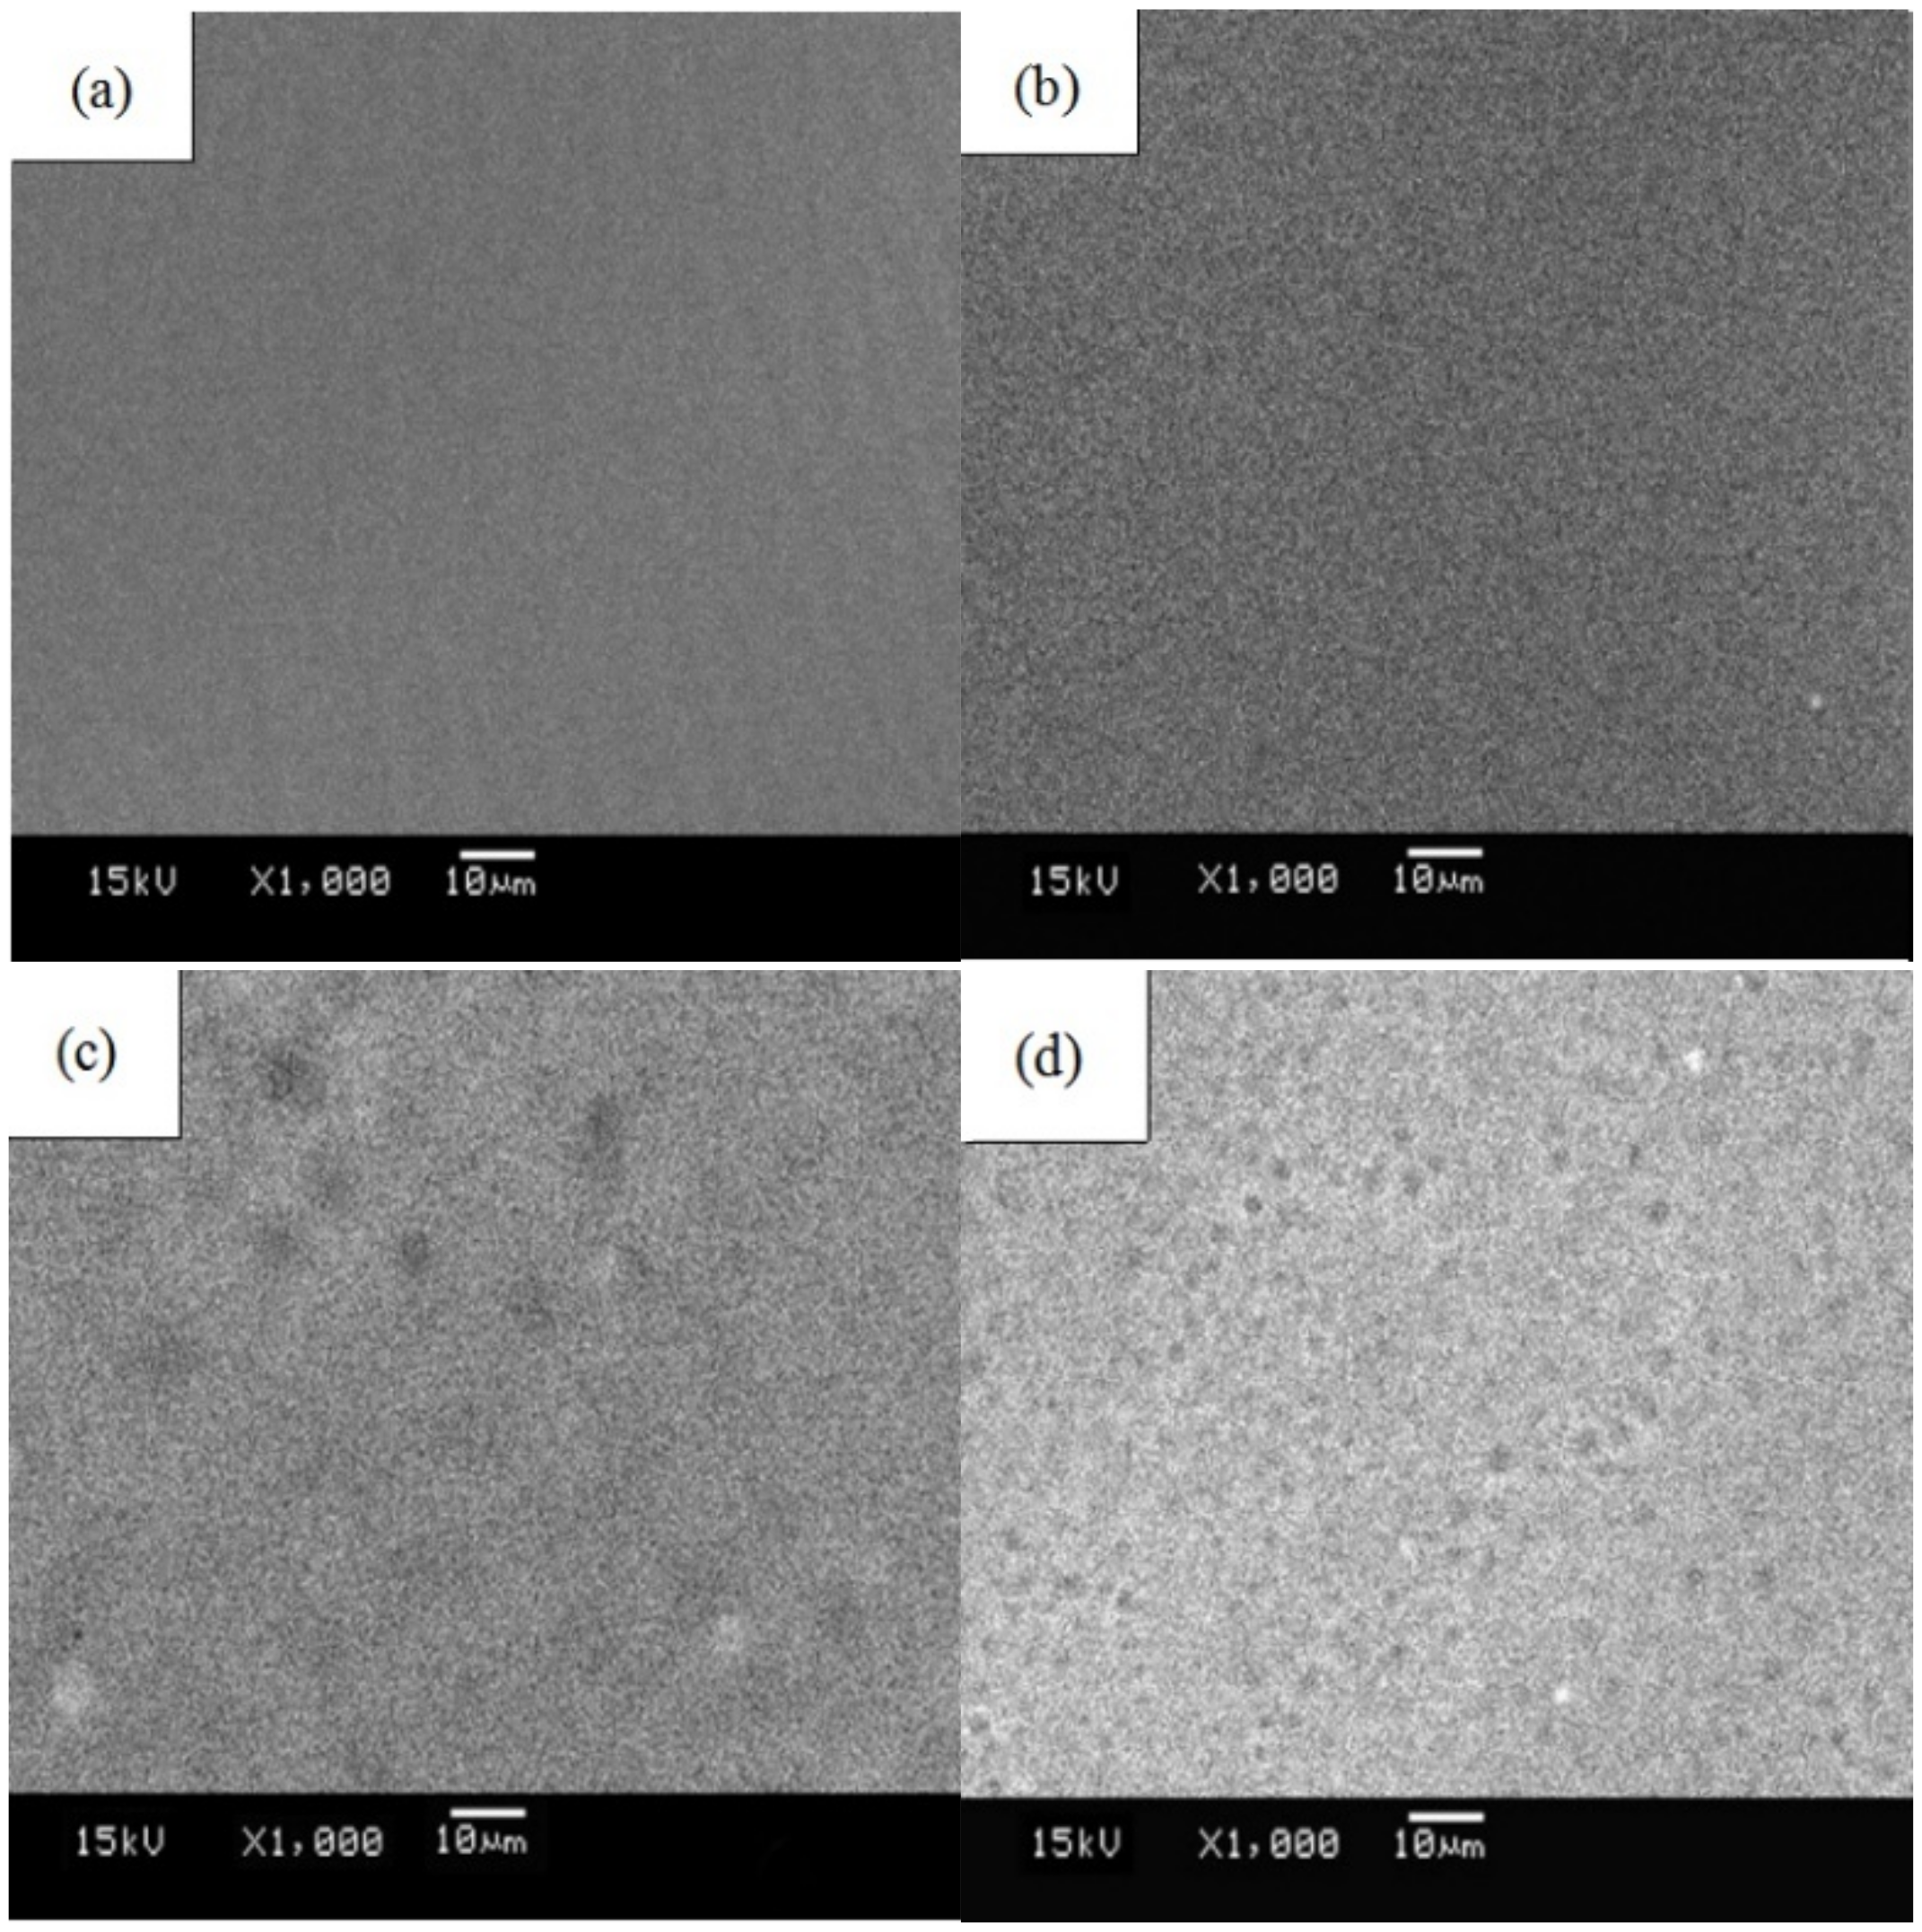
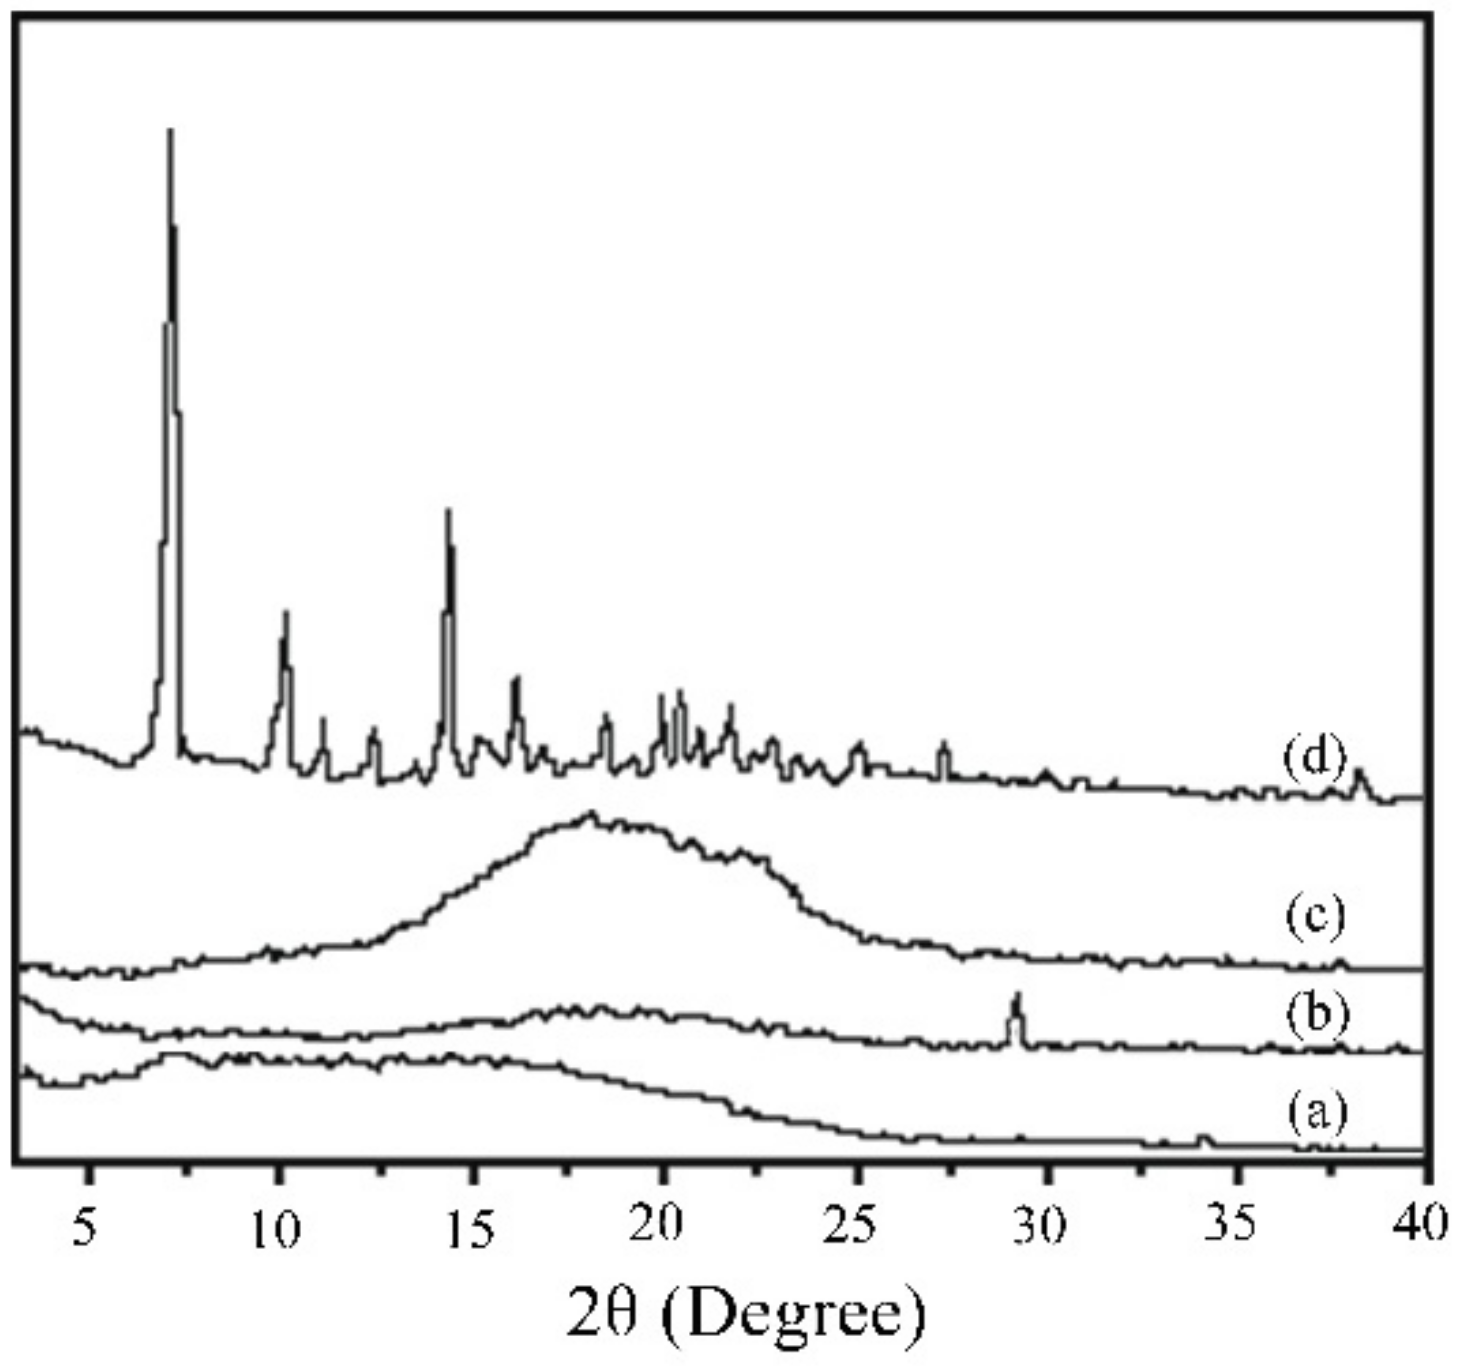
3.1. SEM, DSC, and XRD Measurements of PLGA Drug-Loading Coatings

Figure 2 depicts the surface morphology of the PLGA and PLGA drug-loading coatings. The morphology shown in Figure 2a was relatively compact, and the compactness was slightly lower than seen in Figure 2b. In contrast, the surface shown in Figure 2b was dense and uniform, and the coating was transparent. There were individual dots on the coating surface (Figure 2c), and the coating color changed from transparent to slightly white. The number of spots significantly increased (Figure 2d), and the color of the coating was white. The morphology of the coating did not significantly differ from the PLGA coating when the RAPA level was 33%. The drug did not disperse completely in the carrier solution, which resulted in the aggregation of individual molecules when RAPA levels increased to 50% (Figure 2e). The coating is slightly white because RAPA is a white solid crystal. When the RAPA concentration was 66%, more non-dispersed drug molecules led to increased aggregation, and the coating became distinctly white.
The thermal performance analyses of PLGA and PLGA drug-loading coatings are illustrated in Figure 3. Only Tg (52.6 °C) was observed in the DSC curve of PLGA, indicating that it is amorphous. RAPA had two melting peaks at 191.6 °C (154.39 J/g) and 201.8 °C (41.49 J/g), which were endothermic peaks of drug crystals. When 33% RAPA was added, Tg became 39.7 °C, and a weak endothermic peak was observed, indicating that the drug was still dispersed in PLGA in an amorphous state. When RAPA concentration was 66%, two melting peaks were observed at 174.5 °C (14.52 J/g) and 196.5 °C (15.26 J/g), respectively. This explained that the drug formed a eutectic with the carrier, and the drug existed in PLGA in the form of micro-crystalline [20].
Figure 4 shows the X-ray diffraction pattern of the PLGA drug-loading coating with different drug contents. When the content of RAPA was 33%, the XRD curve showed a diffuse peak, which was amorphous. The characteristic peak of RAPA crystal appeared in 2θ at 7.1°, 10.1°, and 14.4°. When the dosage was 50%, the diffusion peak was enhanced, and there was still no drug diffraction peak. Therefore, we can speculate that when the drug content was 33%, the dispersed drug was protected by adjacent polymer molecules and had high physical stability, and existed in an amorphous state. When the dosage increased to 50%, some drug molecules were separated from the polymer; the drug-loading coating changed from an amorphous state to a partially crystalline state, and the drug molecules were not protected by the polymer to produce recrystallization [21,22,23].

3.2. Degradation Characteristics of PLGA Drug-Loading Coatings

Figure 5a–d present the SEM morphologies of PLGA coatings before degradation and after 8 weeks, 11 weeks, and 14 weeks, respectively. The PLGA surface coating is dense before degradation. Micropores formed on the surface after eight weeks of degradation, and after 11 weeks, the pore size increased and some hollow structures formed. After 14 weeks, the center of the coating became a soft nonporous polymer, while there were still some thicker pores on the periphery. Figure 5e–h show the SEM morphologies of PLGA drug-loading coatings before degradationafter 8 weeks, 11 weeks, and 14 weeks, respectively. The surface of the PLGA drug-loading coating was dense and had a small number of white spots before degradation, though after 8 weeks, micropores formed and spots remained. After 11 weeks, the micropores expanded and the white spots disappeared, and after 14 weeks, some pores disappeared and new pores appeared. White spots formed due to incompletely dispersed drug particles. The drug diffuses into the medium upon degradation, and holes are formed in the PLGA. The entry of water molecules makes the coating degrade preferentially at these holes.
The degradation of PLGA and PLGA drug-loading coatings in Hank’s simulated bodily fluid is shown in Figure 6. In the first week of degradation, there was a slight loss of coating quality (~10%) caused by incomplete monomer polymerization. After that, both coatings experienced a constant weight period for approximately seven weeks. However, the quality of PLGA coatings decreased much faster than drug-loading coatings after seven weeks. The pH values of PLGA and PLGA drug-loading coatings are listed in Table 1. The lowest pH levels corresponded to the maximum mass loss for PLGA coatings, while the pH value of the solution changed only slightly for the drug-loading coating. After eight weeks, many small acidic molecules were produced, which decreased the pH of the medium.
Figure 7 reveals the DSC curves of PLGA and PLGA drug-loading coatings. The glass transition temperature (Tg) of the PLGA coating decreased from 52.6 °C to 18.2 °C, and there was no melting peak (Figure 7a). The Tg of PLGA decreased from 52.6 °C to 39.7 °C upon addition of RAPA and a melting peak was observed at 194.9 °C, and the melting heat was 15 J/g (Figure 7b). When the degradation reached the 8th week, Tg increased from 39.7 °C to 51.3 °C, and the melting peak increased from 194.9 °C to 198.4 °C. These results indicated the Tg of the drug-loaded coating gradually increased and approximated the PLGA coating; the melting peak also gradually shifted to the right, and the melting point tended to decrease. The pure PLGA coating was amorphous. As degradation progressed, the coating integrity decreased, which resulted in a continuous decline of Tg [24,25]. The addition of RAPA reduced the Tg of the PLGA coating. Also, a melting peak was observed, which signified crystallization of the drug molecule. Upon degradation of the drug-loading coating, small drug molecules gradually diffused into the medium, making the Tg of the drug-loading coating close to the PLGA coating, and the melting point gradually decreased. When the degradation reached the 11th week, the specific heat was only 3.78 J/g, indicating levels of drug molecules in the coating were very low.

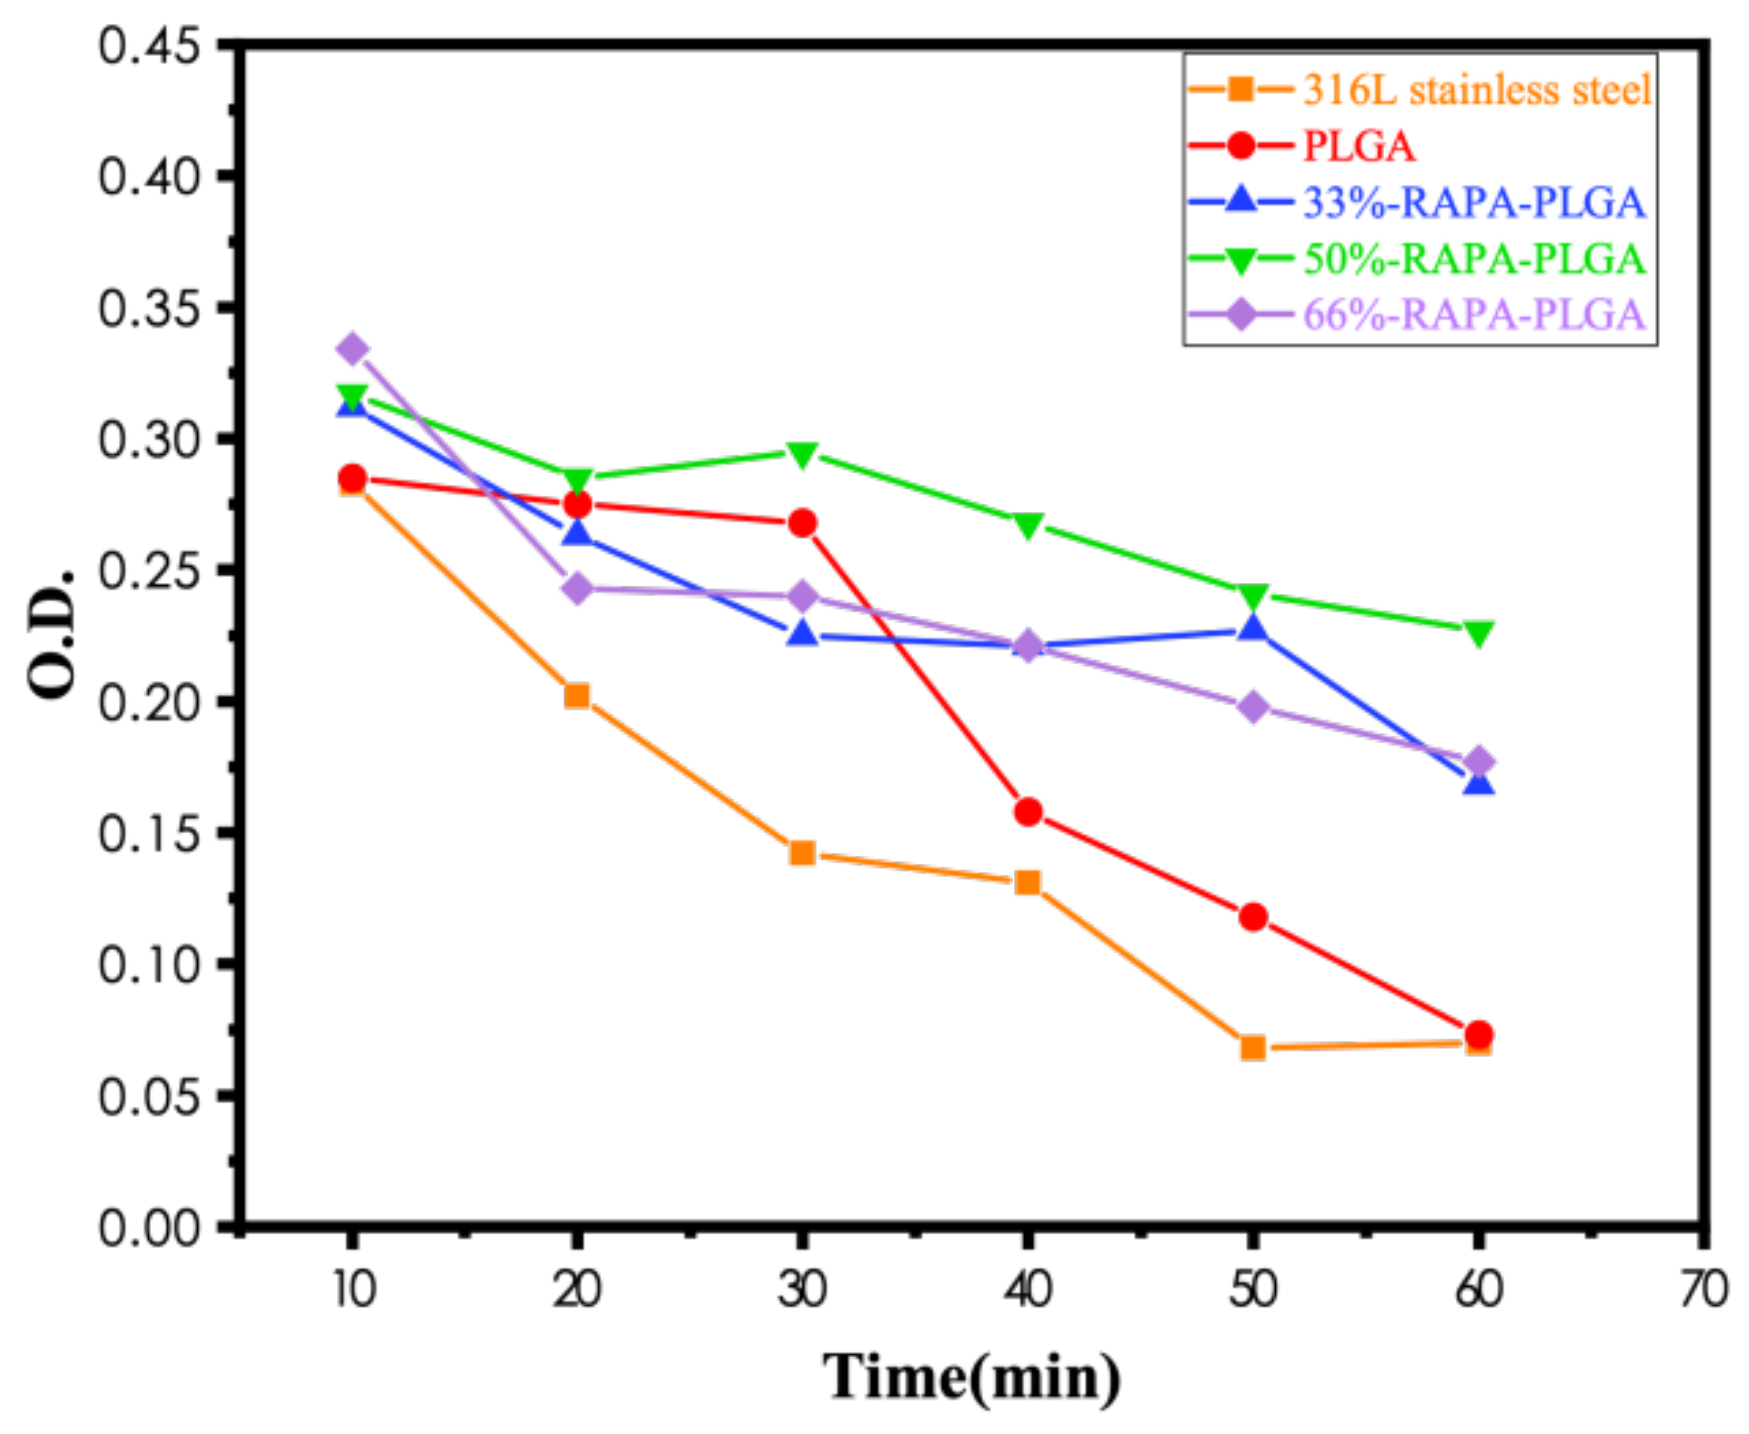
3.3. Blood Compatibility Analyses of PLGA Drug-Loading Coatings

The blood compatibility of materials closely relates to the surface roughness of materials. For implants in contact with blood, the surface roughness shall not exceed 50 nm, otherwise, platelets and blood cells will adhere to the implant surface and lead to thrombosis [26]. Figure 8 shows AFM morphology photos of PLGA and 50%-RAPA-PLGA drug-loading coatings (scanning range 0–20 μm). The surface of the PLGA coating was uniform, smooth, and had little variation, while the surface of the PLGA drug-loading coating was uneven. Figure 9 shows the AFM photos and surface roughness analysis of PLGA coatings. The average surface roughness values of line and surface scanning were 0.471 nm and 0.931 nm, respectively. Figure 10 displays the AFM photos and surface roughness analysis of PLGA drug-loading coatings. The average surface roughnesses of line and surface scanning were 16.232 nm and 39.538 nm, respectively. There was microheterogeneity on the coating surface. PLGA drug-loading coatings were coarser than PLGA coatings, but their Ra value was still less than 50 nm. RAPA and PLGA had different chemical properties. The drug-loading coating mixed them to form a non-uniform physical morphology and uneven chemical properties, which resulted in a micro-phase separation structure and increased the critical tension. Moreover, the interfacial free energy dropped and the polar dispersion ratio increased, which effectively improved the blood compatibility of the coating. The coating smoothness has a great influence on its biocompatibility, and the micro coarse surface (Ra ≈ 1 μm) is advantageous for the coating. A coarser implant surface in direct contact with blood increases coagulation, while high surface smoothness (Ra < 50 nm) helps improve blood compatibility. Studies [27,28,29,30] have shown the vascular walls of organisms are very smooth from a macroscopic viewpoint—an endothelium surface membrane of the vascular endothelium is a bilayer lipid liquid matrix with particles embedded in the membrane. The macroscopic smooth and microscopic multiphase separation structure has excellent anticoagulant properties.
Figure 11 displays the SEM image of platelet adhesion on the surface of a stainless-steel substrate, a PLGA coating, and a PLGA drug-loading coating. Many platelets adhere to the stainless-steel surface; the platelets are deformed and have pseudopodia and aggregate simultaneously (Figure 11a). The platelet adhesion on the surface of the PLGA coating was significantly lower than the matrix, and individual platelets were deformed and stretched out pseudopodia without aggregation (Figure 11b). The number of platelets adhered to the PLGA surface drug-loading coating was significantly less than for the PLGA coating, there was no deformation or pseudopodia formation, and there was no obvious difference among the different drug-loading coatings (Figure 11c–e). Figure 12 displays the statistical results of platelet adhesion after an hour of platelet contact with the material; the adhesion of the coating decreased significantly after drug loading, which agreed with the results shown in Figure 11. After the implant came into contact with blood, a complex protein adsorption layer was formed on the surface. Platelets adhered to the surface of the adsorption layer increased the viscosity and further aggregated to release a large number of coagulation factors to cause coagulation [31,32]. The number of platelets adhered to the PLGA drug-loaded coating surface was the least, and the coating did not deform or cause further platelet aggregation.
Figure 13 presents the O.D. measured at different times on the 316 L stainless steel substrate, PLGA coating, and PLGA drug-loading coating with different drug amounts. The time when O.D. = 0.100 was used as the coagulation time, and the absorbance of the coating decreased slowly over time. The matrix decreased the fastest with a coagulation time of 44 min, while the coagulation time of the PLGA coating was 53 min. The drug-loading coating did not coagulate for 1 h, and the drug-loading coating with 50% RAPA decreased the slowest; the declination rates were nearly identical when the drug doses were 33% and 66%. Consequently, the drug-loading coating has a longer coagulation time and a lower activation degree of coagulation factors, among which the drug-loading coating with 50% RAPA content has the lowest activation degree.

4. Conclusions

(1)
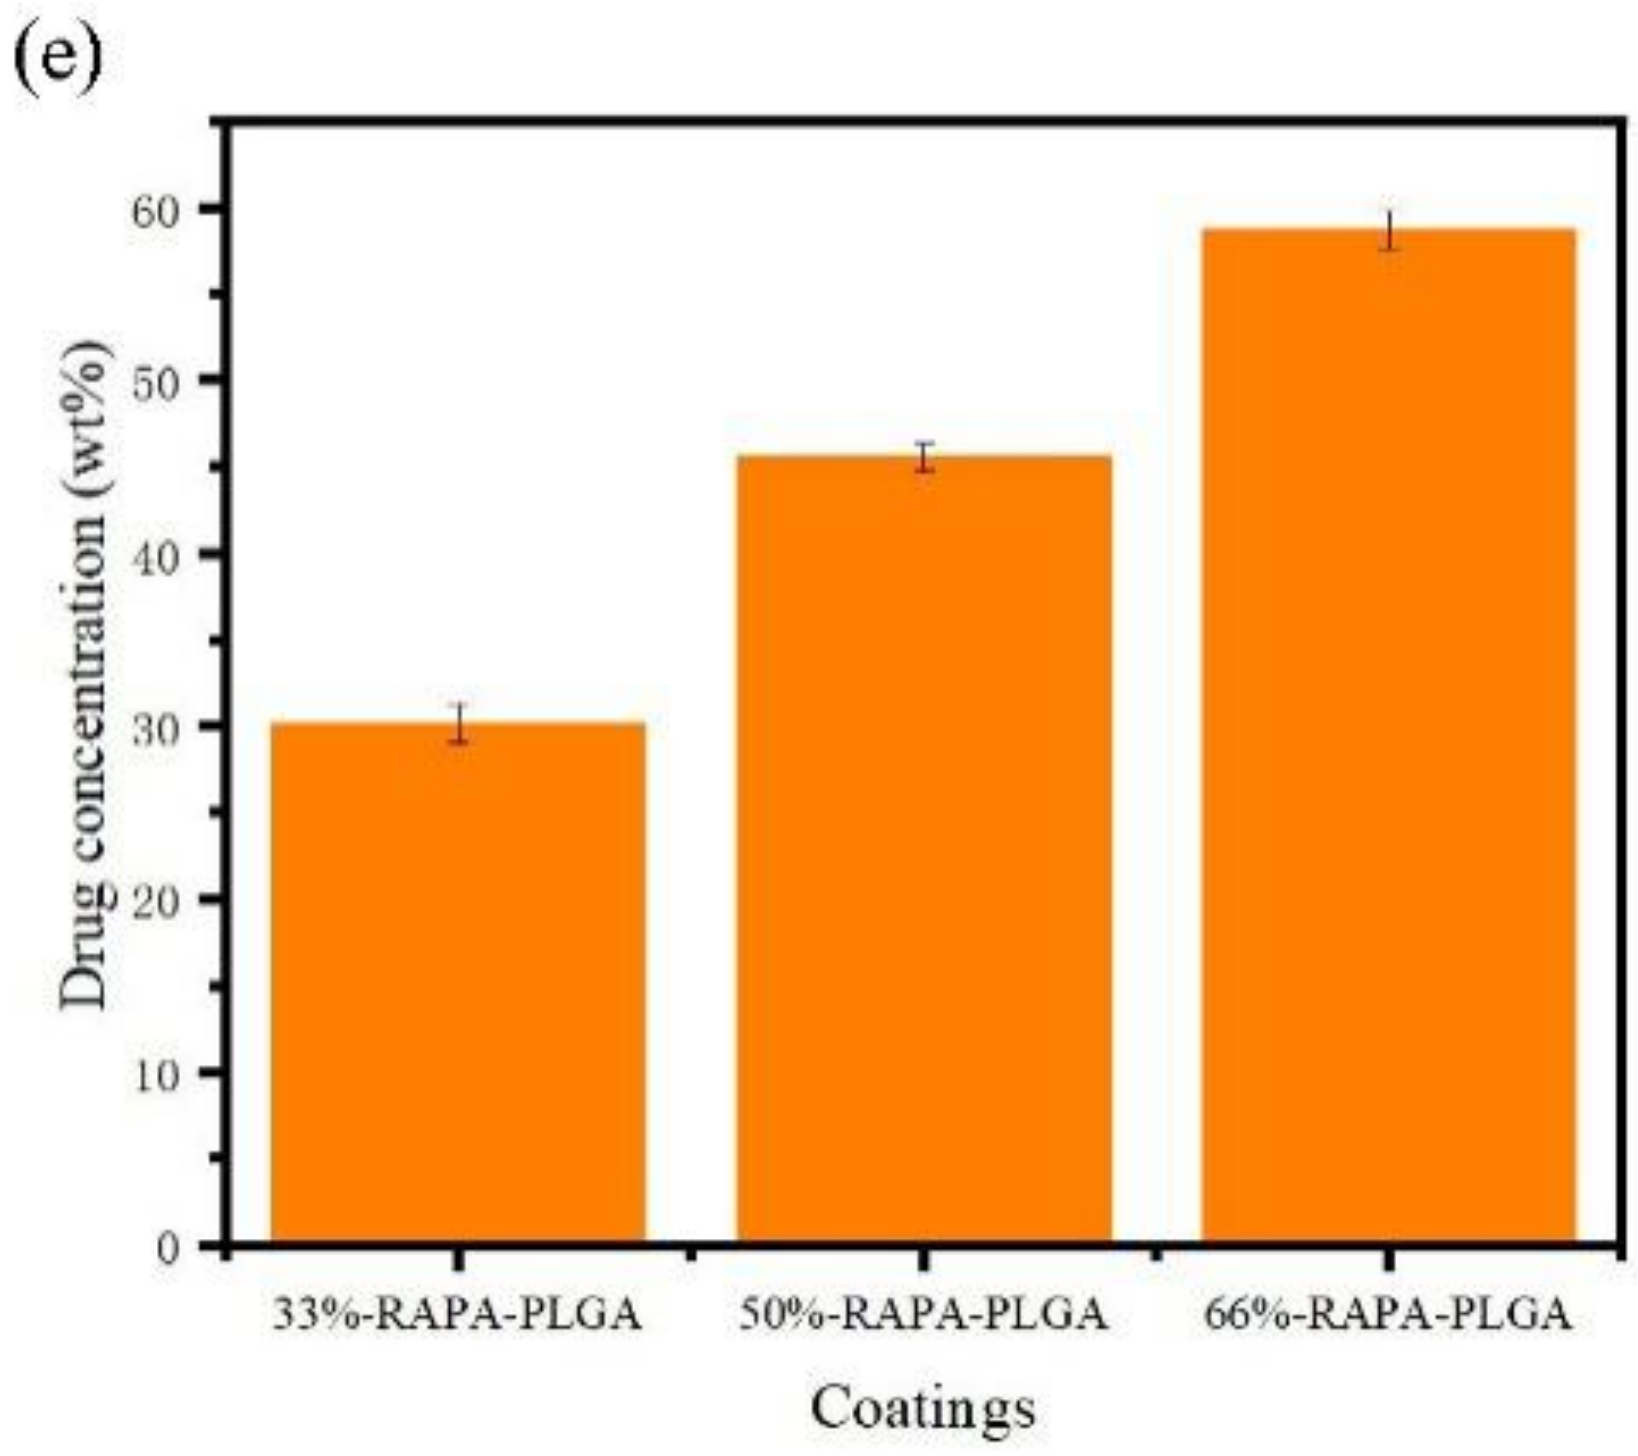
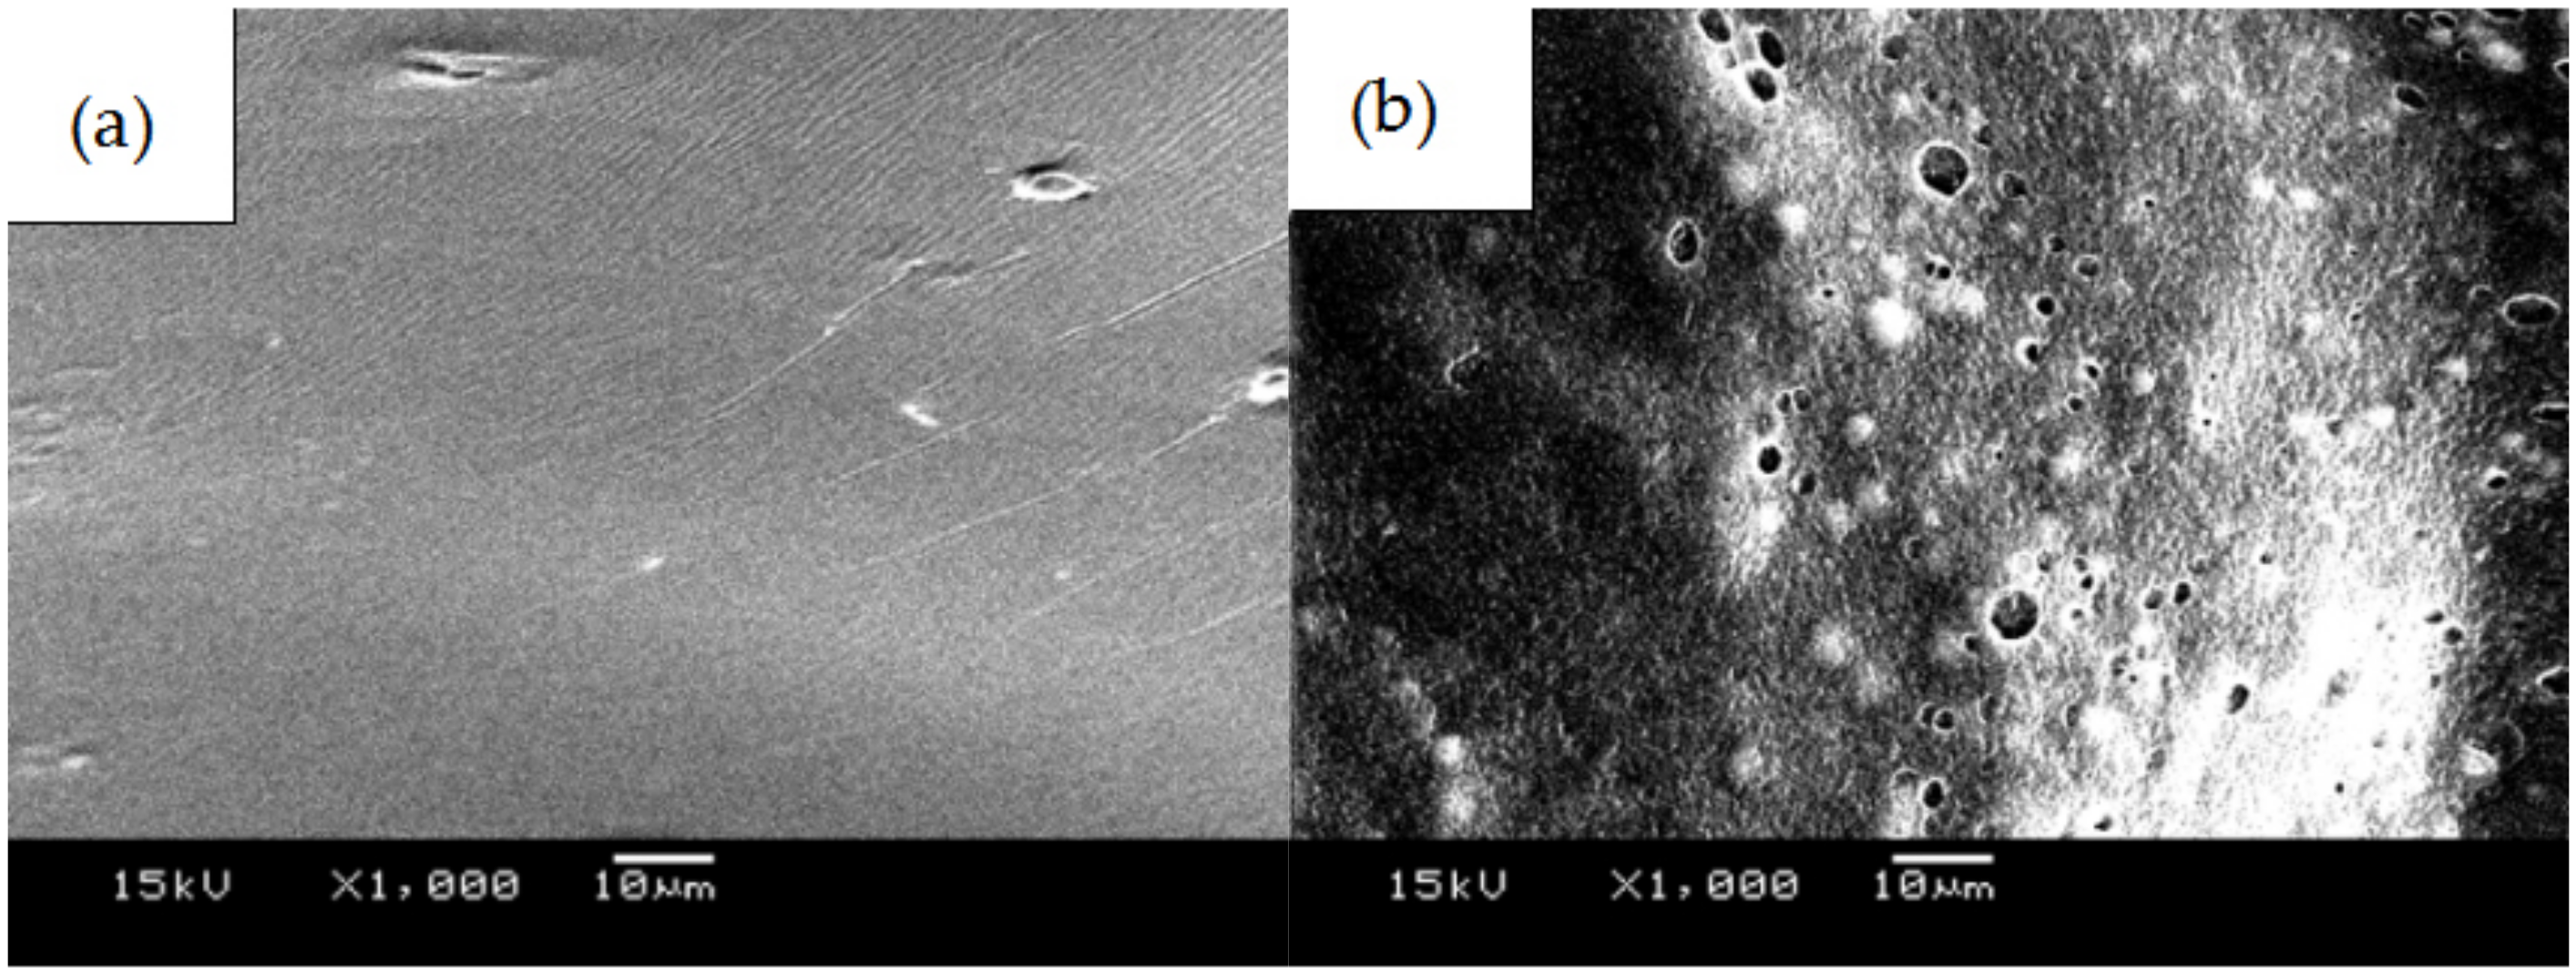
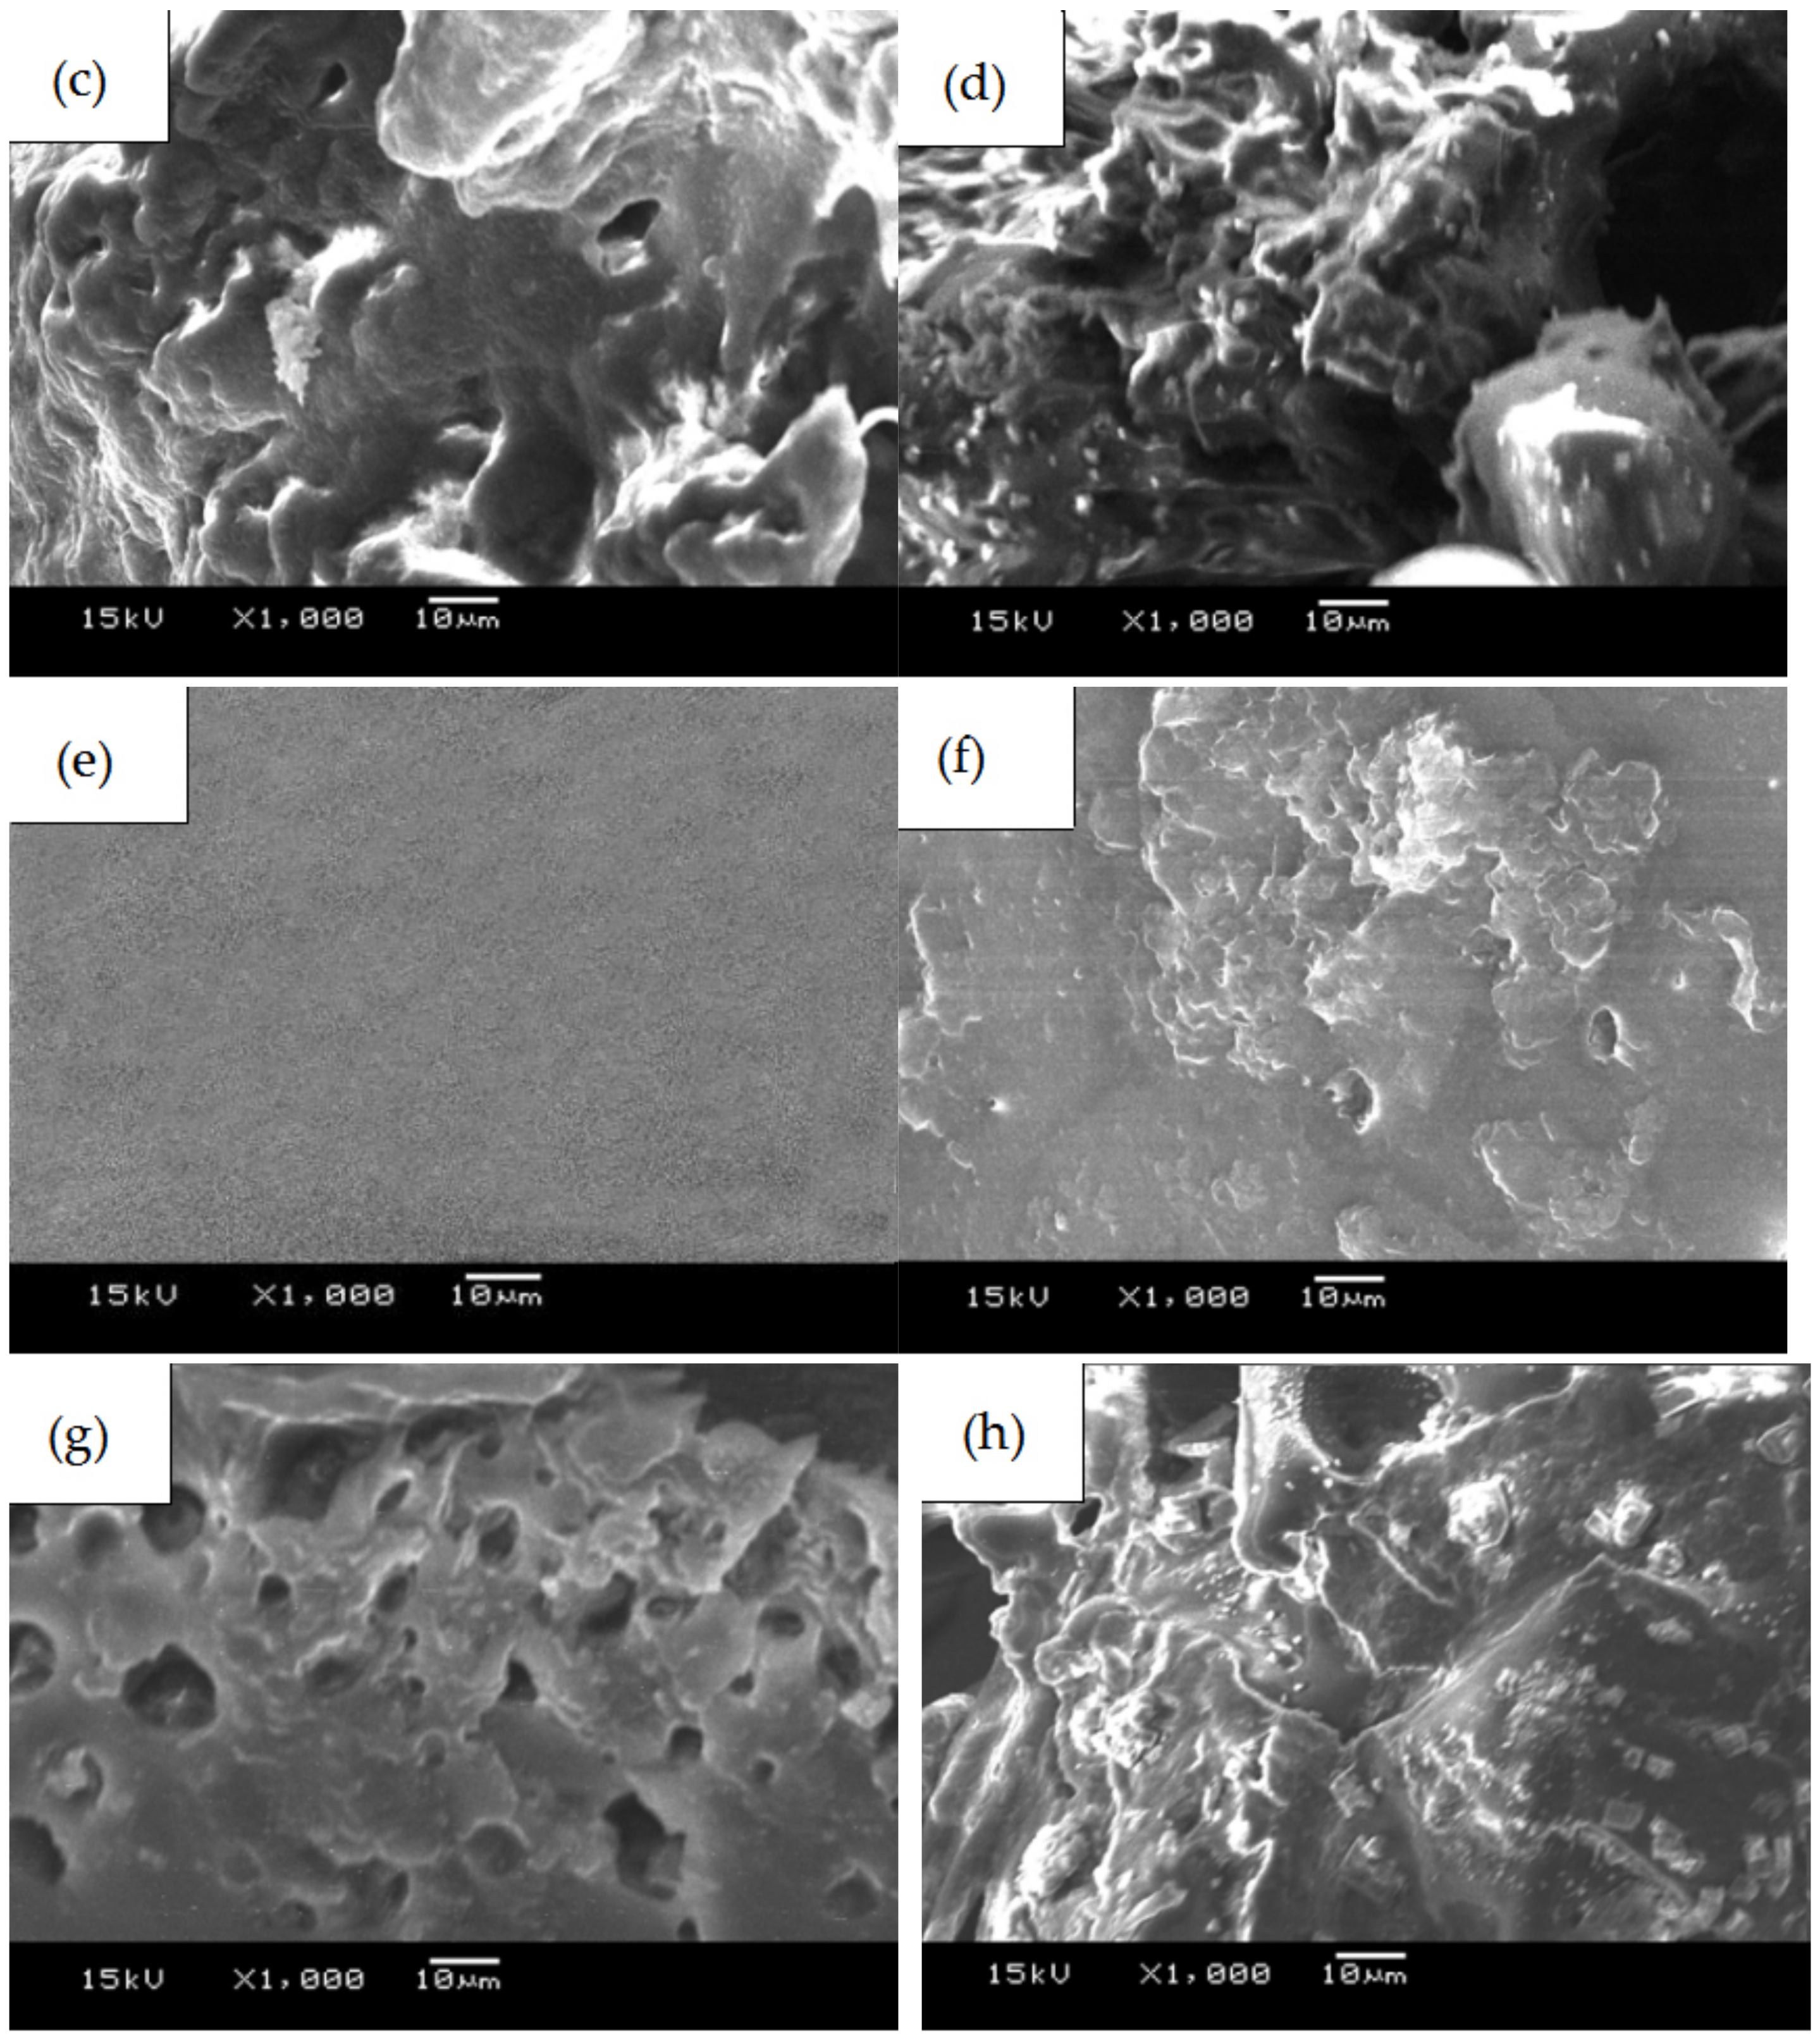
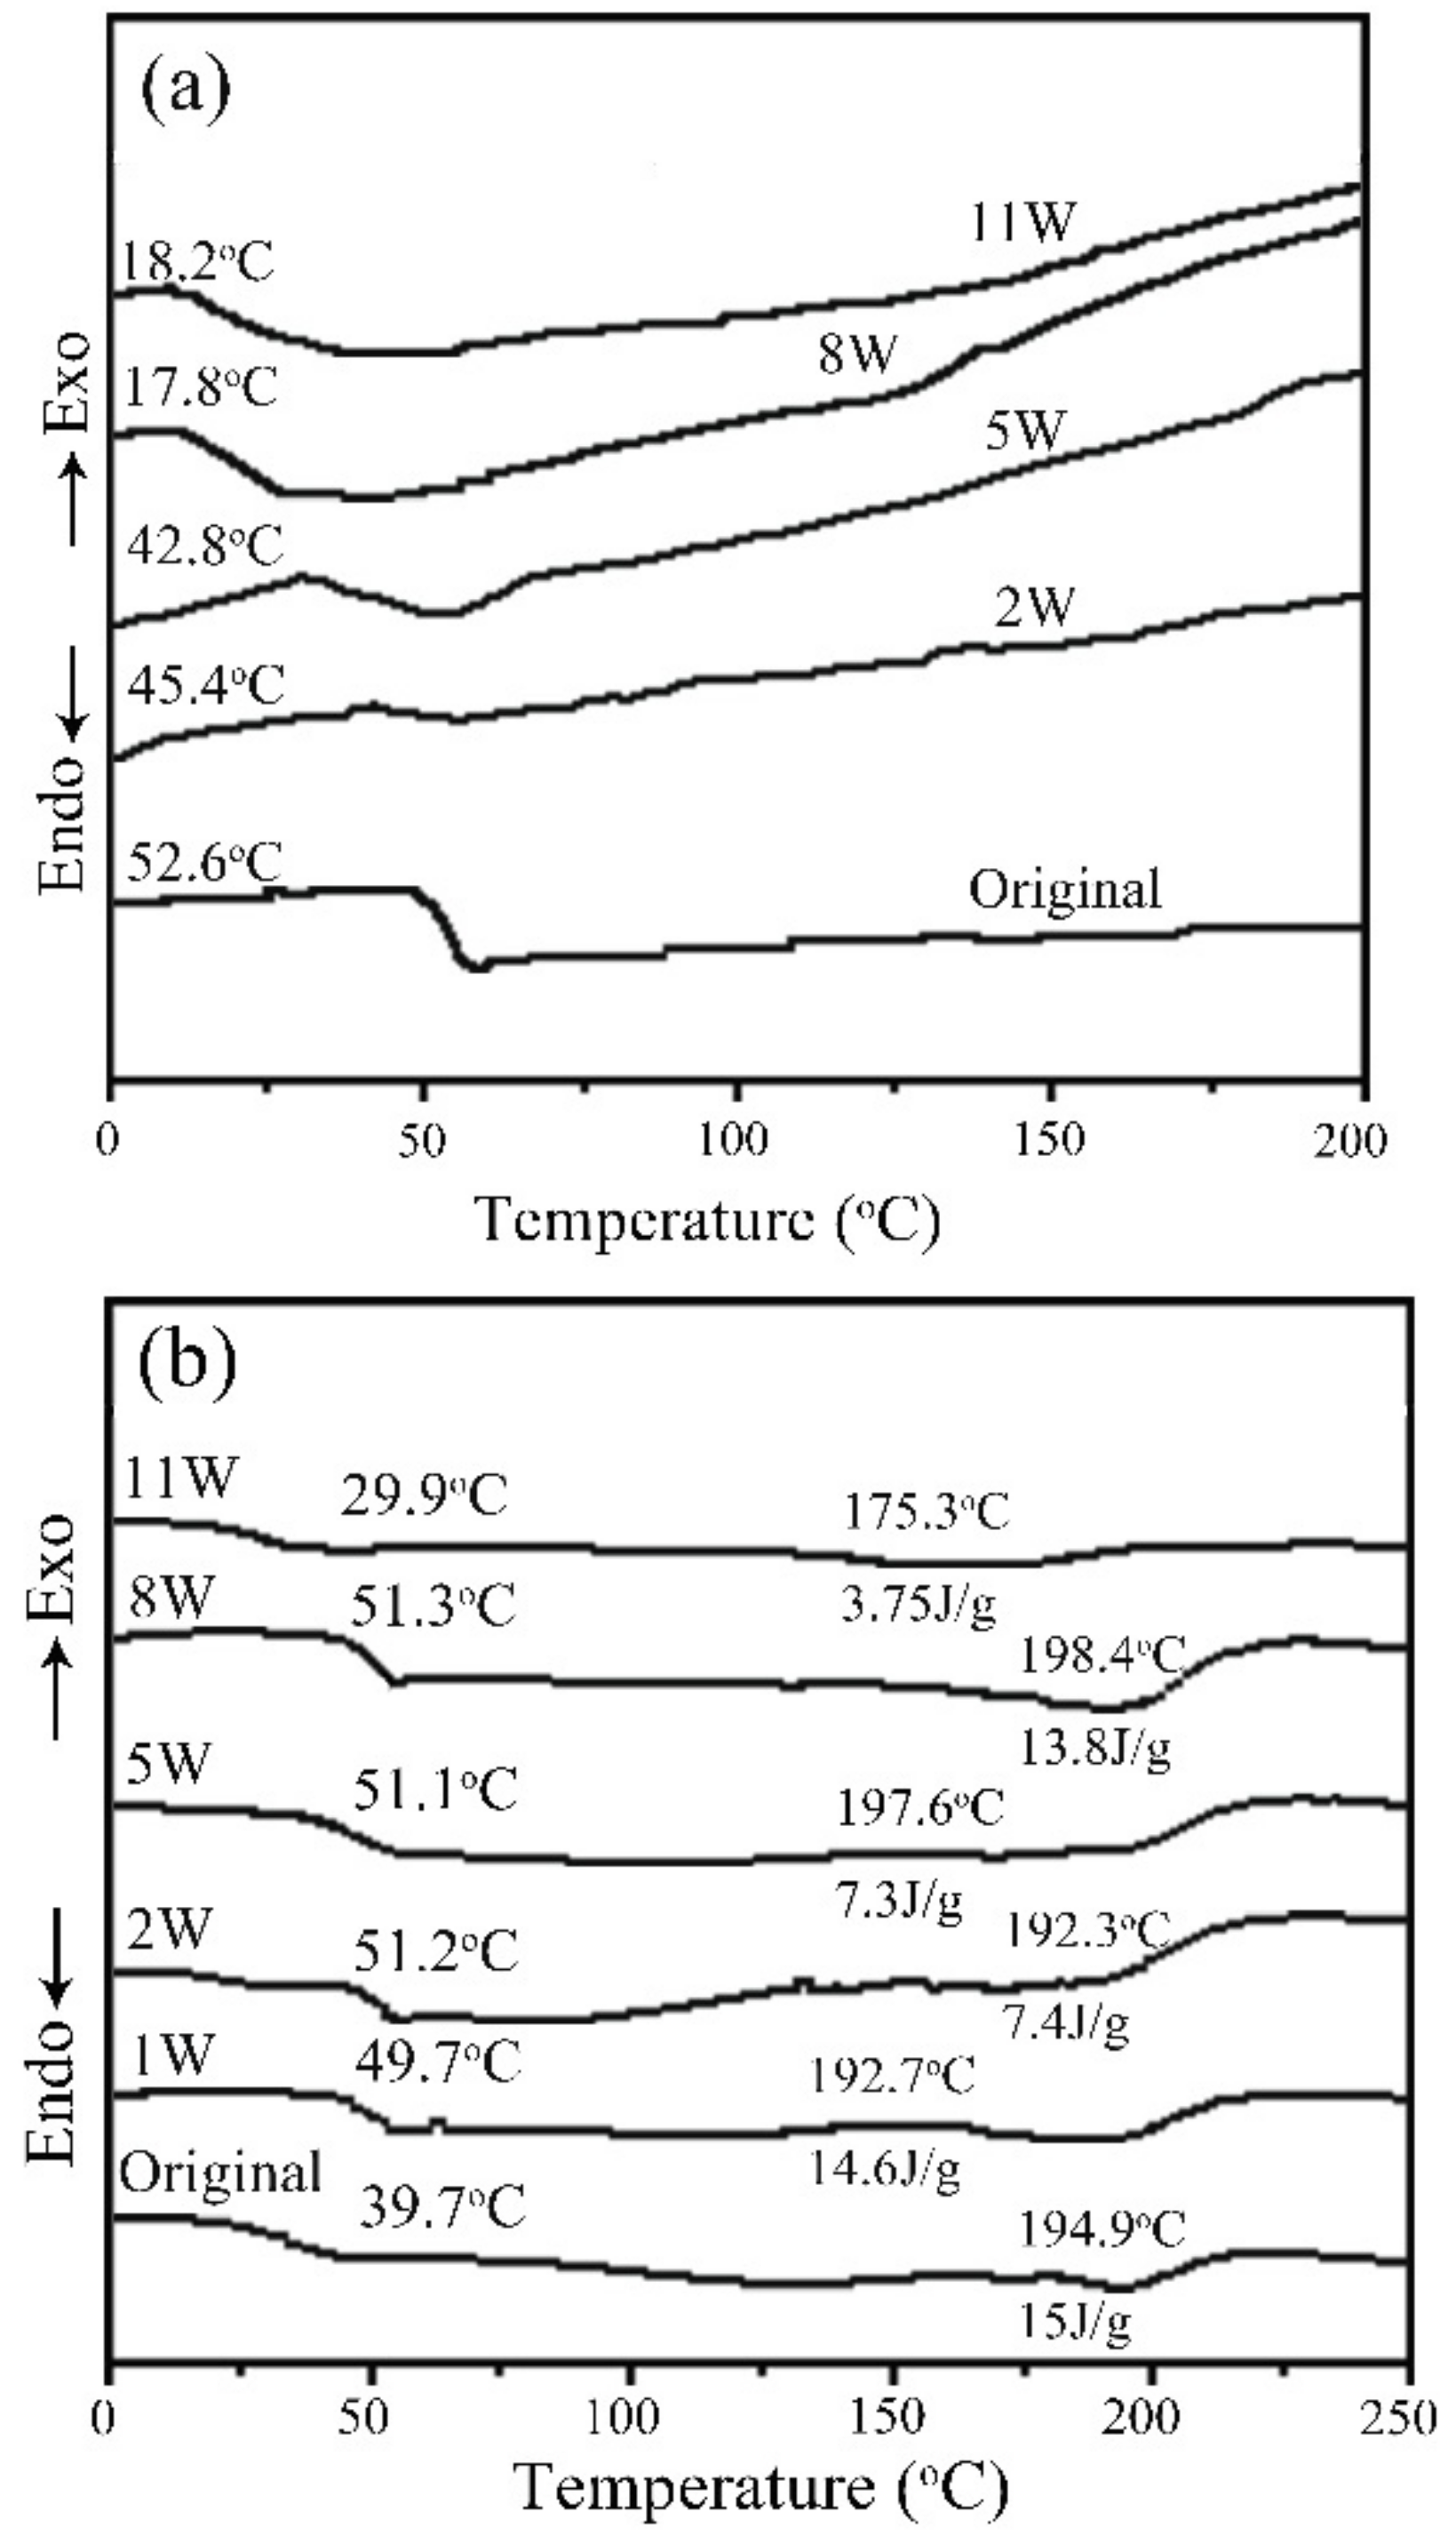
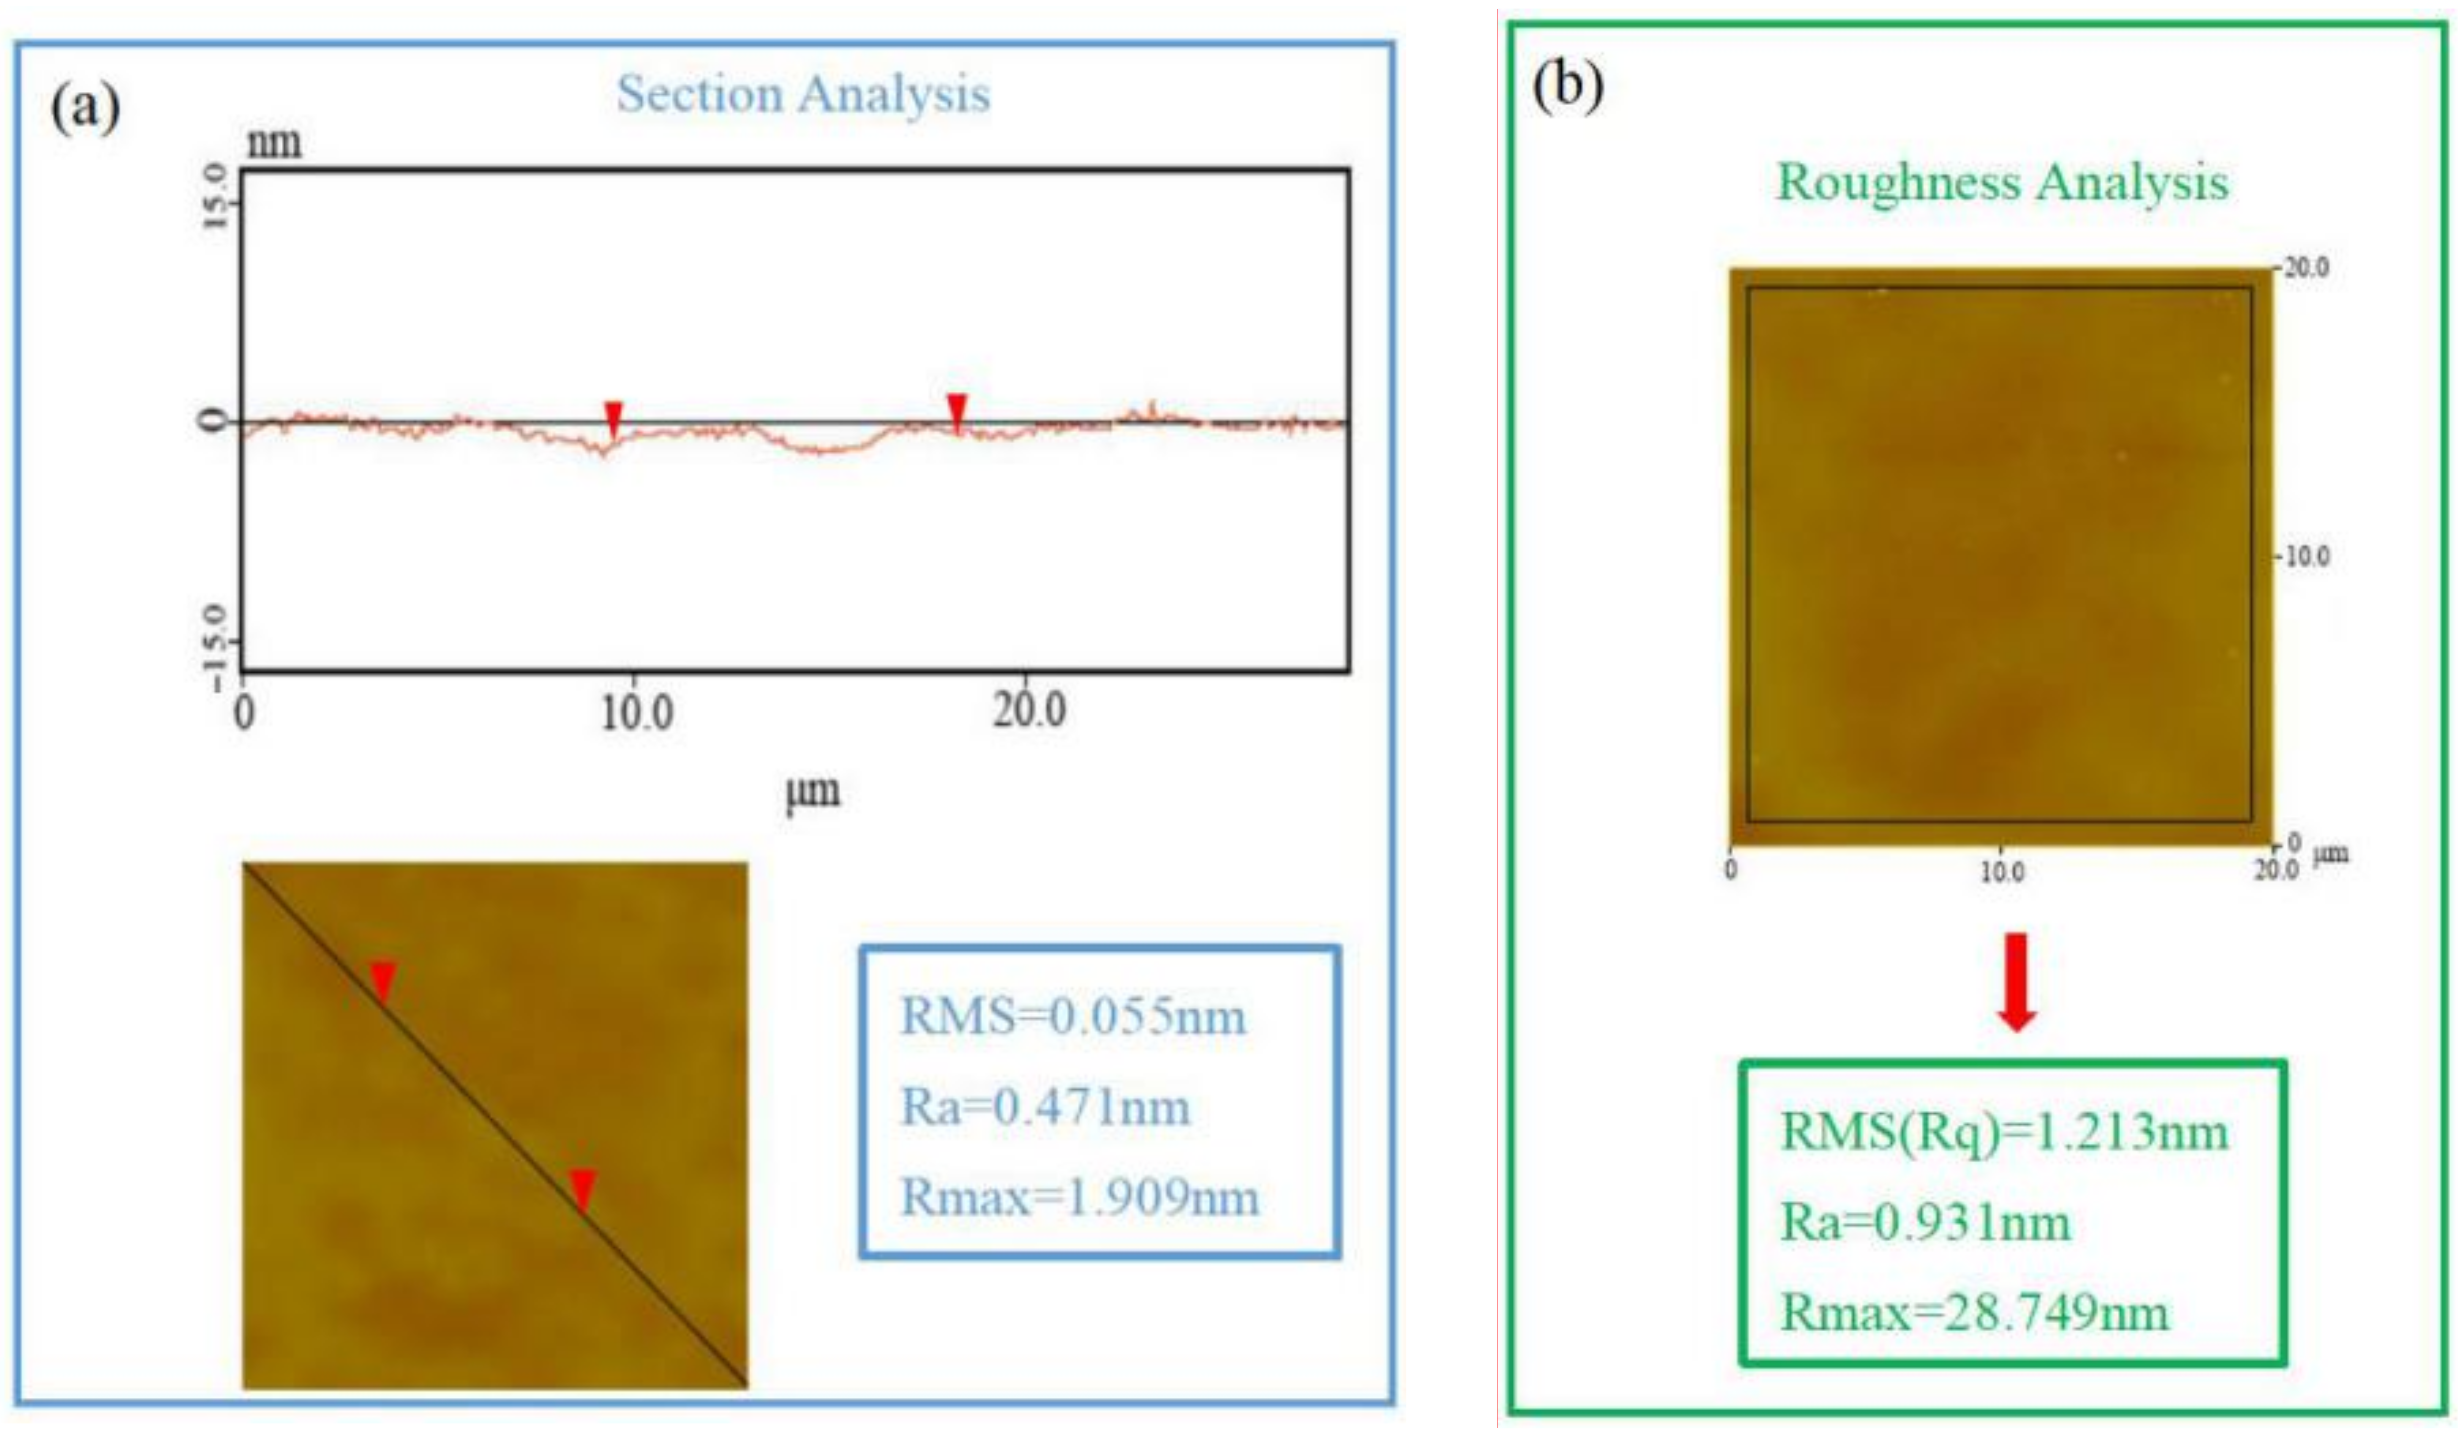
PLGA and PLGA coatings with RAPA levels of 33%, 50%, and 66% were successfully prepared on the surface of 316 L stainless steel. SEM results demonstrated that when the RAPA level was 33%, the drug-loading coating morphology was smooth and flat, which was similar to that of the pure PLGA coating. DSC results indicated the melting peak was observed upon the addition of RAPA, and the melting heat of the coating increased with drug level increases, and the drug existed in a microcrystalline form.
(2)
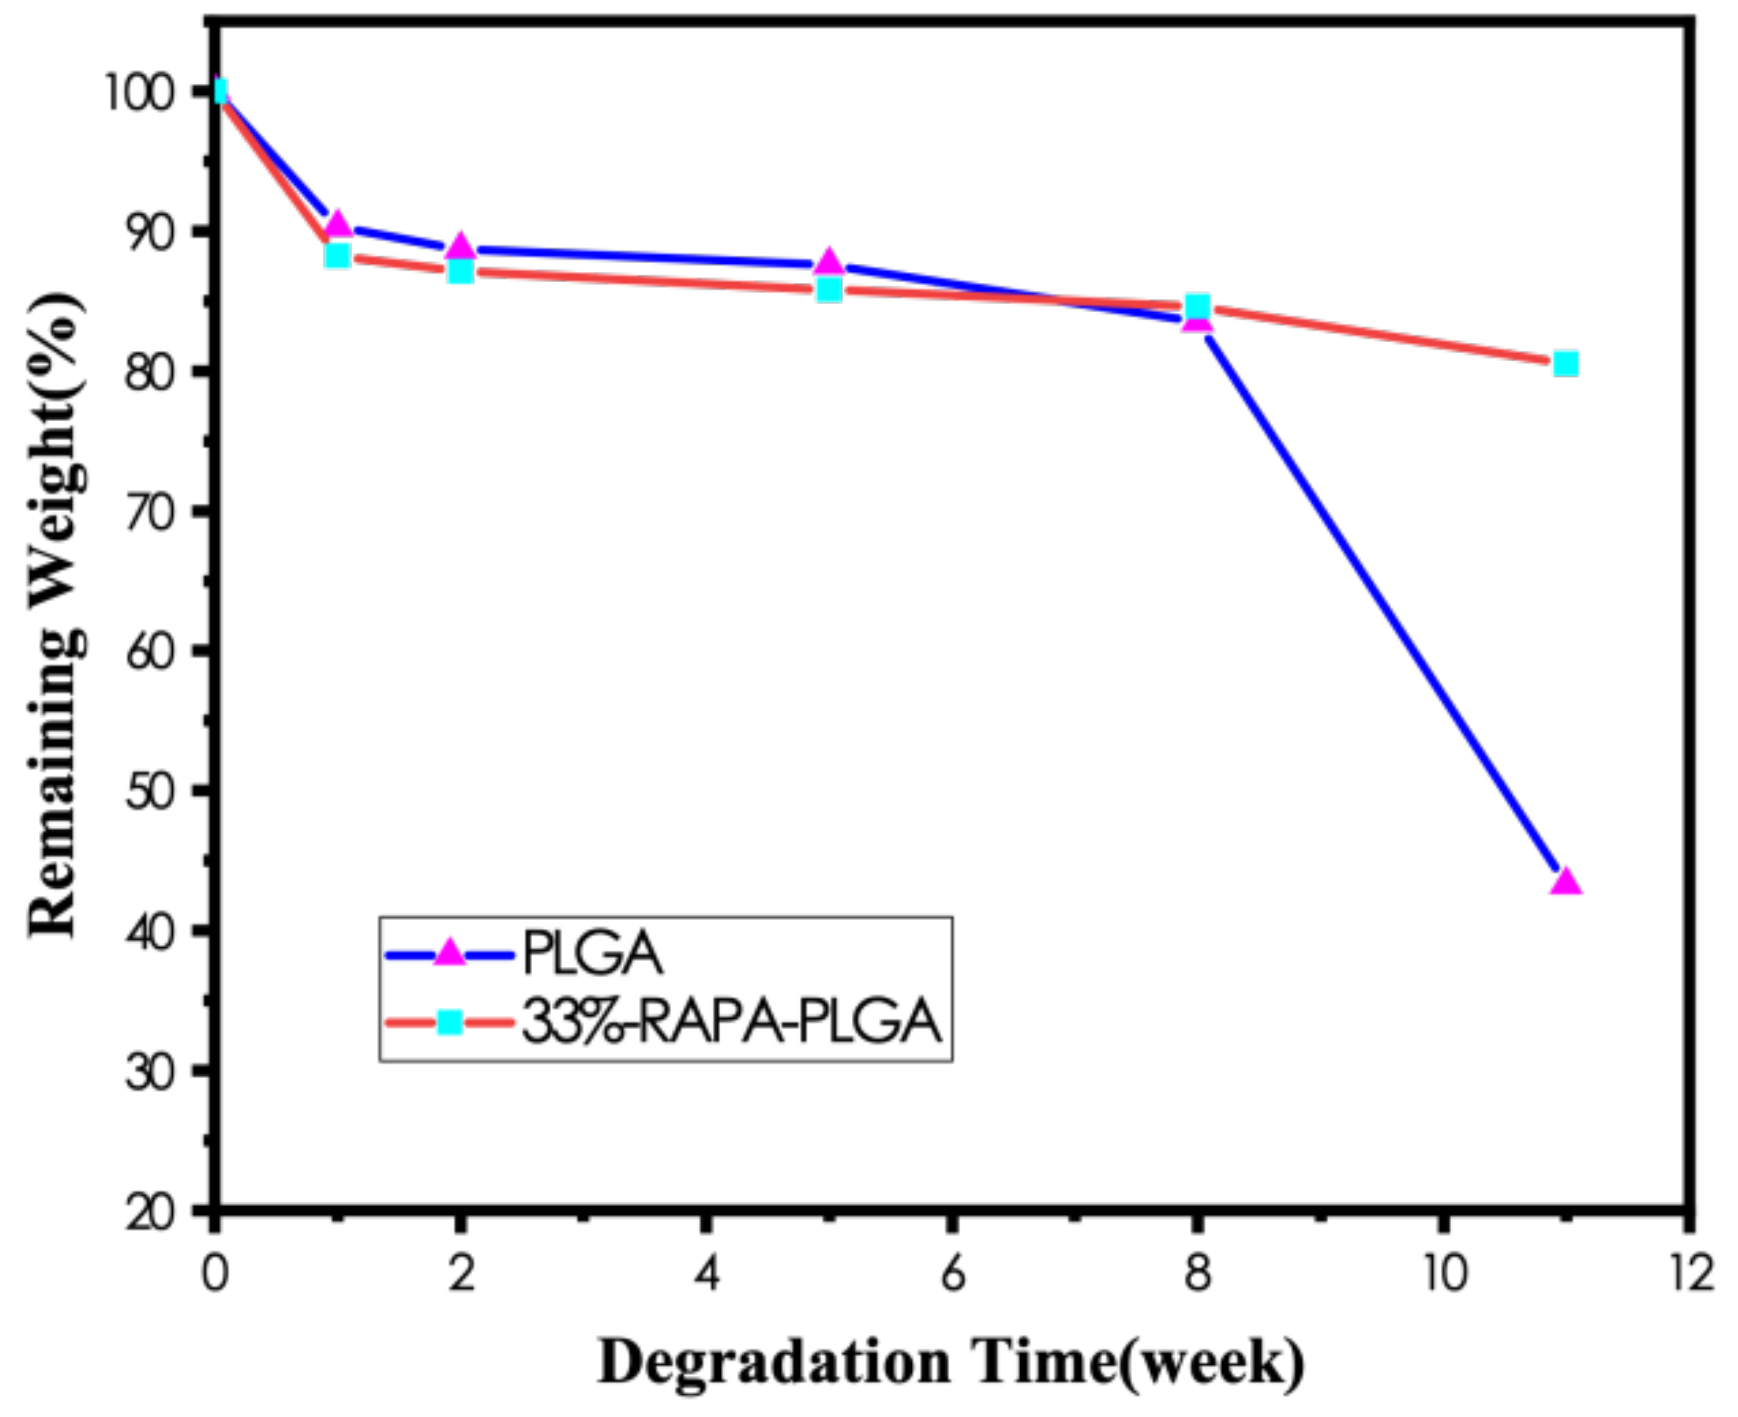
No characteristic peaks from the drug crystal were observed in the XRD results, and the drug-loading coating was still amorphous. RAPA addition decreased the Tg of the PLGA coating, accompanied by partial crystallization that reduced the degradation rate of the drug loading coating.
(3)
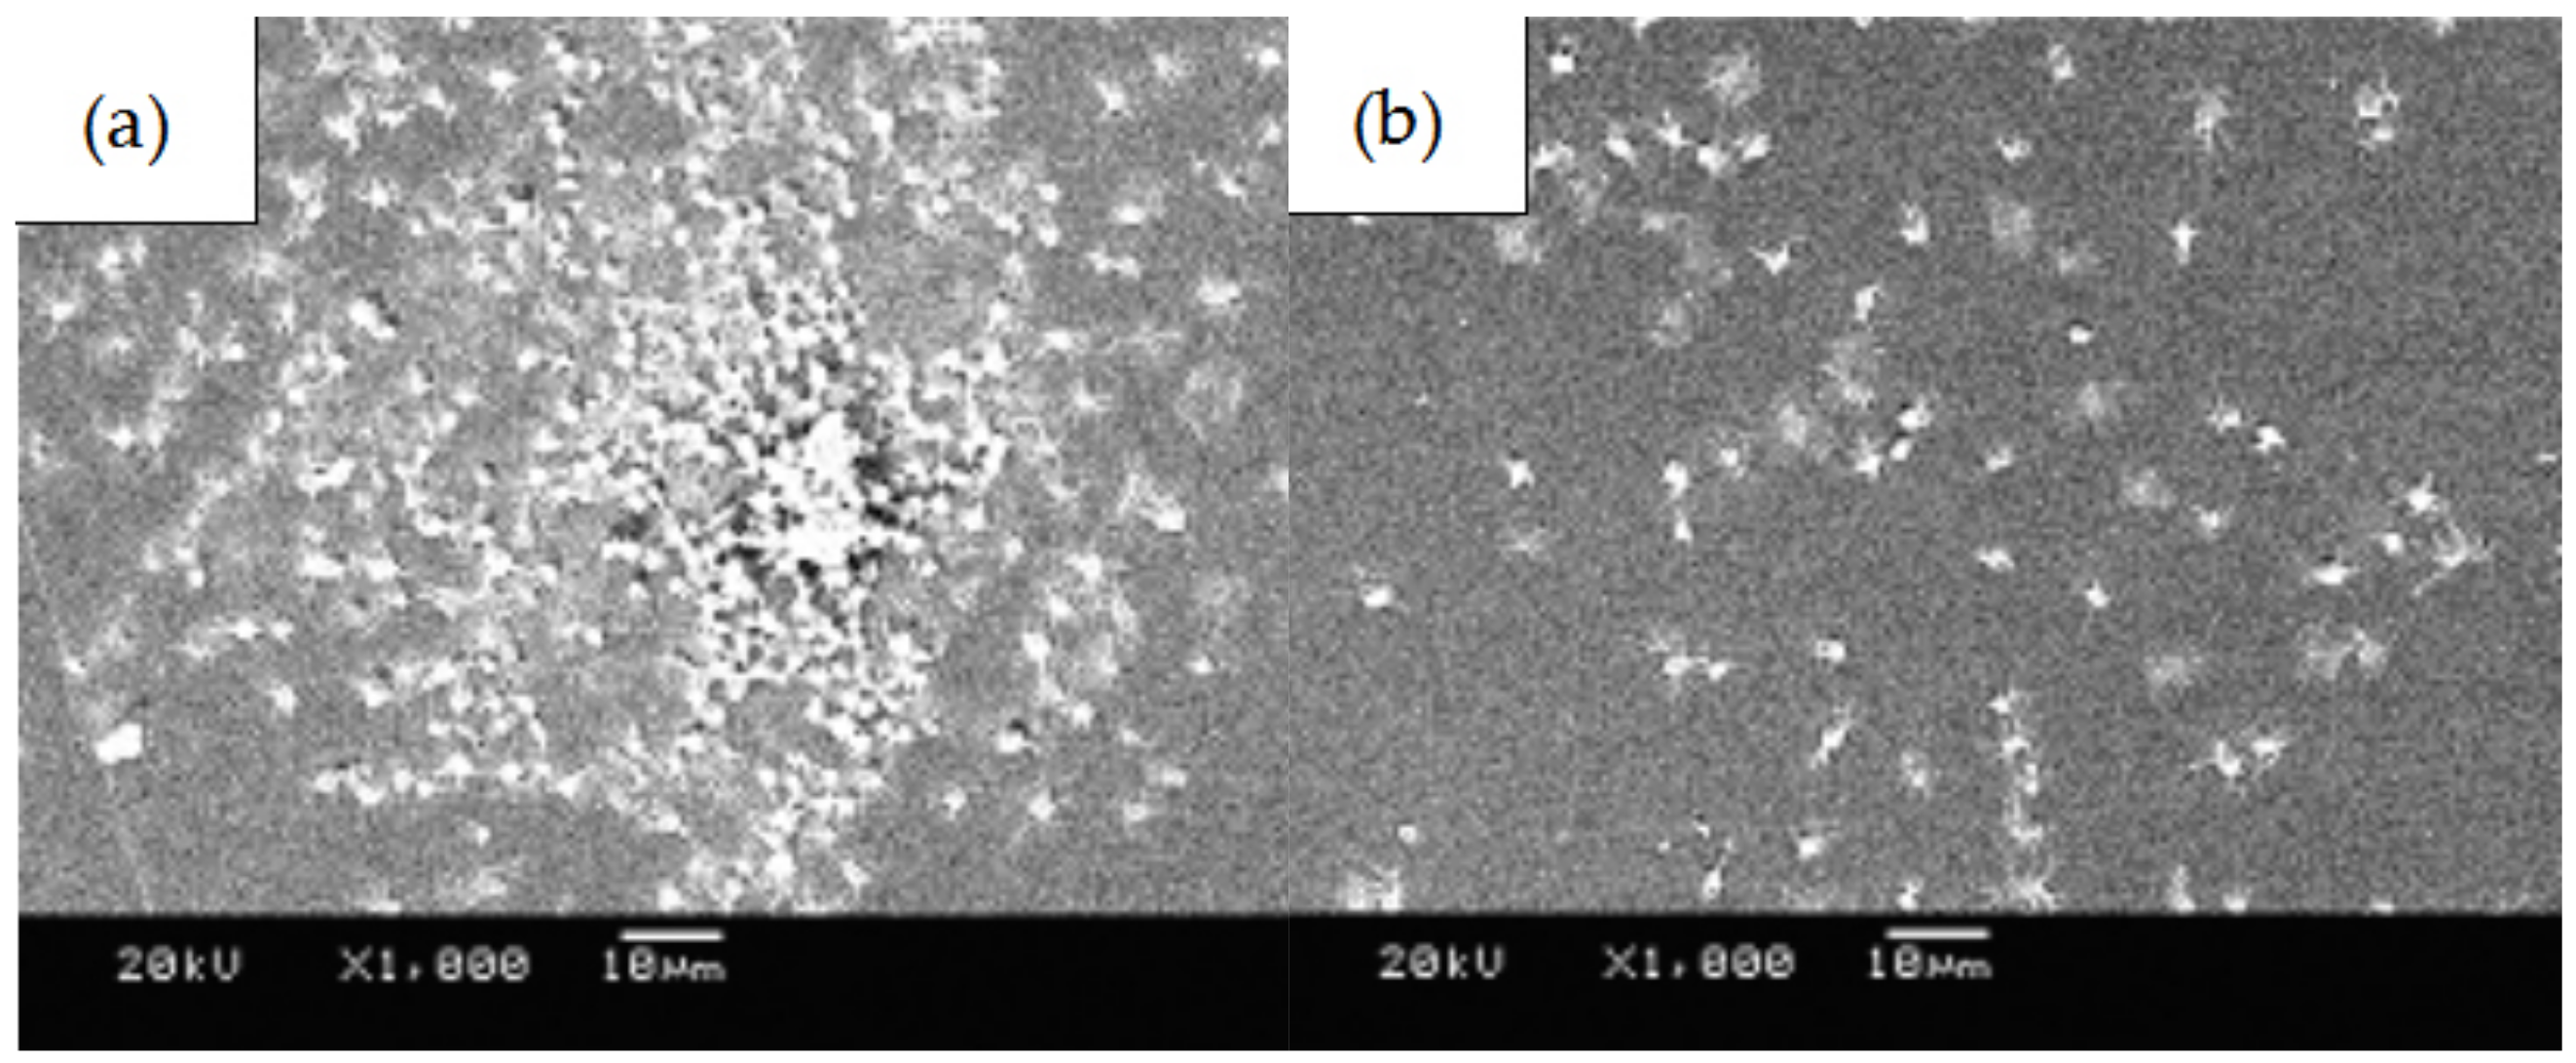
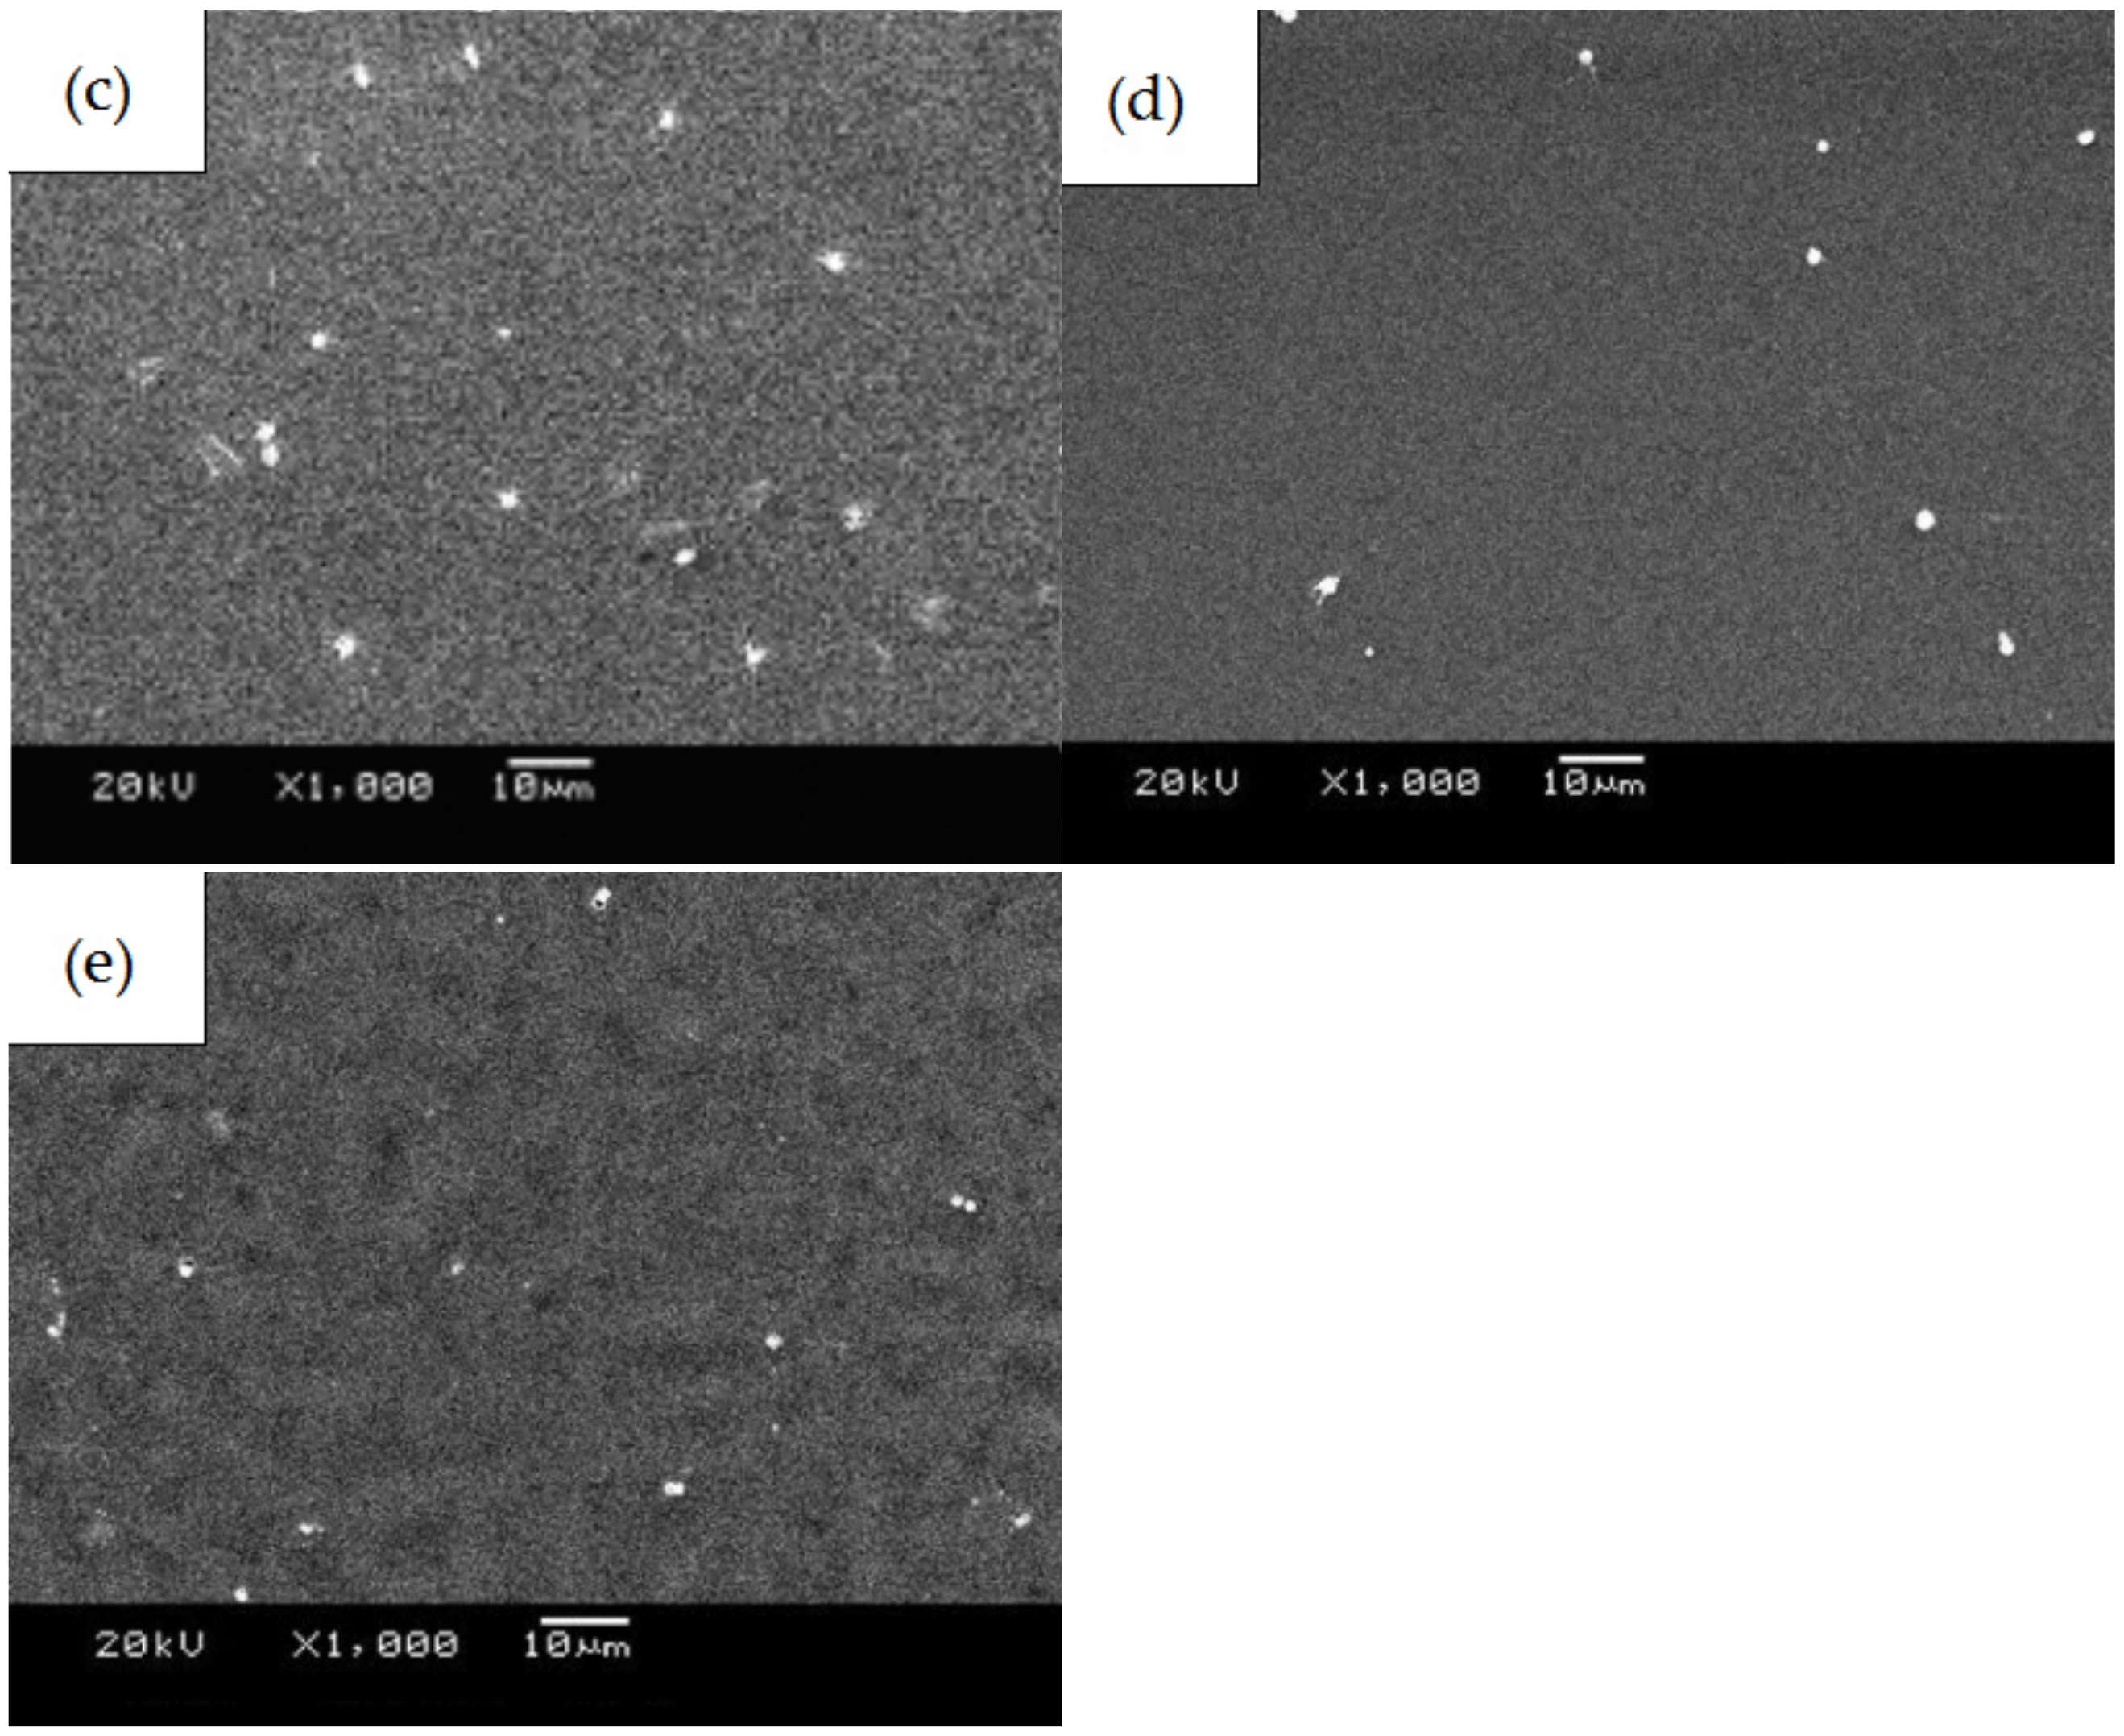
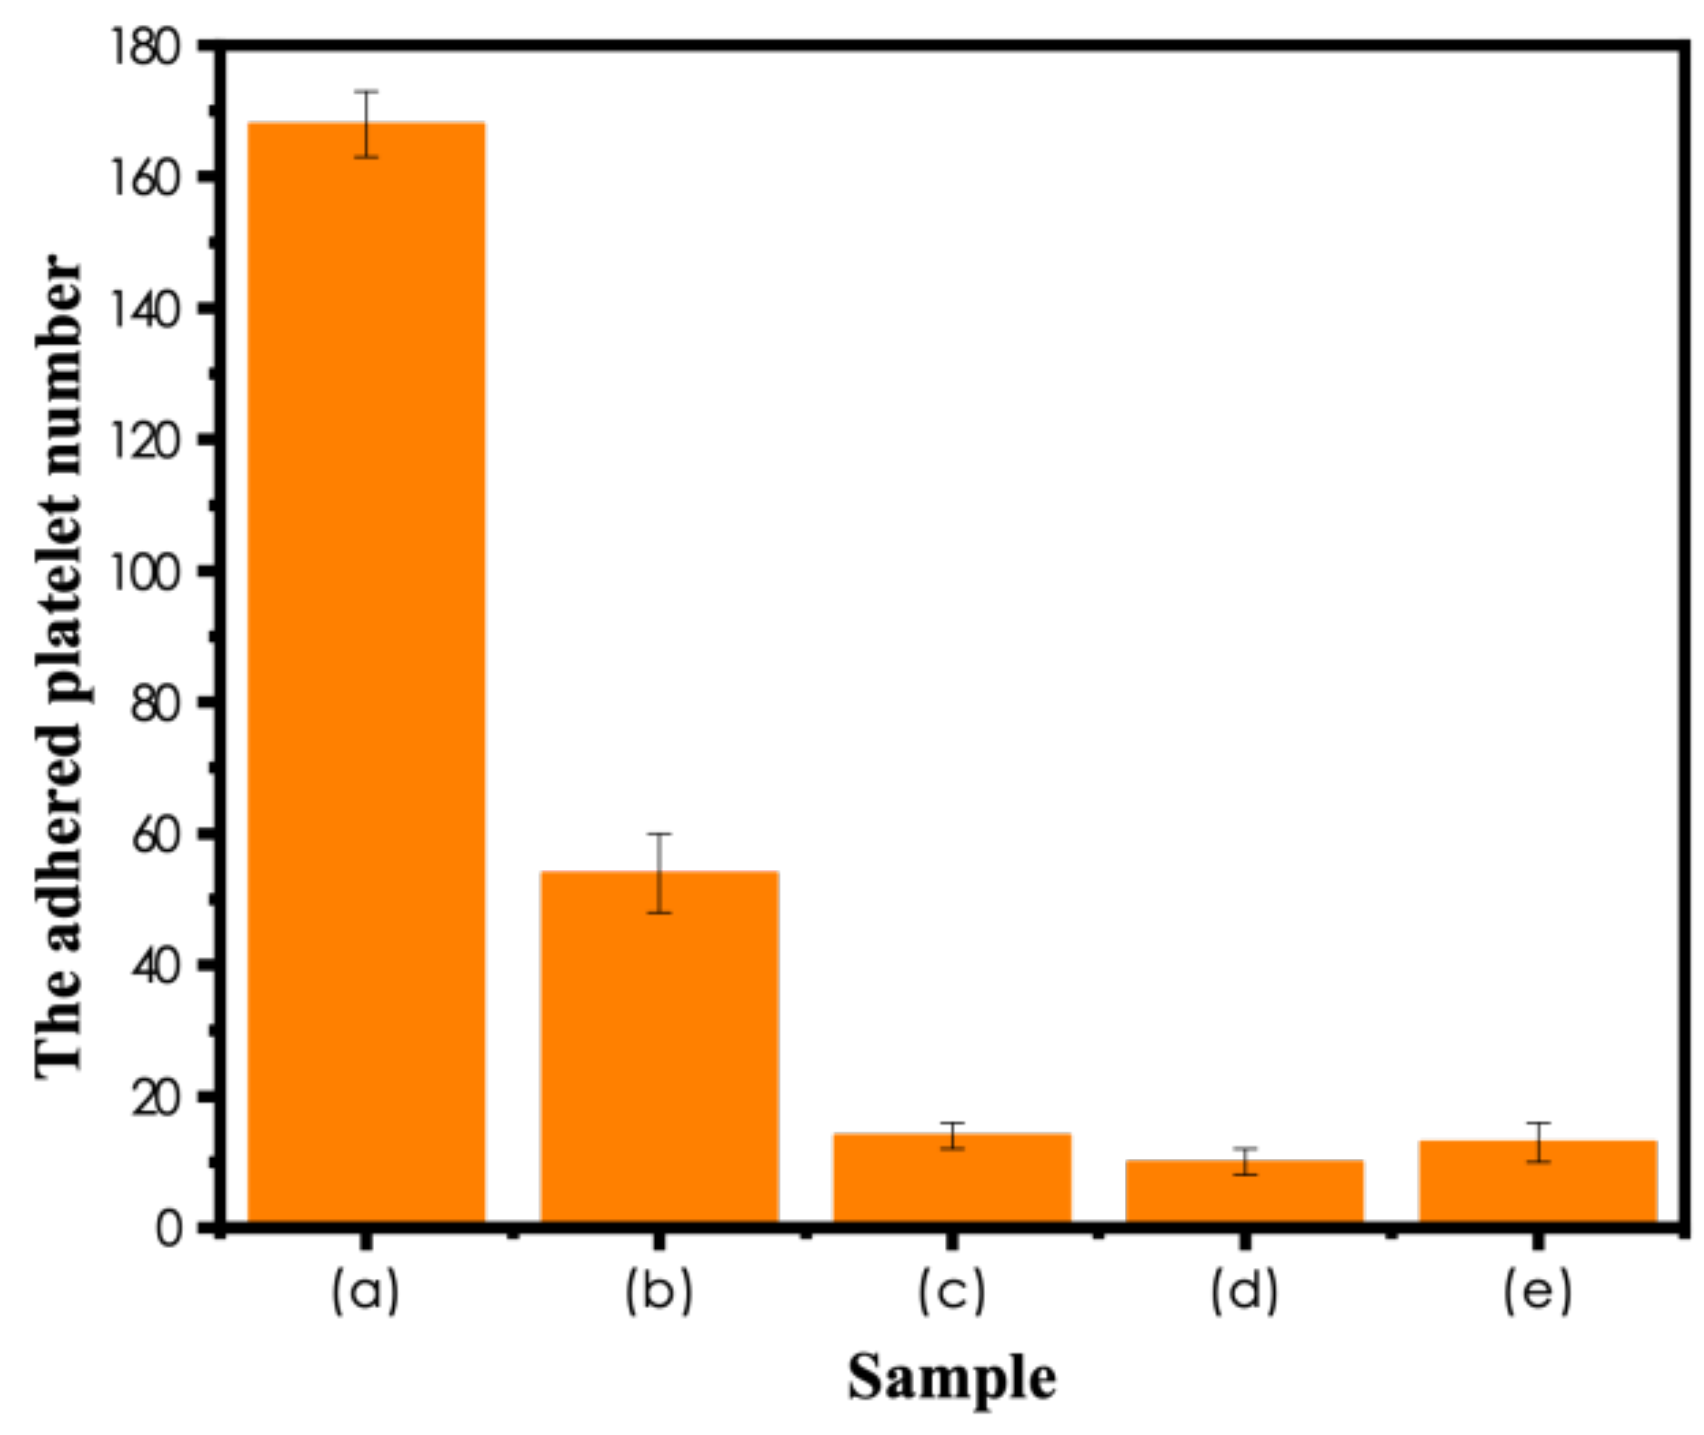
The number of platelets adhered to the PLGA drug-loading coating surface was significantly less than for the PLGA coating, and there was no deformation or pseudopodia. The coagulation time of the drug-loading coating was longer, and the activation degree of the coagulation factor minimized when the RAPA content was 50%. The microphase separation structure was generated by mixing RAPA and PLGA, which effectively increased the critical tension and reduced the free energy of the crystal plane to improve the blood compatibility of the coating.

Author Contributions

Investigation, writing—review and editing, Z.J.; Resources, H.Z.; Writing—original draft, C.M. All authors have read and agreed to the published version of the manuscript.

Funding

This work has been supported by the National Natural Science Foundation of China (Grant Nos. 519714089, 520714090), and Natural Science Foundation of Heilongjiang Province of China (Grant No. LC2018020).

Institutional Review Board Statement

Not applicable.

Informed Consent Statement

Not applicable.

Data Availability Statement

Not applicable.

Conflicts of Interest

The authors declare no conflict of interest.

References

  1. Sofogianni, A. Lipoprotein-associated Phospholipase A2 and Coronary Heart Disease. Curr. Pharm. Design. 2018, 24, 163–168. [Google Scholar] [CrossRef] [PubMed]
  2. Zheng, Q.L.; Qiao, X.; Ren, S.F.; Zhao, Z.P. Effect of severe stenosis or occlusion of small vessel on coronary artery after cardiac stent implantation on cardiac function. Clin. Res. Pract. 2018, 13, 131–137. [Google Scholar]
  3. Mostaed, E.; Sikora, J.; Malgorzata, D.; Jaroslaw, W. Zinc-based alloys for degradable vascular stent applications. Acta Biomater. 2018, 71, 1–23. [Google Scholar] [CrossRef]
  4. Katayama, Y.; Kubo, T.; Akasaka, T.; Aoki, H. TCTAP A-085 Vascular Response to Drug-eluting Stent with Biodegradable Versus Durable Polymer. J. Am. Coll. Cardiol. 2017, 13, S47. [Google Scholar] [CrossRef]
  5. Francesca, B.M.; Francesco, B.; Carlo, T.; Ornella, L. Coronary stents and vascular response to implantation: Literature review. Pragmat. Obs. Res. 2017, 8, 137. [Google Scholar]
  6. Chalony, C.; Aguilar, L.E.; Chan, H.P. Drug free anti-cell proliferative and anti-platelet adhesion coatings for vascular stents via polymeric electrospun fibers. Mater. Lett. 2021, 291, 1295–1302. [Google Scholar] [CrossRef]
  7. Wu, T.; Chen, X.; Fan, D.Z.; Pang, X.L. Development and application of metalmaterials in terms of vascular stents. Bio-Med. Mater. Eng. 2015, 25, 628–635. [Google Scholar]
  8. Liang, C.; Hao, J.; Wang, H.; Li, B.; Xia, D. Preparation and Research Progress of Contact-Induced Surface of Metal Implants. Acta Metall Sin 2017, 13, 21–28. [Google Scholar]
  9. Togha, M.; Jahanshahi, M.; Alizadeh, L.; Jahromi, S.R.; Ghaemi, A. Rapamycin Augments Immunomodulatory Properties of Bone Marrow-Derived Mesenchymal Stem Cells in Experimental Autoimmune Encephalomyelitis. Mol. Neurobiol. 2017, 54, 2445–2457. [Google Scholar] [CrossRef] [PubMed]
  10. Gu, C.F.; Fu, Q.Y.; Liu, J.; Cardiology, D.O. Advances in Coronary Drug-eluting Stent Restenosis. Adv. Cardiovasc. Dis. 2017, 371, 968–974. [Google Scholar]
  11. Hilliard, S.; Baldinozzi, G.; Friedrich, D.; Kressman, S.; Strub, H.; Artero, V. Mesoporous thin film WO3 photoanode for photoelectrochemical water splitting: A sol-gel dip coating approach. Sustain. Energy Fuels. 2017, 1, 145–153. [Google Scholar] [CrossRef] [Green Version]
  12. Bakhsheshi-Rad, R.H.; Hamzah, E.; George, J.; Safaa, D.; Saud, N. Fabrication and characterisation of novel ZnO/MWCNT duplex coatings deposited on Mg alloy by PVD coupled with dip-coatings techniques. J. Alloys Compd. 2017, 728, 4478–4486. [Google Scholar] [CrossRef]
  13. Xia, F.; Li, C.; Ma, C.; Li, Q.; Xing, H. Effect of pulse current density on microstructure and wear property of Ni-TiN nanocoatings deposited via pulse electrodeposition. Appl. Surf. Sci. 2021, 538, 148139. [Google Scholar] [CrossRef]
  14. Ma, C.; Zhao, D.; Ma, Z. Effects of duty cycle and pulse frequency on microstructures and properties of electrodeposited Ni-Co-SiC nanocoatings. Ceram. Int. 2020, 46, 12128–12137. [Google Scholar] [CrossRef]
  15. Xia, F.; Li, Q.; Ma, C.; Liu, W.; Ma, Z. Preparation and wear properties of Ni/TiN-SiC nanocoatingss obtained by pulse current electrodeposition. Ceram. Int. 2020, 46, 7961–7969. [Google Scholar] [CrossRef]
  16. Sidewinder, O.A.; Prikhozhdenko, E.S.; Schurov, I. Patterned Drug-Eluting coatingss for Tracheal Stents Based on PLA, PLGA, and PCL for the Granulation Formation Reduction: In Vivo Studies. Pharmaceutics 2021, 13, 119–126. [Google Scholar]
  17. Qi, H.; Heise, S.; Zhou, J.; Schuhladen, K.; Lu, T. Electrophoretic Deposition of Bioadaptive Drug Delivery coatingss on Magnesium Alloy for Bone Repair. Acs. Appl. Mater. Interfaces 2019, 11, 35–42. [Google Scholar] [CrossRef]
  18. Liu, W.; Zhang, X.X.; Fan, W.; Wang, Q.X.; Li, S.R. Effects of different stents coated with rapamycin on serum adiponectin, GDF-15 and Cys-C levels in patients with true coronary bifurcation lesions. Chin. J. Health. Insp. 2017, 27, 87–90. (In Chinese) [Google Scholar]
  19. Tabatabaeian, K.; Simayee, M.; Shojaie, A.F.; Mashayekhi, F.; Hadavi, M. The Effect of Silica coatings on the Drug Release Profile and Biocompatibility of Nano-MOF-5. J. Sci. Islamic Repub. Iran 2020, 31, 371–377. [Google Scholar]
  20. Nijhoff, F.; Stella, P.R.; Troost, M.S.; Belkacemi, A.; Nathoe, H.M.; Voskuil, M. Comparative assessment of the antirestenotic efficacy of two paclitaxel drug-eluting balloons with different coatings in the treatment of in-stent restenosis. Clin. Res. Cardiol. 2016, 105, 401–411. [Google Scholar] [CrossRef] [Green Version]
  21. Li, J.; Hubert, M.; Pinnamaneni, S.; Tao, L.; Zhao, J.; Sharif, S.; Ramakrishnan, R.K.; Nazarenko, S. Effect of Moisture Sorption on Free Volume and Relaxation of Spray Dried Dispersions: Relation to Drug Recrystallization—ScienceDirect. J. Pharm. Sci. 2020, 109, 1050–1058. [Google Scholar] [CrossRef] [PubMed] [Green Version]
  22. Chen, K.H.; Mueannoom, W.; Gaisford, S.; Kett, V.L. Investigation into the effect of varying l-leucine concentration on the product characteristics of spray-dried liposome powders. J. Pharm. Pharmacol. 2012, 64, 1412–1424. [Google Scholar] [CrossRef] [Green Version]
  23. Jain, S.; Tripathi, S.; Tripathi, P.K. Invasomes: Potential vesicular systems for transdermal delivery of drug molecules. J. Drug. Deliv. Sci. Tec. 2020, 61, 102166. [Google Scholar] [CrossRef]
  24. Liu, X.; Zhen, Z.; Jing, L.; Xi, T.; Zheng, Y.; Guan, S. Multifunctional MgF2/Polydopamine coatings on Mg Alloy for Vascular Stent Application. J. Mater. Sci. Technol. 2015, 31, 733–743. [Google Scholar] [CrossRef]
  25. Guinesi, L.S.; Cavalheiro, D.T.G. The use of DSC curves to determine the acetylation degree of chitin/Chitosan samples. Thermochim. Acta 2006, 444, 128–133. [Google Scholar] [CrossRef]
  26. Eskew, M.W.; Benight, A.S. Ligand binding constants for human serum albumin evaluated by ratiometric analysis of DSC thermograms. Anal. Biochem. 2021, 628, 114293. [Google Scholar] [CrossRef]
  27. Biran, R.; Pond, D. Heparin coatingss for improving blood compatibility of medical devices. Adv. Drug Deliv. Rev. 2016, 26, 12–23. [Google Scholar]
  28. Ayyar, M.; Mani, M.P.; Jaganathan, S.K.; Rathanasamy, R. Preparation, characterization and blood compatibility assessment of a novel electrospun nanocomposite comprising polyurethane and ayurvedic-indhulekha oil for tissue engineering applications. Biomed. Tech. 2017, 3, 245–253. [Google Scholar] [CrossRef]
  29. Vassallo, V.; Stellavato, A.; Cimini, D.; Pirozzi, A.V.A.; Alfano, A.; Cammarota, M.; Balato, G.; D’Addona, A.; Ruosi, C.; Schiraldi, C. Unsulfated biotechnological chondroitin by itself as well as in combination with high molecular weight hyaluronan improves the inflammation profile in osteoarthritis in vitro model. J. Cell. Biochem. 2021, 122, 1021–1036. [Google Scholar] [CrossRef]
  30. Russo, R.; Vassallo, V.; Stellavato, A.; Valletta, M.; Cimini, D.; Pedone, P.V.; Schiraldi, C.; Chambery, A. Differential Secretome Profiling of Human Osteoarthritic Synoviocytes Treated with Biotechnological Unsulfated and Marine Sulfated Chondroitins. Int. J. Mol. Sci. 2020, 21, 3746. [Google Scholar] [CrossRef]
  31. Abe, K.; Kataoka, K.; Sekiguchi, M.; Okano, T.; Shimada, A. Transmission and scanning electron microscopic analysis of rat platelets adhered to HEMA-St ABA type block copolymer surface with microphase separated structure. Blood Vessel 1985, 16, 149–158. [Google Scholar] [CrossRef]
  32. Catauro, M.; Tranquillo, E.; Dal Poggetto, G.; Naviglio, S.; Barrino, F. Antibacterial properties of sol-gel biomaterials with different percentages of PEG or PCL. Macromol. Symp. 2020, 389, 1900056. [Google Scholar] [CrossRef]
Figure 1. Schematic diagram of the dynamic degradation device.
Coatings 11 01427 g001
Figure 2. SEM morphologies of (a) PLGA coating, (b) PLGA drug-loading coating (RAPA 33%), (c) PLGA drug-loading coating (RAPA 50%), and (d) PLGA drug-loading coating (RAPA 66%). (e) RAPA concentration histogram.
Coatings 11 01427 g002aCoatings 11 01427 g002b
Figure 3. DSC curves of PLGA drug-loaded coating: (a) PLGA, (b) 33%-RAPA-PLGA, (c) 50%-RAPA-PLGA, (d) RAPA.
Coatings 11 01427 g003
Figure 4. XRD curves of PLGA drug-loading coating: (a) PLGA, (b) 33%-RAPA-PLGA, (c) 50%-RAPA-PLGA, (d) RAPA.
Coatings 11 01427 g004
Figure 5. SEM morphology of degradation of PLGA coating and PLGA drug-loading coating. PLGA coating: (a) original, (b) degradation 8 weeks, (c) degradation 11 weeks, (d) degradation 14 weeks; PLGA drug-loading coating: (e) original, (f) degradation 8 weeks, (g) degradation 11 weeks, (h) degradation 14 weeks.
Coatings 11 01427 g005aCoatings 11 01427 g005b
Figure 6. Change of remaining weight of PLGA and 33%-RAPA-PLGA coating samples in Hank’s SBF at 37 °C.
Coatings 11 01427 g006
Figure 7. DSC thermograms of PLGA (a) and drug-loaded PLGA (b) samples degradation in Hank’s SBF at 37 °C.
Coatings 11 01427 g007
Figure 8. AFM image of the (a) PLGA coating and (b) PLGA drug-loading coating.
Coatings 11 01427 g008
Figure 9. Surface roughness of PLGA coating: (a) line scanning, and (b) surface scanning.
Coatings 11 01427 g009
Figure 10. Surface roughness of PLGA drug-loading coating: (a) line scanning, and (b) surface scanning.
Coatings 11 01427 g010
Figure 11. SEM images of platelet adhesion: (a) stainless steel substrate, (b) PLGA coating, (c) PLGA drug-loading coating (RAPA 33%), (d) PLGA drug-loading coating (RAPA 50%), and (e) PLGA drug-loading coating (RAPA 66%).
Coatings 11 01427 g011aCoatings 11 01427 g011b
Figure 12. The adhered and clustered platelet numbers on test materials after 1 h.
Coatings 11 01427 g012
Figure 13. The comparison of dynamic clotting time curves for different materials.
Coatings 11 01427 g013
Table 1. Change of pH and remaining weight of PLGA and 33%-RAPA-PLGA degradation in Hank’s SBF.
TimePLGA33%-RAPA-PLGA
(Weeks)Remaining Weight (%)pHRemaining Weight (%)pH
01007.51007.6
190.37.488.27.5
288.77.485.87.5
587.67.487.17.4
883.55.584.65.8
1143.35.080.55.7
Publisher’s Note: MDPI stays neutral with regard to jurisdictional claims in published maps and institutional affiliations.

