1. Introduction
Since the advent of solar panels, solar power plants have been installed at increasing power sizes. Over the last ten years, the capacity built has grown exponentially. In Hungary, it has grown almost ten-fold in 5 years (from 215 to 2001 MW) and is set to increase fivefold in this decade (
Figure 1). However, it should be borne in mind that solar cells age due to their semiconductor electronics, so their efficiency and lifetime are constantly reduced during use. Several test methods are available to assess the condition of solar cells (thermal camera test, flash test, electroluminescence test), however, it is not an easy task to implement real-time diagnosis and clearly demonstrate the time course of efficacy loss [
1]. There are theoretical models that try to draw conclusions from the production and the irradiation data of the given area, but in these cases the efficiency reduction of other equipment (inverters, wires) is also added [
2,
3]. These models can be refined if the solar cells are examined separately, for example by electrical measurements [
4,
5].
During our research work, we conducted a survey of the condition of solar modules in a solar power plant (in 2020, 4 years after commissioning) that has been operating for 5 years. The power plant contains almost 39,000 1.6 m
2 panels of standard size. The power plant operators regularly calculated the theoretical electricity production based on the radiation data typical of the area. There was often a discrepancy of more than 10% between the measured data and the expected values [
6,
7,
8,
9]. To find out the reasons, thermography assessments were made on several occasions [
10,
11]. For hundreds of solar modules, some cells have been found to have 15–40 °C higher temperatures than others. The affected solar panels have been removed. To provide reference data, additional solar cells considered to be in good working order (temperature distribution < 15 °C) were also removed. Our study summarizes the results obtained. The installed solar panels contain 60 cells. In their first 10 years of operation, the maximum allowable efficiency loss is 10%, which is equal to 6 cell power outages. This can also result from a solder fault, which primarily means a failure due to a contact fault. In the case of 30 cells, cell damage without cracking is allowed, which can be realized primarily by recrystallization due to temperature fluctuations during operation. Total burnout of three cells is also acceptable within the threshold limit. New cracks can form in up to 12 cells, which are likely to result in current loss, power loss, and certainly production loss. For three cells, a cobweb-like crack is acceptable. In the case of 30 cells, cracks without current loss and power loss are allowed. Cracks can occur in 6 cells, which cause less than 20% loss of energy production, and cracks with more than 20% loss in production can also be allowed in 6 cells. Given that solar cells have operated for less than five years since their installation, a maximum of half of these phenomena could have occurred assuming linear natural aging. For hundreds of modules, we experienced a faster-than-expected decrease in performance and rapid aging. We believe that this research highlights the fact that we need to be more careful in the future when installing and operating our solar power plants.
2. Materials and Methods
2.1. Mobile Laboratory
The solar panels were tested in an accredited mobile laboratory. The measuring devices were placed in the trunk of a van. This van works as a light-tight black-box where housed inside is a digital camera (JENOPTIC VarioCAM, Jena, Germany) and a sample holder. The interior is spacious enough to accommodate 1.64 m × 0.99 m modules. Thanks to this mobile and compact solution, it is easy to survey solar systems on site, saving a significant amount of money and time. In addition, the laboratory is multifunctional, suitable for flash and electroluminescent test. The spectrum produced by the flash extends from 300 to 1200 nm and it is compatible with the standard IEC 60904-9. Irradiance non-uniformity is under 1% in the entire test area. After manually connecting the module cables, the device performed a 60-ms long flash. The computer determined the electrical parameters and the I–V characteristic curve of the solar modules. The measurement time is under 5 seconds.
The EL images were captured automatically after I–V measurement without any additional work required by the operator. During the EL test, the measurement device was connected to a DC power supply so that the module automatically receives its rated voltage and current for light emission. Although the resolution of the camera is high, the resolution of captured pictures is 3166 × 1920 pixels, so that every small mistake can be noticed in the images. The EL system took a separate image of each wafer. After scanning all 60 wafers one by one, the measurement device assembled the many little ones into a large image that showed the condition of the entire panel.
2.1.1. Thermal Imaging
After the inspection, our department received a dozen modules as a gift. We performed further tests on them, as images taken at the power plant were lost. Thermal imaging is a suitable method for detecting defects or surface contaminants [
10,
11,
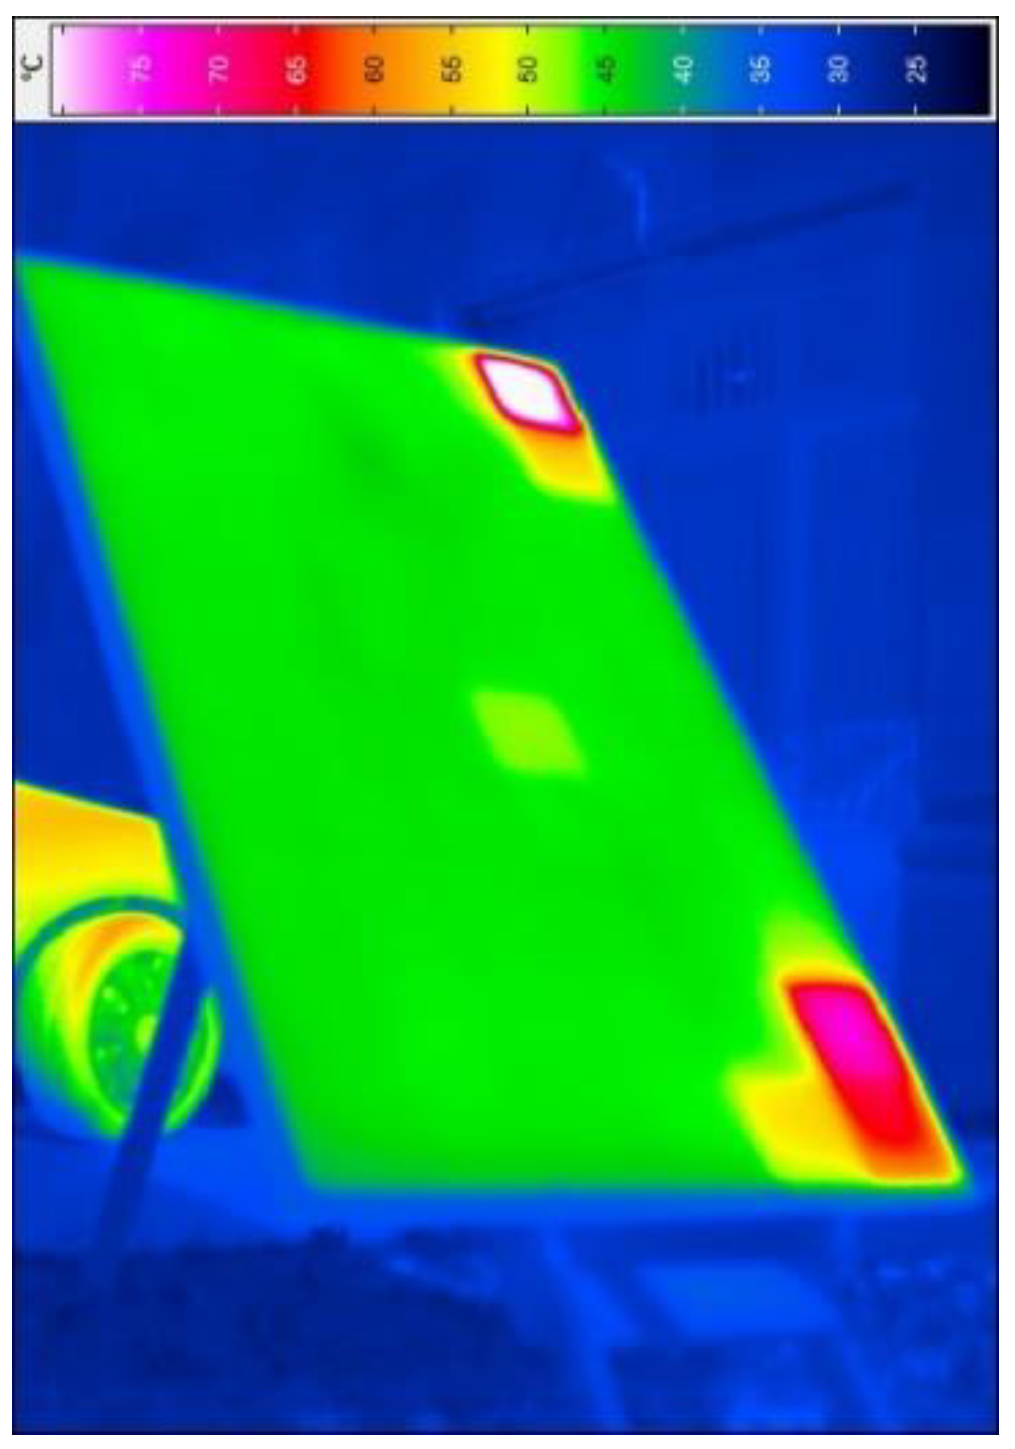
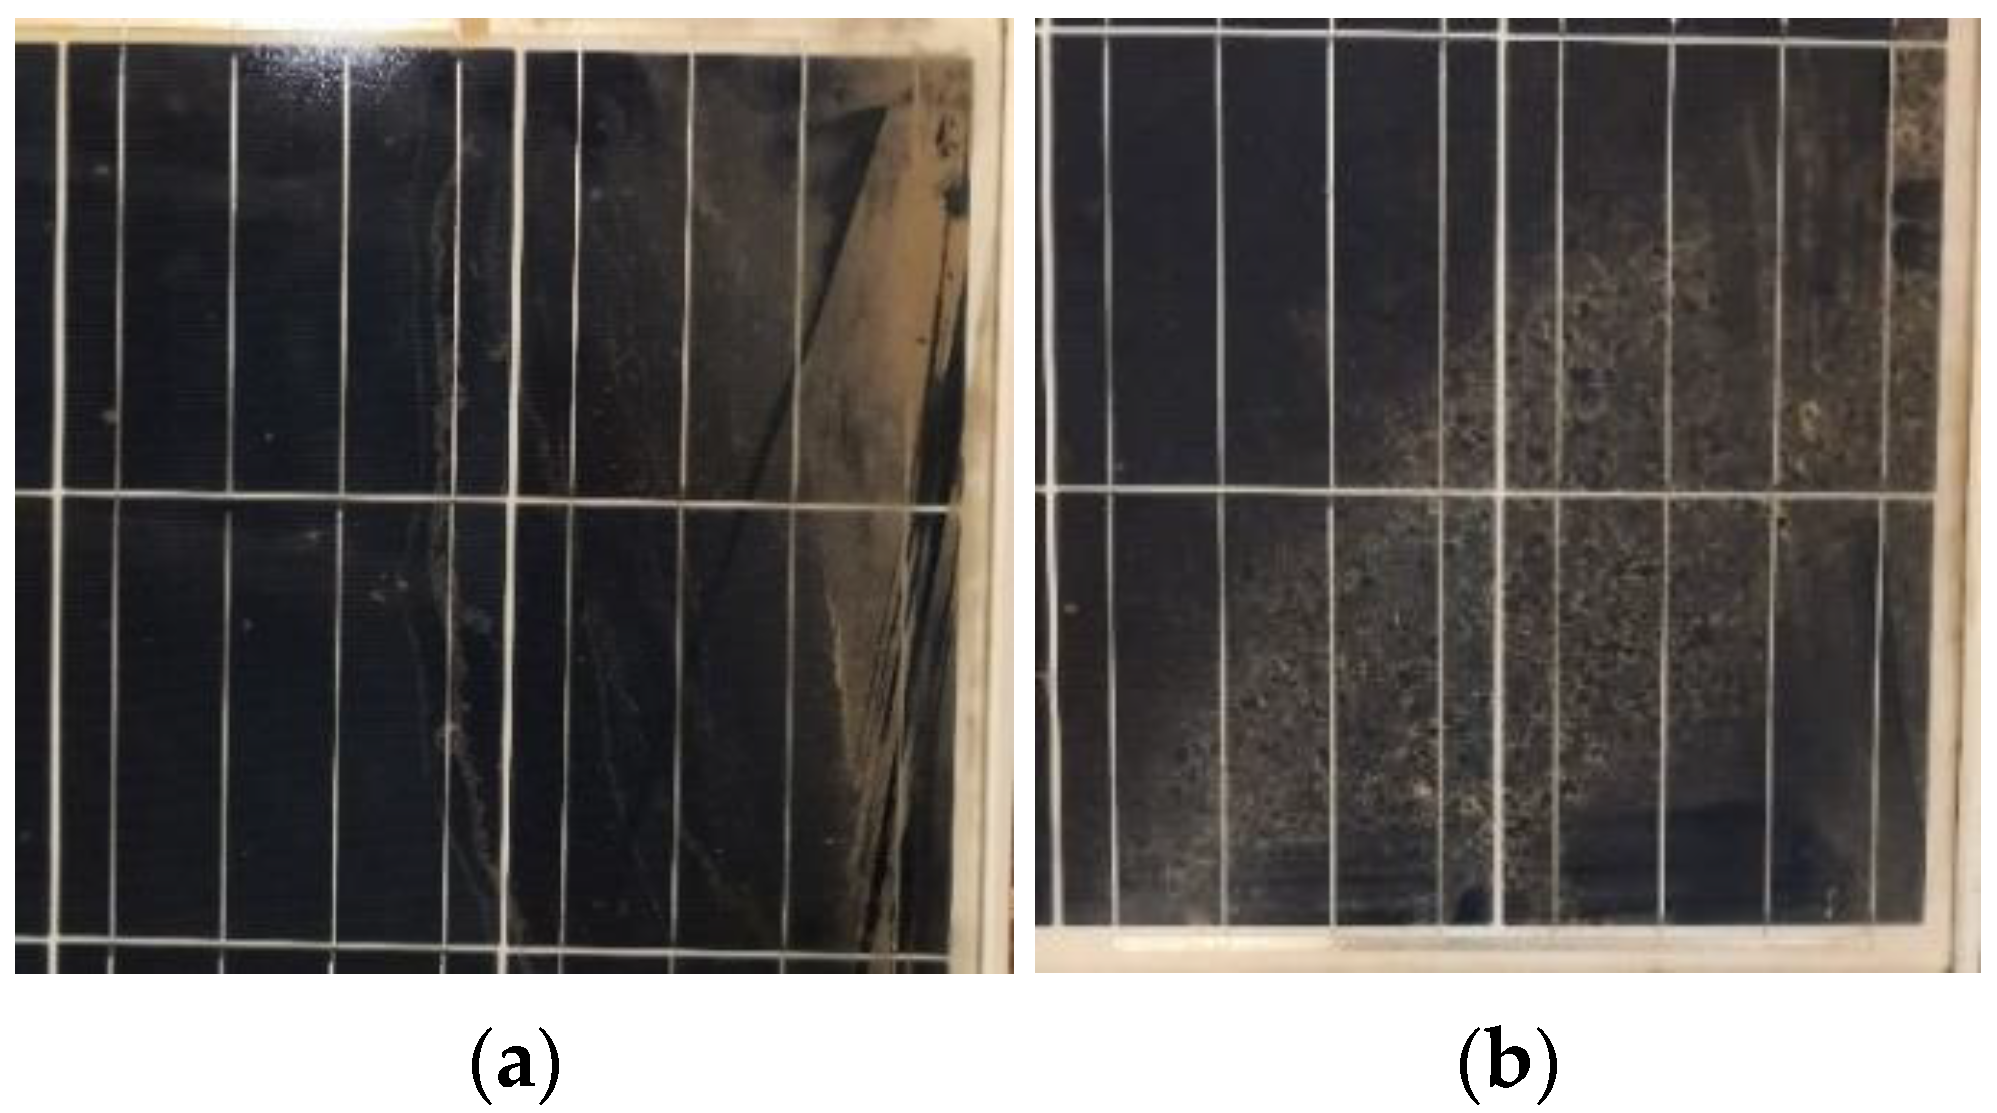
12]. This module also comes from the examined solar power plant. The flash test result was: 267.69 W·MPP (maximum power point) power, 34.67 V·MPP voltage, 7.72 A·MPP current. Based on the test results, it can be stated that the panel was in good condition. However, dirt deposited in the corners can cause damage. The two contaminated corners shown in
Figure 2 and
Figure 3 were covered only by a thin layer of deposited dust.
At 2:00 pm on September 28, 2021, we performed outdoor measurements at the University of Miskolc, Miskolc, Hungary. The open circuit voltage of 33.38 V and a short-circuit current of 6.46 A were measured at a global radiation value of 792 W. The module warmed up in 15 minutes with an average surface temperature of 40 °C. The ambient temperature was 21.3 °C. In the two corners, where dirt deposition was observed (
Figure 3), the temperature increased significantly. This is explained by the fact that the dirt obscures the cells, so they behave like resistance (DC load) instead of generating electricity. The value measured with a contact thermometer in the upper corner was more than double (73.1 °C) the average. The reference value was measured in the middle of the top row. Three cells in the bottom corner were also significantly covered with dirt. Overheating was observed for all three cells. In addition, performance degradation should also be mentioned. The dirty modules tested in the solar power plant were able to produce a 10%–20% lower performance [
4,
5,
13,
14,
15,
16,
17,
18,
19].
Figure 4 shows the additional tests that prove the correctness of
Figure 2. In the first step, we placed a tree branch in front of the panel (
Figure 4a). The tree branch caused moderate cooling in a significant area as the sunrays could not reach the solar cell surface. However, in the case of cells that were completely shaded, intense warming occurred. The explanation is the same as for the effect of surface contamination. As a second step, we cleaned the corners causing them to cool (
Figure 4b). Finally, we removed the tree branch (
Figure 4c).
2.1.2. Flash Test
Table 1 shows the electrotechnical results and the
Figure 5 shows the I–V characteristics of several flash tests. The performance of the most malfunctioning module (PV23160) was only 26.3% of the manufacturer’s data. This value is in sharp contrast with the performance guarantee, and module was virtually completely damaged. The value of the maximum operating point voltage was only one-fourths of the manufacturer’s value. However, the value of the operating point current was proportionally much better, near to the normal value. Based on the electrotechnical parameters, it can be seen that a significant decrease in the voltage of the module can cause some cell damage and their destruction. The voltage of PV73760 and PV02310 modules was low, only about one-thirds of the normal value. The maximal power of both was also low, only 55.5% and 69.4%. PV41140 and PV64260 modules were in a good condition according to the electrotechnical parameters but over the 10% limit. Their maximal power was 87.2% and 89.2%. This assumption is supported by the electroluminescence test (
Figure 6,
Figure 7,
Figure 8,
Figure 9,
Figure 10 and
Figure 11) [
12,
20,
21,
22,
23,
24].
In the case of a well-functioning module (PV50239), we may even experience a slight overwork (103.5%). Peak power is above the upper tolerance limit (260 Wp + 3%). All parameters of the module correspond to the information on the datasheet. The outperformance can also be traced back to current values, that are higher than expected. For each module, the data were recorded, and their distribution will be described in a later chapter.
Figure 5 illustrates the resulting I–V characteristics obtained by six differently behaving solar modules in a flash test [
12]. It is well observed that the I–V curve of PV23160 module (
Figure 5a) and PV73760 module (
Figure 5b) does not correspond to the characteristics of a fault-free solar module; it is far from both the ideal and the practical curve. In case of PV02310 module (
Figure 5c), it can be observed the effect of the non-functioning cells in two whole rows (
Figure 8). The curve of PV41140 and PV64260 module shows, that these modules operate well with a small-scale power reduction (
Figure 5d–e). In
Figure 5f, the practical characteristic curve of the solar module (PV50239) can already be clearly recognized [
13].
2.1.3. Electroluminescence Test
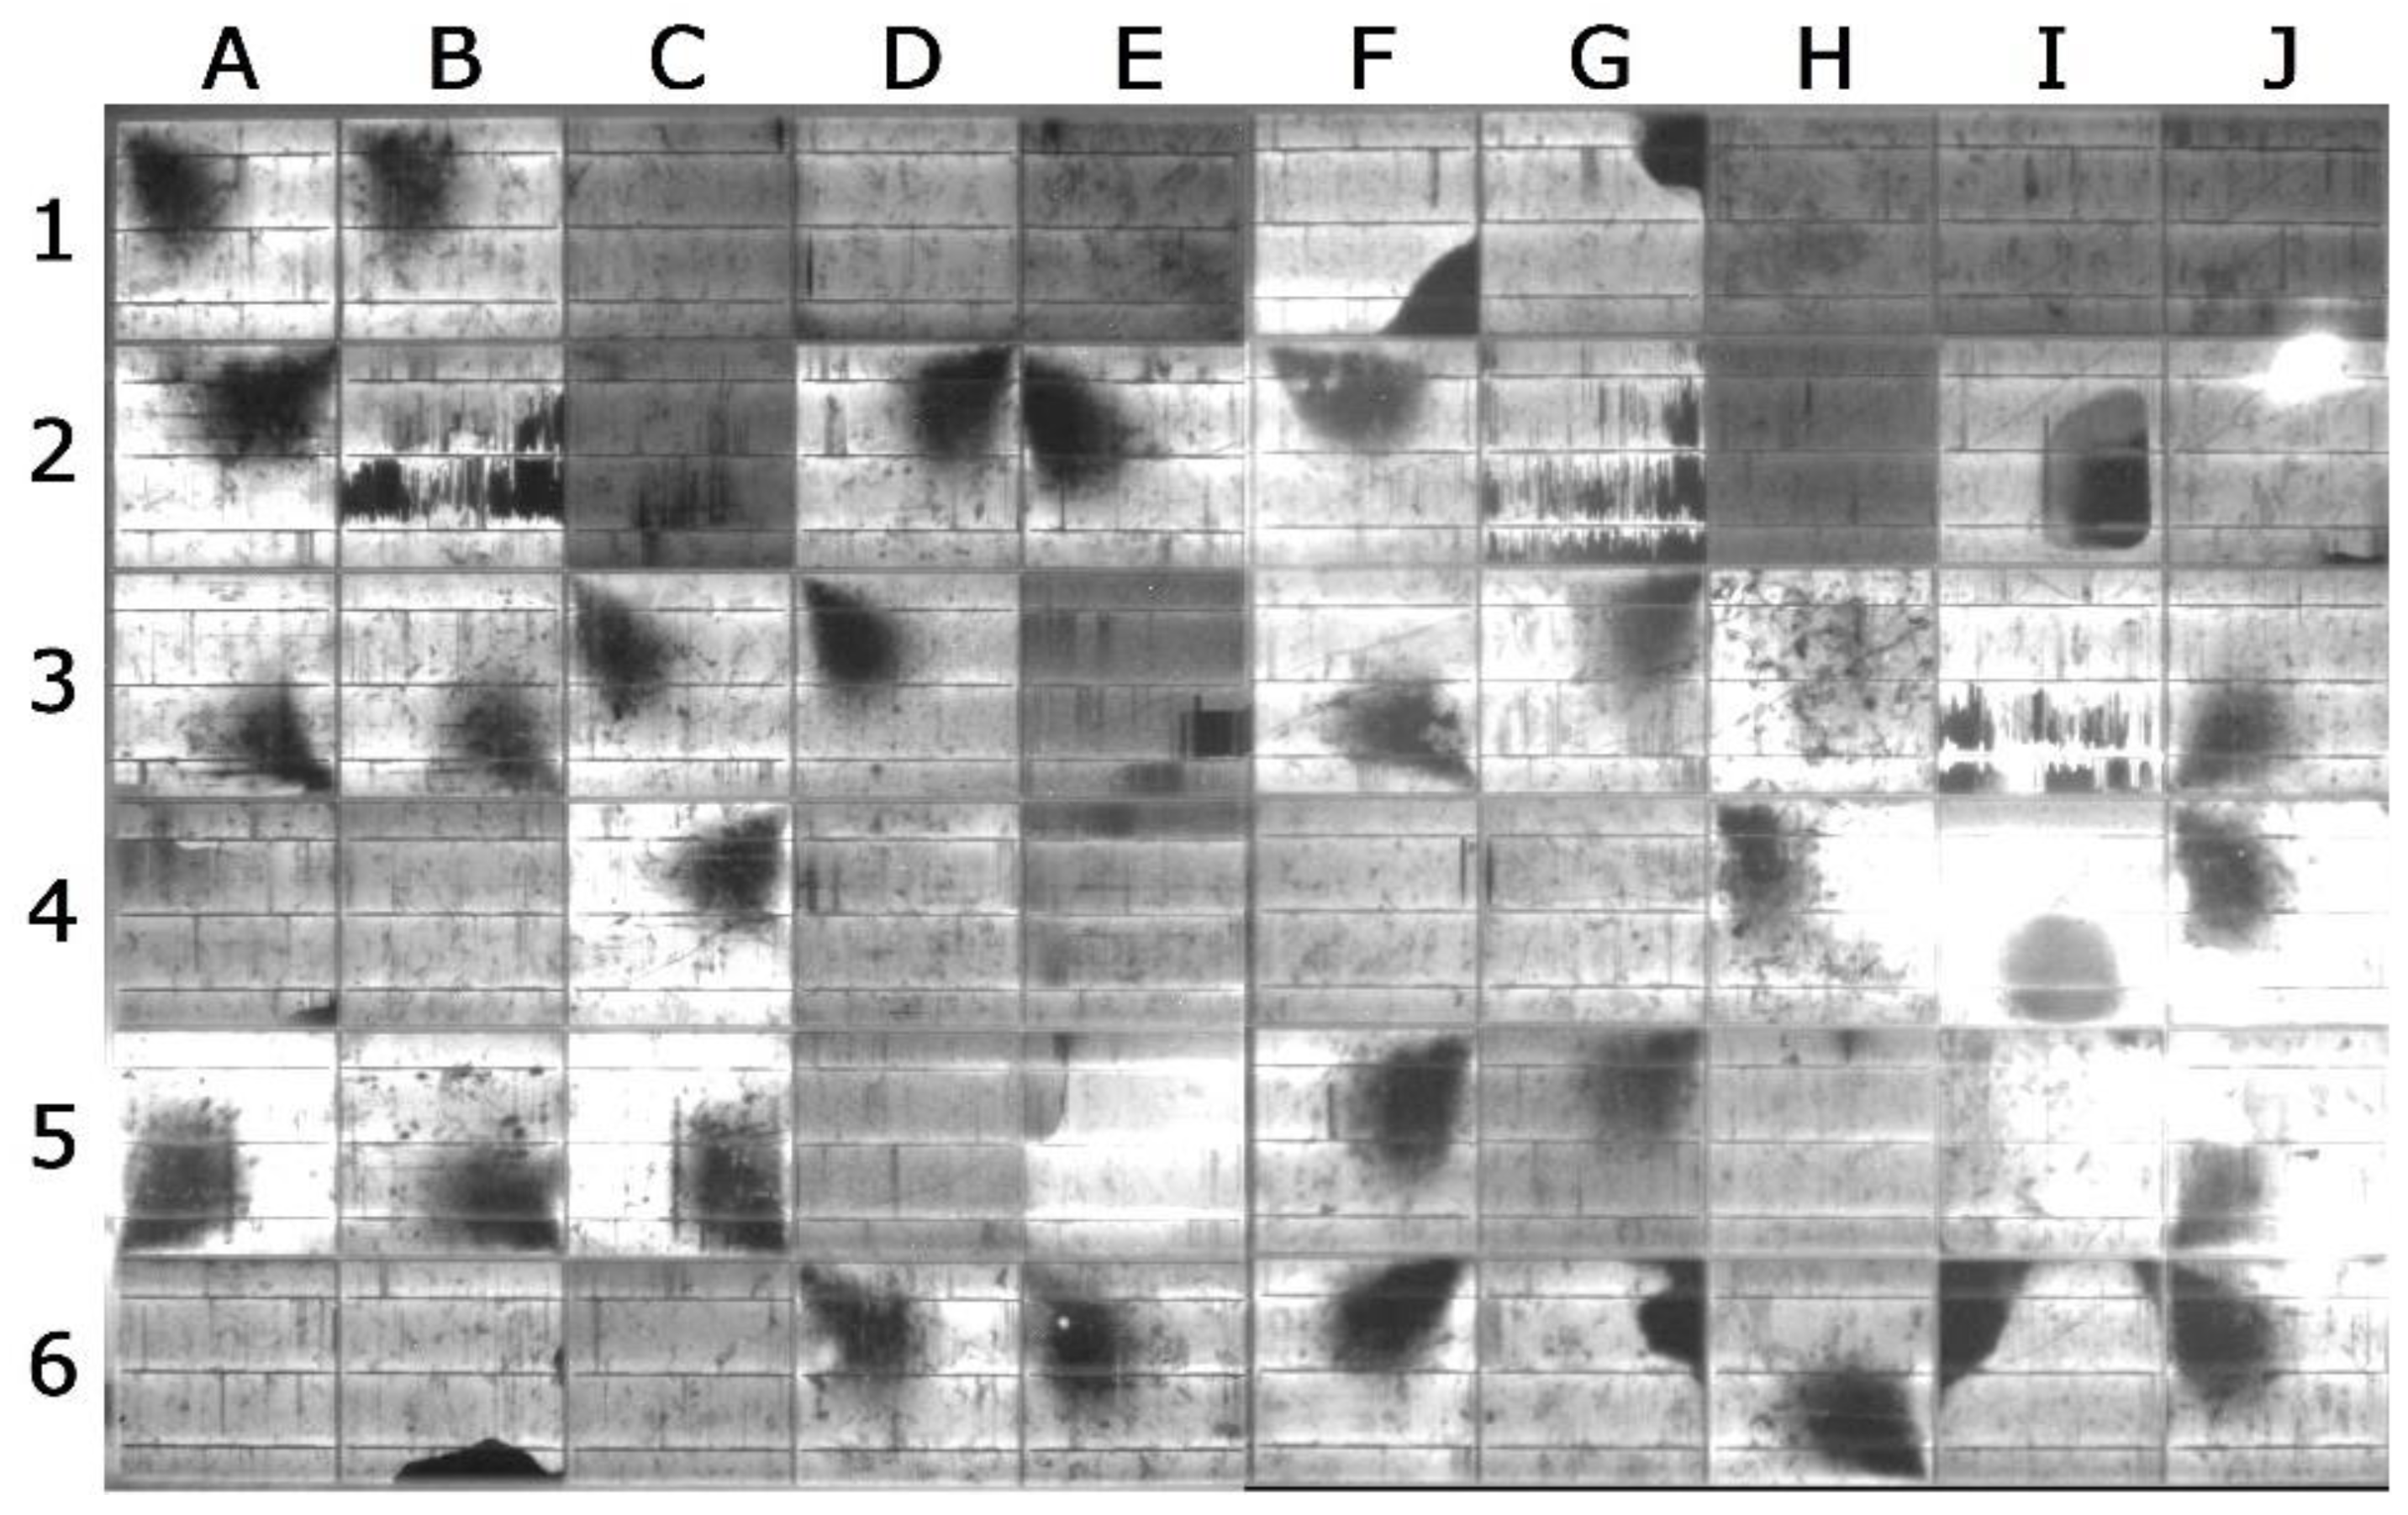
During the electroluminescence tests, all the listed types (in the Introduction chapter) of faults were detected on the solar panel. The following electroluminescent images can be well connected to the I–V curve of the modules [
12]. As in
Table 1, the EL images follow the order of the degree of damage. As the modules measure 1.64 m × 0.99 m (length × width), the aspect ratio is 1:14 in
Figure 6,
Figure 7,
Figure 8,
Figure 9,
Figure 10 and
Figure 11. Firstly,
Figure 6 shows the electroluminescence image of PV23160, which is the most malfunctioning one. There are nonfunctioning cells in the second and fifth row (F2, G2, F5 and G5). Therefore, those lines do not generate electricity. The voltage is 27.4% of the manufacturer’s data. Many cells are in good condition, but critical cracks can be observed in H2 and C6.
Figure 7 shows the electroluminescence image of a solar module (PV73760) whose power was about the half of its rated peak power (144 Wp, 55.5%,
Table 1) during the flash test. Visible full cell burnout (A3), non-critical microcracks (B4, C4), critical cracks (I3) [
25], and local solder failure (B5). Several cells contain finger interruptions (e.g., A4, D3, H3) [
26].
Figure 8 shows a panel (PV02310) that can certainly come from the bottom row of a table. Lines 1 and 2 may have been too close to the ground and shaded by the upper modules of the other table. This is the result of an installation error when the distance between the two tables was not properly determined. In addition, many cells show cracks and cobweb fractures (B3, B4, H5, I3, etc.). A cell piece detachment is observed on cell D4 and a local solder failure (B6). Due to the totally non-functioning two rows, the measured voltage is 20.91 V (60.1% of normal value,
Table 1). The other four rows are still able to generate electricity.
Figure 9 shows the electroluminescence image of a solar panel (PV41140) that failed to meet the expected power level. The power reduction of this module was over 10%. The measured maximal power was 226.7 Wp (
Table 1). In
Figure 9, columns E, F, and G contain “blind spots” caused by wide cracks, i.e., inoperable cell sections (e.g., C6, E4, F5) [
25]. Many cells contain finger interruptions in the whole image (e.g., C2, D5, H5, etc.) [
26] and also several cells contain cracks (A6, B6, C4, etc.) [
25,
26,
27,
28,
29,
30].
Figure 10 shows an electroluminescence snapping of a solar panel (PV64260) showing signs of material defect due to dust deposition. These large dark spots appear to be in the form of shells or funnels (A1, B1, C3, D3, etc.) Cell breakage is observed in cells B6, F1 and I3 [
25]. For five more wafers, a large, obligated cell element can be observed (B2, F1, G1, G6, and I6) [
31,
32,
33,
34,
35].
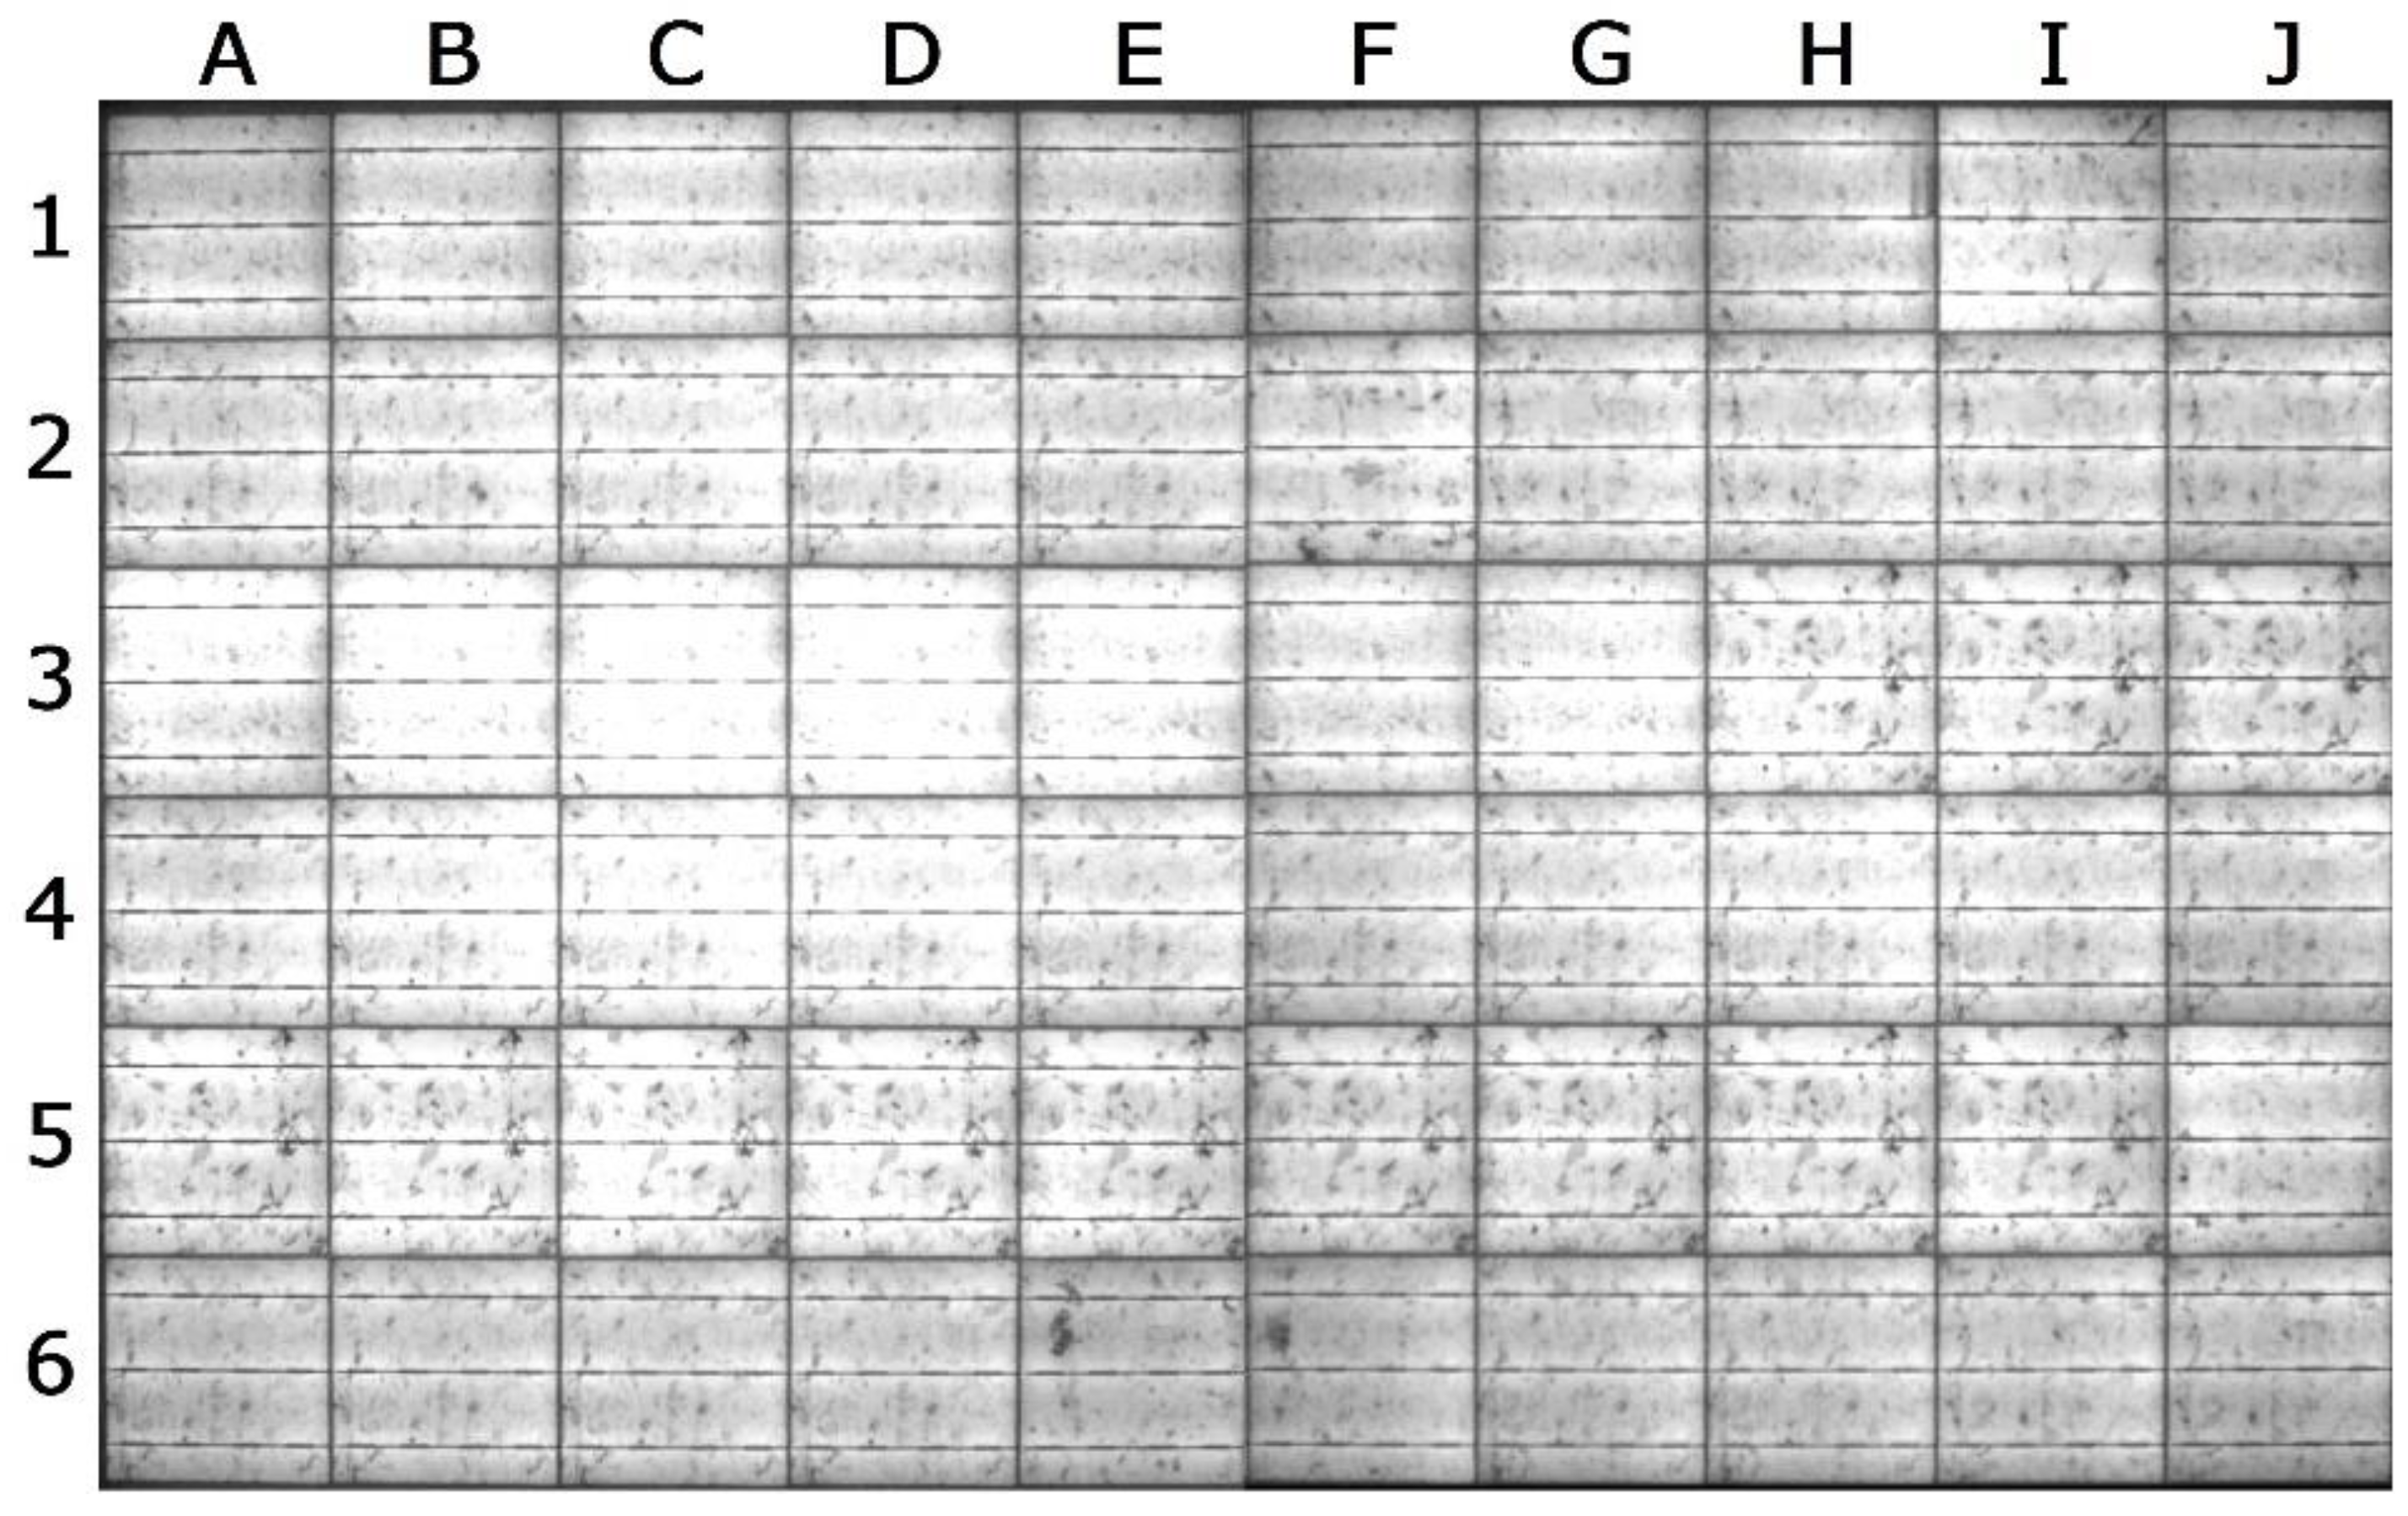
Figure 11 shows the electroluminescence snapping of a solar module (PV50239) whose power was able to provide manufacturer power during the flash test. All cells are bright, with no cracks or breaks visible. Tiny dark spots may be explained by a material defect in a similar pattern on several wafers. This is not a significant manufacturing failure. These small defects do not prevent the module from working properly.
3. Results
It is impossible to report data from more than 1000 panels in as much detail as in previous chapters, thus a statistical summary is much more expedient. In this summary, we compared the results of the flash test available for each module. Five values are derived from the flash tests: MPP power, MPP voltage, open circuit voltage, MPP current and short circuit current. Moreover, only one value is based on in-situ measurement at the solar power plant, which is the actual power value.
Figure 12 shows the distribution of two value types, MPP power and actual power. The MPP power values are derived directly from the flash test, whereas the actual power values are the results of the in-situ measurement. A closer look at the distribution of the MPP power series shows that the maximum performance of many panels is around 270 W. This was explained by the fact that, unlike the official data (260 Wp), many modules were already more powerful than the others at the time of installation. According to the results in the third column of
Table 1, the modules have a power of 260 Wp and the value of the performance tolerance (3%) and measurement tolerance is 3%. This means that the minimum permissible power value during installation is 252.2 W, which changes to 244.63 W with the measuring tolerance. On the other hand, the maximum power is 267.8 W, with the measuring tolerance this value is 275.83 W.
The median of MPP power series is 259.70 Wp, and the average MPP power value is 250.76 Wp. The average difference is 17.68 Wp and the standard deviation is 36.98 Wp. 29% of the values is between of 250 and 260 W (313 modules). Around 27% of MPP power values are less than 252.2 W (282 modules), and 16% were less than 244.63 W (173 modules). The panels have a 90% performance guarantee for the first 10 years and an 85% performance guarantee for the next 10–25 years. After four years, 10% of the modules (107 modules) suffered a performance reduction of more than 10%. If the actual power values are taken into account, we obtain a much worse end result after summing the data. The median of actual power series is 221.55 Wp, and the average actual power value is 215.68 Wp. The average difference of actual power series is 19.27 Wp and the standard deviation is 34.49 Wp. 3% of the values are between of 250 and 260 W (313 modules). Around 98% of MPP power values are less than 252.2 W (1043 modules) and 92% are less than 244.63 W (976 modules). Furthermore, 76% of the modules (811 modules) suffered a performance reduction of more than 10%.
Figure 13 shows the distribution of measured voltage series. The median of MPP voltage series is 34.44 V, and the average MPP voltage value is 33.56 V. The average difference of MPP voltage series is 1.78 V and the standard deviation is 4.34 V; 45% of the values are between of 34and 35 V (476 modules) and 51% of the values are under 34.4 V (manufacturer data from
Table 1). The median of open circuit voltage series is 36.7 V, and the average open circuit voltage value is 36.01 V. The average difference of open circuit voltage series is 1.43 V and the standard deviation is 4.30 V; 55% of the values are between of 36 and 37 V (583 modules) and 61% of the values are under 36.54 V (manufacturer data from
Table 1).
Figure 14 shows the distribution of measured current series. The median of MPP current series is 7.53 A, and the average MPP current value is 7.38 A. The average difference of MPP current series is 0.34 A and the standard deviation is 0.93 A; 56% of the values are between of 7.5 A and 8.0 A (594 modules) and 37% of the values are under 7.47 A (manufacturer data from
Table 1). The median of short circuit current series is 8.24 A, and the average short circuit current value is 8.13 A. The average difference of short circuit current series is 0.33 A and the standard deviation is 0.97 A; 66% of the values are between of 8.0 A and 8.5 A (699 modules) and 11% of the values are under 7.92 A (manufacturer data from
Table 1).
4. Discussion and Conclusions
In summary, the actual power values will certainly give a distorted picture of the condition of the power plant. The measurements lasted a long time, and the modules were not in the same conditions (time, weather). During these in-situ measurements, the surface of the modules was dirty, which further reduced their performance. However, specifically this effect also interested us, as it is a significant factor. At the same time, the actual power values draw attention to the fact that solar modules do not continuously produce peak values, and due to environmental impacts, the actual total performance of the solar power plant may fall far short of expectations. Assuming a linear rate of natural aging, a maximum power reduction of 17.888 Wp can be allowed during the 4-year period between commissioning and measurement, taking into account the tolerance. This means that the MPP performance of the panels at the time of measurement is faultless, in the case of clean panels, it must be more than 242.112 Wp. Out of the 1063 units examined, 913 met this criterion. These are the panels on which the temperature distribution was less than 15 °C. If a measurement uncertainty of 3% is considered, the power of an additional 954 panels may meet expectations (234.849 W). The other solar panels aged faster than expected. This phenomenon affected about 109 solar panels.
Because the MPP power values were recorded under laboratory conditions (constant artificial illumination) and their surface was also cleaned, these values show true performance. For many modules, even better values than the guaranteed performance could be measured. However, the performance of many modules has been significantly reduced in a very short time.
In the case where the actual performance of the panels at the time of measurement is faultless, in the case of clean panels, it must be more than 242.112 Wp. Out of the 1063 units examined, only 118 met this criterion. If a measurement uncertainty of 3% is considered, the power of an additional 234 panels may meet expectations (234.849 W). The other solar panels aged faster than expected. This phenomenon affected about 829 solar panels. However, a reduction in performance due to a manufacturing defect cannot be ruled out either. That mean that with such a large number of panels, some panels may not have been able to meet the factory parameters from the beginning of their operation. Because solar cells that showed temperature deviations greater than 15 °C during thermal imaging studies were subjected to flash tests and electroluminescence tests, these flash tests confirmed that a large number of solar panels did not actually meet the expected performance. Further studies are needed to determine the cause of faster aging.
In order to prevent this problem, more attention should be paid to the effect of surface contaminants. It is advisable to perform thermal camera examinations more frequently using flying drones. The degree of air pollution must be taken into account when starting planning [
1,
2]. The power plant must be located away from busy roads and industrial parks. In the present case, when we are already talking about a power plant that has been built, regular cleaning of the surface of the modules can be considered [
36,
37]. Prototypes of automatically controlled cleaning robots and mechanisms are now available [
38].
Author Contributions
The authors contributed equally to the paper, including conceptualization, I.B. and D.M.-K.; formal analysis, R.R.B.; investigation, R.L. and R.R.B.; writing—original draft preparation, I.B. and D.M.-K.; writing—review and editing, D.M.-K. and R.R.B.; visualization, R.L.; supervision, I.B. All authors have read and agreed to the published version of the manuscript.
Funding
This research received no external funding.
Institutional Review Board Statement
Not applicable.
Informed Consent Statement
Not applicable.
Data Availability Statement
Data sharing is not applicable to this article.
Conflicts of Interest
The authors declare no conflict of interest.
References
- Said, S.A.M.; Hassan, G.; Walwil, H.M.; Al-Aqeeli, N. The effect of environmental factors and dust accumulation on photovoltaic modules and dust-accumulation mitigation strategies. Renew. Sustain. Energy Rev. 2018, 82, 743–760. [Google Scholar] [CrossRef]
- Alonso-Montesinos, J.; Martínez, F.R.; Polo, J.; Martín-Chivelet, N.; Batlles, F.J. Economic effect of dust particles on photovoltaic plant production. Energies 2020, 13, 6376. [Google Scholar] [CrossRef]
- Liu, X.; Yue, S.; Lu, L.; Li, J. Study on dust deposition mechanics on solar mirrors in a solar power plant. Energies 2019, 12, 4550. [Google Scholar] [CrossRef] [Green Version]
- Ndiaye, A.; Kébe, C.M.F.; Bilal, B.O.; Charki, A.; Sambou, V.; Ndiaye, P.A. Study of the correlation between the dust density accumulated on photovoltaic module’s surface and their performance characteristics degradation. Innov. Interdiscip. Solut. Underserved Areas 2018, 204, 31–42. [Google Scholar] [CrossRef]
- Klugmann-Radziemska, E. Shading, dusting and incorrect positioning of photovoltaic modules as important factors in performance reduction. Energies 2020, 13, 1992. [Google Scholar] [CrossRef] [Green Version]
- Gürtürk, M.; Benli, H.; Ertürk, N.K. Effects of different parameters on energy—Exergy and power conversion efficiency of PV modules. Renew. Sustain. Energy Rev. 2018, 92, 426–439. [Google Scholar] [CrossRef]
- Zhang, C.; Shen, C.; Yang, Q.; Wei, S.; Lv, G.; Sun, C. An investigation on the attenuation effect of air pollution on regional solar radiation. Renew. Energy 2020, 161, 570–578. [Google Scholar] [CrossRef]
- Saber, H.H.; Hajiah, A.E.; Alshehri, S.A.; Hussain, H.J. Investigating the effect of dust accumulation on the solar reflectivity of coating materials for cool roof applications. Energies 2021, 14, 445. [Google Scholar] [CrossRef]
- Al Siyabi, I.; Al Mayasi, A.; Al Shukaili, A.; Khanna, S. Effect of soiling on solar photovoltaic performance under desert climatic conditions. Energies 2021, 14, 659. [Google Scholar] [CrossRef]
- Ali, M.U.; Saleem, S.; Masood, H.; Kallu, K.D.; Masud, M.; Alvi, M.J.; Zafar, A. Early hotspot detection in photovoltaic modules using color image descriptors: An infrared thermography study. Int. J. Energy Res. 2021, 45, 1–12. [Google Scholar] [CrossRef]
- Ikejiofor, O.E.; Asuamah, Y.E.; Njoku, H.O.; Enibe, S.O. Detection of hotspots and performance deteriotations in pv modules under partial shading conditions using infrared thermography. Eng. Proc. 2020, 2, 71. [Google Scholar] [CrossRef]
- Gallardo-Saavedra, S.; Hernández-Callejo, L.; Alonso-García, M.C.; Santos, J.D.; Morales-Aragonés, J.I.; Alonso-Gómez, V.; Moretón-Fernández, Á.; González-Rebollo, M.Á.; Martínez-Sacristán, O. Nondestructive characterization of solar PV cells defects by means of electroluminescence, infrared thermography, I–V curves and visual tests: Experimental study and comparison. Energy 2020, 205, 117930. [Google Scholar] [CrossRef]
- Alghamdi, A.S.; Bahaj, A.S.; Blunden, L.S.; Wu, Y. Dust removal from solar pv modules by automated cleaning systems. Energies 2019, 12, 2923. [Google Scholar] [CrossRef] [Green Version]
- Singh, P.; Ravindra, N.M. Temperature dependence of solar cell performance—An analysis. Sol. Energy Mater. Sol. Cells 2012, 101, 36–45. [Google Scholar] [CrossRef]
- Oh, S.; Figgis, B.W.; Rashkeev, S. Effect of thermophoresis on dust accumulation on solar panels. Sol. Energy 2020, 211, 412–417. [Google Scholar] [CrossRef]
- Tang, S.; Xing, Y.; Chen, L.; Song, X.; Yao, F. Review and a novel strategy for mitigating hot spot of PV panels. Sol. Energy 2021, 214, 51–61. [Google Scholar] [CrossRef]
- Gerber, A.; Huhn, V.; Tran, T.M.H.; Siegloch, M.; Augarten, Y.; Pieters, B.E.; Rau, U. Advanced large area characterization of thin-film solar modules by electroluminescence and thermography imaging techniques. Sol. Energy Mater. Sol. Cells 2015, 135, 35–42. [Google Scholar] [CrossRef]
- Salazar, A.M.; Macabebe, E.Q.B. Hotspots detection in photovoltaic modules using infrared thermography. MATEC Web Conf. 2016, 70, 10015. [Google Scholar] [CrossRef] [Green Version]
- Berardone, I.; Lopez-Garcia, J.; Paggi, M. Analysis of electroluminescence and infrared thermal images of monocrystalline silicon photovoltaic modules after 20 years of outdoor use in a solar vehicle. Sol. Energy 2018, 173, 478–486. [Google Scholar] [CrossRef]
- Ballestín-Fuertes, J.; Muñoz-Cruzado-Alba, J.; Sanz-Osorio, J.F.; Hernández-Callejo, L.; Alonso-Gómez, V.; Morales-Aragones, J.I.; Gallardo-Saavedra, S.; Martínez-Sacristan, O.; Moretón-Fernández, Á. Novel utility-scale photovoltaic plant electroluminescence maintenance technique by means of bidirectional power inverter controller. Appl. Sci. 2020, 10, 3084. [Google Scholar] [CrossRef]
- Rajput, A.S.; Ho, J.W.; Zhang, Y.; Nalluri, S.; Aberle, A.G. Quantitative estimation of electrical performance parameters of individual solar cells in silicon photovoltaic modules using electroluminescence imaging. Sol. Energy 2018, 173, 201–208. [Google Scholar] [CrossRef]
- Khan, F.; Kim, J.H. Performance degradation analysis of c-si pv modules mounted on a concrete slab under hot-humid conditions using electroluminescence scanning technique for potential utilization in future solar roadways. Materials 2019, 12, 4047. [Google Scholar] [CrossRef] [PubMed] [Green Version]
- Tang, W.; Yang, Q.; Xiong, K.; Yan, W. Deep learning based automatic defect identification of photovoltaic module using electroluminescence images. Sol. Energy 2020, 201, 453–460. [Google Scholar] [CrossRef]
- Lin, H.-H.; Dandage, H.K.; Lin, K.-M.; Lin, Y.-T.; Chen, Y.-J. Efficient cell segmentation from electroluminescent images of single-crystalline silicon photovoltaic modules and cell-based defect identification using deep learning with pseudo-colorization. Sensors 2021, 21, 4292. [Google Scholar] [CrossRef]
- Chen, H.; Zhao, H.; Han, D.; Liu, K. Accurate and robust crack detection using steerable evidence filtering in electroluminescence images of solar cells. Opt. Lasers Eng. 2019, 118, 22–33. [Google Scholar] [CrossRef]
- Parikh, H.R.; Buratti, Y.; Spataru, S.; Villebro, F.; Reis Benatto, G.A.D.; Poulsen, P.B.; Wendlandt, S.; Kerekes, T.; Sera, D.; Hameiri, Z. Solar cell cracks and finger failure detection using statistical parameters of electroluminescence images and machine learning. Appl. Sci. 2020, 10, 8834. [Google Scholar] [CrossRef]
- Rajput, A.S.; Rodríguez-Gallegos, C.D.; Ho, J.W.; Nalluri, S.; Raj, S.; Aberle, A.G.; Singh, J.P. Fast extraction of front ribbon resistance of silicon photovoltaic modules using electroluminescence imaging. Sol. Energy 2019, 194, 688–695. [Google Scholar] [CrossRef]
- Drabczyk, K.; Kulesza-Matlak, G.; Drygała, A.; Szindler, M.; Lipiński, M. Electroluminescence imaging for determining the influence of metallization parameters for solar cell metal contacts. Sol. Energy 2016, 126, 14–21. [Google Scholar] [CrossRef]
- Frazão, M.; Silva, J.A.; Lobato, K.; Serra, J.M. Electroluminescence of silicon solar cells using a consumer grade digital camera. Measurement 2017, 99, 7–12. [Google Scholar] [CrossRef]
- Deitsch, S.; Christlein, V.; Berger, S.; Buerhop-Lutz, C.; Maier, A.; Gallwitz, F.; Riess, C. Automatic classification of defective photovoltaic module cells in electroluminescence images. Sol. Energy 2019, 185, 455–468. [Google Scholar] [CrossRef] [Green Version]
- Olivares, D.; Ferrada, P.; Bijman, J.; Rodríguez, S.; Trigo-González, M.; Marzo, A.; Rabanal-Arabach, J.; Alonso-Montesinos, J.; Batlles, F.J.; Fuentealba, E. Determination of the soiling impact on photovoltaic modules at the coastal area of the atacama desert. Energies 2020, 13, 3819. [Google Scholar] [CrossRef]
- Akram, M.W.; Li, G.; Jin, Y.; Chen, X.; Zhu, C.; Zhao, X.; Khaliq, A.; Faheem, M.; Ahmad, A. CNN based automatic detection of photovoltaic cell defects in electroluminescence images. Energy 2019, 189, 116319. [Google Scholar] [CrossRef]
- Wang, H.; Zhao, N.; Bi, Z.; Gao, S.; Dai, Q.; Yang, T.; Wang, J.; Jia, Z.; Peng, Z.; Huang, J.; et al. clear representation of surface pathway reactions at ag nanowire cathodes in all-solid Li–O2 batteries. ACS Appl. Mater. Interfaces 2021, 13, 39157–39164. [Google Scholar] [CrossRef] [PubMed]
- Fontani, D.; Sansoni, P.; Francini, F.; Messeri, M.; Pierucci, G.; DeLucia, M.; Jafrancesco, D. Electroluminescence test to investigate the humidity effect on solar cells operation. Energies 2018, 11, 2659. [Google Scholar] [CrossRef] [Green Version]
- Khan, F.; Rezgui, B.D.; Kim, J.H. Reliability study of c-Si PV module mounted on a concrete slab by thermal cycling using electroluminescence scanning: Application in future solar roadways. Materials 2020, 13, 470. [Google Scholar] [CrossRef] [PubMed] [Green Version]
- Kazem, H.A.; Chaichan, M.T.; Al-Waeli, A.H.A.; Sopian, K. A review of dust accumulation and cleaning methods for solar photovoltaic systems. J. Clean. Prod. 2020, 276, 123187. [Google Scholar] [CrossRef]
- Alagoz, S.; Apak, Y. Removal of spoiling materials from solar panel surfaces by applying surface acoustic waves. J. Clean. Prod. 2020, 253, 119992. [Google Scholar] [CrossRef]
- Parrott, B.; Zanini, P.C.; Shehri, A.; Kotsovos, K.; Gereige, I. Automated, robotic dry-cleaning of solar panels in Thuwal, Saudi Arabia using a silicone rubber brush. Sol. Energy 2018, 171, 526–533. [Google Scholar] [CrossRef]
| Publisher’s Note: MDPI stays neutral with regard to jurisdictional claims in published maps and institutional affiliations. |
© 2021 by the authors. Licensee MDPI, Basel, Switzerland. This article is an open access article distributed under the terms and conditions of the Creative Commons Attribution (CC BY) license (https://creativecommons.org/licenses/by/4.0/).


