1. Introduction
Lebeck A.O. [
1], Green I. [
2], and Lu [
3] note that contact mechanical seals are a critical rotating equipment part as they reduce leakage, save energy, and protect the environment. Thus, they remain in the focus and research hotspot of both the scholars and engineers around the world [
1,
2,
3], and Fan et al. [
4] thinks that the leakage failure of contact mechanical seals is still common. Gu [
5] noted that to effectively control and reduce the leakage of contact mechanical seals, it is necessary to focus on the main leakage channel formed between the end faces of the dynamic and static rings. Based on the understanding of its formation, associated evolution mechanism, and external influencing factors, a scientific and reasonable leakage calculation model was established. Furthermore, many studies have been carried out worldwide.
Heinze [
6] established the leakage model for the plane with ideally smooth clearance. Mayer [
7] proposed a simplified model wherein the leakage channel was assumed to be a microchannel with an equal radial height and a uniform gap width. Next, after considering various factors affecting the mechanical seal ring during use, Lebeck [
8] established the leakage channel gap model with a wavy interface. Subsequently, Lebeck [
9] and Elhanafi et al. [
10] proposed a tapered leakage channel gap model after considering the roughness and waviness of the sealing contact surface. Green [
11] studied the variations of simplified leakage channel clearance with time, considering the changes in seal face cone angle caused by wear. Sun et al. [
12] used fractal parameters to characterize the scale irregularity of roughness, waviness, and sealing surface taper. The authors have deduced that the fractal model of the leakage channel was related to time.
The essence of the above-mentioned leakage channel models is to simplify the pores between the rough contact interfaces. The interfaces can be simplified either as parallel gaps with equal height in radial direction or gaps with cosine curves in the circumferential direction. Said conversion greatly simplifies the ensuing calculation process. However, there are also micro bumps and pits with rather disordered geometries and random characteristics on the two seal surfaces. Once the surfaces come in contact, a leakage channel between the seal interfaces is formed. In that case, Wei et al. [
13] noted that if only simplified geometric models are used to describe the leakage rate, the existence of channels between the contact surfaces that are not connected through the sealing surface will be ignored. Furthermore, this is also the main reason why the leakage rate obtained using such models is higher than the measured value.
For these reasons, new leakage models were proposed. Subramaniam et al. [
14] provided a comprehensive and understandable account of the theoretical foundation, modeling issues, and numerical implementation of the Lagrangian–Eulerian (LE) approach for multiphase flows, they also thought that LE methods can be used to solve multiphase flow problems of practical interest, provided sub-models are implemented using numerically convergent algorithms. Bao et al. [
15] established the seepage channel model between end faces of contact mechanical seals; however, this model could not accurately describe the fluid movement characteristics on the pore scale. Moreover, Bottiglione et al. [
16] proposed a two-dimensional percolation leakage channel model for static sealing interfaces. The model was based on two-dimensional percolation theory and contact mechanics theory. Inspired by this model, Yu et al. [
17] studied the percolation characteristics of contact mechanical seal interfaces and investigated the changes in critical percolation channel height with time. Zhou et al. [
18] developed a percolation model for three-dimensional contact between the dynamic and static rings of contact mechanical seals, proposing a method to determine the pore mass percolation. Sun et al. [
19] assumed a single-layer grid percolation at the sealing interface and established the leakage channel model corresponding to the porosity of the sealing interface. Chong Peng et al. [
20] presented a numerical model for simulating free surface flow in porous media with spatially varying porosities. which can consider the spatial and temporal variation of porosity in the porous media. Cancès et al. [
21] proposed a variational approach which avoided the introduction of the so-called Kirchhoff transform and global pressure. Afrasiabi et al. [
22] presented a particle-based numerical solver, applicable to the simulation of heat transfer in multiphase immiscible flows including surface tension and presented a novel coupling of three state-of-the-art particle methods, capable of simulating heat transfer in multiphase flows with minimum error [
23]. Kambhammettu et al. [
24] proposed a relationship to account for change in the permeability and the thickness of the seal interface with contact pressure at the interface and fluid pressure of fluid flowing through the interface and developed a porous-media-based model to describe gas leaking through the metal–elastomer interface.
Based on the reviewed literature, it is clear that the leakage channel model based on the percolation theory provides all the conditions necessary for the study of random and disordered fluid flow on the mechanical seal interface. However, the currently available studies of this model remain in the preliminary stages. Their leakage rate calculation segments mainly focus on the leakage at a single percolation point, while Ji et al. [
25] proposed that the actual leakage channel may have multiple percolation points and various bifurcation forms. Therefore, the calculated values were smaller than their measured counterparts. Based on the extracted real mechanical seal interface data as samples via porous media theory and fractal theory, Ni et al. [
26] established a theoretical model for calculating the seal face leakage rate based on the modified Hagen–Poiseulle equation. It provided a new way to both accurately calculate and predict the leakage rate of contact mechanical seals and reveal the leakage mechanism.
The leakage channel size at the sealing interface is generally in the micron level, belonging to the microflow category. Hence, some of the factors generally neglected in macro flow, such as surface wettability and surface tension, become critical due to the increase in surface area relative to volume. For this reason, a contact mechanical seal leakage rate model considering surface wettability was established in this paper. The model was based on the model developed by Ni et al. [
26] and using the boundary slip theory through establishing the relationships between slip length and surface apparent contact angle, slip length, and leakage rate. It is expected that the study at hand can provide a foundation for further calculation and suppression of the leakage rate of contact mechanical seals.
2. Numerical Analysis of the Effect of Surface Wettability on Slip
The relation between the surface wettability and slip was determined based on the Cassie model and the slip theory and discussed. The slip surfaces and microchannels with various microstructure parameters were constructed and simulated using FLUENT software (version 18.2); the surface wettability was characterized by the apparent contact angle.
2.1. Establishing the Model
A two-dimensional spatial calculation model of a microchannel along the flow direction is shown in
Figure 1. The lower surface simulates the slip surface by constructing a regular rectangular microstructure. The total model length was 200 μm and its height was 100 μm. The slip surface was located 50 μm from the entrance boundary to ensure that the incoming flow will fully develop, ensuring the accuracy of calculation results. Similarly, it was also located 50 μm from the exit boundary to ensure that the outflow would not affect the sliding surface flow state. The model groove depth
h and width
s were the same, while the groove spacing was
a.The influence of microstructure geometric parameters on the solid surface wettability can be studied using a highly regular rough surface [
27]. After defining the microstructure eigenvalues
β =
s/
a, the relationship between the apparent contact angle
θr and the intrinsic contact angle
θe can be obtained as follows [
27]:
A 0.2 μm step was used to reduce the groove spacing
a and increase the groove width
s, aiming to study the effect of apparent contact angles on the slip flow. Nine groups of microchannel models with different microstructures were constructed (see
Table 1) to simulate the wettability effect in the actual leakage channel under the same conditions. Considering that the static ring of the contact mechanical seal is usually made of carbon graphite, the intrinsic contact angle was
θe = 45° [
28]. The apparent contact angles under different microstructures were calculated using Equation (1) and are listed in
Table 1.
2.2. Meshing
Tetrahedron structure mesh is employed within the ICEM module in ANSYS 19.0 to divide the computational domain. The mesh generation of the proposed model needs to be specially considered in simulating the slip flow on the slip surface. The boundary layer grid and the grid encryption technology were adopted for grids inside the sliding wall and the groove. The grids near the sliding wall are dense and become sparser when moving away from the sliding wall.
2.3. Initial Conditions and Boundary Conditions
By using multiphase flow ‘Volume of Fluid’ model to accurately capture the interaction and change process of gas and liquid phases. Moreover, turn on the surface tension option was included, and the surface tension coefficient was set to 0.07. The Call SST k-w model was used in the turbulence model, and the liquid phase was set to water and the gas phase was set to air.
The left end of the calculation domain was set as the uniform velocity inlet, and the mathematical expression is as follows:
Furthermore, the right end of the calculation field was set as the pressure outlet and the mathematical expression is as follows:
2.4. Governing Equations
Volume fraction equation: in the VOF model, tracking the interface between phases is completed by solving the continuous equation of the volume fraction of one or more phases. For the q-phase, there is the Equation [
29]:
Except that a constant mass source or a custom mass source is specified for each phase, the source term s at the right end above is zero.
Attribute equation: the properties appearing in the transport equation are determined by the phase separation existing in each control volume. Taking the gas–liquid two-phase system as an example, the subscripts
a and
w are used to represent the gas phase and liquid phase. If the volume fraction of the liquid phase is tracked, the density in each unit can be written as:
All other properties can be evaluated in this way.
Momentum equation: solve the momentum equation of each single phase in the whole flow field, and the velocity field is shared by each phase. The attributes
a and
B in the momentum equation depend on the volume fraction of all phases, which is written as:
In the equation, v is the common velocity vector of the fluid; g is gravitational acceleration; F is the volume force.
2.5. SST k-w Model
SST
k-
w model has two advantages: one is to use the
k-
w formula in the boundary layer, which can be directly used in the whole viscous sublayer, so it can be used as a low resolution turbulence model; the other is that the SST formula can also transform the
k-
ε behavior in free flow, so as to avoid the common
k-
w problem; that is, the model is sensitive to the turbulent flow of inlet free flow. In general, the standard
k-
w model is used inside the boundary layer and the
k-
ε model is used outside the boundary layer. Considering the influence of turbulent shear force, the viscosity term of turbulence is modified.
2.6. Grid Sensitivity Test
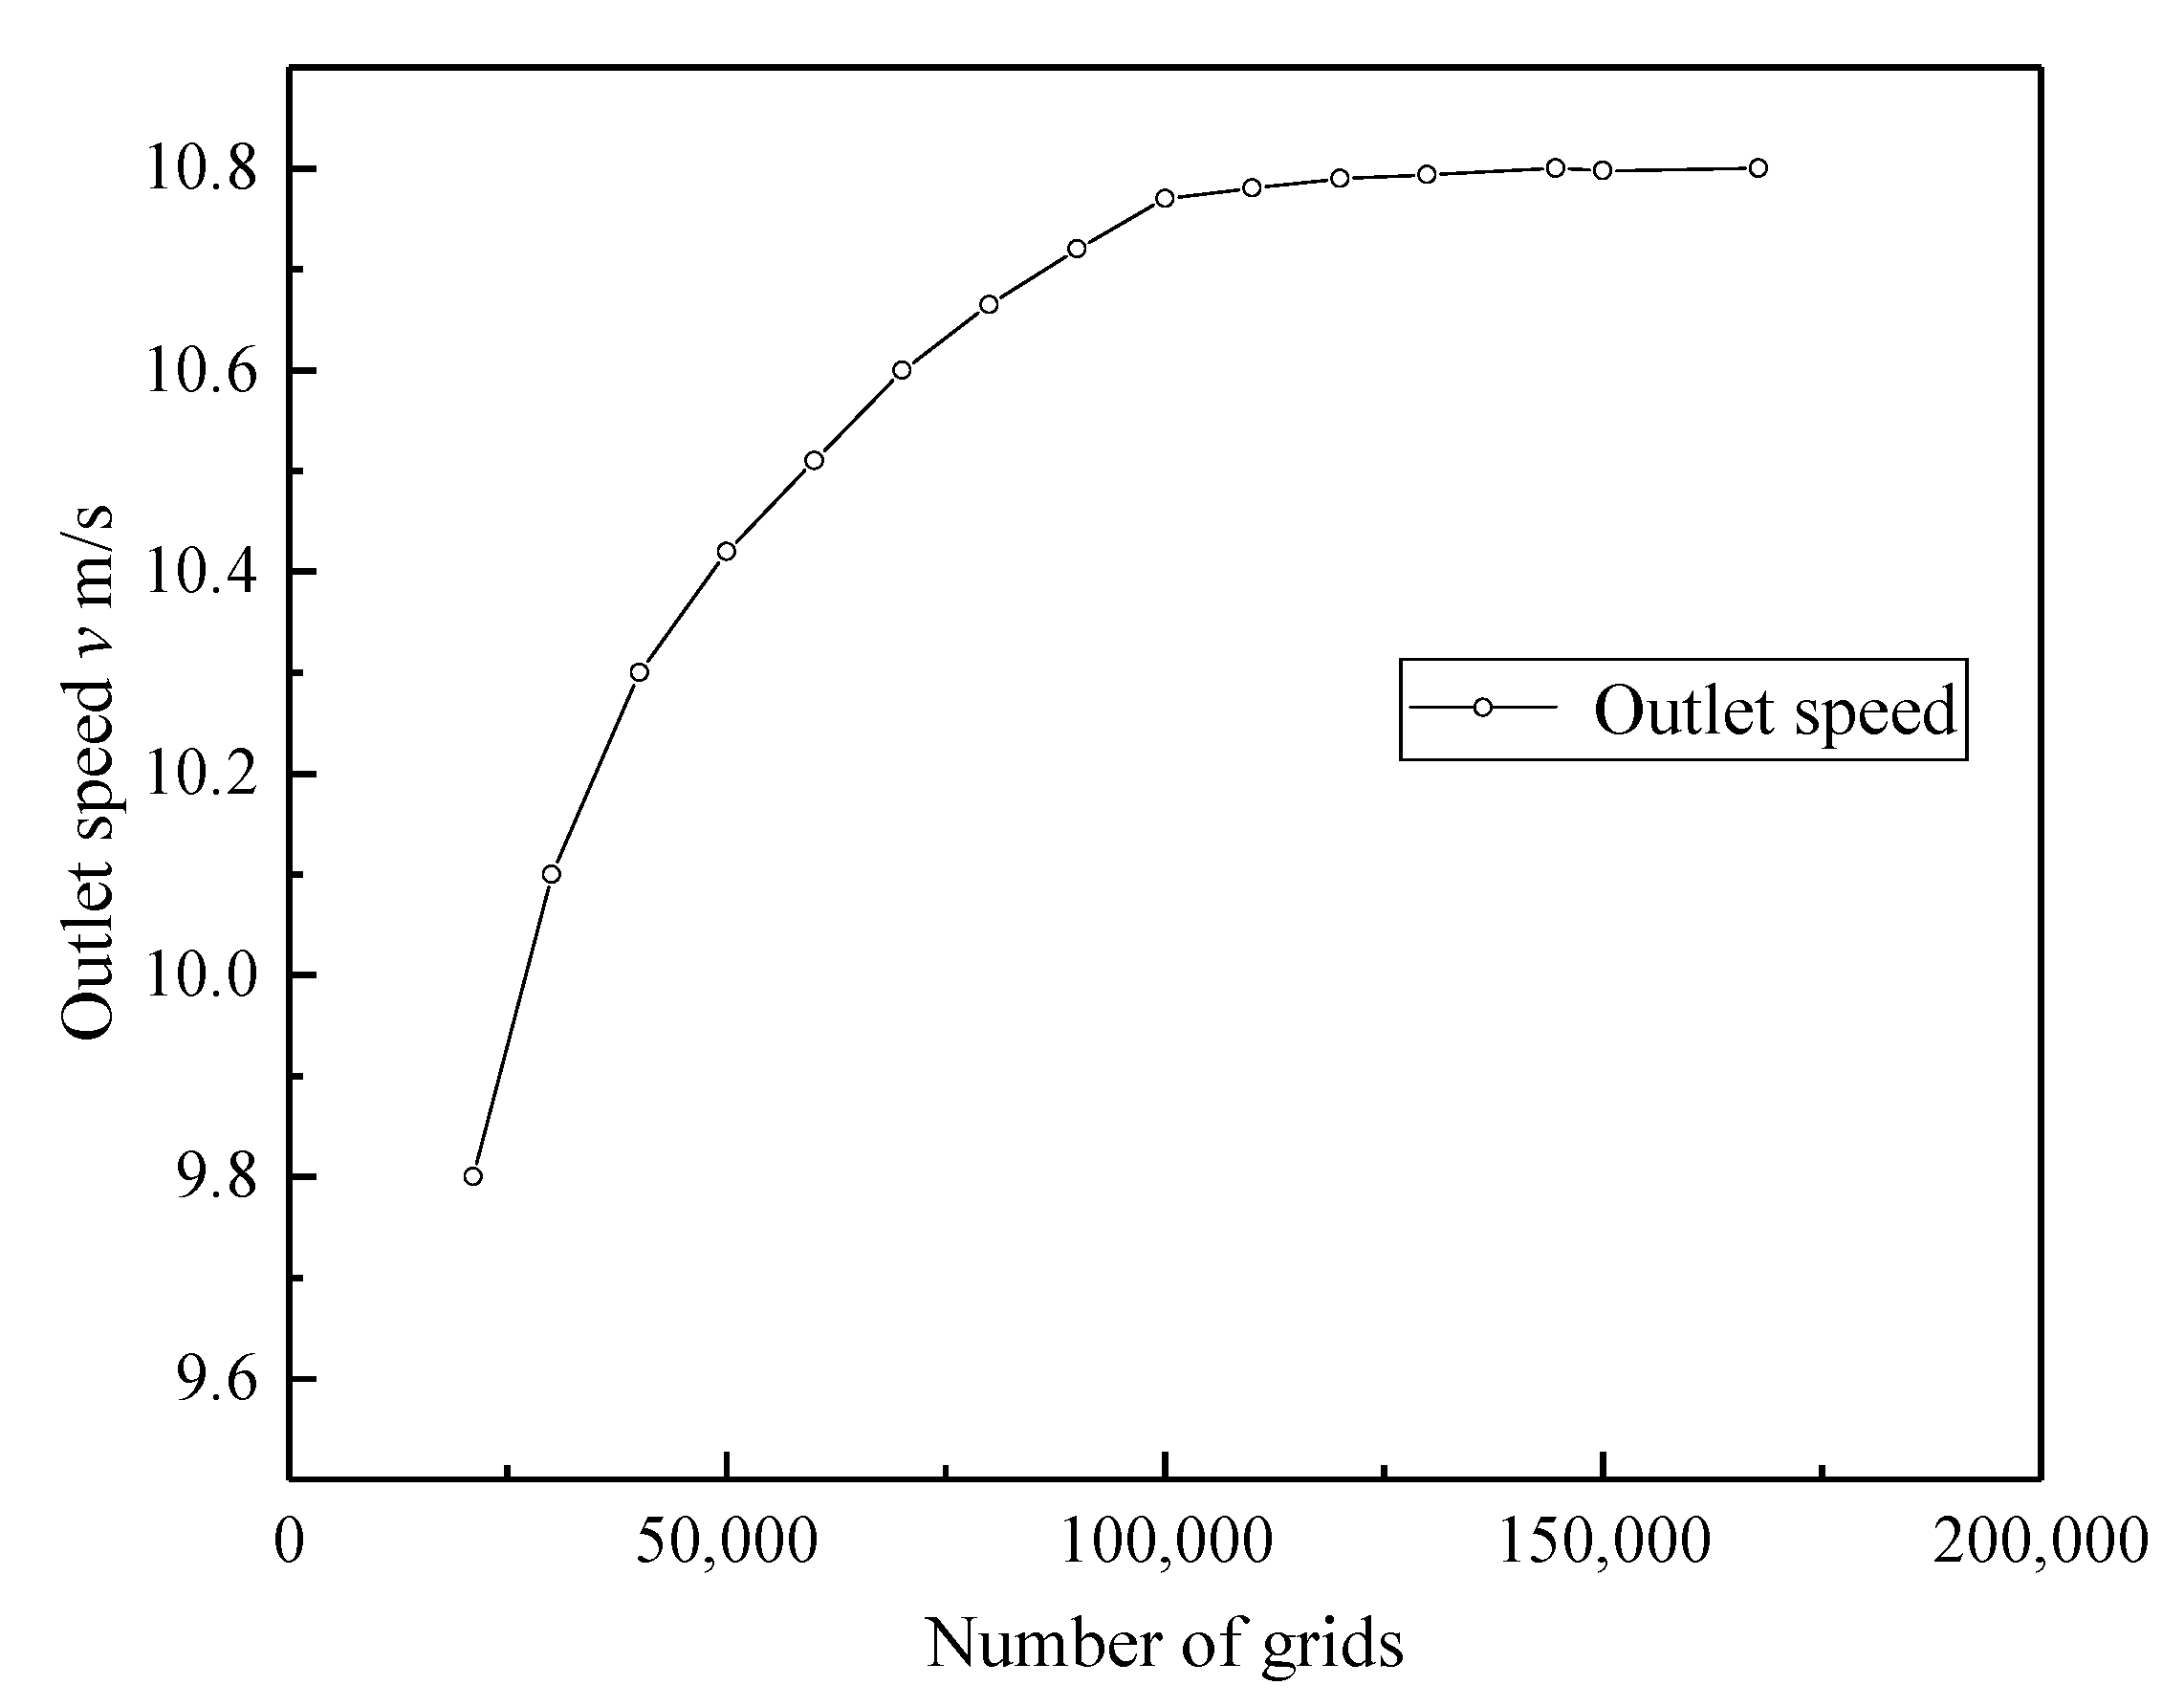
In order to achieve the required calculation accuracy and reduce the calculation cost, the outlet velocity of the flow field is compared and analyzed for the number of grids was between 21,049 and 167,815. The results of grid sensitivity test are shown in
Figure 2. When the number of grids was 144,656, the relative error was 0.04%. Therefore, considering the influence of the number of grids on the calculation cost, it was decided to divide the grid with the size of grids as the standard.
2.7. Numerical Simulation Results and Analysis
The velocity contour of the slip surface with the apparent contact angle (see
Figure 3) was
θr = 154°, while the apparent contact angle was
θr = 84°. The velocity streamlines of various slip surfaces are shown in
Figure 4. As can be seen from the figures, at the gas–liquid interface located at the groove top, the fluid velocity was higher near the wall; the wider the groove, the more obvious the difference. This is caused by a small amount of air trapped in the groove which formed a gas–liquid free shear interface, reducing the wall resistance and increasing the velocity. This is consistent with reference [
29].
The overall velocity vector diagram of the flow field with the apparent contact angle
θr = 154° is shown in
Figure 5. The slip velocity near the wall was small, while the velocity vector showed a gradual increasing trend in the process of developing from the near wall to the inside of the channel. Finally, the flow field velocity tended to be stable, reaching the initially set value
v = 10 m/s.
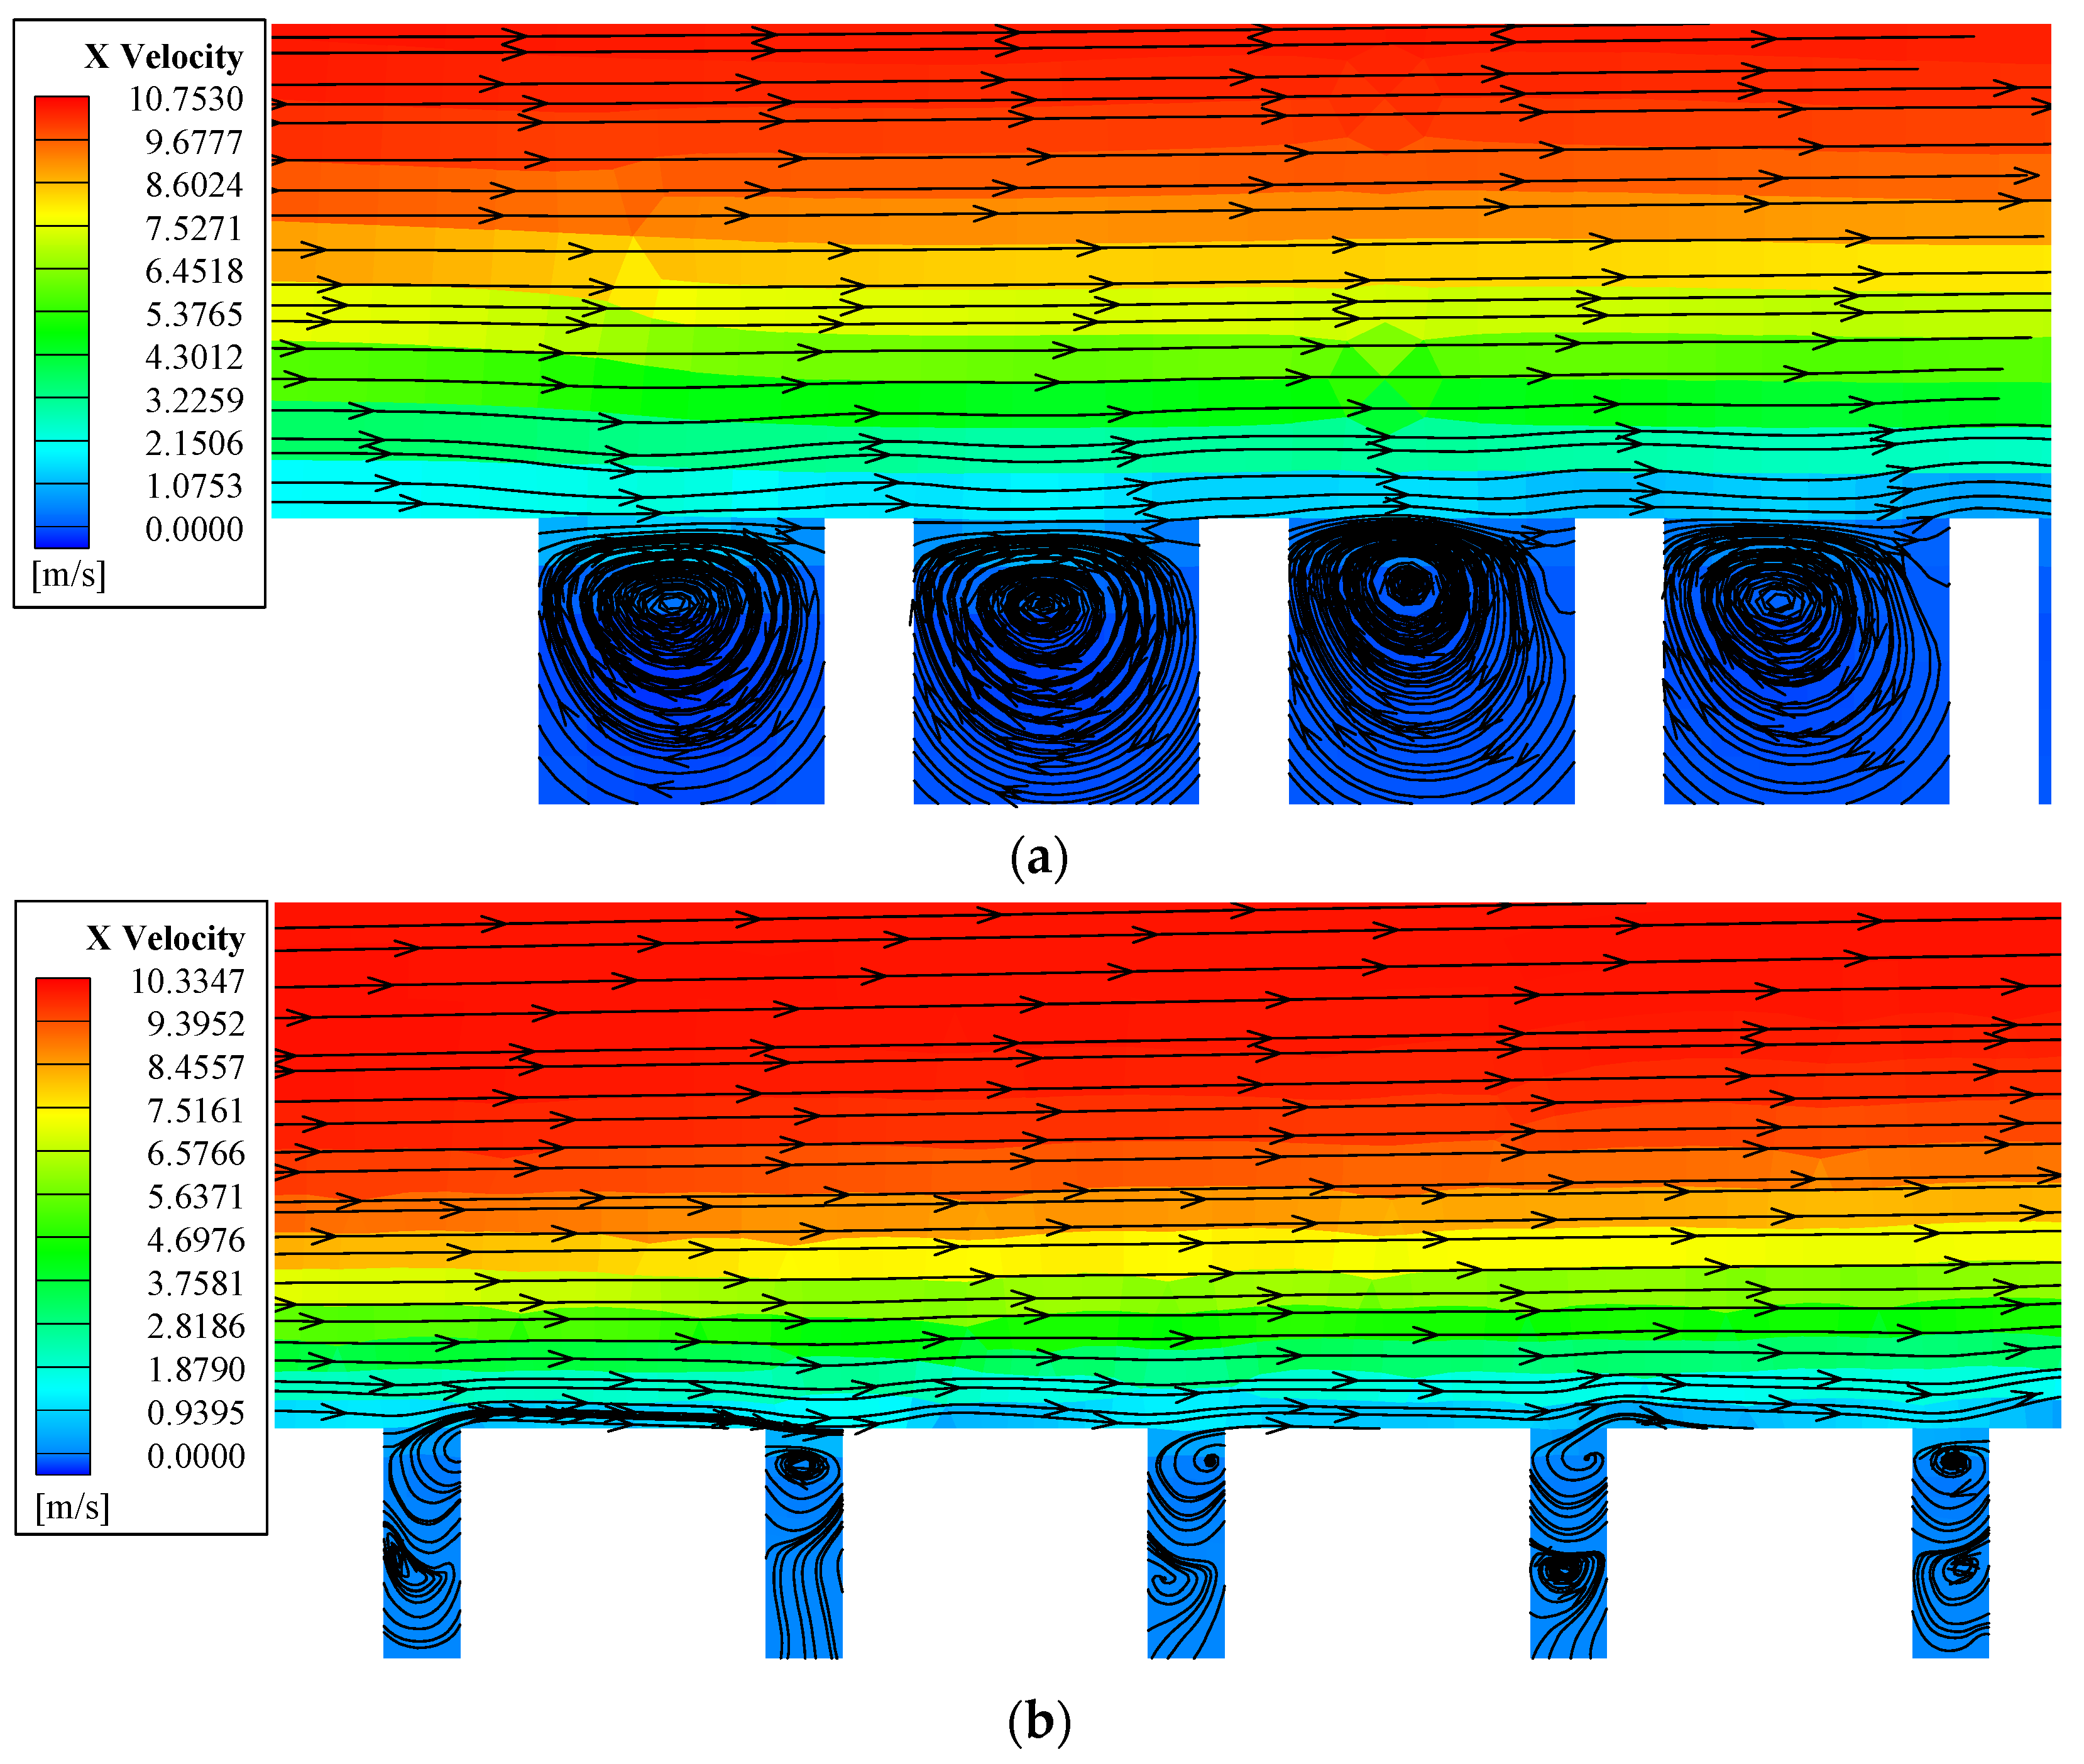
The velocity distribution inside the microchannel groove for various microstructure parameters is shown in
Figure 6. As can be seen in
Figure 6a, a low-speed rotation vortex was formed in the microchannel groove when the groove width was large and the spacing was small. The vortex formation had two main effects on the incoming flow.
Firstly, the rotating vortex inside the groove made the low-speed airflow and the external high-speed water flow contact with each other at the groove top, resulting in the ‘Vortex Cushion’ effect. The Vortex Cushion effect, in turn, reduced the velocity gradient of the high-speed incoming flow, also reducing the turbulence intensity and turbulent energy consumption near the wall. The formation of a low-speed vortex also made the incoming flow flow directly from the groove top without contacting its inner wall, reducing the total friction resistance.
Secondly, the friction resistance direction of the low-speed vortex in the groove was the same as that of the incoming flow at the upper grove part. Thus, the friction resistance formed at the groove bottom can be used as an additional power to propel the incoming flow. These two effects were identified as root causes of the wall slip. Moreover, as shown in
Figure 6b, when the groove width is reduced and the spacing is increased, a stable vortex cannot be formed, or the vortex effect is not obvious, resulting in the negligible sliding effect.
For the positive slip on the hydrophobic surface, the slip length was numerically equal to the vertical distance from the inner wall to the outer wall, until the point where the velocity was zero. Next, when the slip length was equal to the thickness of the viscous layer of liquid molecules adsorbed on the wall the slip on the hydrophilic surface was negative. The layer was analytically expressed as [
29]:
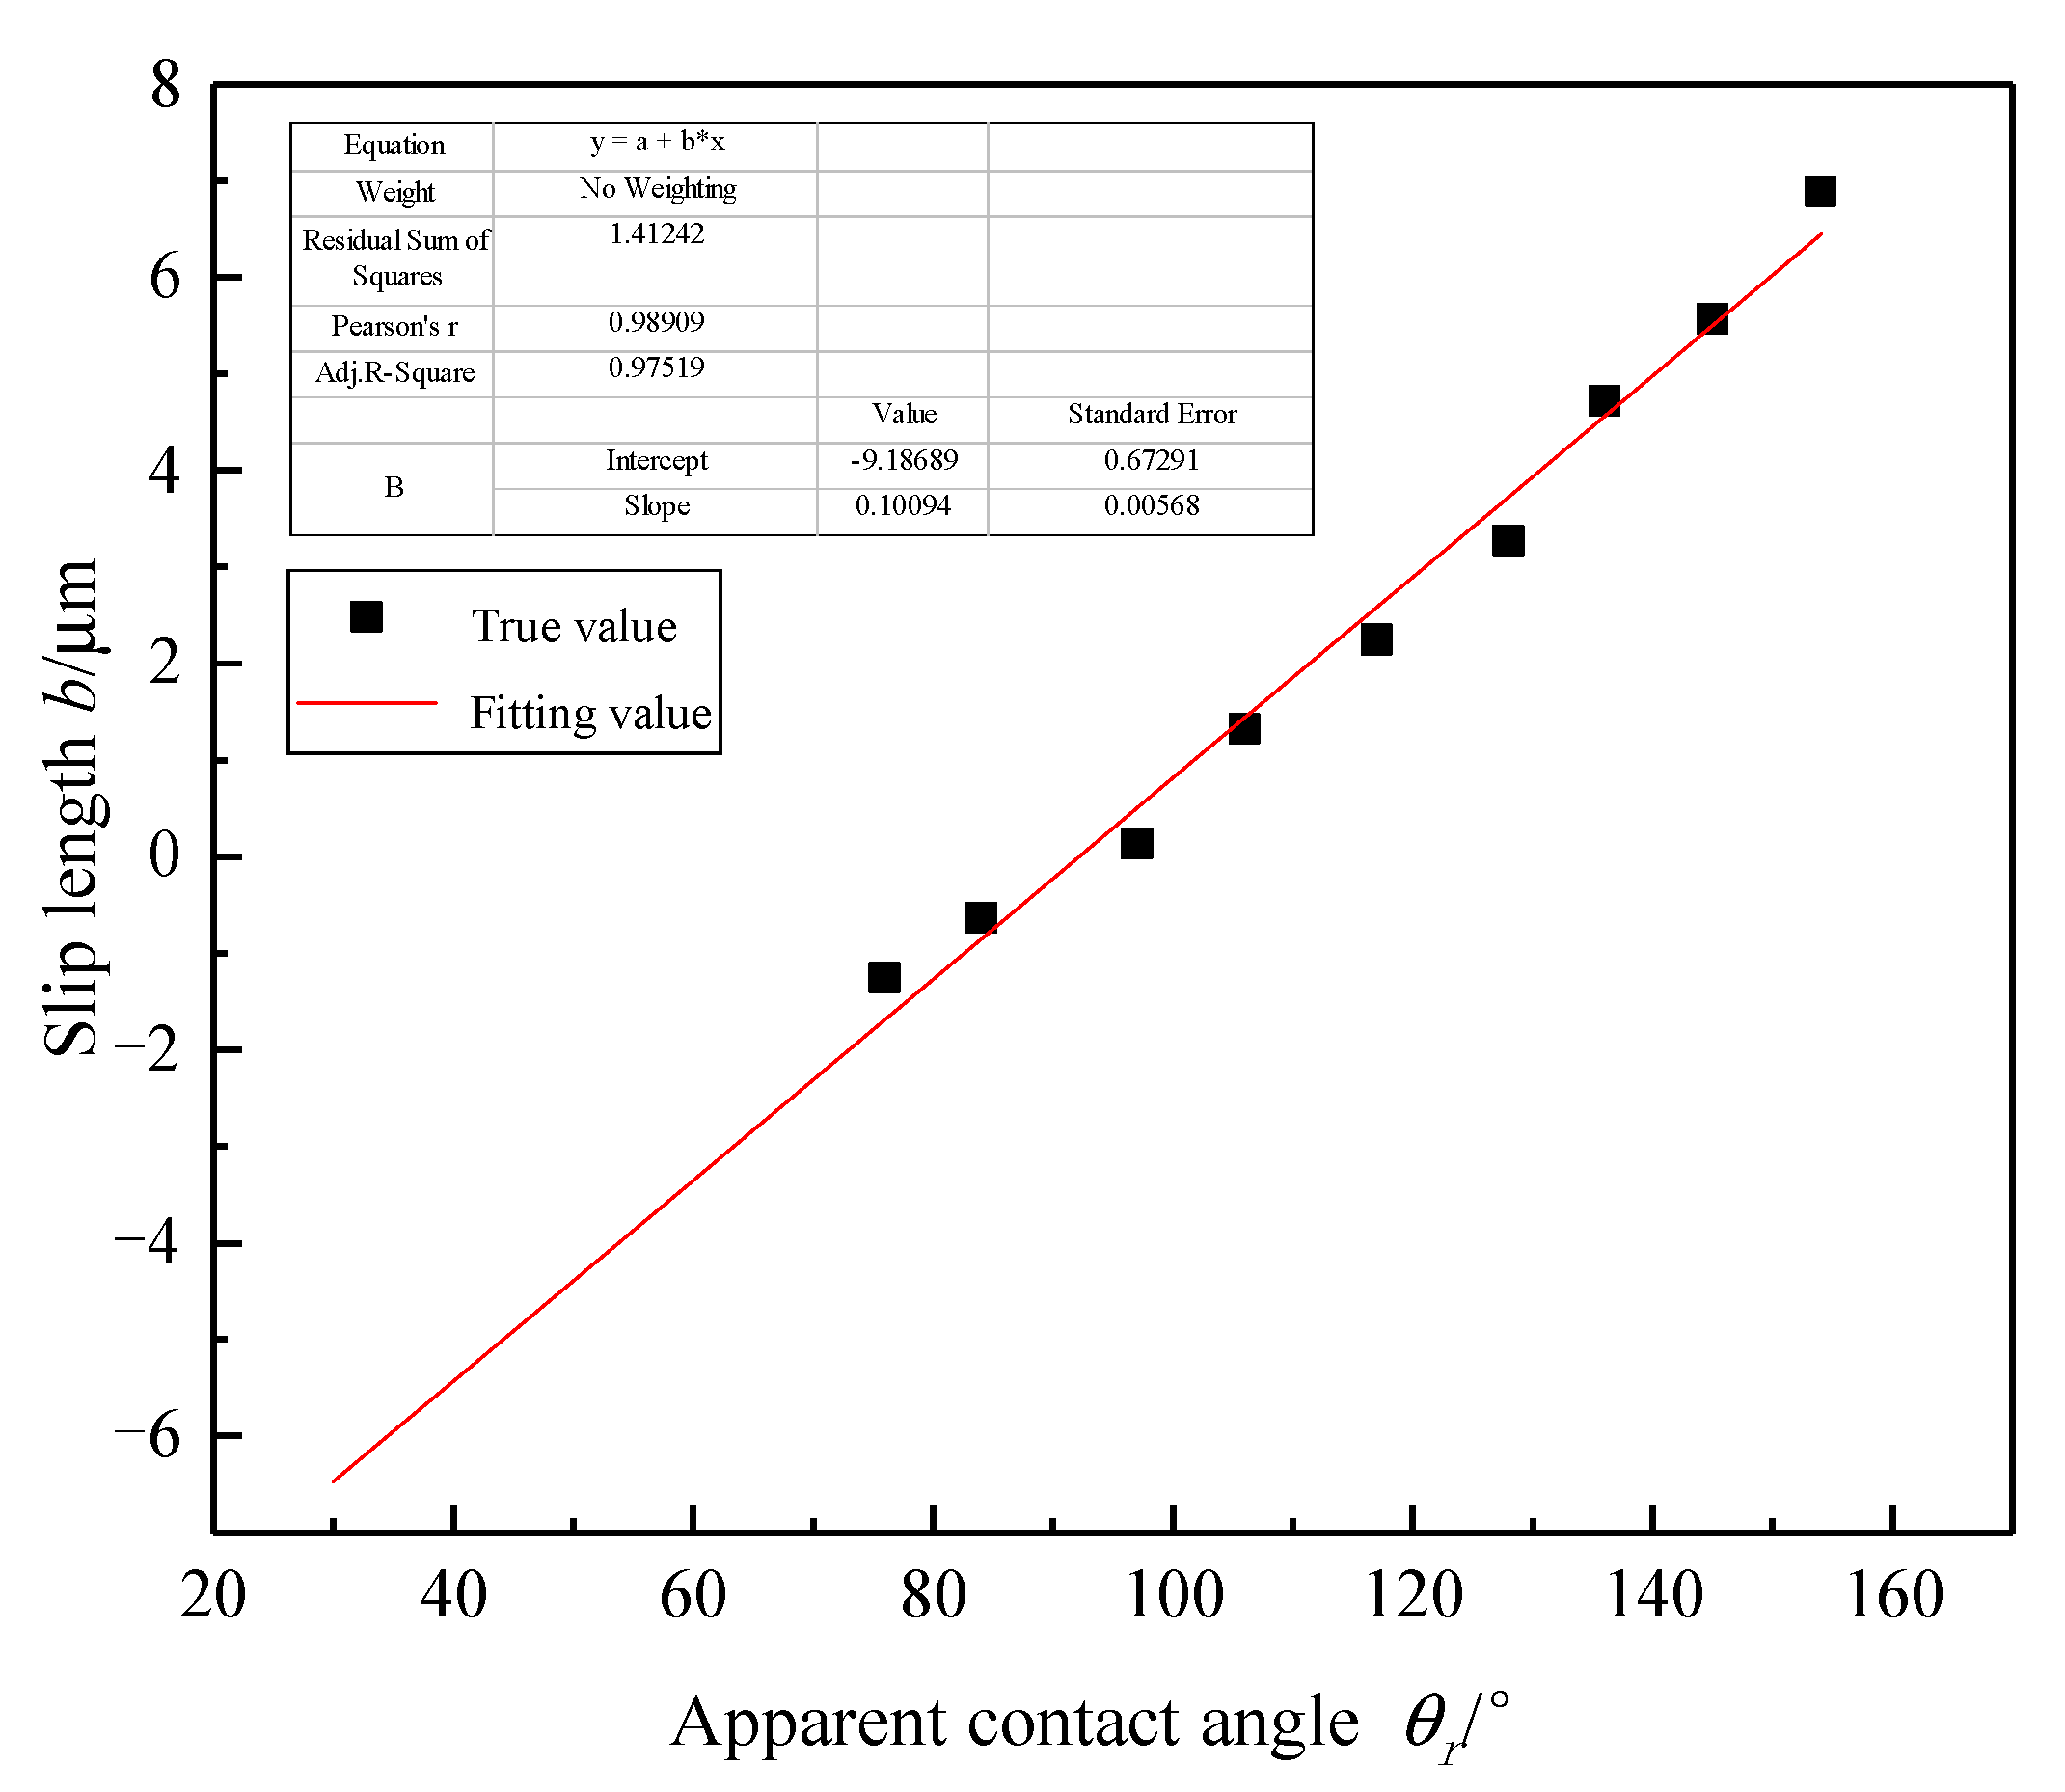
Furthermore, the slip length when the fluid flows through various microchannels calculated according to Equation (9) is shown in
Figure 7. It was determined that the slip length increases with the increase in the apparent contact angle, which is in good agreement with the slip velocity presented in the previous section. In other words, as the groove width gradually increases and the spacing decreases, the ‘Vortex Cushion’ effect and the additional pushing effect caused by the low-speed vortex formed by air within the groove. Furthermore, the drag reduction effect caused by reducing the solid–liquid direct contact area, gradually increase. Thus, the slip length also becomes longer. Particularly, as shown in the figure, when the apparent contact angle is approximately 70°, the negative slip length appears. This can be explained as follows: when the slip length was calculated via Equation (9), and the microchannel width remains unchanged for 2
h. In this case, the slip length was only related to the slip flow
Qslip and the slip pressure drop Δ
pslip. While the apparent contact angle was small, the positive slip phenomenon was not obvious and the corresponding
Qslip was relatively small. At the same time, the slip pressure drop Δ
pslip was relatively large; therefore, the slip length was negative
The relationship between the slip length
b and the apparent contact angle
θr can be expressed using the following equation, which was obtained through fitting:
3. Theoretical Analysis of the Influence of the Surface Slip on the Fluid Flow Characteristics
Since the microchannel fluid flow at the interface of contact mechanical seals is the Poiseuille flow driven by pressure, it was assumed that the microchannel lower surface is a sliding surface. Furthermore, the sliding velocity generated by the fluid when flowing through the sliding surface was defined as
us. Next, the driving force generated by the pressure drop in this process was used to overcome the friction resistance caused by the wall. Thus, the distribution of fluid velocity can be written as follows:
In the earlier equation, represents the pressure gradient along the flow direction, where h is half of the channel width.
Moreover, according to the Nervier slip equation:
where
is the wall shear stress.
By substituting Equation (5) into Equation (4), the following expression is obtained:
Furthermore, the average fluid velocity in the slip channel can now be expressed as:
For channels without the slip surface, the average fluid velocity can be expressed as follows:
By dividing Equation (14) by Equation (15), we obtain the following:
When the pressure in the channel was constant,
, under the same driving pressure, the average velocity of fluid flowing through the channel with the sliding surface was higher. Considering the influence of the slip within the slip channel on the average velocity from the leakage rate perspective, the influence factor
α was defined. The factor can be obtained as follows:
It is evident from Equation (17) that when the channel width
h remains constant and the slip distance is
b > 0, the influence factor value is
α > 1. This shows that the solid wall has an important role in reducing the resistance; the effect becomes more obvious with the increase in the slip distance. Moreover, when the slip distance is
b < 0, the influence factor value is
α < 1, showing that the solid wall increases the resistance. The effect becomes more prominent with the decrease in the slip distance. By dividing Equation (10) by Equation (17) and taking the value of
h as 50, we obtain the following:
The influence factor
α values obtained for various apparent contact angles calculated according to Equation (14) are given in
Table 2.
4. Establishment and Analysis of the Leakage Rate Model Considering the Influence of Surface Wettability
The dynamic and static ring surfaces of the contact mechanical seal look smooth; however, there is a large number of micro bumps and pits of various sizes and shapes. Since contact mechanical seals generally operate in the mixed lubrication state during the start-up, stop, and operation, micro protrusions between the two surfaces will be in direct contact. Similarly, other parts form pores and are partially connected, forming leakage channels. This confirms that the mechanical seal interface is in a porous medium state, during which the solid entities and pores coexist. Furthermore, interface pores are connected in varying degrees. Next, considering the end surface morphology and the random contact characteristics, the research can be carried out by simplifying the dynamic sealing interface, representing it as a static geometric model of porous media, both statistically and by adopting the relevant theoretical background.
According to the research carried out by Ni et al. [
25] and based on the porous media and the fractal theories, the leakage rate model of contact mechanical seals interface can be written as:
There are seven parameters in Equation (19), each having a clear physical meaning, without any empirical constants. In this equation,
μ is the hydrodynamic viscosity, Δ
P is the differential pressure driving force,
Df represents the fractal pore area dimension,
DT is the fractal tortuosity dimension,
λmax is the maximum pore diameter,
L0 is the representative channel length, and
A is the pore cross-sectional area. The remaining porous media parameters can be obtained from the interface data of the real contact mechanical seal [
25]. Finally, the model validity is verified in [
25].
Based on the above-presented research, when considering the surface wettability influence, the leakage rate model of contact mechanical seals interface can be expressed as:
The effect of the apparent contact angle on the leakage rate under different contact pressures is provided in
Figure 8. By selecting the water as the sealing medium, the dynamic fluid viscosity was
μ = 1.005 × 10
−3 Pa·s. The calculation method for finding the sealing interface size and related parameters is provided in [
25]. It was observed that, under a certain apparent contact angle, the leakage rate decreases with the increase in the contact pressure. This phenomenon can be interpreted as: with the increase in the external load, the surface roughness peak is crushed, gradually filling the pores, blocking the leakage channel, and thus reducing the leakage rate. It was also found that, when the contact pressure is constant, the leakage rate increases with the increase in the apparent contact angle. When the apparent contact angle is small, the solid surface is hydrophilic and adsorbed on the fluid flowing through the surface. However, as the apparent contact angle increases, the solid surface gradually becomes hydrophobic. In this process, the adsorption effect of the hydrophilic surface on the fluid gradually decreases, slowly changing into the repulsion effect of the hydrophobic surface on fluid. Finally, the drag-increasing effect brought by the adsorption also changes into the drag-reducing effect instigated by repulsion. This is equivalent to increasing the effective diameter of the fluid leakage channel to gradually increase the leakage rate. This is the same as the conclusion obtained in reference [
30].
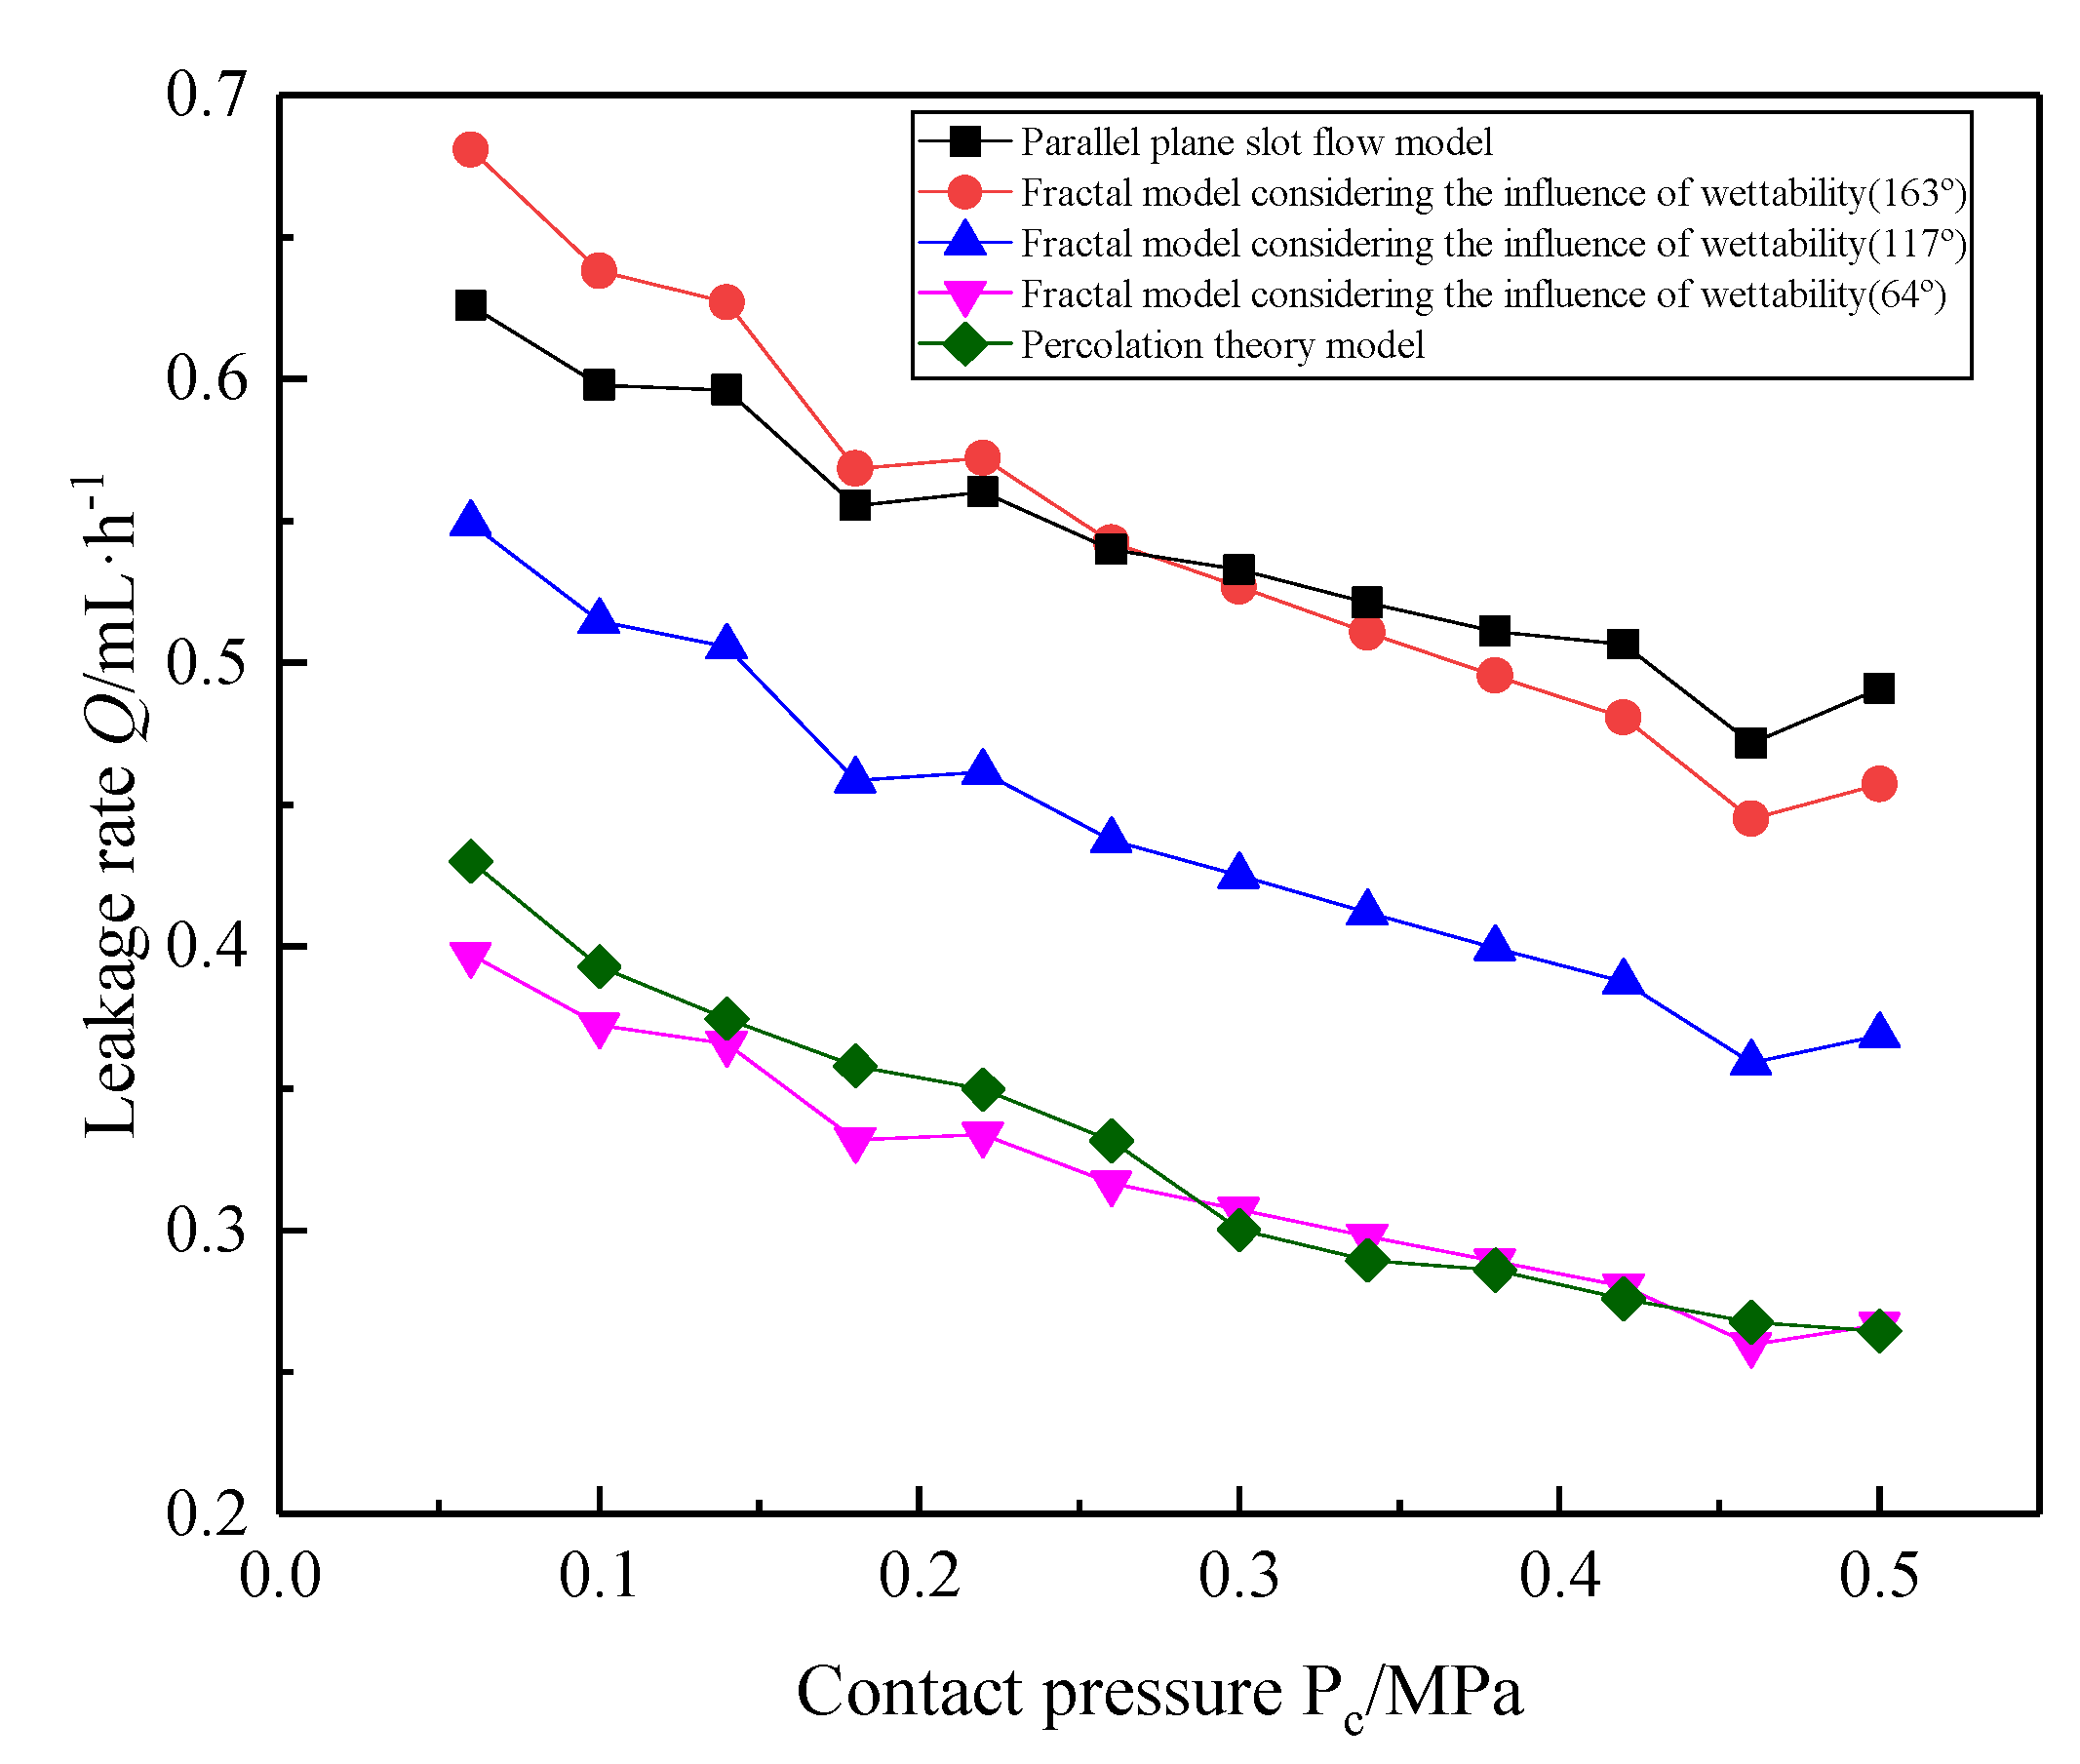
The calculation results were compared to the parallel plane slot flow model and the percolation theoretical model to illustrate the feasibility of the proposed model for the calculation of the leakage rate in contact mechanical seals. The comparison of leakage rate calculation results for three models is shown in
Figure 9. It can be seen that the leakage rate calculated by each of the three models decreases with the increase in the contact pressure, which is in agreement with the realistic case. It was also found that the leakage rate calculated by the parallel plane slot flow model was similar to that calculated by the contact mechanical seal leakage model considering surface wettability for the contact angle of 163°. On the other hand, the leakage rate calculated by the percolation theoretical model was similar to that calculated by the contact mechanical seal leakage model considering surface wettability for the contact angle of 64°. However, for the conventional contact mechanical seal face materials, the apparent contact angle is generally approximately 110°. Therefore, in the leakage rate calculation, the model established by considering the surface wettability influence provided more realistic results.
According to the experimental results, the apparent contact angle of the static ring surface made of carbon graphite was 106°, with the corresponding influence factor
α = 1.084. The leakage rate was calculated and compared to the leakage rate when the surface wettability was not considered for the influence factor
α = 1. The variation curves of the differences Δ
Q between the two with the contact pressure are shown in
Figure 10. When the contact pressure was 0.25 MPa, Δ
Q was 0.032 mL·h
−1, while the relative error was roughly 8%. With the gradual decrease in the contact pressure, Δ
Q gradually increased, making the surface wettability effect more prominent. In other words, it is necessary to consider the influence of surface wettability when calculating the leakage rate of contact mechanical seals as it improves the calculation accuracy, especially when the contact pressure is small.
Additionally, regarding the influence of different wettability walls on the fluid flow resistance, the apparent contact angle of the sealing face material should be reduced as much as possible. This is to increase the fluid flow resistance on the sealing face, aiming to both reduce the leakage rate and obtain a better sealing effect.
5. Conclusions
Based on the theoretical model for calculating the leakage rate of the sealing end face of the modified Hagen–Poiseulle equation and with the help of the boundary slip theory, the relationship between the slip length and leakage rate and the surface apparent contact angle was analyzed, and the leakage model of the contact mechanical seal considering the surface wettability was established. By comparing leakage rates to those calculated by other models, the presented calculation was clarified and confirmed. The results have shown that, for a certain apparent contact angle, the leakage rate decreases with the increase of the contact pressure. Furthermore, for a given contact pressure, the leakage rate increased with the increase in the apparent contact angle, especially when the contact pressure was small. However, the influence of surface wettability was more significant, and the apparent contact angle of the sealing face should be reduced to reduce the leakage rate.
Lastly, the current research still stays in the leakage research of static contact mechanical seals. In the next step, the dynamic randomness of contact mechanical seals needs to be considered, and based on the results, the purpose of controlling the flow and reducing the leakage by changing the surface wettability of microchannels in the mechanical seal structure will be achieved.


