Article

Functional Thin Films Synthesized from Liquid Precursors by Combining Mist Chambers and Atmospheric-Pressure Plasma Polymerization

Junior Research Group Biosensing Surfaces, Leibniz Institute for Plasma Science and Technology, 17489 Greifswald, Germany
*
Author to whom correspondence should be addressed.
Current address: Research Group Nanobiotechnology, Central European Institute of Technology (CEITEC), Masaryk University, 625 00 Brno, Czech Republic.
Coatings 2021, 11(11), 1336; https://doi.org/10.3390/coatings11111336
Submission received: 4 October 2021 / Revised: 27 October 2021 / Accepted: 27 October 2021 / Published: 30 October 2021
(This article belongs to the Special Issue Plasma Processing and Thin Films Formation Applications)

Abstract

:
For the creation of thin films, the use of precursors in liquid phase offers a viable alternative when these chemicals are sensitive to high temperatures and phase changes. However, it requires appropriate liquid handling and deposition technologies capable of dispensing the fluid homogeneously to produce a uniform thin film. We report different tailor-made mist chamber designs integrated in an atmospheric-pressure plasma polymerization process for the synthesis of functional thin polymer films from liquid precursors. A systematic investigation, evaluated by performance indicators, is presented on the characteristics and suitability of metallic 3D-printed mist chambers depending on inner volume, geometry and surface post-treatment, for the deposition of a thin liquid monomer film. To assess the quality of the subsequently obtained plasma-polymerized (pp) films, their properties were characterized in terms of thickness, chemical composition, surface morphology and stability in aqueous environment. It was found that the specification of the mist chambers along with the plasma process parameters influences the pp film’s thickness, surface morphology and degree of monomer conversion. This study is one of the first demonstrations of a controllable process able to tune the cross-linked polymeric chains of plasma-polymers at atmospheric pressure, highlighting the opportunities of using mist chambers and plasma technology to discover tailored organic thin films to materials sciences and life sciences.

Graphical Abstract

1. Introduction

Thin plasma-polymerized (pp) films are used to improve the chemical and/or mechanical surface properties without changing the bulk of the material [1,2]. The films characteristics depend on the deposition technique and process parameters, which are usually chosen in function of the film properties to achieve, application and industrial scalability [1,3,4]. The use of physical plasmas for surface engineering, in particular thin film deposition, has increased, either as a stand-alone technology or in hybrid setups [1,4,5,6]. Plasma polymerization is a method to generate thin inorganic or organic layers, whose physio-chemical properties can be tailored by controlling plasma–chemical reactions and plasma–surface interactions [4,7]. The recent upraise in the use of atmospheric-pressure plasmas due to the ease of processing, avoidance of vacuum equipment, and the possibility of localized and large area deposition, has significantly contributed towards cutting-edge thin film fabrication, particularly for polymer coatings [8,9]. Conventionally, the precursor monomer used for the synthesis of pp films is in the gaseous or liquid phase [4,6,8,9,10]. In either case, the precursor is introduced into the gas discharge for the polymerization and direct deposition on the substrate. In recent studies, the precursor monomer is not introduced into the plasma, but deposited on the substrate and subsequently polymerized by atmospheric pressure plasmas [11,12,13,14,15]. Compared to gas-phase processes, liquid processes require a liquid handling technology to dispense the fluid homogeneously on the substrate. For this purpose, different approaches are described in the literature: 1. Spin coating, where a flat substrate covered with a liquid is spun at a high velocity to centrifugally spread the solution over the substrate [16], 2. Dip coating, where the substrate is completely submerged in the solution [16], 3. Single droplet deposition in the sub-microliter range by using automated pipetting systems [17,18], and 4. Electrospray for the formation and deposition of atomized precursor droplets across an electric filed [19]. However, all methods described have disadvantages in terms of restrictions in the substrates geometry or limitation in the application if the substrate to be coated provides a certain surface microstructure or cavities. On the contrary, spray deposition permits an easy deposition of almost insoluble and non-evaporative liquids on any substrate material. Furthermore, it allows for combining processing technologies like plasma polymerization, making it a promising approach for an environmentally friendly coating technology, as the process optimization may admit the use of suitable precursor monomers.
Spray chambers are widely used especially in inductively-couple plasma spectrometry (ICP-S), as part of the sample injection system to identify and determine trace elements in liquid samples, but they also have the potential for use in other applications, such as deposition of precursor monomers on solid substrates. The ICP-S sample introduction system is based on a nebulizer and spray chamber, which introduces an aerosol of fine droplets directly into the excitation/ionization source [20,21,22]. In the present work, the underlying principle of these spray chambers was adopted to develop a new design of a so-called mist chamber, for the deposition of small droplets on solid surfaces for the synthesis of thin plasma-polymerized films. Not only the design was modified according to the need that the misted aerosol has to be deposited perpendicular to the substrate, but also the material used for the fabrication of mist chambers. In ICP-S, the material of the spray chamber is often chosen based on the tolerance to the sample matrix, chemical resistance and surface wettability [23,24,25]. Due to the need of designing different mist chambers for the validation of their performance, additive manufacturing (AM) appeared to be a perfect tool to manufacture customized objects in the laboratory. In a previous work, different chamber geometries were studied for their capability to provide a fine mist, whereas the first proof-of-concept showed that it was possible to obtain thin pp films [26]. The cyclonic ICP-S spray chamber geometry, in which the aerosol from the nebulizer is tangentially introduced and first impacts against the front walls to be then transported towards the outlet, has demonstrated to be more efficient than other types of chambers [21,22,24]. As per the previously mentioned study [26], this type of geometry also proved to be the most appropriate for mist chambers for the synthesis of pp films. Considering that cyclonic chambers are recognized as impact wall turbulent deposition devices, then the droplet cut-off diameter (all particles greater than this diameter are collected while all particles smaller than that size pass through [27]) can be adjusted by varying the intersection point and wall proximity [21]. For these reasons, the cyclonic design was used as base for the present optimization of the mist chambers.
We present and demonstrate a novel mist chamber design, integrated in a plasma grafting and plasma polymerization process, for the synthesis of functional thin polymer films. In particular, different mist chamber designs were evaluated using the performance indicators mist-out time (analogous to washout time for ICP-S) and mass of misted monomer, along with the plasma polymerization process and the resulting properties of the pp film. For the latter, physical and chemical characterization was performed for the as-deposited pp films, as well as after 24 h of immersion in water to evaluate their stability. As a result, it was demonstrated that the film thickness, surface morphology and degree of monomer conversion of the pp films can be tailored by using the current process. For these reasons, the synthesized exemplary oxygen-rich, functional polymer films are of particular interest for engineering surfaces applied in biosciences, as a platform for fundamental studies at the cellular level, and in general for thin film research.

2. Materials and Methods

2.1. Chemicals and Materials

The monomers tetrahydrofurfurylmethacrylate (THFMA, C9H14O3) (97% purity, containing 75 ppm hydroquinone (HQ), 900 ppm methylhydroquinone (MEHQ) as stabilizers) and 1,2,4-trivinylcyclohexane (TVC, C6H9(CH=CH2)3) (98%, mixture of isomers), purchased from Sigma-Aldrich (Taufkirchen, Germany), were used in proportion of 1:2 (THFMA:TVC) volume ratio, without any further purification (hereinafter referred as TT12). These particular monomers were chosen based on their intrinsic oxygen content, their capability to be plasma-polymerized and their proven functionality for bioscience-related applications, as explained elsewhere [13,14]. Argon (Ar) with a purity of 99.998% was supplied by Messer SE & Co. KGaA (Taunus, Germany). Single-side polished silicon (Si) wafers and double-side polished single crystal silicon (c-Si) wafers ( 111 , N-type phosphorus doped, resistance 1–5 Ω · cm) were purchased from MicroChemicals (Ulm, Germany) and cut into substrates of 10 mm × 10 mm. Single-side polished Si wafers were used for atomic force microscopy (AFM) and ellipsometric measurements. Double-side polished Si wafers were used for Fourier transformed infrared (FT-IR) spectroscopy studies. Crystals for quartz crystal microbalance (QCM) (10 MHz, blank diameter 14 mm, electrode diameter 6 mm, gold coating) were purchased from Krystaly Hradec Králové a.s. (Hradec Králové, Czech Republic). Substrates and mist chambers were cleaned by sonication in 2-Propanol (Sigma-Aldrich, 99.8%) for 10 min prior to each set of experiments. Ammonium sulfate ((NH4)2SO4), purchased from BASF SE (Ludwigshafen, Germany), was used as electrolyte for plasma electrolytic polishing. Stainless steel 316L metal powder (Fe-Alloy 316L (1.4404)) from SLM Solutions Group AG (Lübeck, Germany) was used for fabricating the mist chambers via selective laser melting.

2.2. Mist Generation

The mist generation can be divided in two stages: nebulization and misting. For the nebulization, a peristaltic pump (LP-BQ50-1J, Longer, Hebei, China, maximum revolutions per minute (rpmmax) = 50, equivalent to a maximum flowrate of 1.42 mL/min with Tygon tubing 1/16 ID×1/8 OD) took the liquid monomer into a quartz concentric nebulizer (Meinhard TQ-30-A1, 1 mL/min Ar, 6 mm OD, bought from ESI Elemental Service & Instruments GmbH, Mainz, Germany), forming an aerosol. For misting, the nebulizer was connected to the mist chamber, which filtered the aerosol to allow only the smallest droplets to exit, producing a fine and uniform mist at the outlet of the chamber, while the biggest droplets were drained away. Misting conditions, controlled via proprietary software, included variations in misting time (1 s, 3 s, 6 s, 10 s, and 15 s) and pumping speed (S, minimum speed: 10% of rpmmax (S10) = 0.11 mL/min, maximum speed: 100% of rpmmax (S100) = 1.42 mL/min; see Figure S1 for experimental “Flowrate vs. % rpm” curve).

2.3. Plasma-Induced Synthesis of pp Films

Plasma-induced polymerization was performed with a radio frequency-driven atmospheric-pressure plasma jet, described elsewhere [28]. The plasma jet was operated at an input power of 5 W, Ar flow rate Q(Ar) = 1 slm, and a distance of 5 mm from nozzle outlet to substrate. The plasma-based synthesis of pp films comprises three steps, as shown in Figure 1. The plasma-induced polymerization time was 16 s for the deposition on single-side polished Si wafers and QCM crystals, while for double-side polished Si wafers 8 s, 16 s, 24 s and 32 s were used.

2.4. Design and Manufacturing of the Mist Chambers

The mist chambers were designed using computer aided design (CAD) with the program Autodesk Inventor Professional 2017 (California, United States of America). The 3D design files were post-processed with the slicing software Materialise Magics (version 21.1, 2017, Materialise, Leuven, Belgium). The metallic mist chambers were constructed using additive manufacturing (commonly referred as 3D-printing), by means of selective laser melting (SLM). The machine SLM 280 was employed with 316L stainless steel powder, both from SLM Solutions Group AG (Lübeck, Germany), using a layer thickness of 30 μ m for printing. When designing, the chambers were divided into two parts, anticipating that they would not need supports on the inside during 3D-printing, to ensure uniformity of the surface in contact with the mist. For post-processing of the chambers after 3D printing, outer supports were removed and the parts were grit-blasted with glass beads (inner and outer surfaces) to ensure removal of residual powder and debris from the printing process. The surface quality of 3D-printed samples was studied before and after plasma electrolytic polishing on especially manufactured specimens (dimensions: 33 mm × 10 mm × 2 mm, Figure S2), following the previous described procedure (printed without supports).

2.5. Plasma-Electrolytic Polishing

Plasma electrolytic polishing (PEP) was employed to smoothen and to clean the surface of the 3D-printed metallic mist chambers using the equipment described elsewhere [29]. Each part (half of a chamber) was anodically polarized (U = 320 V) and was immersed in a cathodic bath filled with an aqueous electrolyte of ammonium sulfate ((NH4)2SO4). The temperature and concentration of the electrolyte were 80 C and 5 wt%, respectively. In order to compensate the geometrical inhomogeneity, each part was plasma-polished four times for 7.5 min by sequentially rotating 90 every time—as shown in Figure 2—thus, the total treatment time for each chamber part was 30 min. After the PEP process, the parts were cleaned in distilled water to remove residual electrolyte.

2.6. Quartz Crystal Microbalance

A customized quartz crystal microbalance (QCM) setup based on OpenQCM system (openQCM Software version 1.2, Novaetech S.r.l, Pompeii, Italy) was used for measuring the mass of the pp film as-deposited and after immersion in water, as well as the mass of the misted liquid monomer mixture, following Sauerbrey’s formula [30] (see Section 2 in Supplemental information). For measuring the mass changes of pp-films deposited on crystals (following the plasma-induced synthesis indicated in Section 2.3), experiments were conducted at different misting conditions, involving changes in pumping speed (percentage of rpmmax, represented as S%) and misting time (in seconds). Hereafter, these conditions are indicated in the format S%—x s. Quantitative data were obtained from two QCM crystals for each condition and chamber (n = 2). The mass of the misted liquid was quantified by coupling the mist chamber’s outlet directly to an enclosure containing a quartz crystal (Figure 3). The mist emitted from the chamber was measured instantaneously and plotted as a Δf vs. time curve (see Figure S5A). Prior to each measurement, the nebulizer was primed with the monomer. Afterwards, the QCM was started and due time was permitted for the signal to stabilize and to have a reliable zero-point, corresponding to the fundamental resonant frequency of the crystal (f0), while always letting the Ar flow (at the nebulizer) run (dry run of the chamber). The nebulizer’s pump was then initiated (50% of rpmmax, S50) and the aerosol was generated inside the mist chamber. The aerosol swept the chamber and the smallest particles were transported towards the outlet, while the larger particles were drained away. The QCM was stopped when the resonance peak was reached, which in all cases plateaus for 3 s before decreasing again. The nebulizer’s pump was turned off and the chamber ran dry for a few minutes while the QCM crystal was replaced to start a new measurement. For every polished chamber, up to 7 measurements were conducted, while for the non-polished ones, one to two measurements were performed. Although collected for longer time, data used for the calculations was considered with an offset of two seconds before nebulization (0 to 2 s at f0), to the peak oscillation including the 3 s plateau. The acquired Δf vs. time curves were converted to Δm vs. time curves (Figure S5B) using Sauerbrey’s formula [30], to obtain the performance indicators of mist-out time (Tmist) and misted mass transport rate (Wtot). Tmist was determined at the X value (T, time) of 1% fall from the given Y value of the mass peak (Δmpeak) and the respective subtraction of the time interval the before nebulization starts (TΔm0, corresponding to 2 s), as shown in Equation (1):
T m i s t = T Δ m p e a k 1 × T Δ m p e a k 100 T Δ m 0
T m i s t = T Δ m p e a k T Δ m p e a k 100 2
For Wtot, the calculation was made considering mass peak value and its corresponding time, minus the respective values of no mist (Equation (2)).
W tot = Δ m p e a k Δ m 0 T Δ m p e a k T Δ m 0
W tot = Δ m p e a k T Δ m p e a k 2

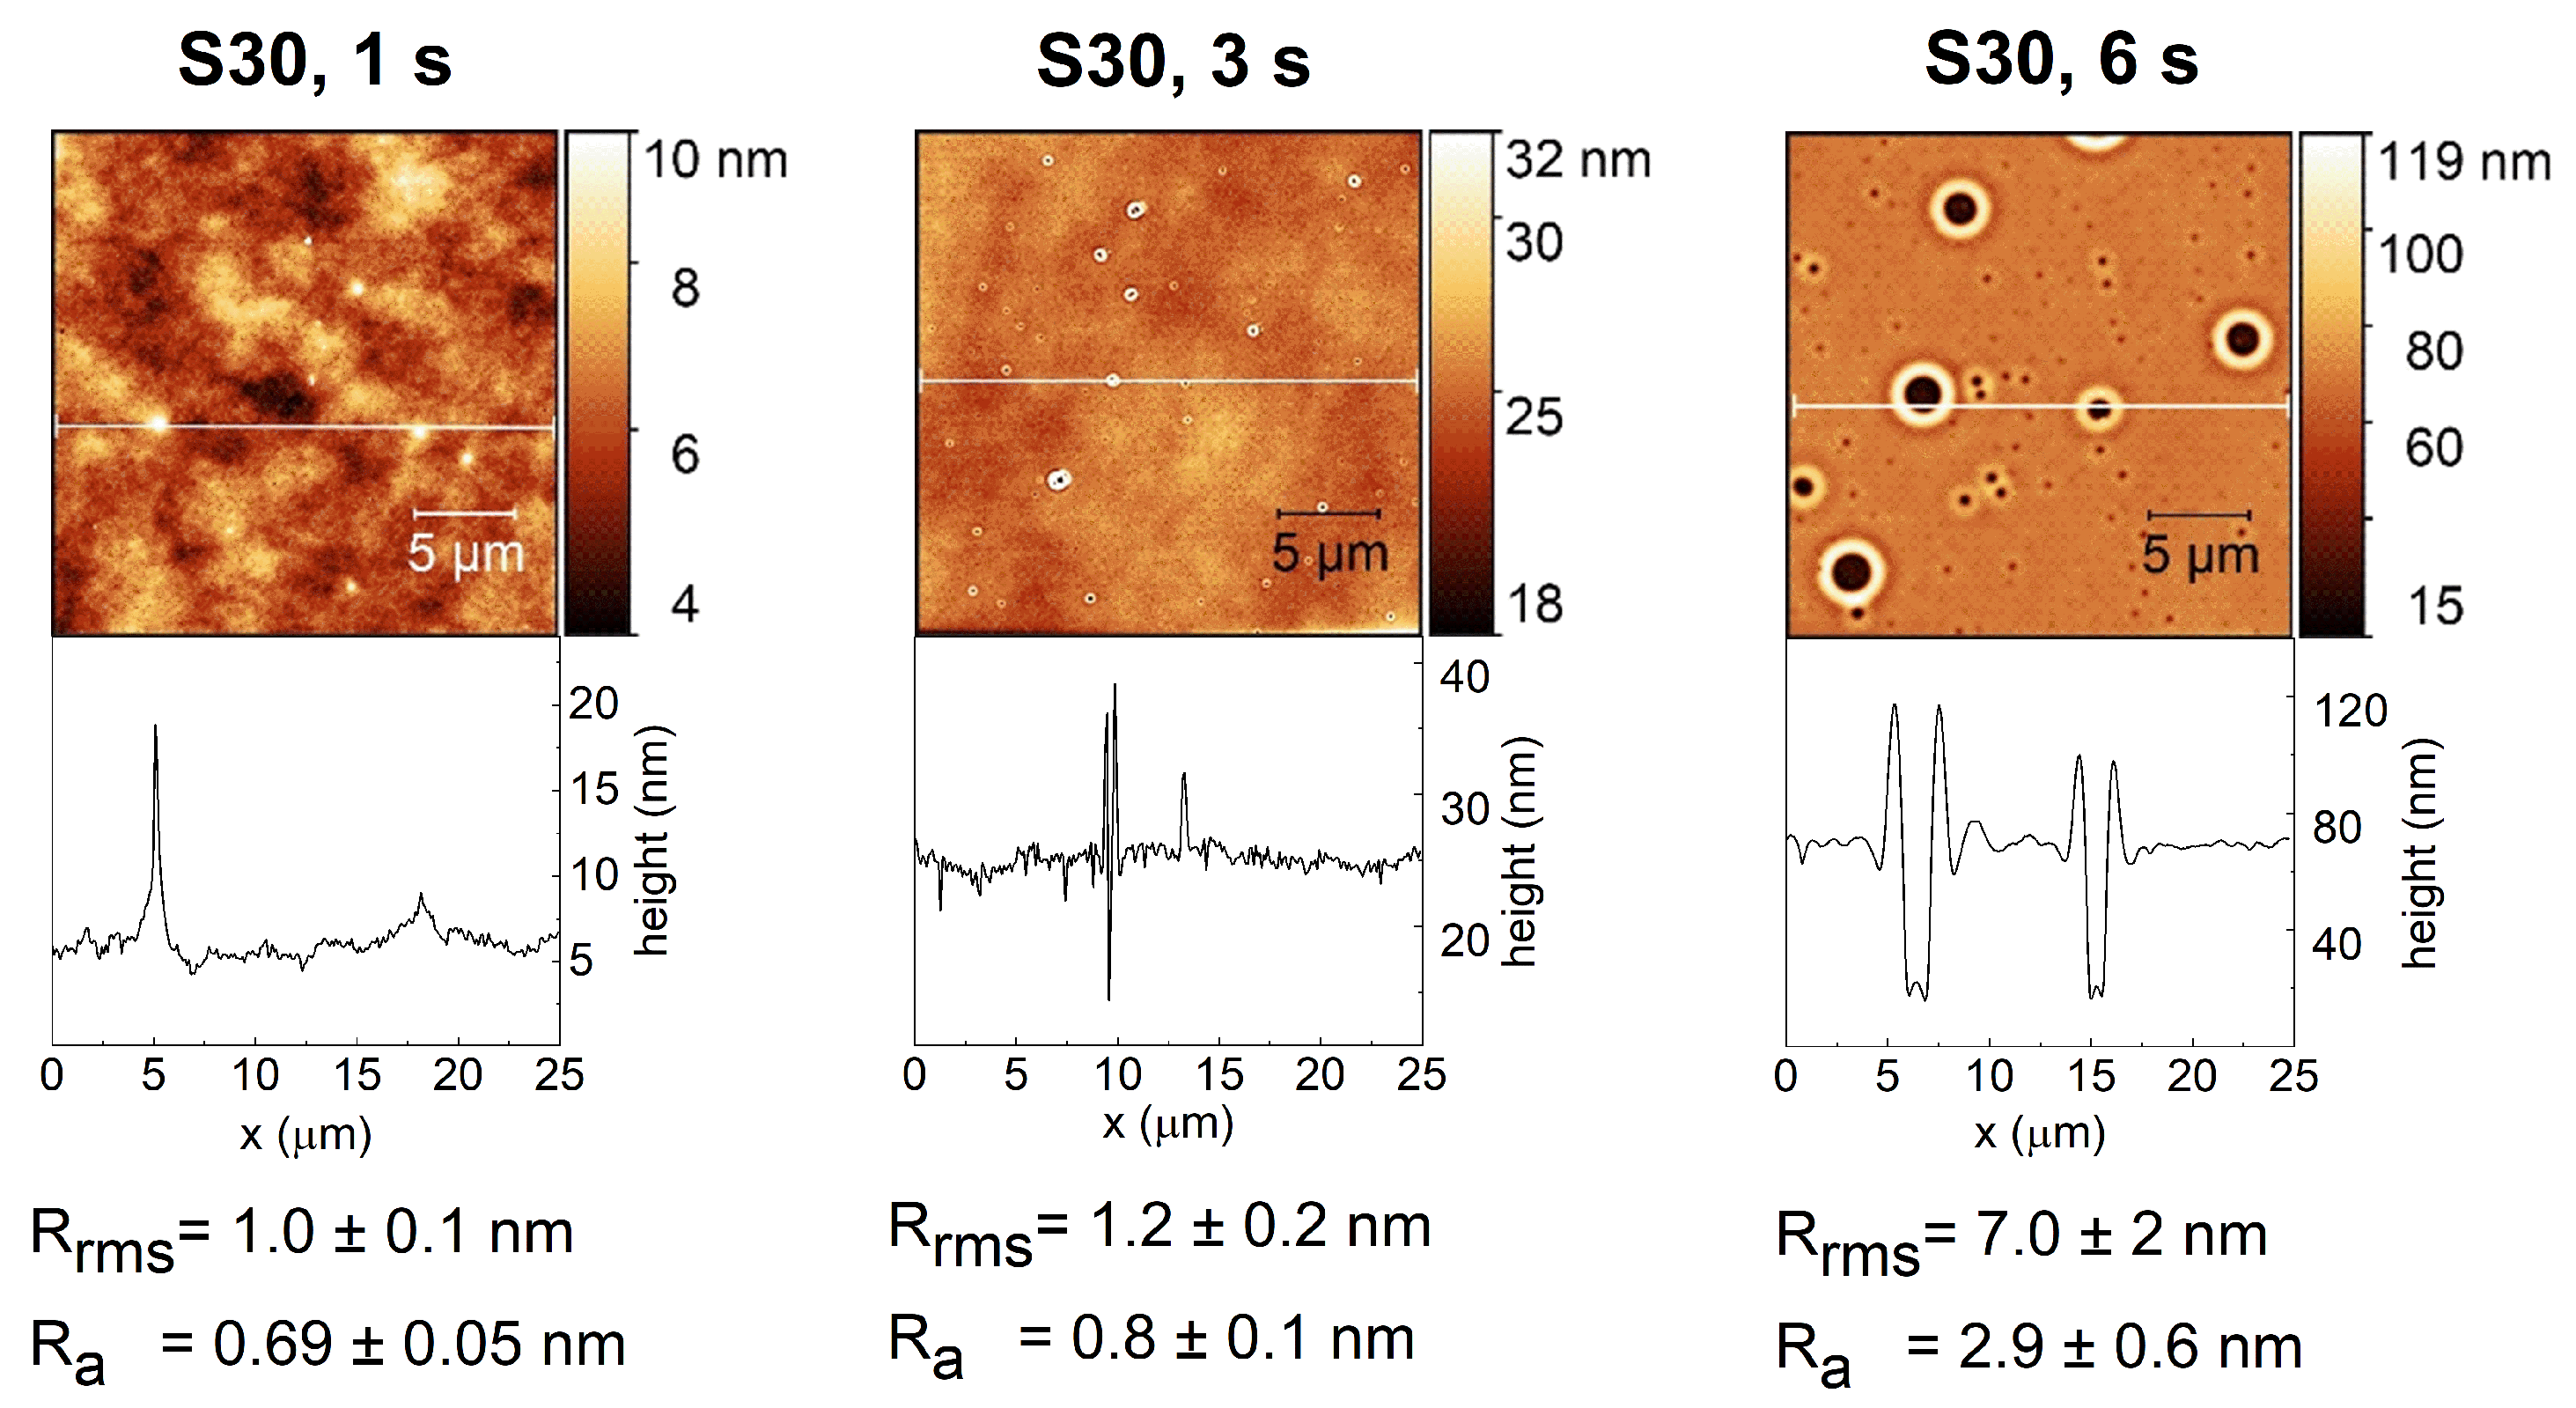
2.7. Atomic Force Microscopy

Morphology and roughness of the pp films was analyzed as-deposited and after 24 h of immersion in deionized water by using AFM (CoreAFM system, Nanosurf AG, Liestal, Switzerland). pp films stored in water for 24 h were dried with compressed air and left in contact with air for 24 h before AFM analysis. AFM imaging was conducted in non-contact mode, using a 190Al-G tip with a spring constant of 48 N/m. The acquired data were evaluated using GWYDDION software (version 2.55, 2019, open source supported by Department of Nanometrology, Czech Metrology Institute, Brno, Czech Republic). The surface roughness of the pp films were determined by acquiring three AFM images (25 μ m × 25 μ m) on three replicates (n = 9) for each pp film studied.

2.8. Ellipsometry

For the determination of the thickness of the pp films, ellipsometric data were measured using a J.A. Woollam Co. M-2000V (Lincoln, NE, USA) ellipsometer at incidence angles of 55 , 65 , and 75 . The Cauchy model, including film non-uniformity and roughness, was utilized to fit the optical data obtained for the as-deposited films and for the films after storage in water, using CompleteEASE software (version 5.01, 2013, J.A. Woollam Co., Lincoln, NE, USA). The agreement between the data and the fit was achieved for all the studied films. The pp films stored for 24 h in water were carefully dried in a stream of air and left for 24 h in air prior to the measurements. Quantitative data on pp films’ thickness changes were obtained from CompleteEASE software by conducting three measurements on each pp film (n = 3).

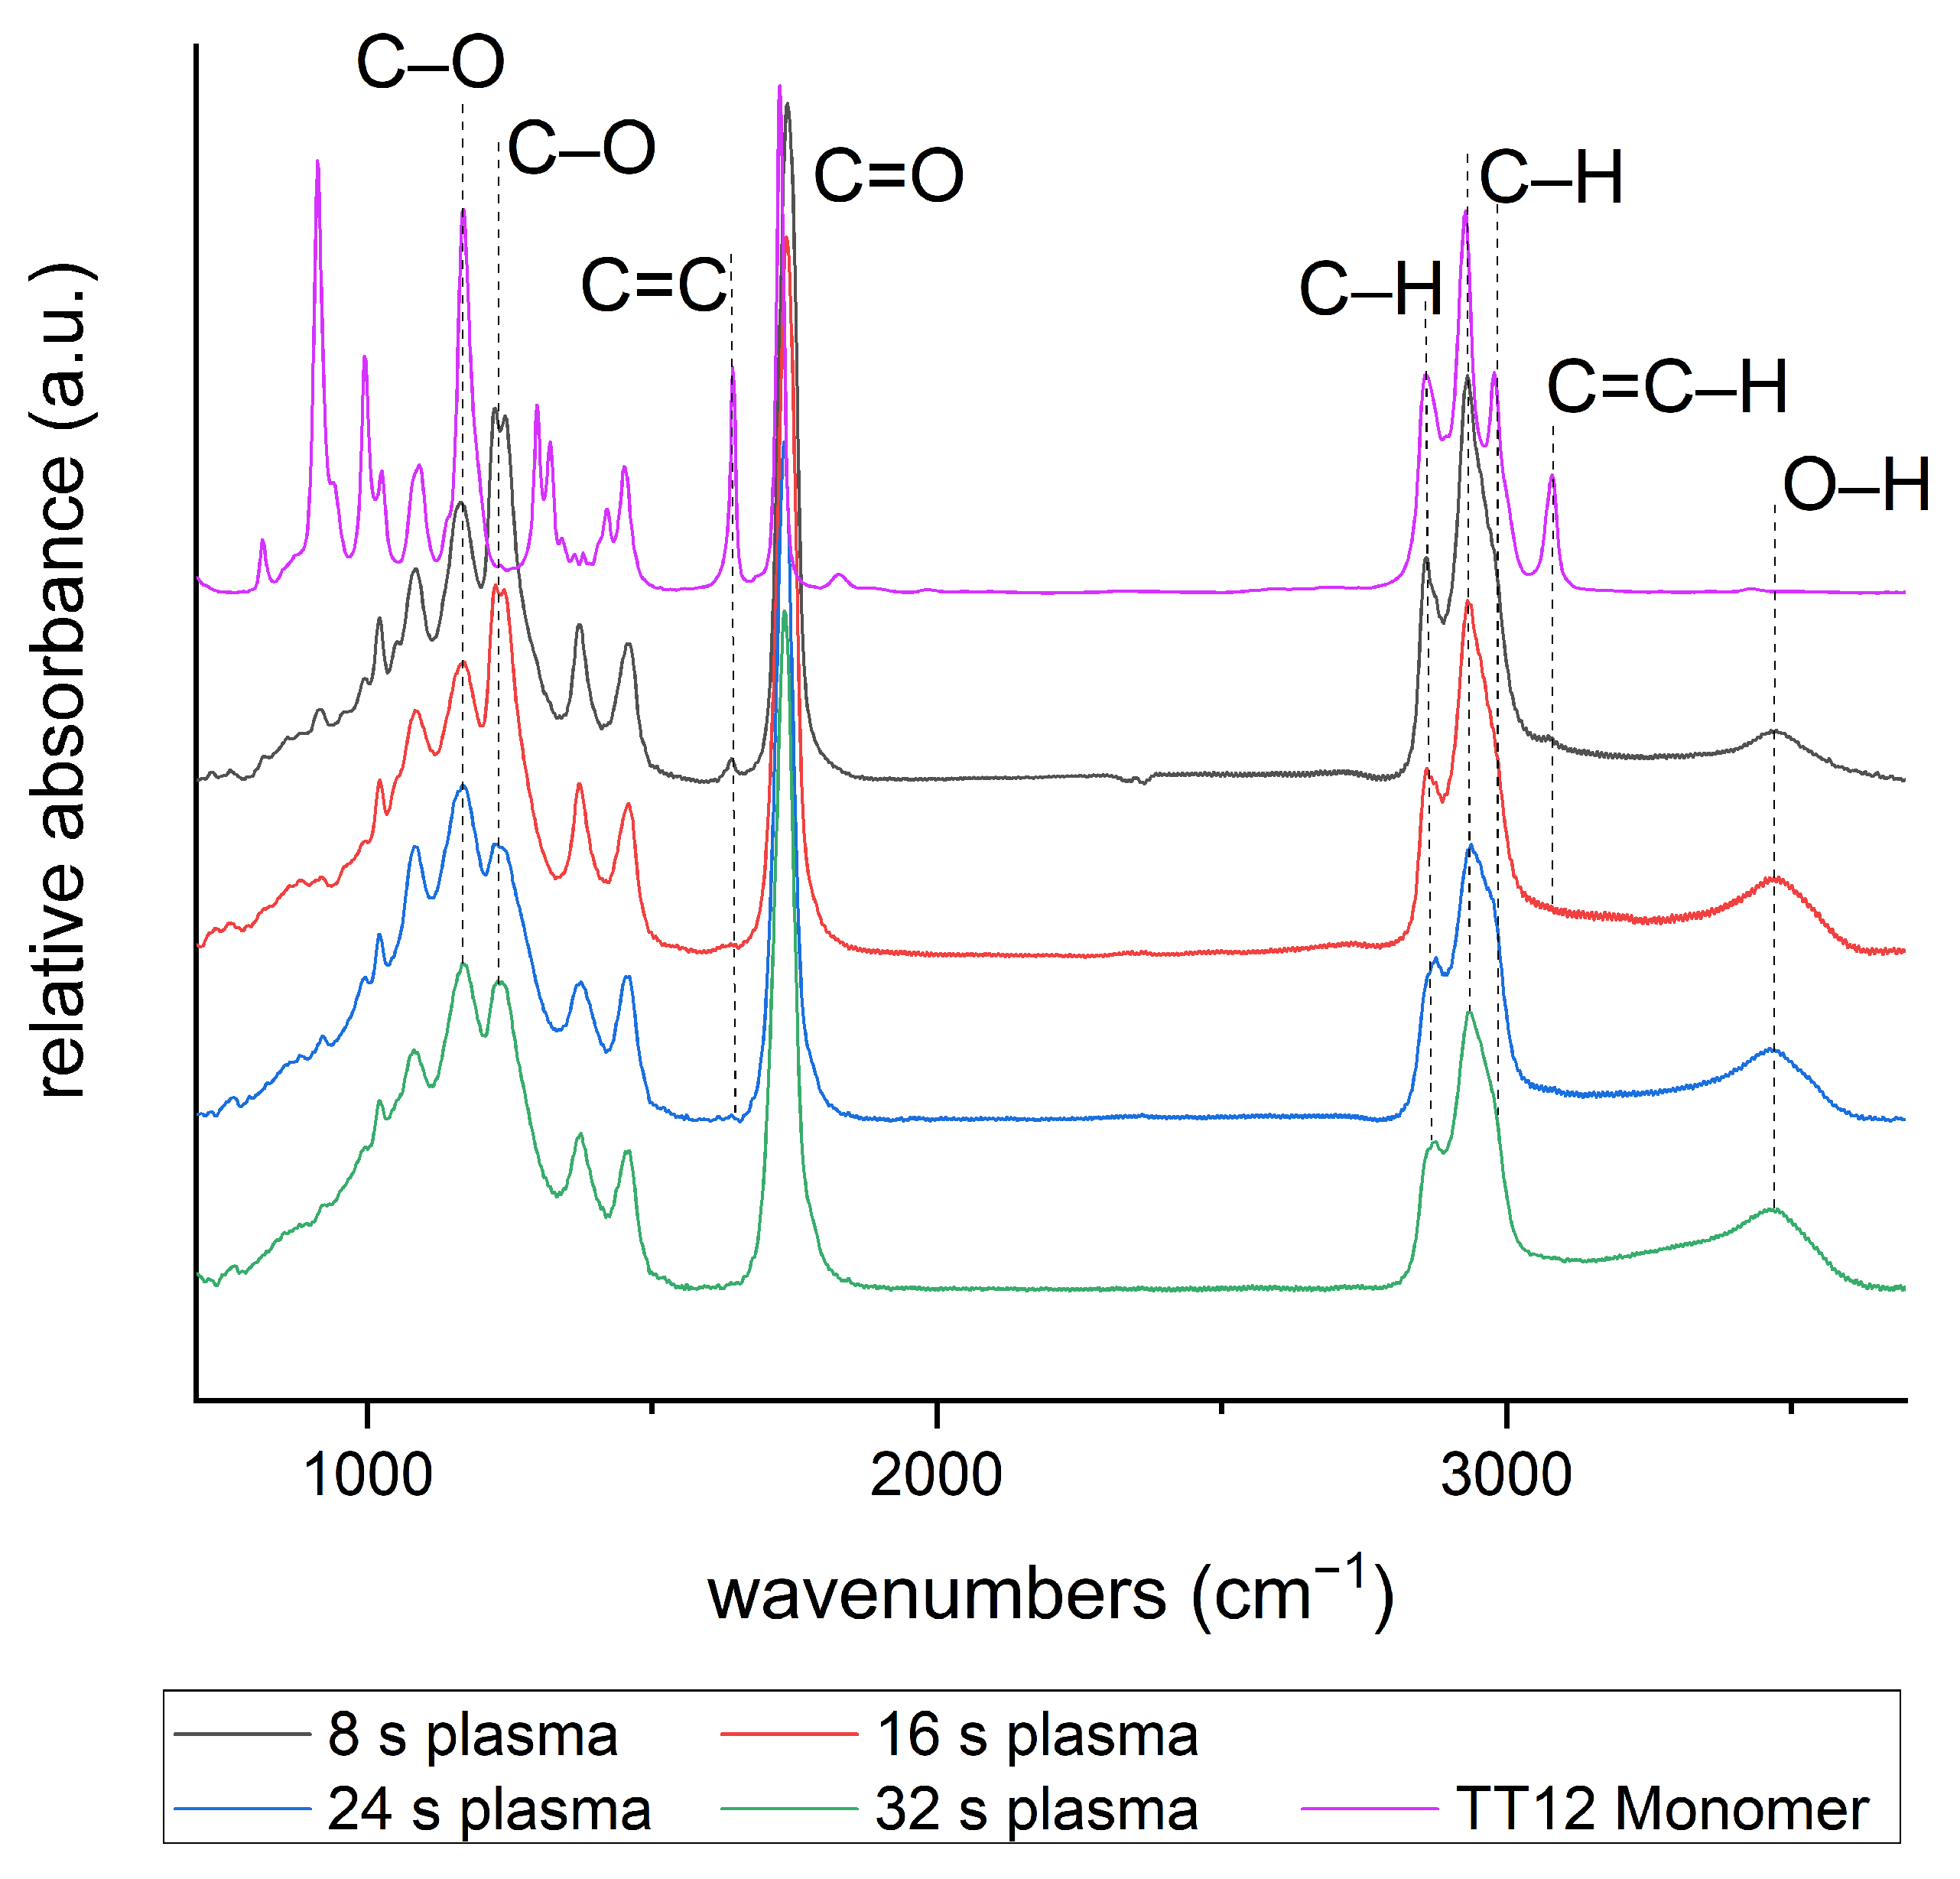
2.9. FT-IR Spectroscopy

FT-IR analysis of the pp films was performed with a Bruker Vertex 80 v spectrometer (Leipzig, Germany). The data were collected in the transmission mode with a parallel beam transmittance accessory in the middle infrared spectral range (400–4000 cm−1). The measurements were collected at a pressure of 2.5 HPa, with the resolution of 4 cm−1 and 500 scans. For thin film analysis, the absorbance normalized by the films’ thickness was used.

3. Results and Discussion

3.1. Design and Manufacturing of Mist Chambers

An ideal spray or mist chamber should remove all the larger droplets and allow the desired smaller ones to pass, due to the effect of complex processes such as modification of the particle size distribution, reduction of aerosol concentration, modification of the charge equilibrium and reduction of the turbulence associated with the nebulization process, among others [21,25]. These processes determine the fate of the droplets in the chamber: they either follow the flow path of the gas flow from the nebulizer when they are fully entrained (this is the case for small droplets, ≤1 μ m), or they intercept in the walls of the chamber when the gas flow turns, due to their inability to equilibrate their velocities with the gas flow (larger droplets) [25]. According to Sharp [21], the main difficulty when designing a spray chamber is to minimize “the adverse effects of the recirculation that causes unnecessary loss of small particles on the side walls and by collisions in the jet mixing layer”. The innovation of ICP-S spray chambers has largely remained static for decades [21,31] due to the sufficient functionality that they have within the ICP-S sample introduction system. Hence, only a couple of different geometrical variations of chambers are available, whereby the cyclonic geometry (in all of its variations) is nowadays the most popular type. The cyclonic chamber is characterized by its reduced size, in comparison to Scott-type chambers, along with an improved efficiency and faster washout times [21,24,32]. In agreement with the previous study, where the proof-of-concept of tailor-made mist chambers of different shapes were evaluated, the cyclonic design proved to be the best option [26]. This previous design had a diameter (d) of 25 mm, impact wall height (w) of 22 mm, impact length (L) of 17.5 mm and an internal volume of 13.55 mL. Therefore, these dimensions, along with theoretical and empirical insights from ICP-S spray chambers, were the starting point for the presented specifications of the new mist chambers (MC) in this work, shown in Figure 4.
The inner volume of all MC variations was kept below 20 mL due to the fact that spray chambers with inner volume lower than 20 mL provide improved washout times and transport efficiencies [24,25,33]. Further dimensions such as diameter, wall height and impact length, which influence the particle deposition dynamics inside the chamber’s walls and the aerosol transport phenomena, were constrained in virtue of the inner volume [21,22,24]. In addition, it is worth knowing that geometrical changes have a limited influence on the particle deposition inside the chamber [21], in particular as the present design of the mist chamber relies on the geometry of a cyclonic design. Thus, once w, L and its aspect ratio L/w are determined, no further changes can be done. For this reason, different variations of MC were focused on the dimensions w and L, except for the design MC30v where the orientation and the position of the mist outlet were also changed. The impact length textitL, corresponding to the distance between the nebulizer tip and the wall in front of it (impact wall, w), is in fact driven by the chamber’s diameter, since the position of the nebulizer was set to be the same for all MC variations to ensure comparability. The position of the nebulizer, or in this case, the impact length, can have a great influence on achieving an optimal transport in cyclonic chambers. As stated by Todolí and Mermet [24], if the nebulizer is too close to the impact wall, the inertial losses will be too intense, while if it is too far, the flow regime established inside the chamber can be troubled by the action of the nebulizer gas. In line with that, L affects the droplet size distribution, and therefore, the size selection of droplets leaving the chamber. Consequently, it is suggested that an impact surface in spray chambers should be placed at a distance not farther than 20 mm from the nebulizer tip to achieve droplet sizes between 1 and 20 μ m [21,24]. The specific design of the cyclonic chamber is appropriate for removing droplets with diameters larger than 10 μ m [24]. Processes and phenomena in cyclonic chambers are complex due to the obvious recirculation, as only a portion of the aerosol coarse droplets is focused towards the impact surface, whereas the remaining ones undergo additional processes such as evaporation, fractionation and/or coalescence (also known as coagulation, which occurs when droplets fuse during its collision, leading to an increased droplet diameter), until they are finally transported outwards [24]. For the above mentioned reasons, the maximum diameter of the mist chambers was 30 mm, in order to maintain the impact length L below 20 mm.
Regarding the height of the impact wall (w), it is recognized that it is not selective in terms of separation of coarse droplets [24], and that most of the incoming aerosol from the nebulizer is deposited on this wall as well as in the wall ring and bottom, as explained by Schaldach et al. [22]. Nonetheless, the wall height affects the gas velocity of the Ar coming from the nebulizer into the aerosol flow field (and acceleration of the droplets) along the axis (z), which influences the droplet deposition process on the chamber’s walls [22]. Sharp [21] also indicates that this deposition will occur primarily on the side walls for high aspect ratios (impact length to wall L/w). Therefore, it can be deduced that ultimately, w also affects the transport towards the outlet. Based on the literature [21,22,34] and the commercial ICP-S cyclonic spray chambers, the impact wall height of the mist chambers presented was set between 12 and 20 mm.
A fundamental difference between ICP-S cyclonic spray chambers and the presented MCs is the position of the outlet, pivotal for its application in a thin film deposition process. In the former, the outlet is located at the center of the conical top with the purpose of directing the aerosol towards the plasma torch, usually placed atop of the spray chamber. In contrast, for MC30, MC25 and MC30s, the outlet is located in the fourth quadrant of the cylindrical chamber ring, parallel to the nebulizer inlet, as the mist needs to be directed perpendicular to the substrate surface. Empirical experiences revealed that if the outlet is not in the fourth quadrant of the cylindrical chamber ring and parallel to the nebulizer inlet, the amount of misted monomer is not sufficient and further, an accumulation of droplets occurs at the interface chamber-outlet, resulting in the formation of larger droplets. All of these coincide with the characteristics presented by Schaldach et al. [22] and Todoli et al. [24], which claim: (i) almost 15% of the nebulized liquid is trapped at the upper part of the chamber, which appears to be most selective area since mainly the coarse drops are removed there; and (ii) that more than half (53.6%) is lost between the top and the bottom on the curved surface of the chamber. This proves that when placing the outlet on the wall ring, the misted mass transport rate (Wtot) is higher as when the outlet is placed on the lateral top part, as seen in Table 1 for MC25 and MC30 in comparison to MC30s, respectively. For MC30v, it was decided to place the outlet in the top central part and to turn the orientation of the chamber in a vertical direction, assuming to achieve a more direct path of the mist downwards, based upon the flow path given by the commercial ICP-S chambers, and the design in the works of Taylor et al. [34] and Schaldach et al. [32]. Although its Wtot ranked second among the chambers, it presented two major drawbacks that will be discussed in the performance analysis section.
Deduced from the previous mist chamber designs [26] and knowing that the great majority of nebulized liquid is trapped on the walls and subsequently lost, it is recognized that the drain possesses important consideration. According to Schaldach et al. [22], more than 90% of the aerosol generated by the nebulizer will be removed by the spray chamber, whereas only 2% leaves the cyclonic spray chamber through the outlet. Therefore, the drain should be large enough to evacuate the liquid properly to avoid flooding within the chamber and to be able to operate the chamber for long periods. For the shape of the drain, different angles (measured from the impact wall) were tested in previous versions and the following were chosen in order to maintain the proportions across the chambers: 127 for the chambers MC30-MC30s and 135 for MC25. For MC30v, the drain was shaped as an elliptical cone in the lowest part of the wall ring. For further improvement of the drainage and to avoid the buildup of large droplets on the walls, some manufacturers have included a flow spoiler or groove that goes from the top of the chamber down to guide larger droplets to the drain [24,35,36]. For all MC presented, a spoiler of 1 mm width and 0.75 mm height was added in the IV quadrant for MC30, MC30s and MC25; and in quadrants III and IV in the wall ring for MC30v. Another important factor for a proper drainage is the surface wettability of the mist chamber. This issue was an imperative aspect for choosing metal-based chambers instead of polymers. In polymeric ICP-S spray chambers, it has been shown that their hydrophobic nature drives not only erratic drainage and longer washout times, but also negatively affects the aerosol transport efficiency due to the formation of large droplets on the walls, the sensitivity and even the flow fields inside [21,23,24,25,35,37]. To reduce these problems, some manufacturers add organic-based coatings to the surface [35], which cannot be considered when using organic chemicals for thin film synthesis due to unwanted chemical interactions with the monomers. However, generating very smooth surfaces has also proven to be a good solution [35], which was the objective by using plasma-electrolytic polishing of the metal mist chambers.

3.2. Surface Treatment of the Mist Chambers: Plasma-Electrolytic Polishing

Despite the many advantages of selective laser melting (SLM) over conventional manufacturing methods, the limited surface quality and porosity inherent to the process [38,39] might cause major drawbacks depending on the application. Although grit-blasting with glass beads was applied to all 3D-printed components as part of a standardize post-processing procedure, it was not sufficient to achieve an appropriate surface quality to ensure efficient mist transport and drainage. Hence, plasma-electrolytic polishing (PEP) was applied with the aim of reducing the surface roughness and pore depth. Pictures of untreated (only grit-blasting) and a PEP-treated (30 min) specimen are depicted in Figure S2, while scanning electron microscopy images are shown in Figure 5. As observed, the surface of the untreated specimen presented a rough surface morphology and edge irregularities, due to the combination of incomplete melting of metallic powder during the SLM process [39,40,41] and the blasting finishing. In contrast, for the PEP-treated specimen, a smooth surface with blunt edges can be seen. The surface roughness was determined by employing white light interferometry (Profilm 3D, FILMETRICS, California, United States of America) (Table S1). In addition, representative 2D and 3D surface topologies of untreated and PEP-treated specimen can be seen in Figure S3A–D, as well as corresponding height profiles of selected regions (marked as line a and b in the 3D images of Figure S3C,D). After the PEP process of 30 min, the average surface roughness (Ra) was considerably reduced from 1.68 ± 0.17 μ m to 0.07 ± 0.03 μ m. The areal surface roughness was reduced by 66% after 30 min of plasma polishing compared to the roughness of the untreated specimen. After the PEP treatment, the weight of the 3D printed chamber parts declined in a range of 4.4% to 5.8% (Table S2), depending on the treated surface area. Other authors have also reported a dependency between the material removal rate and the workpiece geometry [42]. In Figure S4, water contact angles of untreated and PEP treated surfaces are shown. For the untreated part a water contact angle (WCA) of 59 was measured whereas the plasma-polished surface exhibited a WCA of 76 . After analysis by QCM performance measurements, shown in Table 1, it was realized that for the particular case of metallic SLM-manufactured chambers, the improvement in mist transport and drainage is driven by the reduction in the pore sized and roughness of the surface after PEP, rather than by the wettability, as the hydrophobicity actually increased when compared to untreated surfaces.

3.3. Performance Evaluation

3.3.1. Mist-Out Time and Misted Mass Transport Rate

The influence of chamber design as well as post-treatment (untreated vs. plasma polished chamber) in terms of efficiency and performance was first evaluated by measuring the amount of mist emitted from the chamber’s outlet directly onto the quartz crystal (Figure 3) by applying a pump speed of S50 (selected as representative mid-range value). The aim was to emulate one of the performance indicators commonly used for ICP-S spray chambers: wash-in/out time [21]. According to Sharp [21,25], wash-in/out time is the time required for a signal to rise or fall to some fraction of its initial value. Usually, this fraction is considered as a decline of 1% from the peak value, which would represent the time for the aerosol to be swept from the chamber (note: other authors can give different percentages based on different conventions [24]). ICP-S spray chambers’ manufacturers prefer shorter washout times for economic reasons (to run as many different samples in the shortest time as possible), to reduce memory effects, and to increase the transport efficiency of the analyte into the plasma [21,36]. However, since the purpose of the presented mist chambers does not target ICP-S, this parameter cannot be considered and analyzed in the same way. Alternatively, in the present method, the QCM is able to track the frequency shift due to the wetting of the quartz crystal surface by the aerosol particles, and hence, the mass loading onto it, analogous to the methods described by other authors for aerosol mass determination [43,44,45]. Therefore, the curve provides not only a similar indicator to washout time, hereinafter labeled as mist-out time (Tmist, determined at 1% fall of the resonance peak value), but also the misted mass transport rate (Wtot), defined as the mass of mist leaving the mist chamber per unit of time. Wtot is only approximated, as two exhaust holes were added in the QCM crystal enclosure to avoid overpressure and consequently some mist escapes (visible in Figure 3). It is important to mention that this is only a qualitative measurement that intends to compare the performance between the proposed chamber designs, in which it is assumed that the added material (aerosol particles) follows the oscillation of the quartz and can be approximated to be a part of the crystal (as a thin, rigid layer), up to peak oscillation. At this point and onwards, the accumulation of aerosol particles on the surface forms a liquid layer that cannot longer be approximated as part of the crystal (viscoelastic film), provoking damping of the oscillator and information beyond the first harmonic (including dissipation) would be needed (further information regarding QCM characterization and interpretation can be found in [46,47]). However, since quantitative information of the liquid film (viscoelastic modeling) is not of interest here, the applied QCM scenario (measurement up to the resonance peak) is valid for obtaining useful information on the different chamber designs and surface finish (untreated and PEP-treated), through the derived performance indicators of Tmist and Wtot. The obtained values are shown in Table 1 (see also Figure S5). It is noticeable that for the PEP-treated chambers an improvement of Tmist and Wtot was achieved independent from the design. The reduction in mist-out time means faster drainage and less time for the smaller droplets to be swept to the outlet by the Ar stream; hence, a better transport efficiency, as the formation of large droplets on the walls is reduced.
Overall, the mist-out time is inversely proportional to the mass transport rate. The chamber that presented the largest differences when considering surface finish was MC30v, with a reduction of 66.9% of Tmist and 2.83× greater Δ Wtot after PEP, whereas the smallest change after PEP was for MC30s, with 23.2% of Tmist and 1.3 × Δ Wtot, respectively. Among the chambers studied, MC30 provided the lowest mist-out time and highest Wtot (Figure S5C). Although MC30v presented comparable results, a lot of mist was escaping from the drain tubing (while it kept draining large droplets) during its operation, indicating that the drain area in the chamber was also acting similar to an outlet, and therefore, the transport efficiency could not be at its maximum at the actual outlet. Furthermore, the nebulizer inlet was flooded with monomer up to the point of dripping outside of it, implying excessive recirculation and unnecessary loss of small particles in the wall ring. Although recirculation cannot be avoided, this implies that the proposed vertical geometry of MC30v does not provide a low impedance path for the mist [21]. A similar situation was observed when operating with MC30s, where the inlet was also flooded to some extent. A characteristic finding for both, MC30s and MC30v, is that they have the smallest wall height (w) and the largest aspect ratios, respectively. As stated before, the deposition of droplets arises primarily on the side walls for high aspect ratio chambers [21], coherently explaining the flooding in the inlet. For MC30s, the smallest wall height (12 mm) can account for the lowest mass transport rate measured. Based on these results, MC30 and MC25 delivered the best performance, as the combination of shorter Tmist and greater Wtot is preferred.

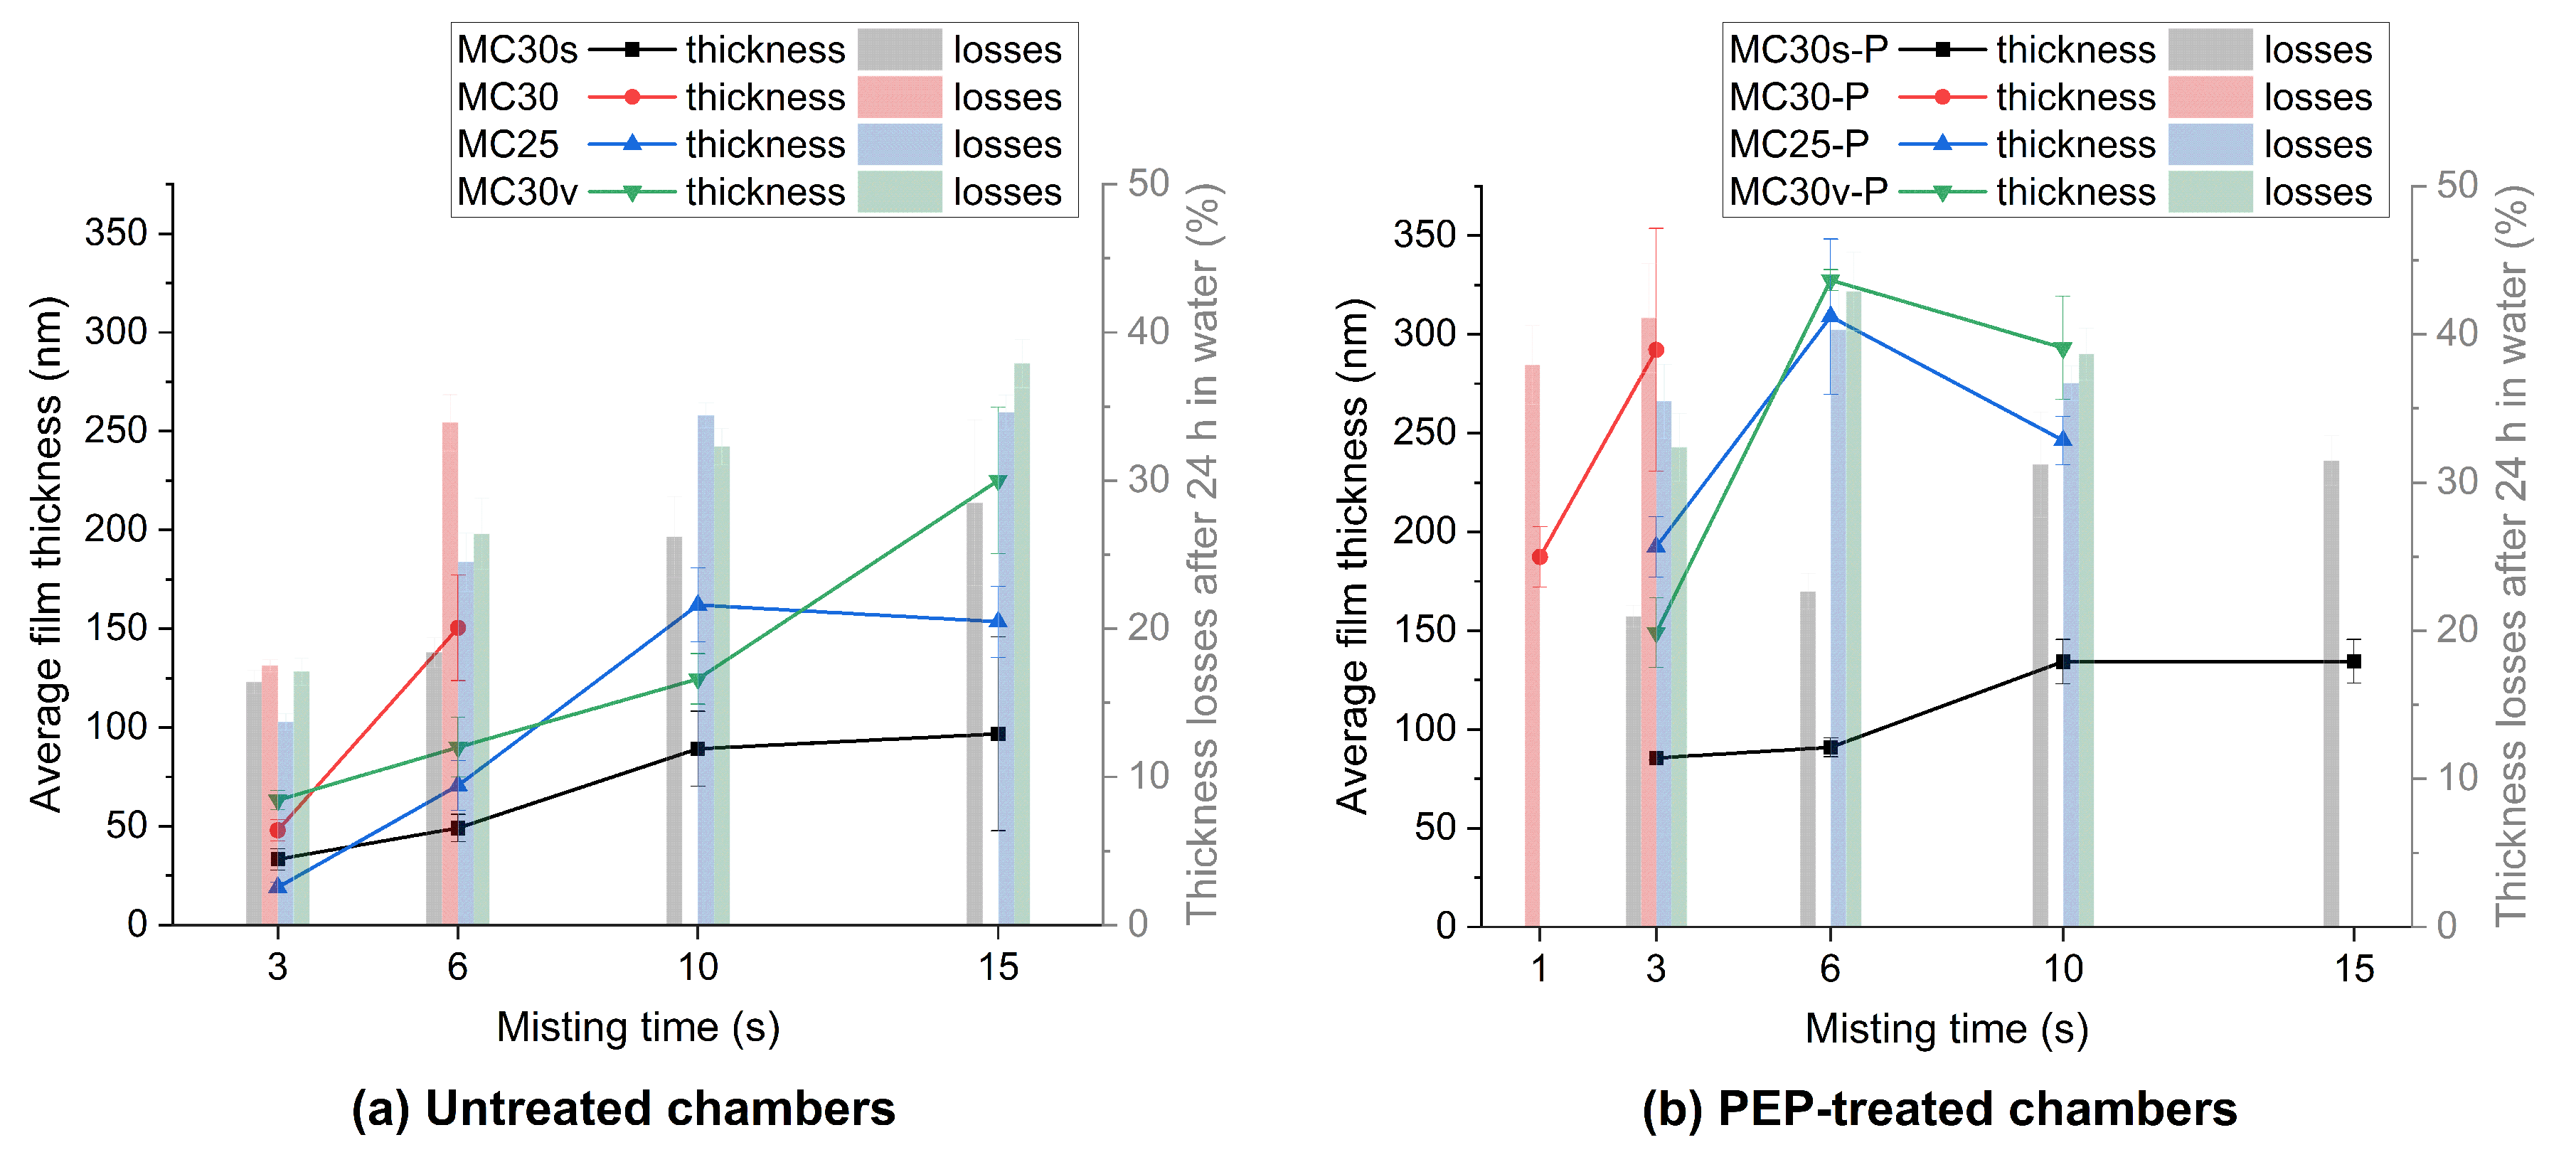
3.3.2. Plasma-Polymerized Films

The amount of deposited liquid monomer can be one of the factors that determines the films’ thickness and their uniformity in terms of surface morphology. For this reason, pp films were synthesized by using the different chamber designs and surface finish depending on the misting time (initially 3, 6, 10 and 15 s, all at pump speed S50) at a fixed plasma polymerization time (16 s). The obtained pp film was evaluated in terms of stability by measuring the thickness immediately after polymerization (as-deposited) and after 24 h of immersion in water by using ellipsometry (for the pp films deposited on Si wafers) and QCM measurements.
As portrayed by the line plots in Figure 6, PEP-treated chambers led to significantly thicker plasma-polymerized films, up to 10 times as compared to films obtained by using the untreated chambers (e.g., for MC25 at 6 s) due to the higher amount of misted liquid, which agrees with the Wtot results presented in the previous section. In fact, in some cases, no data were obtained for misting times of 6, 10 or 15 s, because the amount of misted liquid was too high to achieve a polymerized thin film within 16 s of plasma polymerization. Deposition experiments, using the same process parameters, were also performed on QCM crystals. Both ellipsometry (bar plots in Figure 6) and QCM data (shown in Table S3) indicate that the mass losses are higher for thicker pp films (after immersion) obtained by using PEP-treated mist chambers. Hence, it can be concluded that with longer misting time, more monomer mist is deposited on the substrate; however, it does not necessarily lead to thicker plasma-polymerized films, as it can be seen from the thickness decay with PEP-treated chambers at 6 s, 10 s and 15 s in Figure 6b.
Considering that for an efficient deposition process, it is desired to reach a target film thickness in the least possible time, the chambers MC30 and MC25 are the most prospective ones because of the highest deposition rates. However, MC25 proved to give an optimal balance between mist-out time, Wtot and versatility for pp film thickness at different misting times, without increasing the plasma polymerization time. Therefore, MC25 was chosen to conduct further experiments on the quality of pp films, reported in Section 3.4. Additional misting reproducibility tests were conducted to determine the optimal pump speed for this chamber, in order to keep a balance between input monomer from the nebulizer, drainage flowrate and mist flowrate. If the monomer inflow is too high and the drainage cannot drain fast enough, the chamber can get filled up to a point where it affects the recirculation and flow of the particles due to inner volume reduction, negatively impacting the Wtot. QCM measurements at different pump speeds were performed. The results, shown in Figures S6 and S7, revealed that there is not a significant increment of the Δm with pump speeds higher than S40, as compared to S10 to S30. Yet, questions arose regarding the impact of misting and polymerization time on pp films in terms of thickness, surface morphology and presence of functional groups in relation to monomer conversion degree.

3.4. Influence of Misting Conditions and Plasma Polymerization Time on the Degree of Monomer Conversion

Since the properties of the pp films depend not only on the amount of the liquid monomer, but also on other parameters such as the plasma polymerization time, another set of depositions was performed to study the degree of monomer conversion and its influence on the properties of the obtained pp films. MC25 chamber was utilized in this set of experiments varying misting conditions and plasma polymerization time. First, the pp films were deposited using the pump speed of S10 and S30, misting time of 1 s, 3 s, and 6 s, and fixed plasma polymerization time of 16 s. The conditions were chosen in order to study the thin (less than 150 nm) pp films behavior. The obtained results (Table 2) showed that the pump speed of S10 was not sufficient for the deposition process as far as no pp film were obtained for ellipsometric measurement during 1 s and 3 s of misting, while at 6 s, it was possible to obtain a pp film with the thickness of 29 nm. On the other hand, usage of just 1 s of misting at the pump speed of S30 was enough to achieve a stable deposition. Further increase of misting time at the pump speed of S30 led to an increase of the resulting pp films thickness following a linear behavior, confirmed by a simple linear model fitting ( y = a + b × x , see Figure S8). This allows approximating the pp film thickness of the studied monomer mixture, as a function of the misting time for the found optimal speed (S30) and polymerization time of 16 s, obtaining the following equation:
y t ( m ) = 25.75 x m 8.48
where y t ( m ) is the desired pp film thickness in nanometers, and x m the misting time in seconds.
The data confirmed the preceding thickness losses analysis (Figure 6), where pp film thickness losses and mass losses are greater as the misted mass—and consequently the pp film thickness—increased. It is well known from traditional plasma-enhanced chemical vapor deposition (PECVD) that film microstructure and surface morphology can be tailored by plasma-surface interactions and substrate surface conditions, along with the gas-phase chemical processes that are largely responsible for the chemical composition of the deposited films [4]. This contributes to hypothesize that, for the current grafting and plasma polymerization process, there is a clear relationship between film thickness, polymerization time, and degree of monomer conversion. The first proof of the correlation comes from the evidence in surface morphology, by measuring the roughness of the films (after 24 h immersion in water). As observed in Figure 7, all depositions comprise a smooth surface, but pinholes start to arise as the pp film thickness increases due to longer misting time, leading to subsequent growth of such pinholes in quantity and size. This occurs due to the incomplete formation of crosslinked polymer chains during the plasma polymerization process, which generates less stable polymeric networks and leads to the removal of loosened oligomer particles from the film’s surface after the immersion in water, generating the cavities and increasing the roughness as compared before immersion and/or for thinner films [13]. Hence, if the plasma polymerization conditions (treatment time and power) remain the same, but the misting time increases, thicker pp films will suffer from a lower degree of monomer conversion and instabilities, as there is no compensation for the bulk of liquid to achieve the same degree of polymerization.
Further pp films depositions were performed using the pump speed of S30, misting time of 6 s, and varying plasma polymerization time in order to investigate the influence of degree of monomer conversion on the properties of the resulting pp films, specifically film thickness-mass losses and presence of functional groups. The degree of monomer conversion was studied via measuring FT-IR spectra of the resulting pp films applying normalization by the pp films thickness.
The first results, presented in Figure 8, indicate that the film thickness (as-deposited) is inversely proportional to the polymerization time and the pp films stability is increased with an increase of plasma polymerization time. An approximation the pp film thickness as a function of the plasma polymerization time was obtained using a polynomial fit of order 2 ( y = a + b 1 × x 1 + b 2 × x 2 , see Figure S9), resulting in the following equation:
y t ( p ) = 204.09 4.52 x p + 0.054 x p 2
where y t ( p ) is the desired pp film thickness in nanometers, and x p the plasma polymerization time in seconds.
FT-IR analysis of the monomer mixture and the resulting pp films (Figure 9) showed that the main differences between the monomer spectrum and the spectra of pp films are the appearance of O–H stretching (3460 cm−1), and the significant decrease of C=C–H (3080 cm−1) and C=C (1640 cm−1) stretching signals. The monomer mixture does not contain any hydroxyl groups in its structure, whereas the O–H stretching signal appears in all of the studied pp films. The amount of O–H groups presented in the pp films structure is directly proportional to plasma polymerization time as a product of atmospheric-pressure plasma-induced oxidation [14]. The C=C stretching signal experienced a dramatic decrease after plasma polymerization, indicating the major role of the vinyl and vinylidene bonds in the formation of the polymeric chains. Just traces of C=C stretching signal are observed in the spectra of pp films polymerized for 8 s, and its intensity is continuously decreased with an increase of polymerization time, until the signal completely disappears in the spectrum of pp film polymerized for 32 s, indicating complete monomer conversion. Intensities of C–H stretching multiple peaks (2800–3100 cm−1) corresponding to different alkane fragments are also decreasing with the increase of plasma polymerization time. A smaller amount of C–H moieties in the pp films polymerized for a longer time shows that longer plasma polymerization time results in pp films with longer and more cross-linked polymeric chains.
Finally, it can be pointed out that the thinner the pp film, the more uniform it tends to be, particularly in the area directly under the plasma jet. Hence, the uniformity of the pp films is in agreement with the film thickness and degree of monomer conversion relationship: for thicker liquid films deposited (i.e., more monomer), the depth penetration of the plasma species is limited and their distribution is time- and area-dependent (the last one driven by the inner diameter of the plasma jet capillary). Therefore, there is a gradient in the degree of monomer conversion along and across the layer, influencing its homogeneity, as displayed in Figure 10.

4. Conclusions

In the present work, different versions of novel mist chambers were designed and evaluated to integrate them in an atmospheric-pressure plasma polymerization process, aim at the synthesis of functional thin polymer films from liquid precursors. The multidisciplinary research combined mechanical design based on theoretical aspects of ICP-S spray chambers, additive manufacturing, plasma electrolytic polishing, atmospheric-pressure plasma liquid deposition and plasma chemistry analysis. It was demonstrated how different changes in the geometry of the mist chambers, in particular the impact length (L) and impact wall height (w), as well as the surface finish of the chambers, influence the time for the aerosol to be swept from the chamber and the drainage of lost droplets. These physical characteristics of the mist chambers, along with misting conditions (pump speed and misting time), affect the amount of dispensed liquid, and ultimately also the thickness of plasma-polymerized film. In addition, plasma process parameters like polymerization time can alter not only the pp film thickness, but also the surface morphology and degree of monomer conversion. Here, it was also demonstrated how the vinyl and vinylidene bonds present in the monomer mixture play a major role in the formation of the polymeric chains, as the C=C stretching signal experienced a dramatic decrease when the plasma polymerization time increased. After selecting MC25 as the best performing mist chamber, two simple formulas were acquired, where an approximation of the pp film thickness can be determined as a function of the misting time or the plasma polymerization time, with the aim of creating recipes for customizing the pp films derived from the particular monomer mixture used. Aside from the exposed synthesis process, the mist chambers can also be used with other thin film fabrication technologies that likewise employ precursors in the liquid phase and aim at engineered coatings, such as UV photopolymerization and chemical deposition, extending the benefits and applications of the devices.

Supplementary Materials

The following are available at https://www.mdpi.com/article/10.3390/coatings11111336/s1, Figure S1. Experimental “Flowrate vs. % rpm” curve for peristaltic pump Longer, LP-BQ50-1J, using Tygon tubing 1/16″ ID×1/8″ OD, and liquid with density ρ = 0.90 ± 0.01 g/cm3. Table S1. Roughness values for untreated and PEP-treated stainless steel 3D printed probes, evaluated by white light interferometry. Table S2. Mass losses of 3D printed chambers before and after PEP. Figure S2. Pictures of 316L stainless steel 3D-printed probes for plasma-electrolytic polishing (PEP) surface analysis, untreated and after 30 min PEP, and close-up optical microscope images. Figure S3. 2D and 3D surface topology images of stainless steel 3D printed probes untreated and after 30 min PEP treatment, and their corresponding height profiles. Figure S4. Water contact angle measurements on stainless steel 3D printed probes, untreated and for each PEP treatment time. Figure S5. Performance indicator graphs of the chambers before and after plasma-electrolytic polishing. Table S3. Mass changes of pp films deposited on QCM crystals after 24 h immersion in water, for all mist chambers. Figure S6. Curve Δm vs. time using different pump speeds. Figure S7. Curve Δm vs. time to determine the Wtot for pump speeds S10 and S30. Figure S8. Linear fit for average film thickness in function of the misting time, for MC25 with pump speed of S30 and polymerization time of 16 s. Figure S9. Polynomial fit for average film thickness in function of the plasma polymerization time, for MC25 with pump speed of S30 and misting time of 6 s.

Author Contributions

Conceptualization, L.B.; methodology, L.B., E.M. and S.A.; software, L.B.; validation, E.M. and K.F.; formal analysis, L.B., E.M., S.A. and K.F.; investigation, L.B., E.M. and S.A.; resources, K.F.; data curation, L.B., E.M., S.A. and K.F.; writing—original draft preparation, L.B.; writing—review and editing, E.M., S.A. and K.F.; visualization, L.B.; supervision, K.F. and L.B.; project administration, K.F.; funding acquisition, K.F. All authors have read and agreed to the published version of the manuscript.

Funding

This research received no external funding.

Institutional Review Board Statement

Not applicable.

Informed Consent Statement

Not applicable.

Data Availability Statement

Data are contained within the article and supplementary material.

Acknowledgments

The authors would like to thank and recognize Michael Timm, Udo Nehmzow, Philipp Wittmann, Peter Gransow and Jens Zöllner-Krumme, for their invaluable support in manufacturing the different mist chambers.

Conflicts of Interest

The authors declare no conflict of interest.

References

  1. Martin, P.M. Deposition Technologies: An Overview. In Handbook of Deposition Technologies for Films and Coatings, 3rd ed.; Martin, P.M., Ed.; Elsevier Ltd.: Amsterdam, The Netherlands, 2010; pp. 1–31. [Google Scholar] [CrossRef]
  2. Jilani, A.; Abdel-wahab, M.S.; Hammad, A.H. Advance Deposition Techniques for Thin Film and Coating. In Modern Technologies for Creating the Thin-film Systems and Coatings; Nikitenkov, N.N., Ed.; IntechOpen: London, UK, 2017; pp. 137–149. [Google Scholar] [CrossRef] [Green Version]
  3. Rossnagel, S.M. Thin film deposition with physical vapor deposition and related technologies. J. Vac. Sci. Technol. A Vacuum Surfaces Film. 2003, 21, S74–S87. [Google Scholar] [CrossRef]
  4. Martinu, L.; Zabeida, O.; Klemberg-Sapieha, J. Plasma-Enhanced Chemical Vapor Deposition of Functional Coatings. In Handbook of Deposition Technologies for Films and Coatings, 3rd ed.; Martin, P.M., Ed.; Elsevier Ltd.: Amsterdam, The Netherlands, 2010; pp. 392–465. [Google Scholar] [CrossRef]
  5. Cameron, D. Introduction to Films and Coatings: Technology and Recent Development. In Comprehensive Materials Processing, 1st ed.; Hashmi, S., Batalha, G.F., Tyne, C.J.V., Yilbas, B., Eds.; Elsevier Ltd.: Amsterdam, The Netherlands, 2014; Volume 4, p. 1. [Google Scholar] [CrossRef]
  6. Setsuhara, Y. Plasma Sources in Thin Film Deposition. In Comprehensive Materials Processing, 1st ed.; Hashmi, S., Batalha, G.F., Tyne, C.J.V., Yilbas, B., Eds.; Elsevier: Amsterdam, The Netherlands, 2014; Volume 4, pp. 307–324. [Google Scholar] [CrossRef]
  7. Vasudev, M.C.; Anderson, K.D.; Bunning, T.J.; Tsukruk, V.V.; Naik, R.R. Exploration of Plasma-Enhanced Chemical Vapor Deposition as a Method for Thin-Film Fabrication with Biological Applications. ACS Appl. Mater. Interfaces 2013, 5, 3983–3994. [Google Scholar] [CrossRef] [PubMed]
  8. Massines, F.; Sarra-Bournet, C.; Fanelli, F.; Naude, N.; Gherardi, N. Atmospheric Pressure Low Temperature Direct Plasma Technology: Status and Challenges for Thin Film Deposition. PLasma Process. Polym. 2012, 9, 1041–1073. [Google Scholar] [CrossRef]
  9. Merche, D.; Vandencasteele, N.; Reniers, F. Atmospheric plasmas for thin film deposition: A critical review. Thin Solid Film. 2012, 520, 4219–4236. [Google Scholar] [CrossRef]
  10. Tatoulian, M.; Arefi-Khonsari, F.; Borra, J.P. Deposition of organic coatings at atmospheric pressure from liquid precursors. Plasma Process. Polym. 2007, 4, 360–369. [Google Scholar] [CrossRef]
  11. Schäfer, J.; Fricke, K.; Mika, F.; Pokorná, Z.; Zajíčková, L.; Foest, R. Liquid assisted plasma enhanced chemical vapour deposition with a non-thermal plasma jet at atmospheric pressure. Thin Solid Film. 2017, 630, 71–78. [Google Scholar] [CrossRef] [Green Version]
  12. Palumbo, F.; Porto, C.L.; Fracassi, F.; Favia, P. Recent Advancements in the Use of Aerosol-Assisted Atmospheric Pressure Plasma Deposition. Coatings 2020, 10, 440. [Google Scholar] [CrossRef]
  13. Makhneva, E.; Barillas, L.; Weltmann, K.D.; Fricke, K. Stability of oxygen-rich plasma-polymerized coatings in aqueous environment. Biointerphases 2020, 15, 061001. [Google Scholar] [CrossRef]
  14. Makhneva, E.; Barillas, L.; Farka, Z.; Pastucha, M.; Skládal, P.; Weltmann, K.D.; Fricke, K. Functional Plasma Polymerized Surfaces for Biosensing. ACS Appl. Mater. Interfaces 2020, 12, 17100–17112. [Google Scholar] [CrossRef]
  15. Boscher, N.D.; Duday, D.; Heier, P.; Heinze, K.; Hilt, F.; Choquet, P. Plasma polymer membranes for immobilising metalloporphyrins. Plasma Process. Polym. 2013, 10, 336–344. [Google Scholar] [CrossRef]
  16. Makhlouf, A.S.H. Current and advanced coating technologies for industrial applications. In Nanocoatings and Ultra-Thin Films; Makhlouf, A.S.H., Tiginyanu, I., Eds.; Woodhead Publishing: Sawston, UK, 2011; pp. 3–23. [Google Scholar] [CrossRef]
  17. Tao, R.; Ning, H.; Chen, J.; Zou, J.; Fang, Z.; Yang, C.; Zhou, Y.; Zhang, J.; Yao, R.; Peng, J. Inkjet Printed Electrodes in Thin Film Transistors. IEEE J. Electron Devices Soc. 2018, 6, 774–790. [Google Scholar] [CrossRef]
  18. Shi, Y.; Osada, M.; Ebina, Y.; Sasaki, T. Single Droplet Assembly for Two-Dimensional Nanosheet Tiling. ACS Nano 2020, 14, 15216–15226. [Google Scholar] [CrossRef] [PubMed]
  19. Jaworek, A. Electrospray droplet sources for thin film deposition. J. Mater. Sci. 2007, 42, 266–297. [Google Scholar] [CrossRef]
  20. Sharp, B.L. Pneumatic nebulisers and spray chambers for inductively coupled plasma spectrometry: A review. Part 1. Nebulisers. J. Anal. At. Spectrom. 1988, 3, 613–652. [Google Scholar] [CrossRef]
  21. Sharp, B.L. Pneumatic nebulisers and spray chambers for inductively coupled plasma spectrometry: A review. Part 2. Spray Chambers. J. Anal. At. Spectrom. 1988, 3, 939–963. [Google Scholar] [CrossRef]
  22. Schaldach, G.; Berger, L.; Razilov, I.; Berndt, H. Characterization of a cyclone spray chamber for ICP spectrometry by computer simulation. J. Anal. At. Spectrom. 2002, 17, 334–344. [Google Scholar] [CrossRef]
  23. Todolí, J.L.; Mermet, J.M. Specifications of a Sample Introduction System to be Used with an ICP. In Liquid Sample Introduction in ICP Spectrometry, 1st ed.; Elsevier Ltd.: Amsterdam, The Netherlands, 2008; pp. 3–15. [Google Scholar] [CrossRef]
  24. Todolí, J.L.; Mermet, J.M. Spray Chamber Design. In Liquid Sample Introduction in ICP Spectrometry, 1st ed.; Elsevier Ltd.: Amsterdam, The Netherlands, 2008; pp. 77–118. [Google Scholar] [CrossRef]
  25. Sharp, B.L.; O’Connor, C. Aerosol Generation and Sample Transport. In Inductively Coupled Plasma Spectrometry and its Applications, 1st ed.; Hill, S., Ed.; Blackwell Publishing Ltd.: Hoboken, NJ, USA, 2007; pp. 98–133. [Google Scholar] [CrossRef]
  26. Hidalgo, S.; Barillas, L.; Weltmann, K.D.; Fricke, K. Influence of the design of a mist chamber for the deposition of nanometric thin liquid films—Proof-of-concept. Tecnol. Marcha 2020, 33, 130–142. [Google Scholar] [CrossRef]
  27. Wu, C.Y.; Zhang, Q.; Li, Y.; Switt, R.; Matta, S. Aerosol Transport—Inertia. Available online: https://aerosol.ees.ufl.edu/aerosol_trans/section09_c.html (accessed on 25 March 2021).
  28. Schäfer, J.; Foest, R.; Quade, A.; Ohl, A.; Weltmann, K.D. Local deposition of SiOx plasma polymer films by a miniaturized atmospheric pressure plasma jet (APPJ). J. Phys. D Appl. Phys. 2008, 41, 194010. [Google Scholar] [CrossRef] [Green Version]
  29. An, S.; Foest, R.; Fricke, K.; Riemer, H.; Fröhlich, M.; Quade, A.; Schäfer, J.; Weltmann, K.D.; Kersten, H. Pretreatment of cutting tools by plasma electrolytic polishing (PEP) for enhanced adhesion of hard coatings. Surf. Coatings Technol. 2021, 405, 126504. [Google Scholar] [CrossRef]
  30. Sauerbrey, G. Verwendung von Schwingquarzen zur Wägung dünner Schichten und zur Mikrowägung. Z. Phys. 1959, 155, 206–222. [Google Scholar] [CrossRef]
  31. Thompson, D.F. Rapid production of cyclonic spray chambers for inductively coupled plasma applications using low cost 3D printer technology. J. Anal. At. Spectrom. 2014, 29, 2262–2266. [Google Scholar] [CrossRef]
  32. Schaldach, G.; Berndt, H.; Sharp, B.L. An application of computational fluid dynamics (CFD) to the characterisation and optimisation of a cyclonic spray chamber for ICP-AES. J. Anal. At. Spectrom. 2003, 18, 742–750. [Google Scholar] [CrossRef]
  33. Todolí, J.L.; Mermet, J.M. Influence of the spray chamber design for vapor-based liquid sample introduction at room temperature in ICP-AES. J. Anal. At. Spectrom. 2002, 17, 211–218. [Google Scholar] [CrossRef]
  34. Taylor, K.A.; Sharp, B.L.; Lewis, D.J.; Crews, H.M. Design and characterisation of a microconcentric nebuliser interface for capillary electrophoresis-inductively coupled plasma mass spectrometry. J. Anal. At. Spectrom. 1998, 13, 1095–1100. [Google Scholar] [CrossRef]
  35. PFA Cyclonic Spray Chamber for ICP-OES and ICP-MS (Data Sheet). Available online: https://www.savillex.com/Image/GetDocument/en/56 (accessed on 13 March 2021).
  36. Masone, J.; Brennan, R.; Fornadel, A. Improved Washout with the Glass Expansion Helix CT Cyclonic Spray Chamber. Available online: https://www.geicp.com/site/images/application_notes/ (accessed on 15 October 2020).
  37. Product Design Focus: Inert Spray Chambers—Glass Expansion Newsletter Issue 26,2011. Available online: https://www.geicp.com/site/GE_Newsletter/GlassExpansionNewsOct11.pdf (accessed on 15 October 2020).
  38. Jeon, T.J.; Hwang, T.W.; Yun, H.J.; VanTyne, C.J.; Moon, Y.H. Control of porosity in parts produced by a direct laser melting process. Appl. Sci. 2018, 8, 2573. [Google Scholar] [CrossRef] [Green Version]
  39. Yasa, E.; Kruth, J.P. Microstructural investigation of Selective Laser Melting 316L stainless steel parts exposed to laser re-melting. Procedia Eng. 2011, 19, 389–395. [Google Scholar] [CrossRef]
  40. Matras, A. Research and Optimization of Surface Roughness in Milling of SLM Semi-Finished Parts Manufactured by Using the Different Laser Scanning Speed. Materials 2019, 13, 9. [Google Scholar] [CrossRef] [PubMed] [Green Version]
  41. Hong, M.H.; Min, B.K.; Kwon, T.Y. The influence of process parameters on the surface roughness of a 3d-printed Co-Cr dental alloy produced via selective laser melting. Appl. Sci. 2016, 6, 401. [Google Scholar] [CrossRef] [Green Version]
  42. Alekseev, Y.G.; Kosobutsky, A.A.; Korolev, A.Y.; Niss, V.S.; Kucheryavy, V.D.; Povzhik, A.A. Features of the processes of dimensional processing of metal products by the electrolyte-plasma method. Litye. Metall. 2005, 4, 188–195. [Google Scholar]
  43. Adamson, J.; Hughes, S.; Azzopardi, D.; McAughey, J.; Gaça, M.D. Real-time assessment of cigarette smoke particle deposition. Chem. Cent. J. 2012, 6, 1–11. [Google Scholar] [CrossRef] [Green Version]
  44. Ding, Y.; Weindl, P.; Lenz, A.G.; Mayer, P.; Krebs, T.; Schmid, O. Quartz crystal microbalances (QCM) are suitable for real-time dosimetry in nanotoxicological studies using VITROCELL®Cloud cell exposure systems. Part. Fibre Toxicol. 2020, 17, 1–20. [Google Scholar] [CrossRef] [PubMed]
  45. Liang, D.; Shih, W.P.; Chen, C.S.; Dai, C.A. A Miniature system for separating aerosol particles and measuring mass concentrations. Sensors 2010, 10, 3641–3654. [Google Scholar] [CrossRef] [PubMed] [Green Version]
  46. Edvardsson, M. QCM-D in Relation to Other QCMs: What Are the Differences, and Does It Matter Which One to Use? 2018. Available online: https://www.biolinscientific.com/measurements/qcm-d (accessed on 21 February 2021).
  47. Quartz Crystal Microbalance (QCM). Available online: https://www.nanoscience.com/techniques/quartz-crystal-microbalance/ (accessed on 19 October 2021).
Figure 1. Process steps for the plasma-based synthesis of pp films obtained from liquid monomers. (a) plasma activation of the substrate’s surface; (b) deposition of the misted monomer onto the substrate to form a thin liquid layer (mist chamber outlet with focusing nozzle, orifice of Ø = 2 mm, distance to substrate 2 mm); and (c) polymerization of the deposited liquid monomer film via plasma treatment.
Coatings 11 01336 g001
Figure 2. Photographs of the upper part of a metallic 3D-printed mist chamber, showing the PEP immersion sequence and time. In total, every part was plasma-polished for 30 min.
Coatings 11 01336 g002
Figure 3. QCM setup for mist-out time and misted mass transport rate measurements, obtained from the given “Δf vs. time” curve. Note that the mist chamber outlet is enclosed to avoid air flow that could disturb the measurement and to contain the mist within the sampling area; yet, two symmetrical exhaust holes (Ø = 1 mm) were included to avoid overpressure and fast accumulation of the liquid.
Coatings 11 01336 g003
Figure 4. Drawings and specifications of the different mist chamber designs used in this study.
Coatings 11 01336 g004
Figure 5. SEM images (1000×) of a 316L stainless steel specimen manufactured by selective laser melting, before and after plasma-electrolytic polishing for 30 min. Aside from the surface roughness reduction, the smoothening of edges is also noticeable. Phenom Pro Desktop SEM, Thermo Fisher, 5 kV acceleration voltage.
Coatings 11 01336 g005
Figure 6. Average thickness (left Y axis, lines) of as-deposited plasma-polymerized films and their thickness losses after 24 h of immersion in water (right Y axis, bars), obtained before (a) and after plasma-electrolytic polishing (b), with different misting times. Pump speed S50, plasma polymerization time 16 s. Data acquired by ellipsometric measurements. Note: for certain mist chambers, the data for some misting times could not be obtained because the amount of misted liquid was too high to achieve a polymerized thin film within the specified plasma polymerization time. In the case of MC30-P, pp films with misting time of 1 s were acquired to have more data points.
Coatings 11 01336 g006
Figure 7. AFM images of pp films after 24 h immersion and their corresponding height profile and roughness. The films were deposited with MC25 at pump speed S30 with different misting times, and plasma-polymerized for 16 s.
Coatings 11 01336 g007
Figure 8. Average thickness (as-deposited) and mass losses of pp films for different plasma polymerization treatment times, at S30 and misting time of 6 s.
Coatings 11 01336 g008
Figure 9. FT-IR spectra of TT12 monomer and as-deposited pp films obtained at different plasma polymerization times.
Coatings 11 01336 g009
Figure 10. Relationship between thickness and uniformity of the pp films.
Coatings 11 01336 g010
Table 1. Mist-out time and misted mass transport rate for MC chambers, untreated and after PEP, for pump speed S50.
Mist ChamberTmist (s)Wtot ( μ g/s)
UntreatedPEP-Treated Δ UntreatedPEP-Treated Δ
MC30s158.85 ± 1.0121.97 ± 5.8−23.2%0.03915 ± 0.0010.05063 ± 0.00229.3%
MC3041.72 ± 1.017.74 ± 1.0−57.5%0.1375 ± 0.0010.31282 ± 0.006127.5%
MC2560.42 ± 3.521.29 ± 3.0−64.8%0.10301 ± 0.0120.2807 ± 0.020172.5%
MC30v56.36 ± 6.918.65 ± 3.5−66.9%0.10762 ± 0.0130.30499 ± 0.040183.4%
Table 2. Thickness and mass losses of pp films prepared with MC25 at different pump speeds and misting times, and 16 s plasma polymerization time.
Conditions
(Pump Speed,
Misting Time)
Wtot
( μ g/s)
Thickness of pp Film
(Measured by Ellipsometry)
Mass of pp Film
(Measured by QCM)
As-Deposited
(nm)
After 24 h in
Water (nm)
Thickness
Loss (%)
As-Deposited
Mass ( μ g)
Mass Loss after
24 h in Water ( μ g)
Mass Loss
(%)
S10, 1 s0.00854N/AN/AN/AN/AN/AN/A
S10, 3 s0.01894N/AN/AN/A0.25 ± 0.050.02 ± 0.008.32
S10, 6 s0.0321428.40 ± 0.8623.49 ± 0.9917.291.04 ± 0.160.20 ± 0.0219.61
S30, 1 s0.0236217.48 ± 1.0915.13 ± 0.9113.410.59 ± 0.070.08 ± 0.0113.91
S30, 3 s0.0535868.63 ± 3.1052.07 ± 2.1024.141.99 ± 0.050.50 ± 0.0225.09
S30, 6 s0.11946146.02 ± 6.9398.89 ± 3.6632.283.56 ± 0.221.29 ± 0.1136.13
Publisher’s Note: MDPI stays neutral with regard to jurisdictional claims in published maps and institutional affiliations.

