Article

Interfacial Microstructure and Corrosion Behaviour of Mild Steel Coated with Alumina Nanoparticles Doped Tin Composite via Direct Tinning Route

by
Abdulaziz S. Alghamdi
1,
K. S. Abdel Halim
1,2,*,
Mohammed A. Amin
3,
Abdullah S. Alshammari
4,
Naglaa Fathy
4 and
Mohamed Ramadan
1,2
1
College of Engineering, University of Ha’il, P.O. Box 2440, Ha’il 81441, Saudi Arabia
2
Central Metallurgical Research and Development Institute (CMRDI), P.O. Box 87, Helwan 11421, Egypt
3
Chemistry Department, Faculty of Science, Taif University, P.O. Box 888, Taif 21974, Saudi Arabia
4
Department of Physics, College of Science, University of Ha’il, P.O. Box 2440, Ha’il 81441, Saudi Arabia
*
Author to whom correspondence should be addressed.
Coatings 2021, 11(11), 1318; https://doi.org/10.3390/coatings11111318
Submission received: 19 September 2021 / Revised: 18 October 2021 / Accepted: 25 October 2021 / Published: 29 October 2021

Abstract

:
The improvement of the surface properties of ferrous metallic materials has become a crucial criterion for advanced engineering applications. The interfacial microstructure and corrosion behaviour of mild steel coated with alumina nanoparticles doped in tin composite using the direct tinning technique were investigated. A coating layer of tin composite containing different loads of Al2O3 nanoparticles (0.25 wt.%, 0.50 wt.%, 1.00 wt.% and 1.5 wt.%) was prepared and directly deposited on a mild steel substrate. This type of a direct tinning process is considered to be a simple and low-cost route for protecting metallic materials from corrosion. It was found that the thickness of both the composite layer and Fe-Sn intermetallic layer at the coated interfaces was highly affected by the presence of alumina nanoparticles that effectively inhibit the diffusion of Sn atoms into the Fe substrate. For the samples coated with lower content of alumina nanoparticles (0.25 wt.% and 0.50 wt.%), the thickness of the Fe-Sn intermetallic coating (IMC) layer is decreased due to Fe-Sn IMC suppression. Otherwise, for the addition of more alumina nanoparticles (1.00 wt.% and 1.50 wt.%), the thickness of the Fe-Sn IMC layer is slightly increased because of nanoparticle’s agglomeration and flotation. It can be reported that the presence of alumina nanoparticles in the coating layer improves, to a great extent, the corrosion resistance of Sn-composites surface on mild steel substrates. Although the tin composite coating layer with a high quantity of alumina nanoparticles (1.0 wt.%) exhibited better corrosion resistance than the other tested samples, such nanoparticle additions have become increasingly difficult to obtain. It was observed that the Al2O3 nanoparticles agglomeration and flotation that were detected in the coating surface may be related to high fraction nanoparticles loading and to the difference in the gravity for Sn and Al2O3 nanoparticles. However, based on our investigation, a coating layer that contains 0.50 wt.% alumina nanoparticles is highly recommended for achieving long lasting and high-performance corrosion resistance for coated mild steel with minimal coating layer defects.

1. Introduction

Metallic alloys, such as low carbon steel, are commonly used in advanced engineering applications such as automotive, energy transformation industry parts and petrochemical processes. These metallic alloy materials are used in the manufacturing of engines, pumps, valves and other internal mechanical parts. Generally, these internal mechanical parts are exposed to high temperatures, corrosion, and wear conditions. For example, the mechanical parts of automotive cylinder and valves are greatly affected by the surrounding environment (temperature, humidity, and other operating conditions), which may lead to the corrosion of these elements within a short time period. The corrosion effects minimize the lifetime, functionality and safety of these internal mechanical parts. The present study develops a novel technique for the surface modification of low carbon steel alloys by coating the steel alloy with nano sized Al2O3 particles doped with tin paste. Such types of composite paste will enable steel alloys to be high corrosion, wear and oxidation resistance. The coated layer will greatly enhance the surface properties of the steel alloys, consequently, increase their lifetime, and protect them from corrosion. The improvement in the surface properties in turn enhances the mechanical properties of steel alloys that make them more feasible for advanced engineering applications.
However, many investigators with varying perspectives managed the coating process of metallic alloys. As of recent, the main technologies for the surface treatment of metallic alloys are hot-dip aluminizing [1], thermal spraying [2], micro-arc oxidation [3], hot dipping and diffusion aluminizing [4], and pack-aluminizing [5]. Many coated materials were suggested based on the proposed technique. One of the promising techniques is to produce a hard-coated layer using the diffusion technique, which may be more preferable than Physical Vapor Deposition(PVD) and Chemical Vapor Deposition (CVD) processes [6,7]. It was reported that the resistance against corrosion of cast iron could be improved through coating with NbC using diffusion techniques. The results showed that the layers of NbC coatings offer high anticorrosive properties for their protection against corrosion. The corrosion rates were three times lower for the coated samples due to the presence of NbC. The diffusion techniques do not require vacuum equipment, have a low processing cost, and require economical supplies [8,9]. Aluminizing technique is also widely used to protect metallic alloys from corrosion [10,11,12,13,14,15,16,17,18]. It was found that aluminizing the steel improved its oxidation resistance, due to the formation of a protective, dense and stable Al2O3 layer on the surface of the aluminide layer on steels during the oxidation process. The surface properties of some steel alloys were modified to improve their corrosion resistance using the boronising technique [19]. A significant increase in the corrosion resistance was a result of the chemical stability and high density of FeB or FeB2. The analyses revealed that the boride layers do not react with aluminum.
In other related investigations, the authors of the present work used Sn-based alloys (Babbitt) as an isolated surface lining during the formation of bimetallic materials for bearing applications [20,21,22,23,24]. The optimization of the tinning process of the solid carbon steel substrate after the incorporation of the flux constituents with the tin powder was discussed in the literature [25] to improve the bonding strength and the performance of bimetallic bearings. In Al/Fe bimetallic materials, it was found that the ratio of tin-to-flux 1:10 demonstrated the best performance of the interfacial structure, bonded area and the interfacial shear strength. The improvement of the surface properties can be attributed to a restriction of the formation of Al-Fe and Fe-Al intermetallic phases. The optimizing of the tinning process offers a promising technique for the fabrication of bimetallic materials with a high performance for bearing applications.
The largest category of low-carbon steel is flat-rolled products. The carbon content for these high-formability steels is less than 0.25% C, with up to 0.4% Mn. It is typically used in automobile body panels, tin plates and wire products. For rolled steel structural plates and sections, the carbon content may be increased to approximately 0.30%, with a higher manganese content of up to 1.5%. These materials may be used for forgings, boilerplates, seamless tubes, and many other engineering applications. It is well known that metals are not inherently stable in most environments but tend to revert to more stable compounds. Using metallic coatings with a more noble metal can separate or protect mild steel against the aggressive environment [26,27].
The present work is designed to investigate the surface properties enhancement accompanying the coating of low carbon mild steel through Sn-composites using a direct tinning process that incorporates the flux constituents with tin powder and alumina nanoparticles. The interfacial microstructure for the produced coated materials together with the corrosion behavior were investigated under different Sn- nanocomposites conditions. A direct tinning process is considered as a promising technique for protecting metallic materials from corrosion as a simple and low-cost method.

2. Experimental

2.1. Coating Process

Low carbon steel specimens of approximately 42 × 18 × 7 mm3 that were used as substrates in the present study were grinded with emery papers of up to 400 grades (namely S0 to S5). These specimens were coated by Sn-metal containing different amounts of alumina nanoparticles (50 nm) and S2–S5 substrates. The tinning process of the steel substrate which involves powder tin and the flux mixture deposition has been explained in detail elsewhere [20,21,22,25]. In the present work, the tinning process of mild steel solid substrate surfaces was performed using powder tin (with and without alumina nanoparticles) and a flux mixture. For the tinning process of mild steel solid substrates without alumina nanoparticles, flux constituents of 24 g ZnCl2, 6 g NaCl, 3 g NH4Cl, 1 mL HCl and 1 mL H2O were mixed. Then, 1 g of powder pure Sn (with grain size ≈ 50 μm) was mixed with 10 g of the flux. A layer of Sn- flux mixture amounting to 0.2 g/cm2 was distributed on the steel surface area (42 mm × 18 mm). The steel substrates with an Sn-flux mixture were heated using a hotplate for 2.5 min at 350 °C. After the tinning process, the steel substrates were cooled and washed using worm water to remove the remaining flux on the surface of tin layer. Two reference steel specimens without/with coating tin composite were also prepared (S0 without any coating and S1 substrate coating with tin composite without any addition of alumina nanoparticles). Table 1 displays the chemical compositions of the steel substrate as used for the coating process in the current study. The produced specimens (S0–S5) were cross-sectional cut, grinded with emery papers of up to 1200 mesh, polished and etched with nital of 4% HNO3 and ethyl alcohol for microstructural investigations.

2.2. Microstructure Characterization

An optical microscope and scanning electron microscope (FEI Quanta 250 SEM, Eindhoven, Netherlands) were used to investigate the surface morphology and the structure of the coated layer. The chemical compositions of the interfaces of the coated layer were measured using energy-dispersive X-ray spectroscopy (EDAX-AMETEK, Mahwah, NJ, USA). The thickness of the surface layers was measured using a micrograph image analysis from software (Image Analyzer Software, Olympus GX51, Tokyo, Japan). The thickness of the formed layer was measured at the different areas of the micrograph to confirm our results. The average thickness layer was obtained for each sample.

2.3. Corrosion Resistance Test

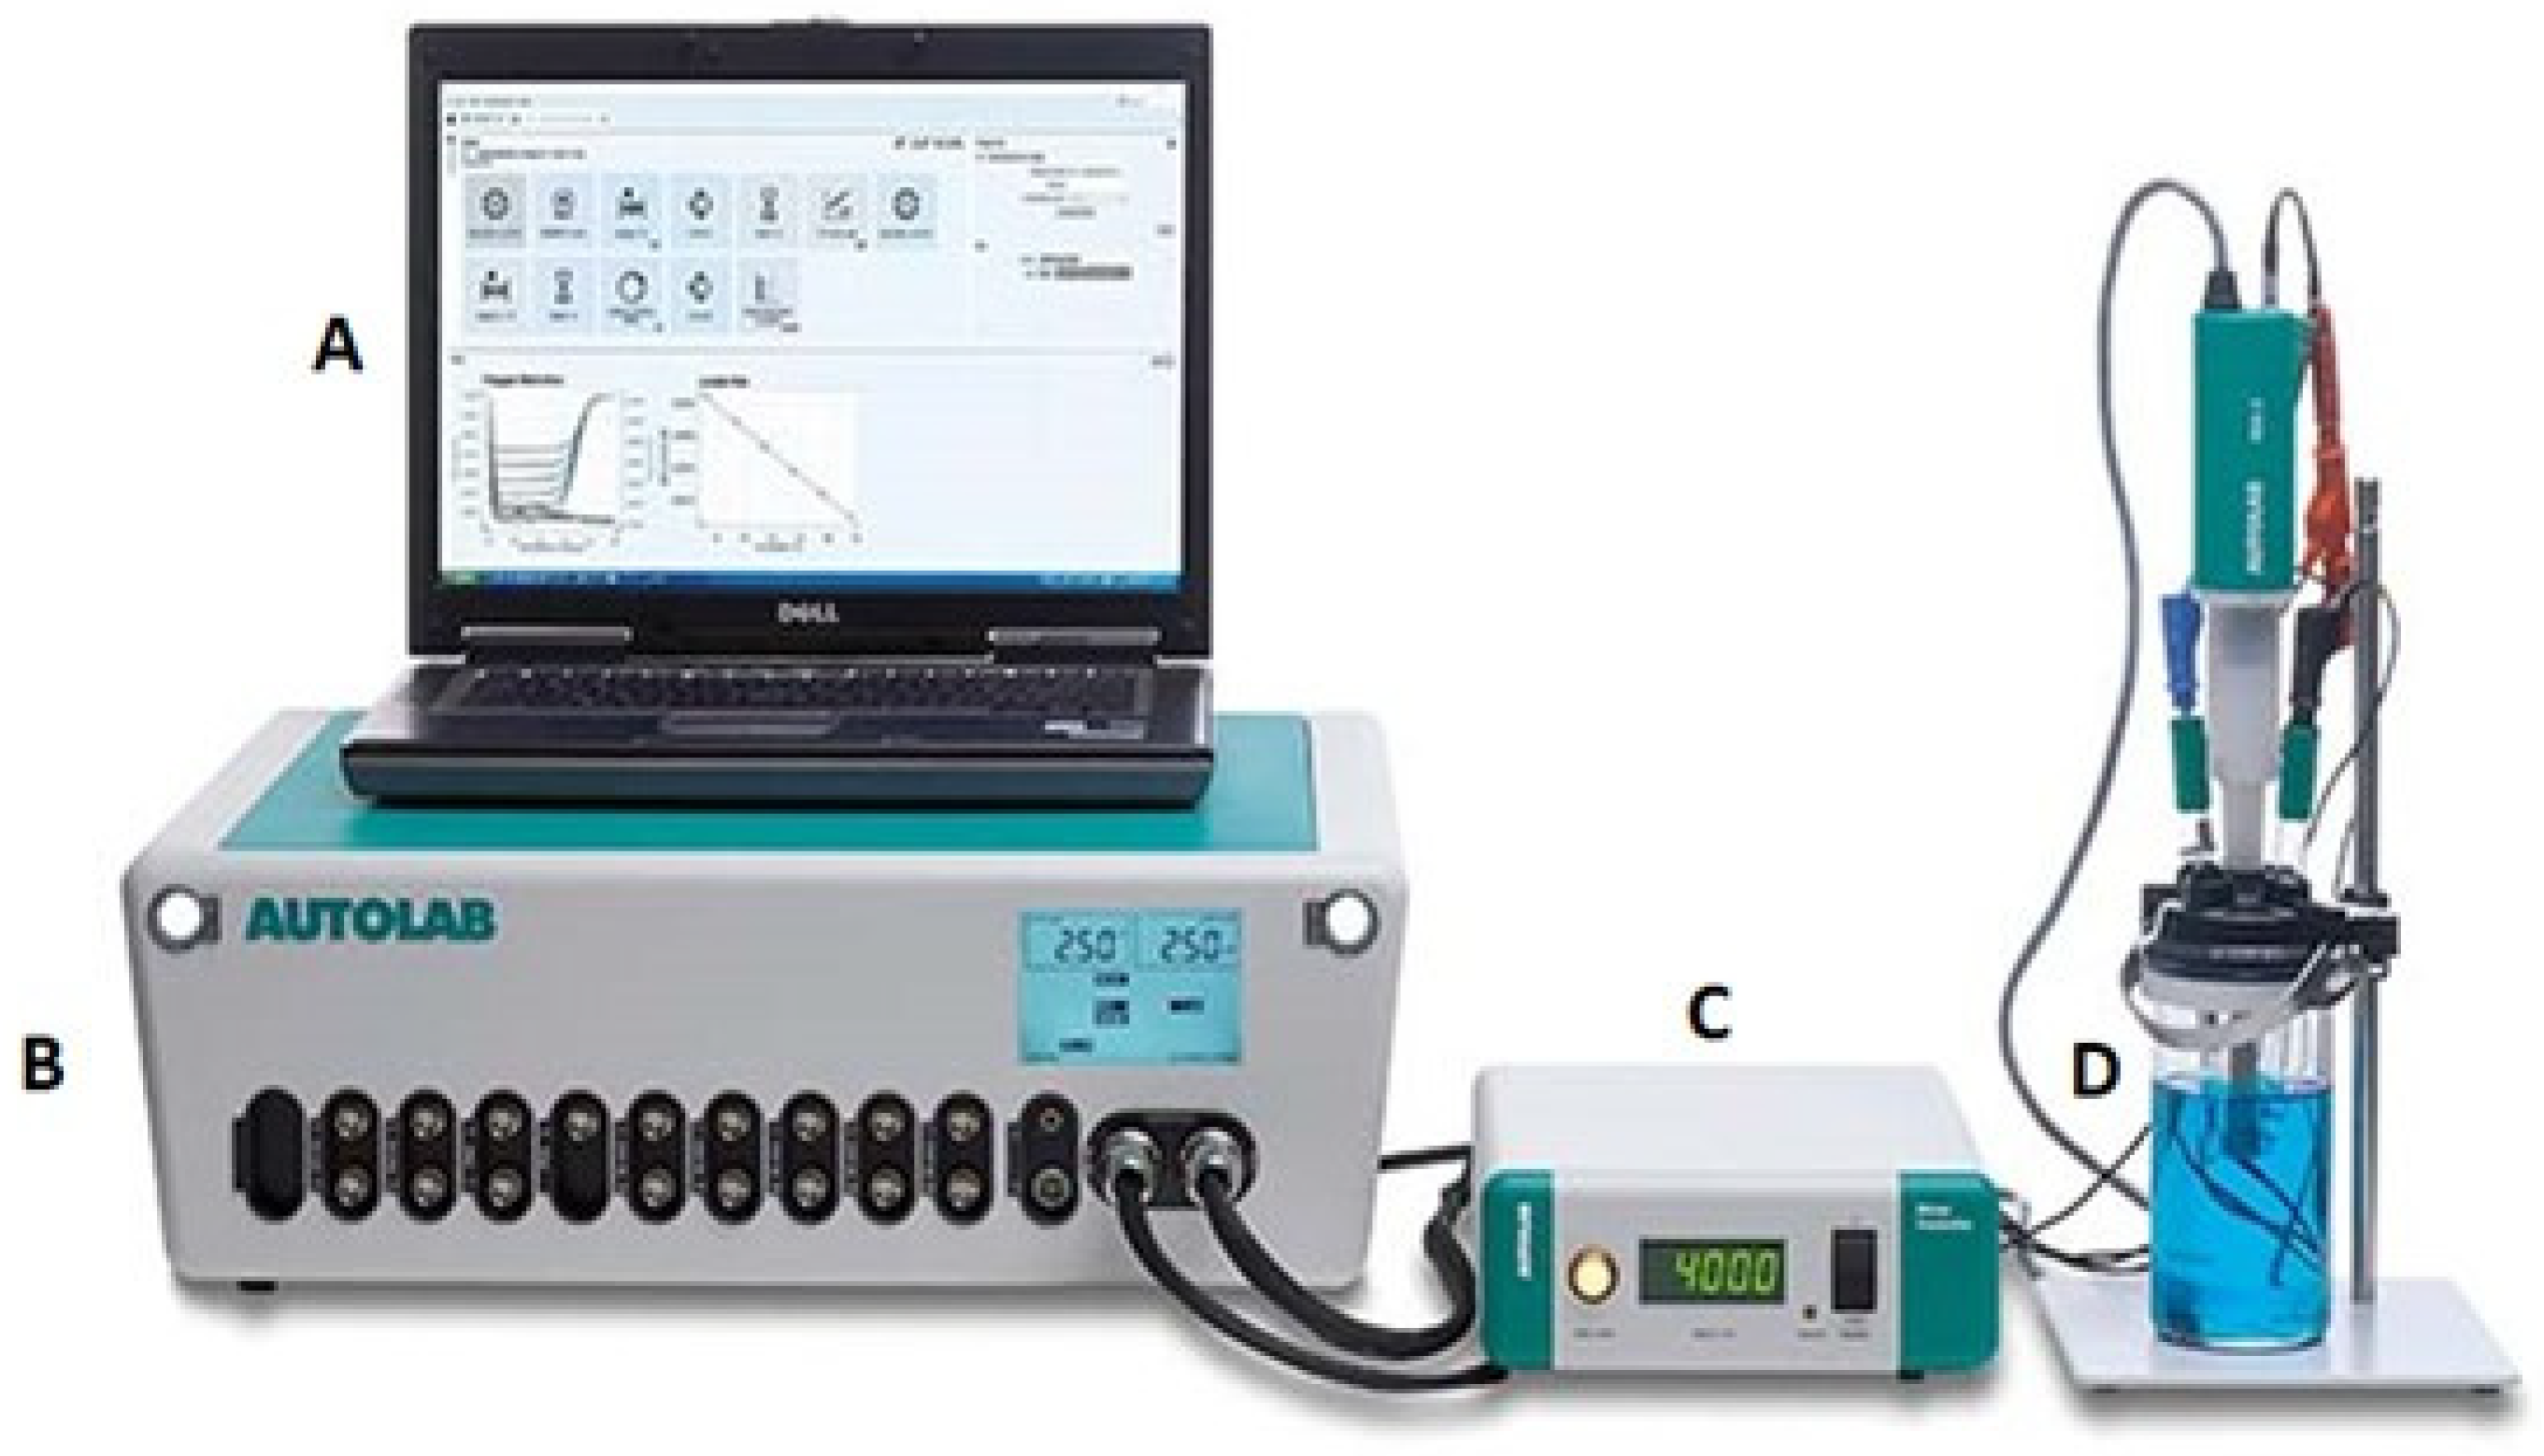
2.3.1. Electrochemical Setup

For electrochemical measurements as shown in Figure 1, a typical jacketed three-electrode cell was employed. A Pt electrode and a saturated calomel electrode (SCE) were used as the auxiliary electrode and a reference electrode, respectively. All potentials were referred to on the SCE potential scale. A potentiostat/galvanostat AUTOLAB (PGSTAT30, Metrohm, Herisau, Switzerland) was used in conjunction with an Autolab frequency response analyzer (FRA) with FRA2 module linked to a PC for electrochemical studies. For each run, there were 200 mL of the test solution inside the inner compartment of the cell. The volume of the test solution was great enough to withstand any considerable driftage in the composition during the run.
Prior to the electrochemical runs, the test solutions were deoxygenated for at least 30 min by bubbling Ar through them. With the use of a temperature-controlled bath and water flowing through the outer cell jacket, the temperature was fixed at (25 °C ± 0.2 °C). At least three different experiments were conducted for each electrochemical run to guarantee that the results were repeatable. Although the corrosion resistance of the coatings usually evaluated by electrochemical techniques without and with lubricated conditions [28,29,30,31], the present work focused on corrosion tests without lubricating conditions. The information gathered was judged to be statistically significant. The arithmetic mean and standard deviation were calculated and reported appropriately.

2.3.2. Uniform Corrosion Studies

A combination of two d.c. electrochemical techniques, namely linear polarization resistance (LPR) and Tafel polarization were utilized to analyze the uniform corrosion behavior of the studied alloys. After stabilizing the working electrode in the test solution for 2 h, LPR was conducted, which was then followed by Tafel polarization measurements. With an exceedingly slow potential scan rate of 0.167 mV s−1, LPR measurements were conducted by changing the potential of the working electrode linearly from −20 to +20 versus the corrosion potential (Ecorr). Once the LPR was completed, Tafel polarization measurements were conducted by polarizing the working electrode within the Tafel potential region (E = Ecorr ± 250 mV) and employing a potential sweep rate of 1.0 mV s−1.

3. Results and Discussion

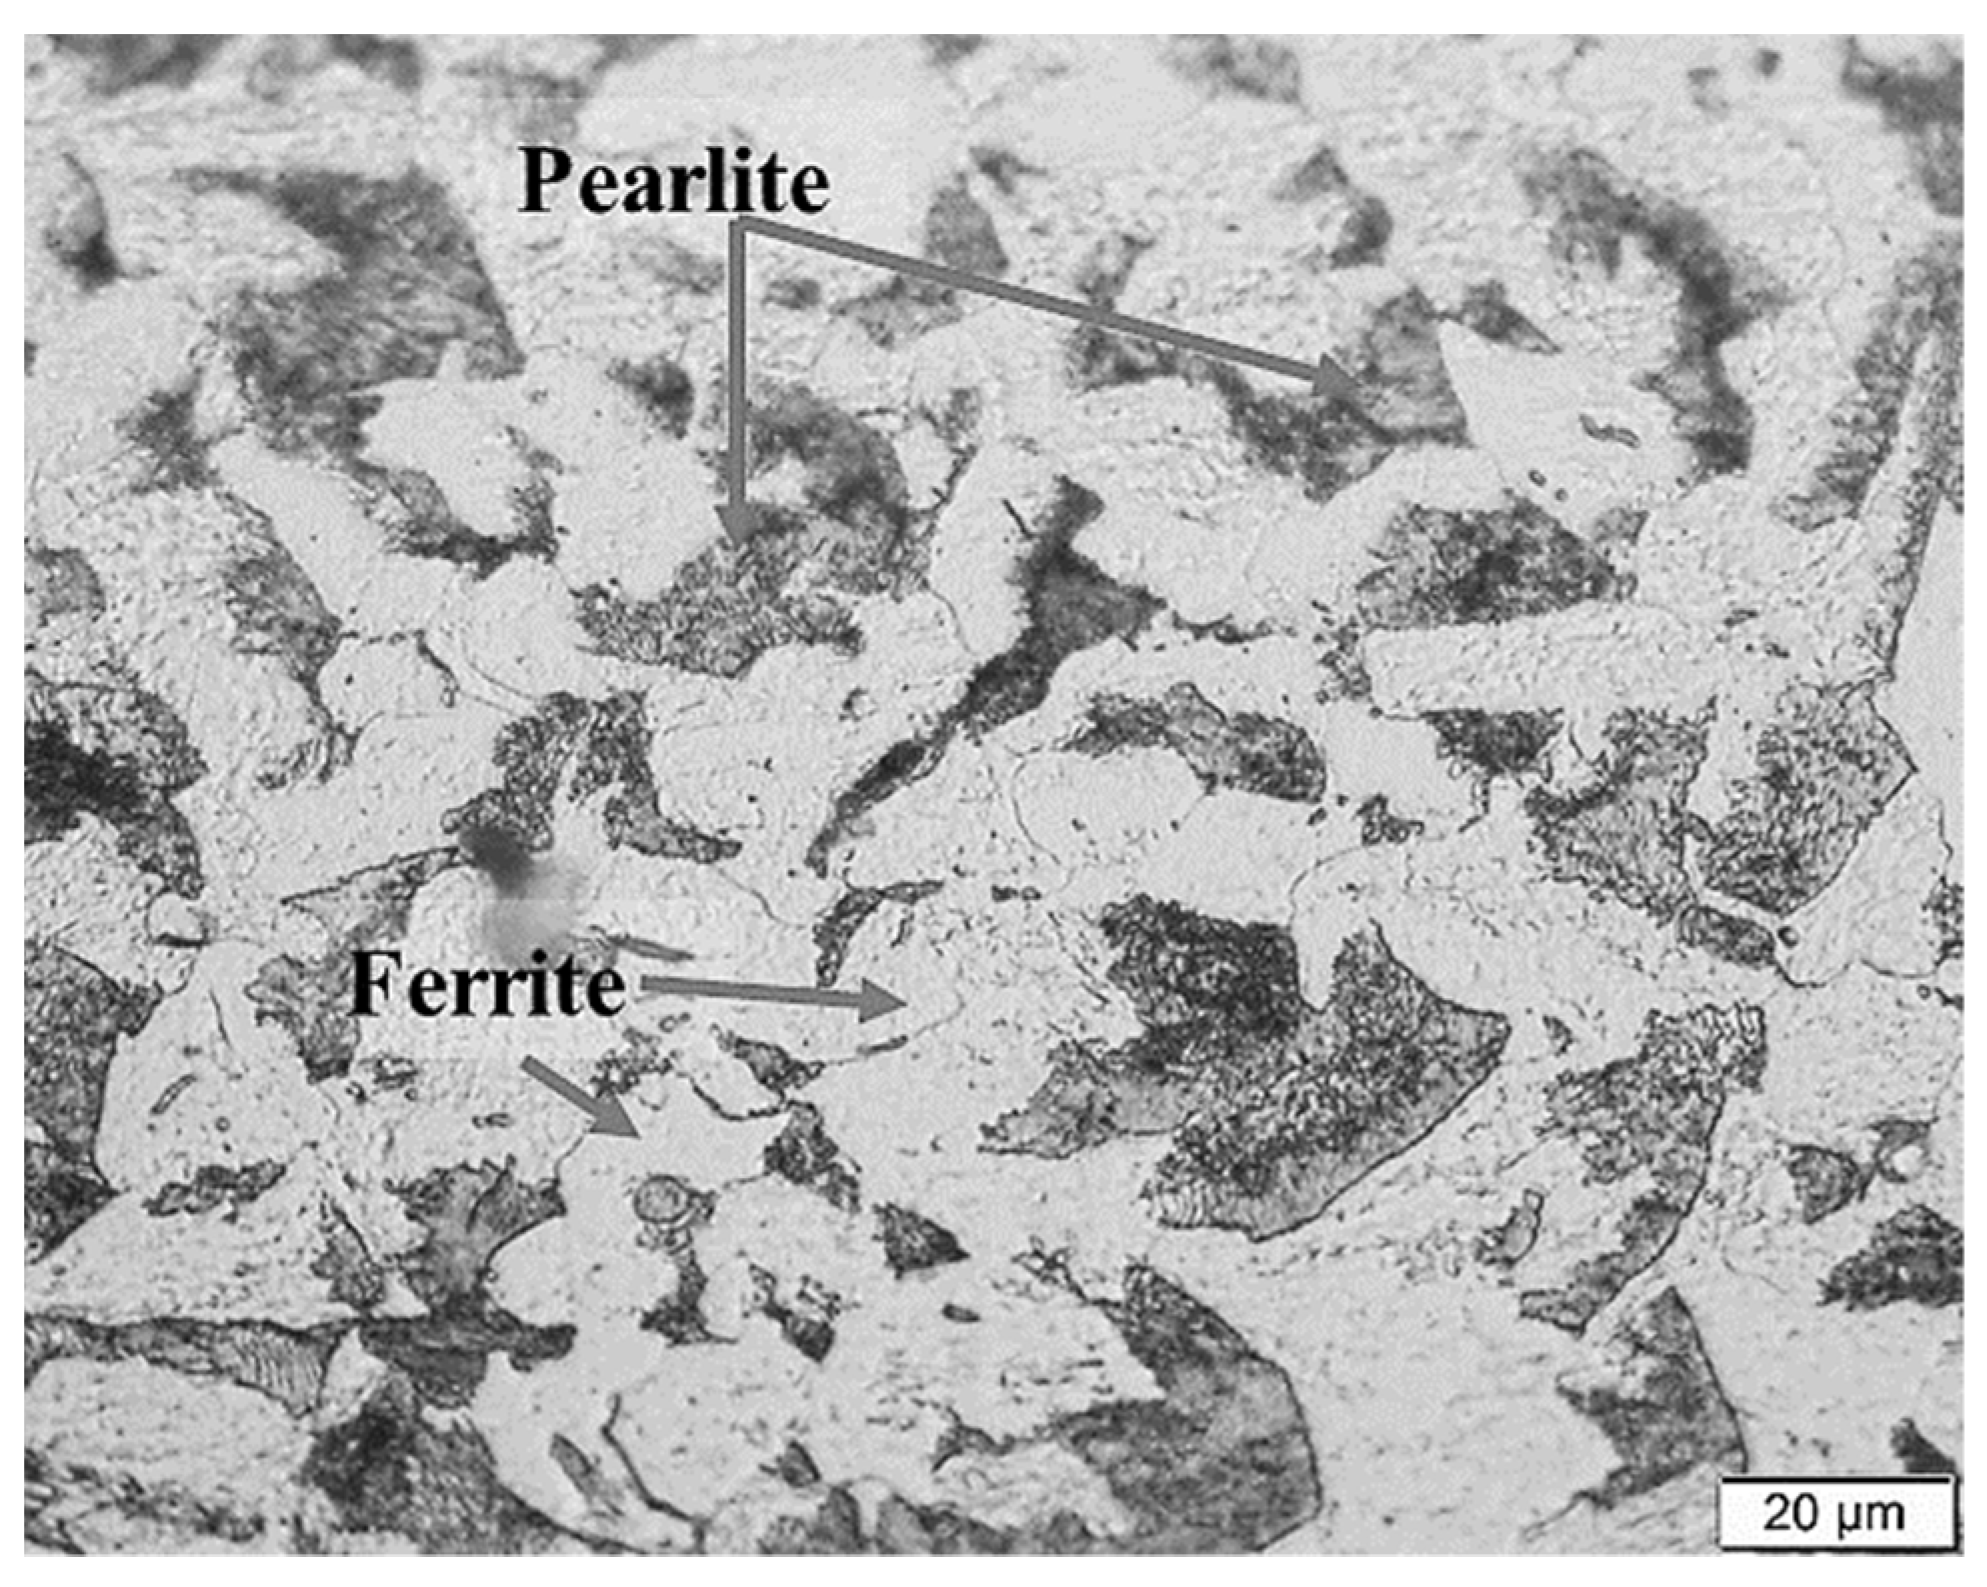
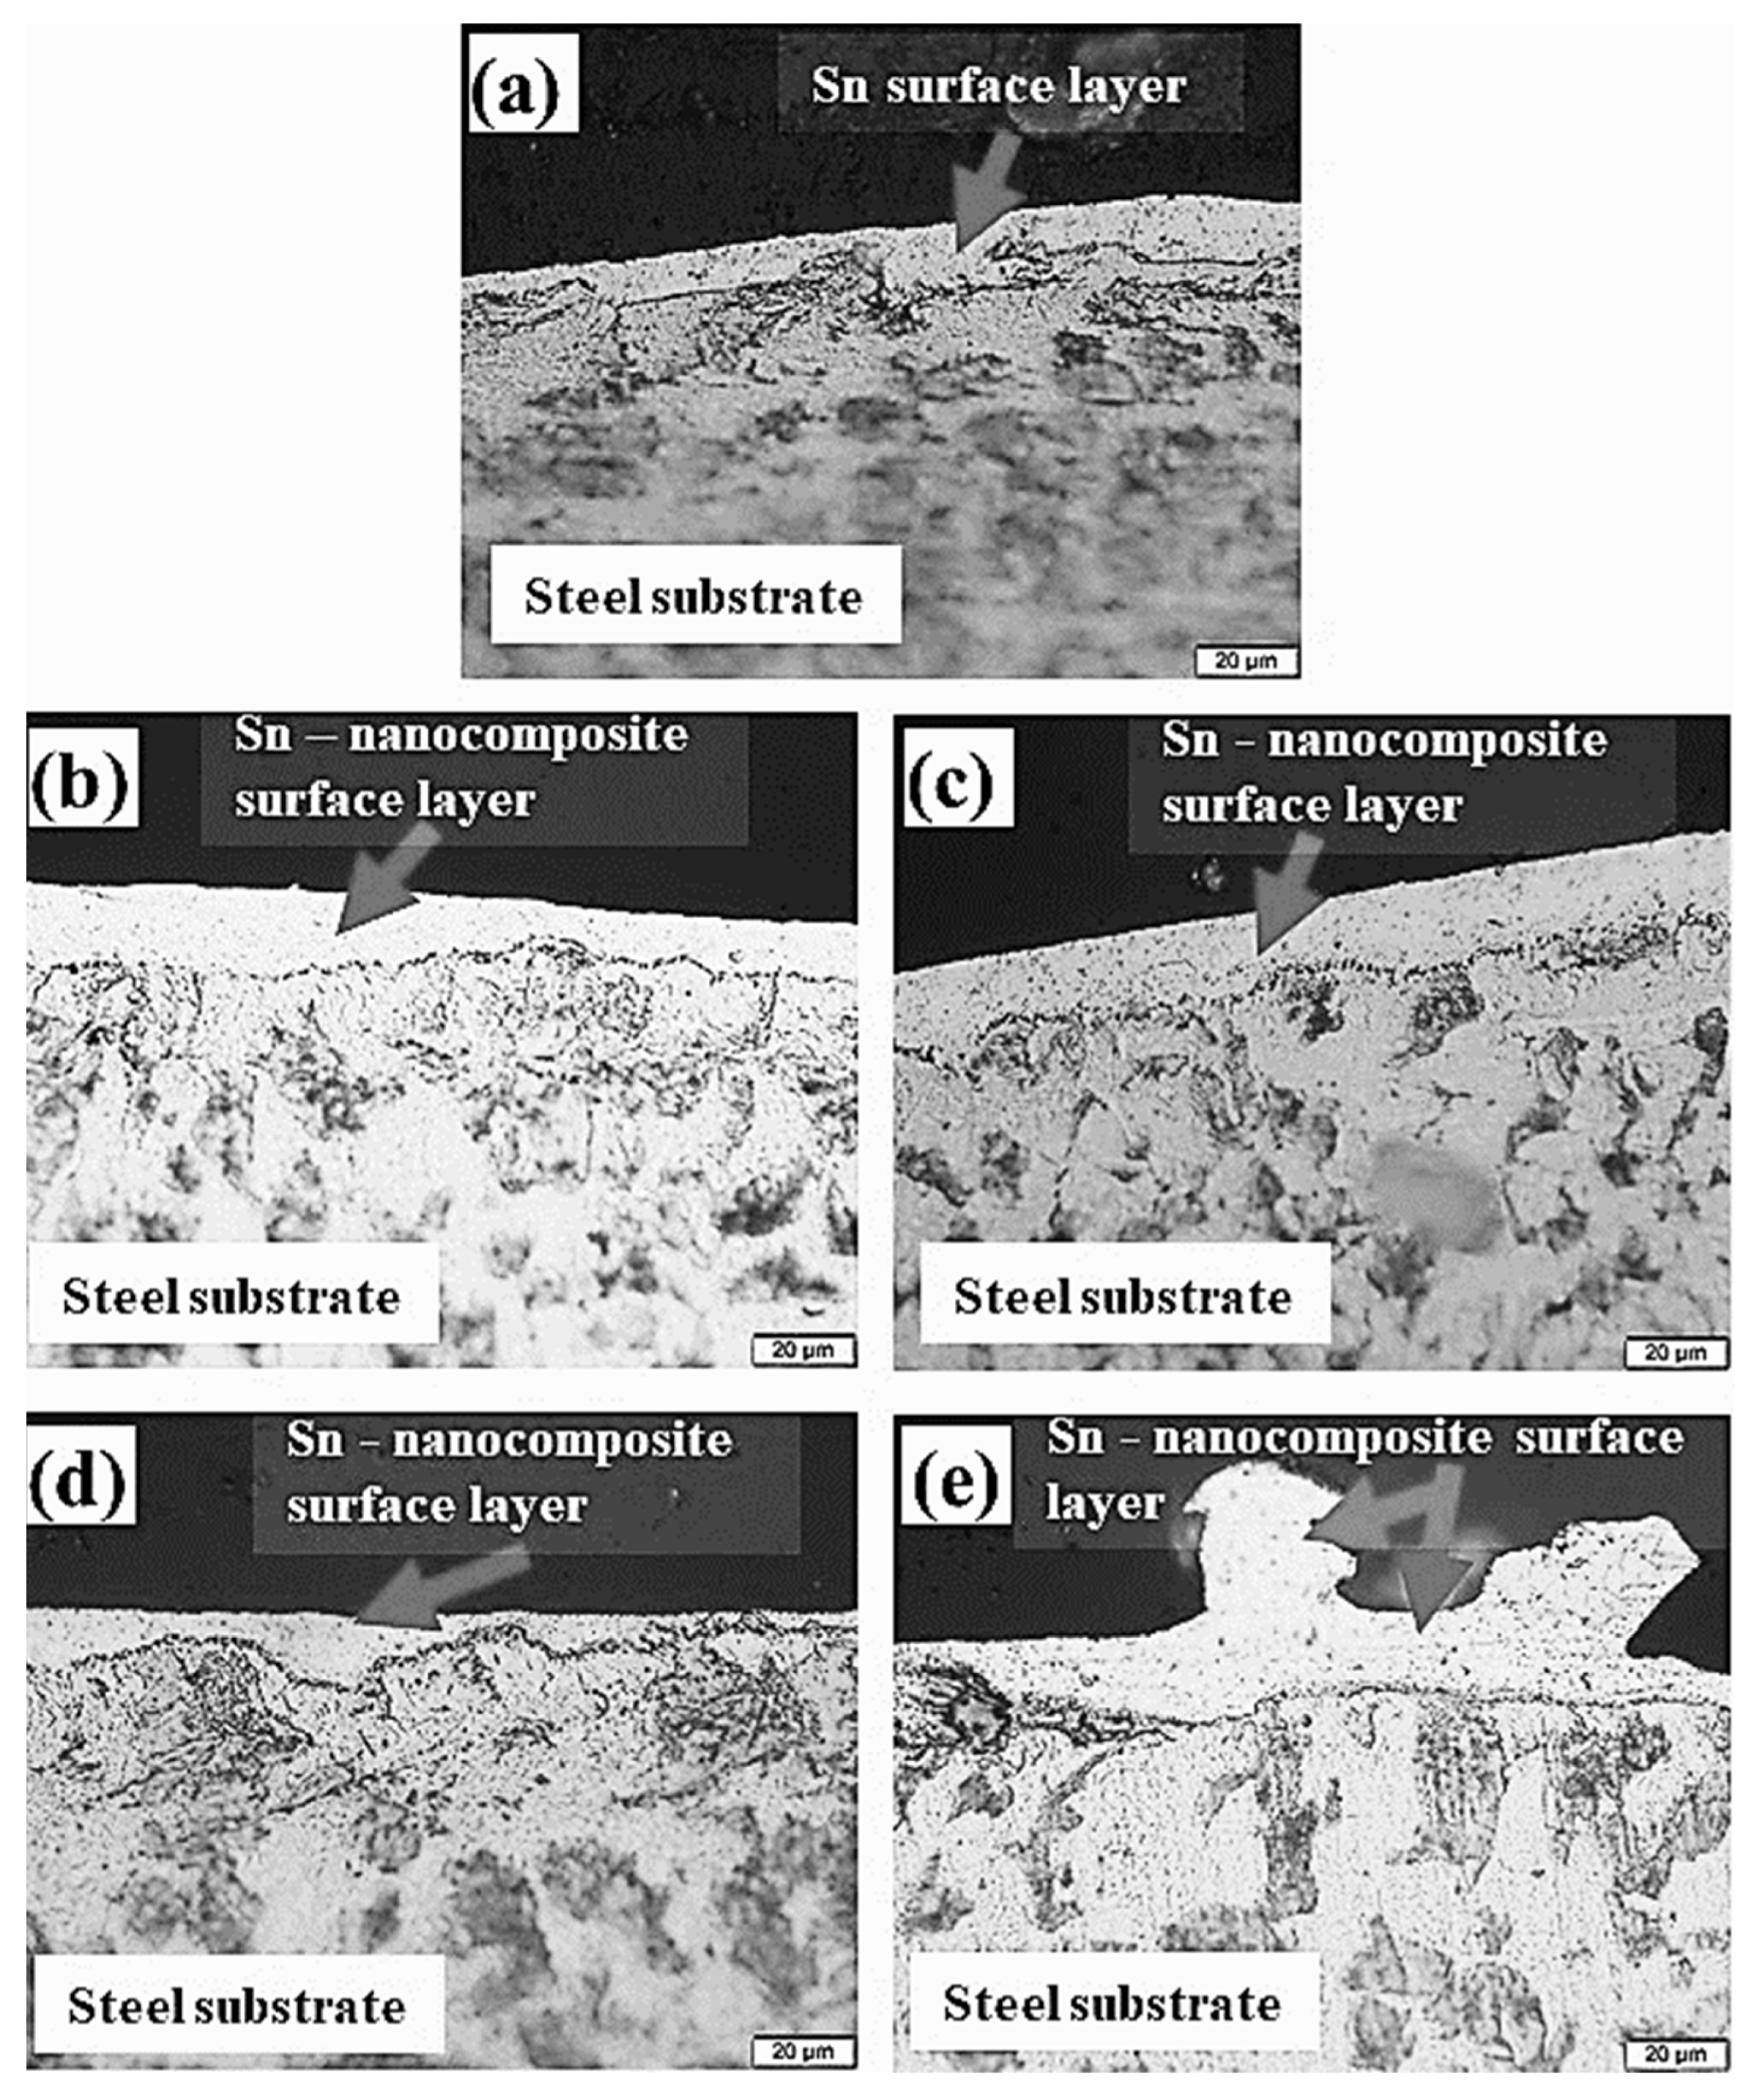
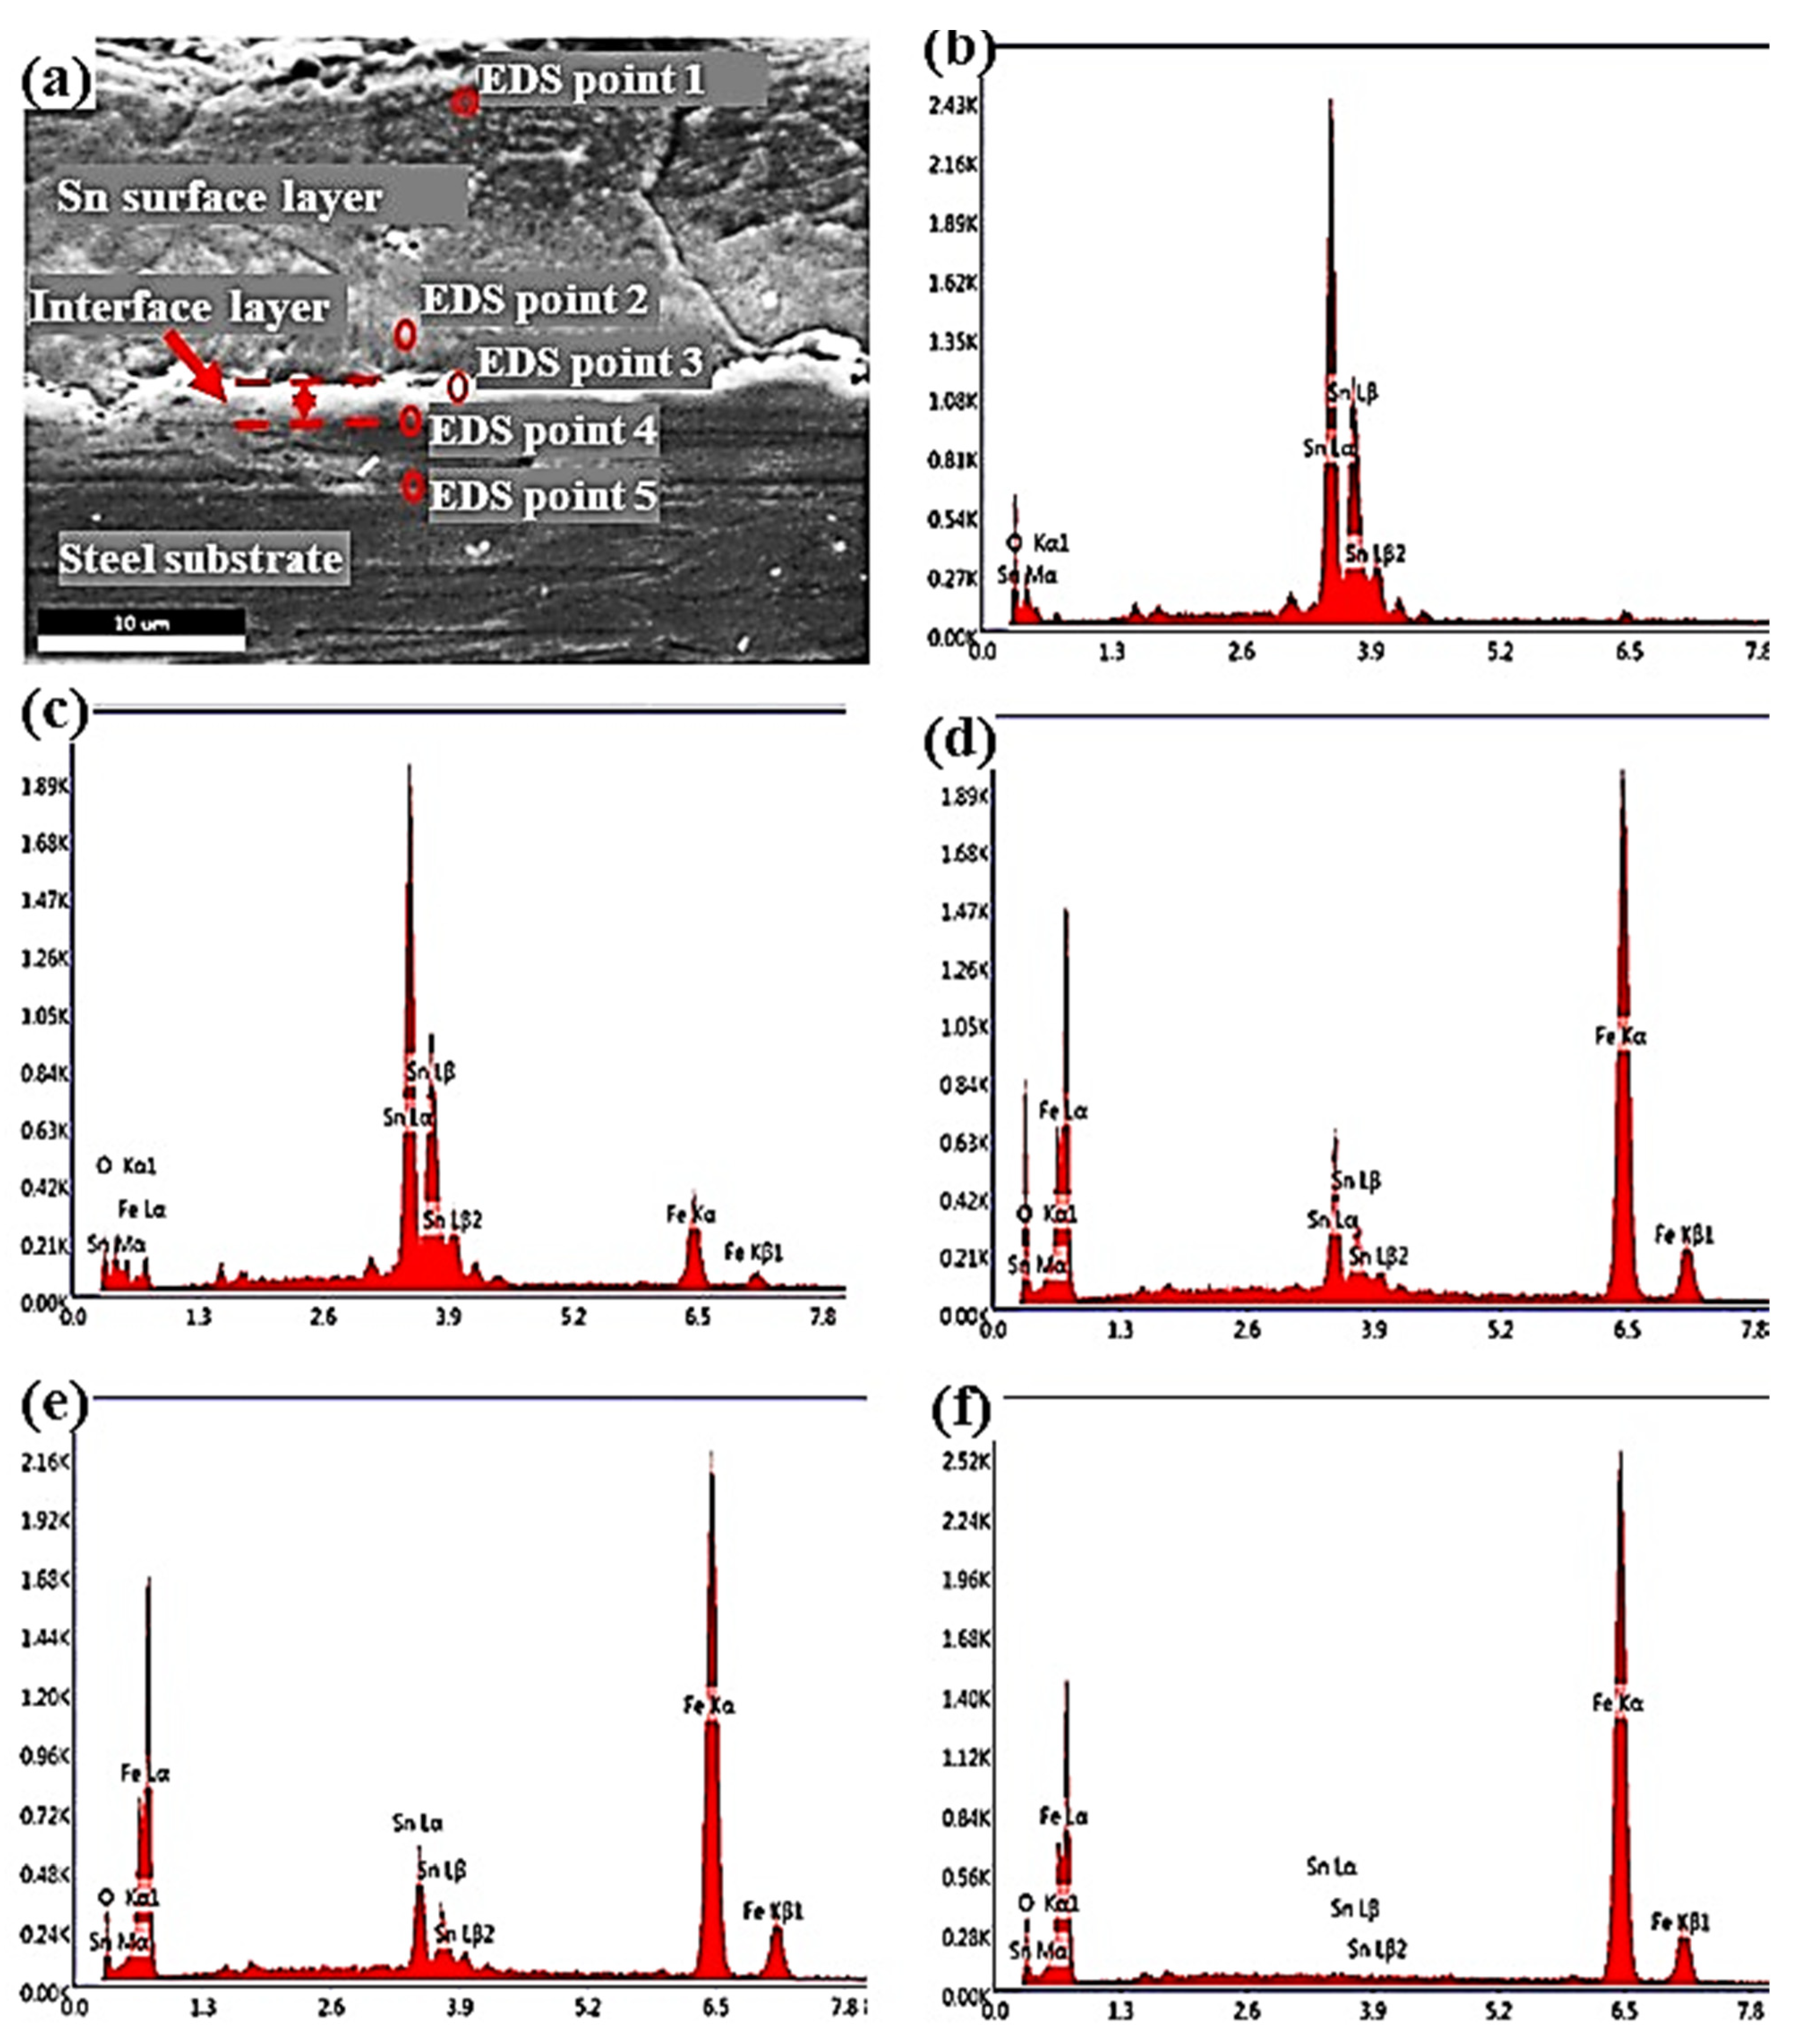
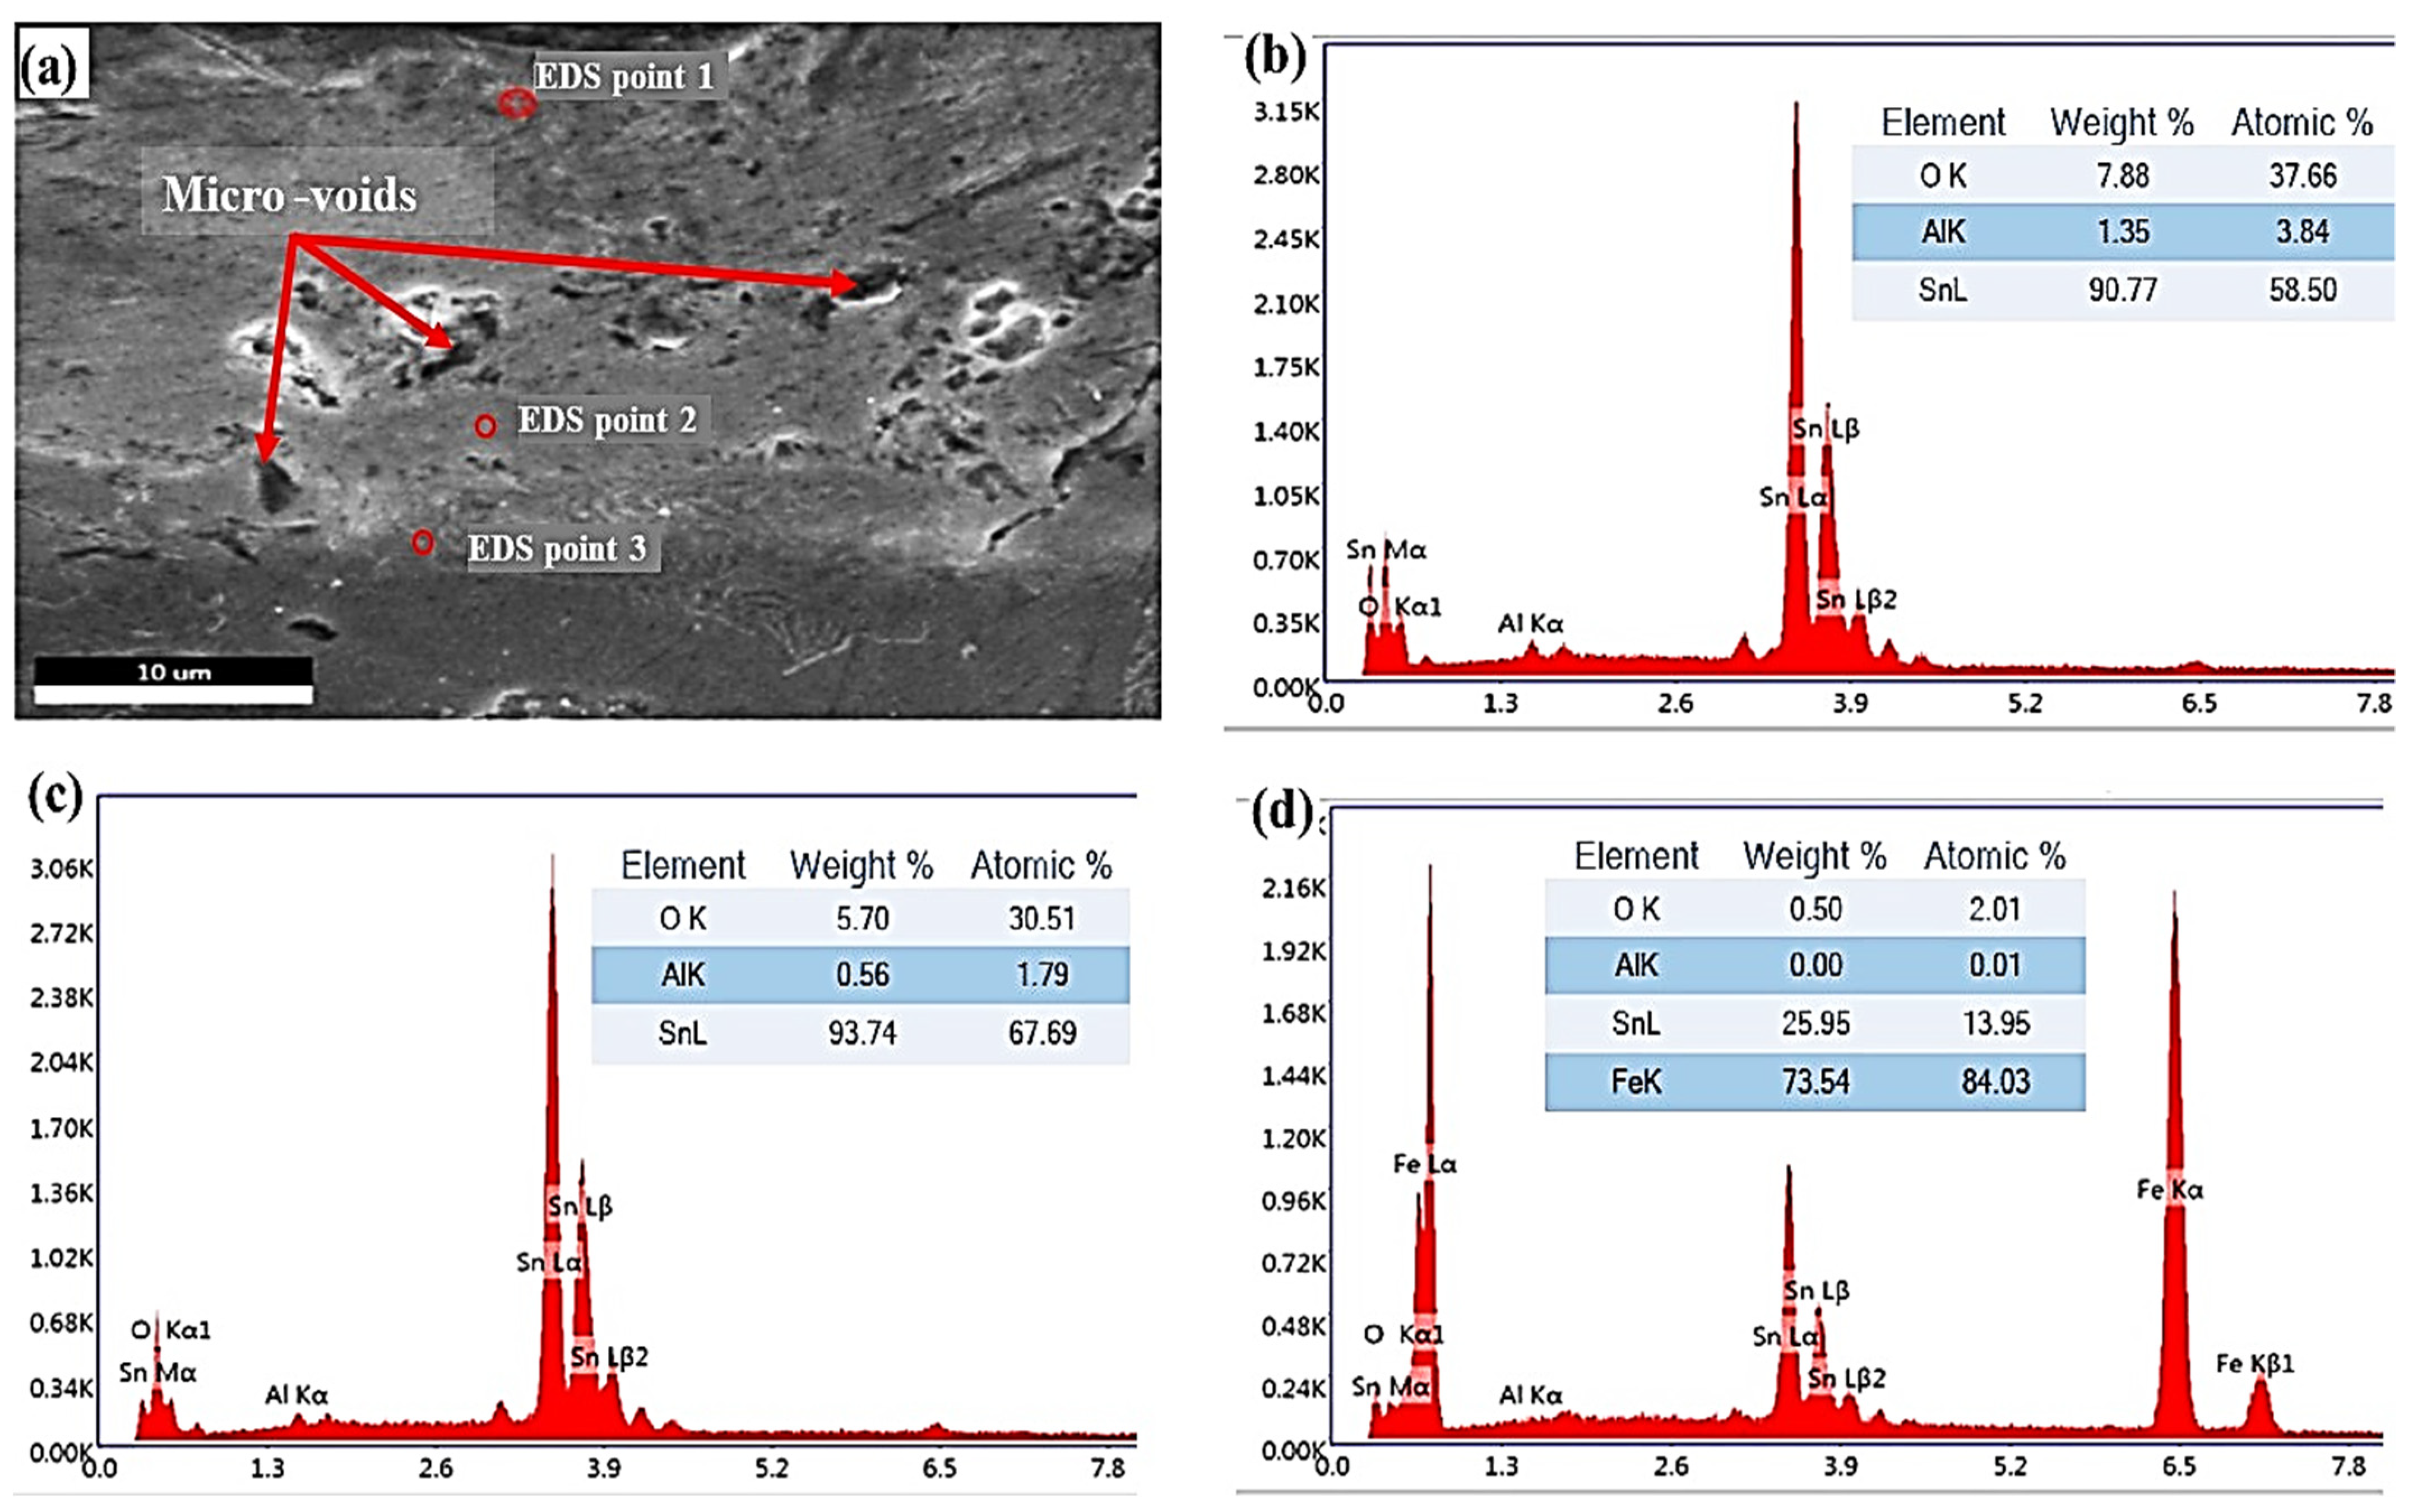
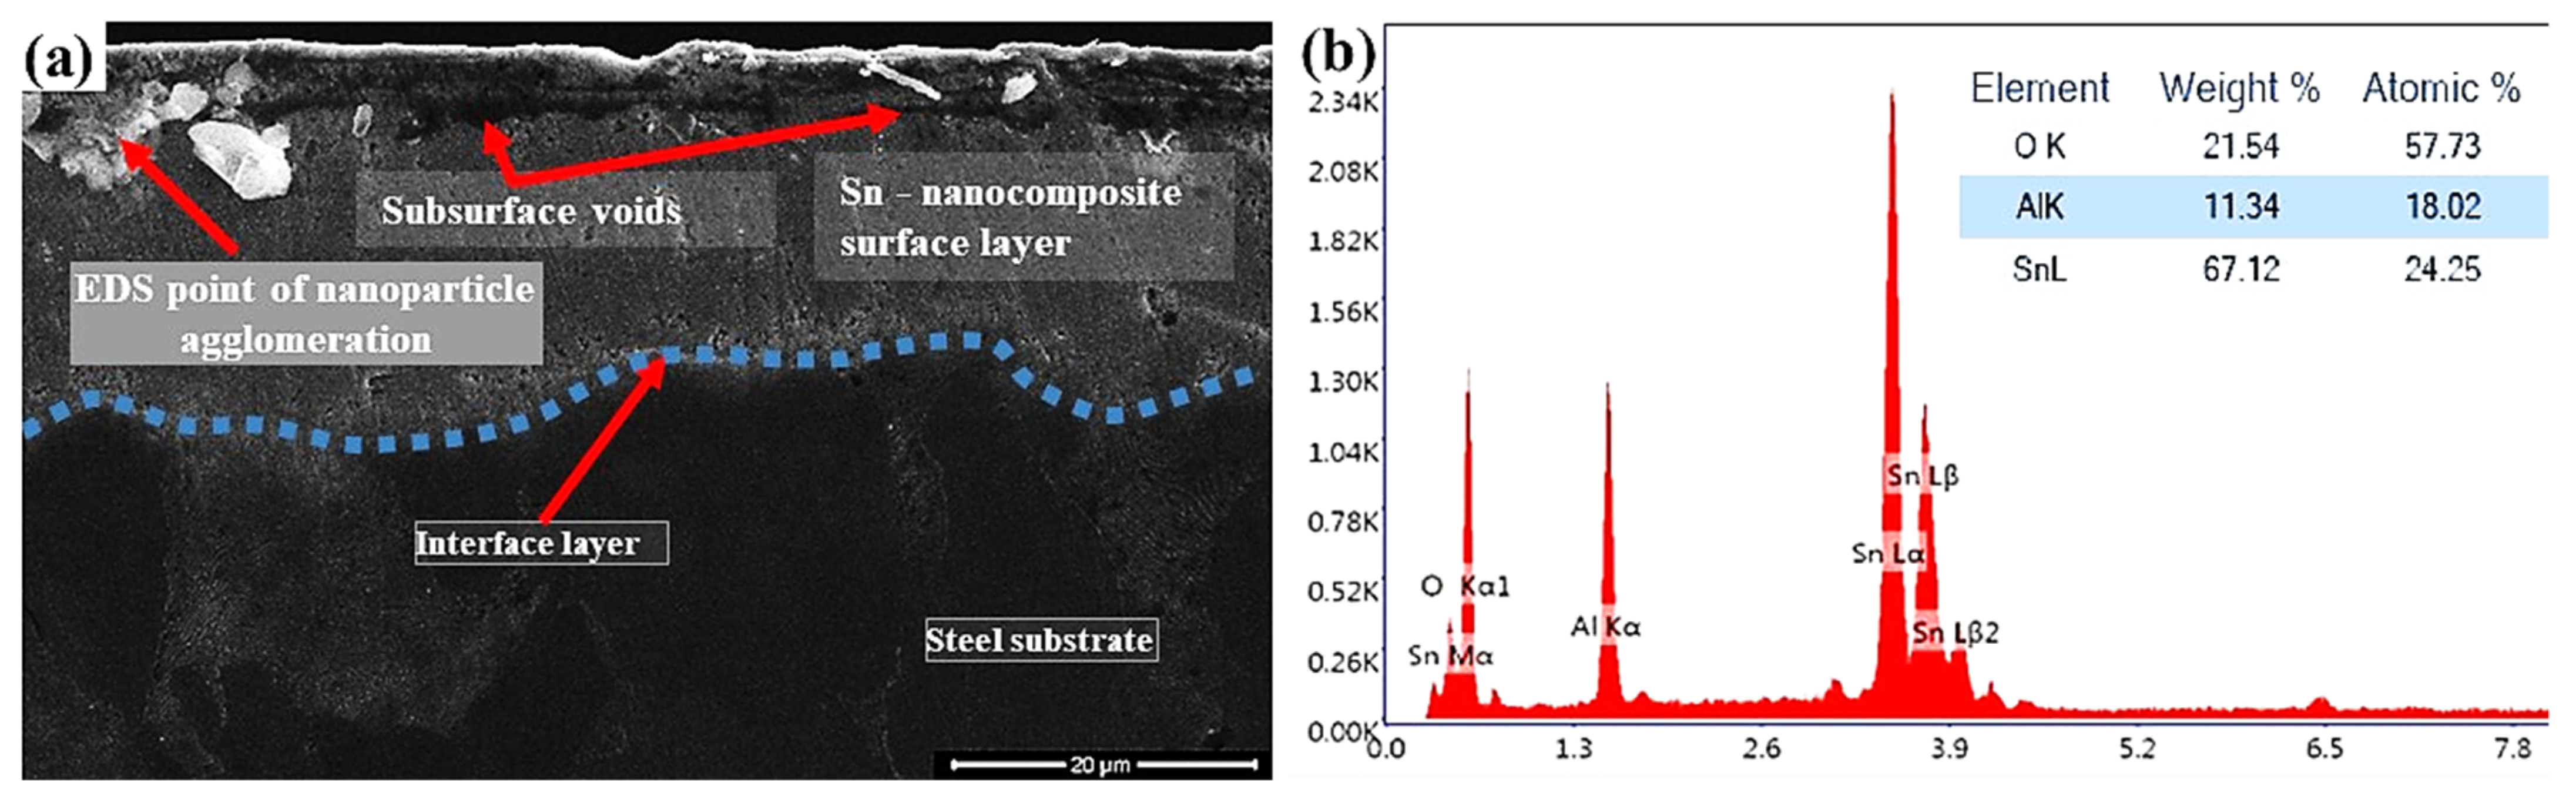
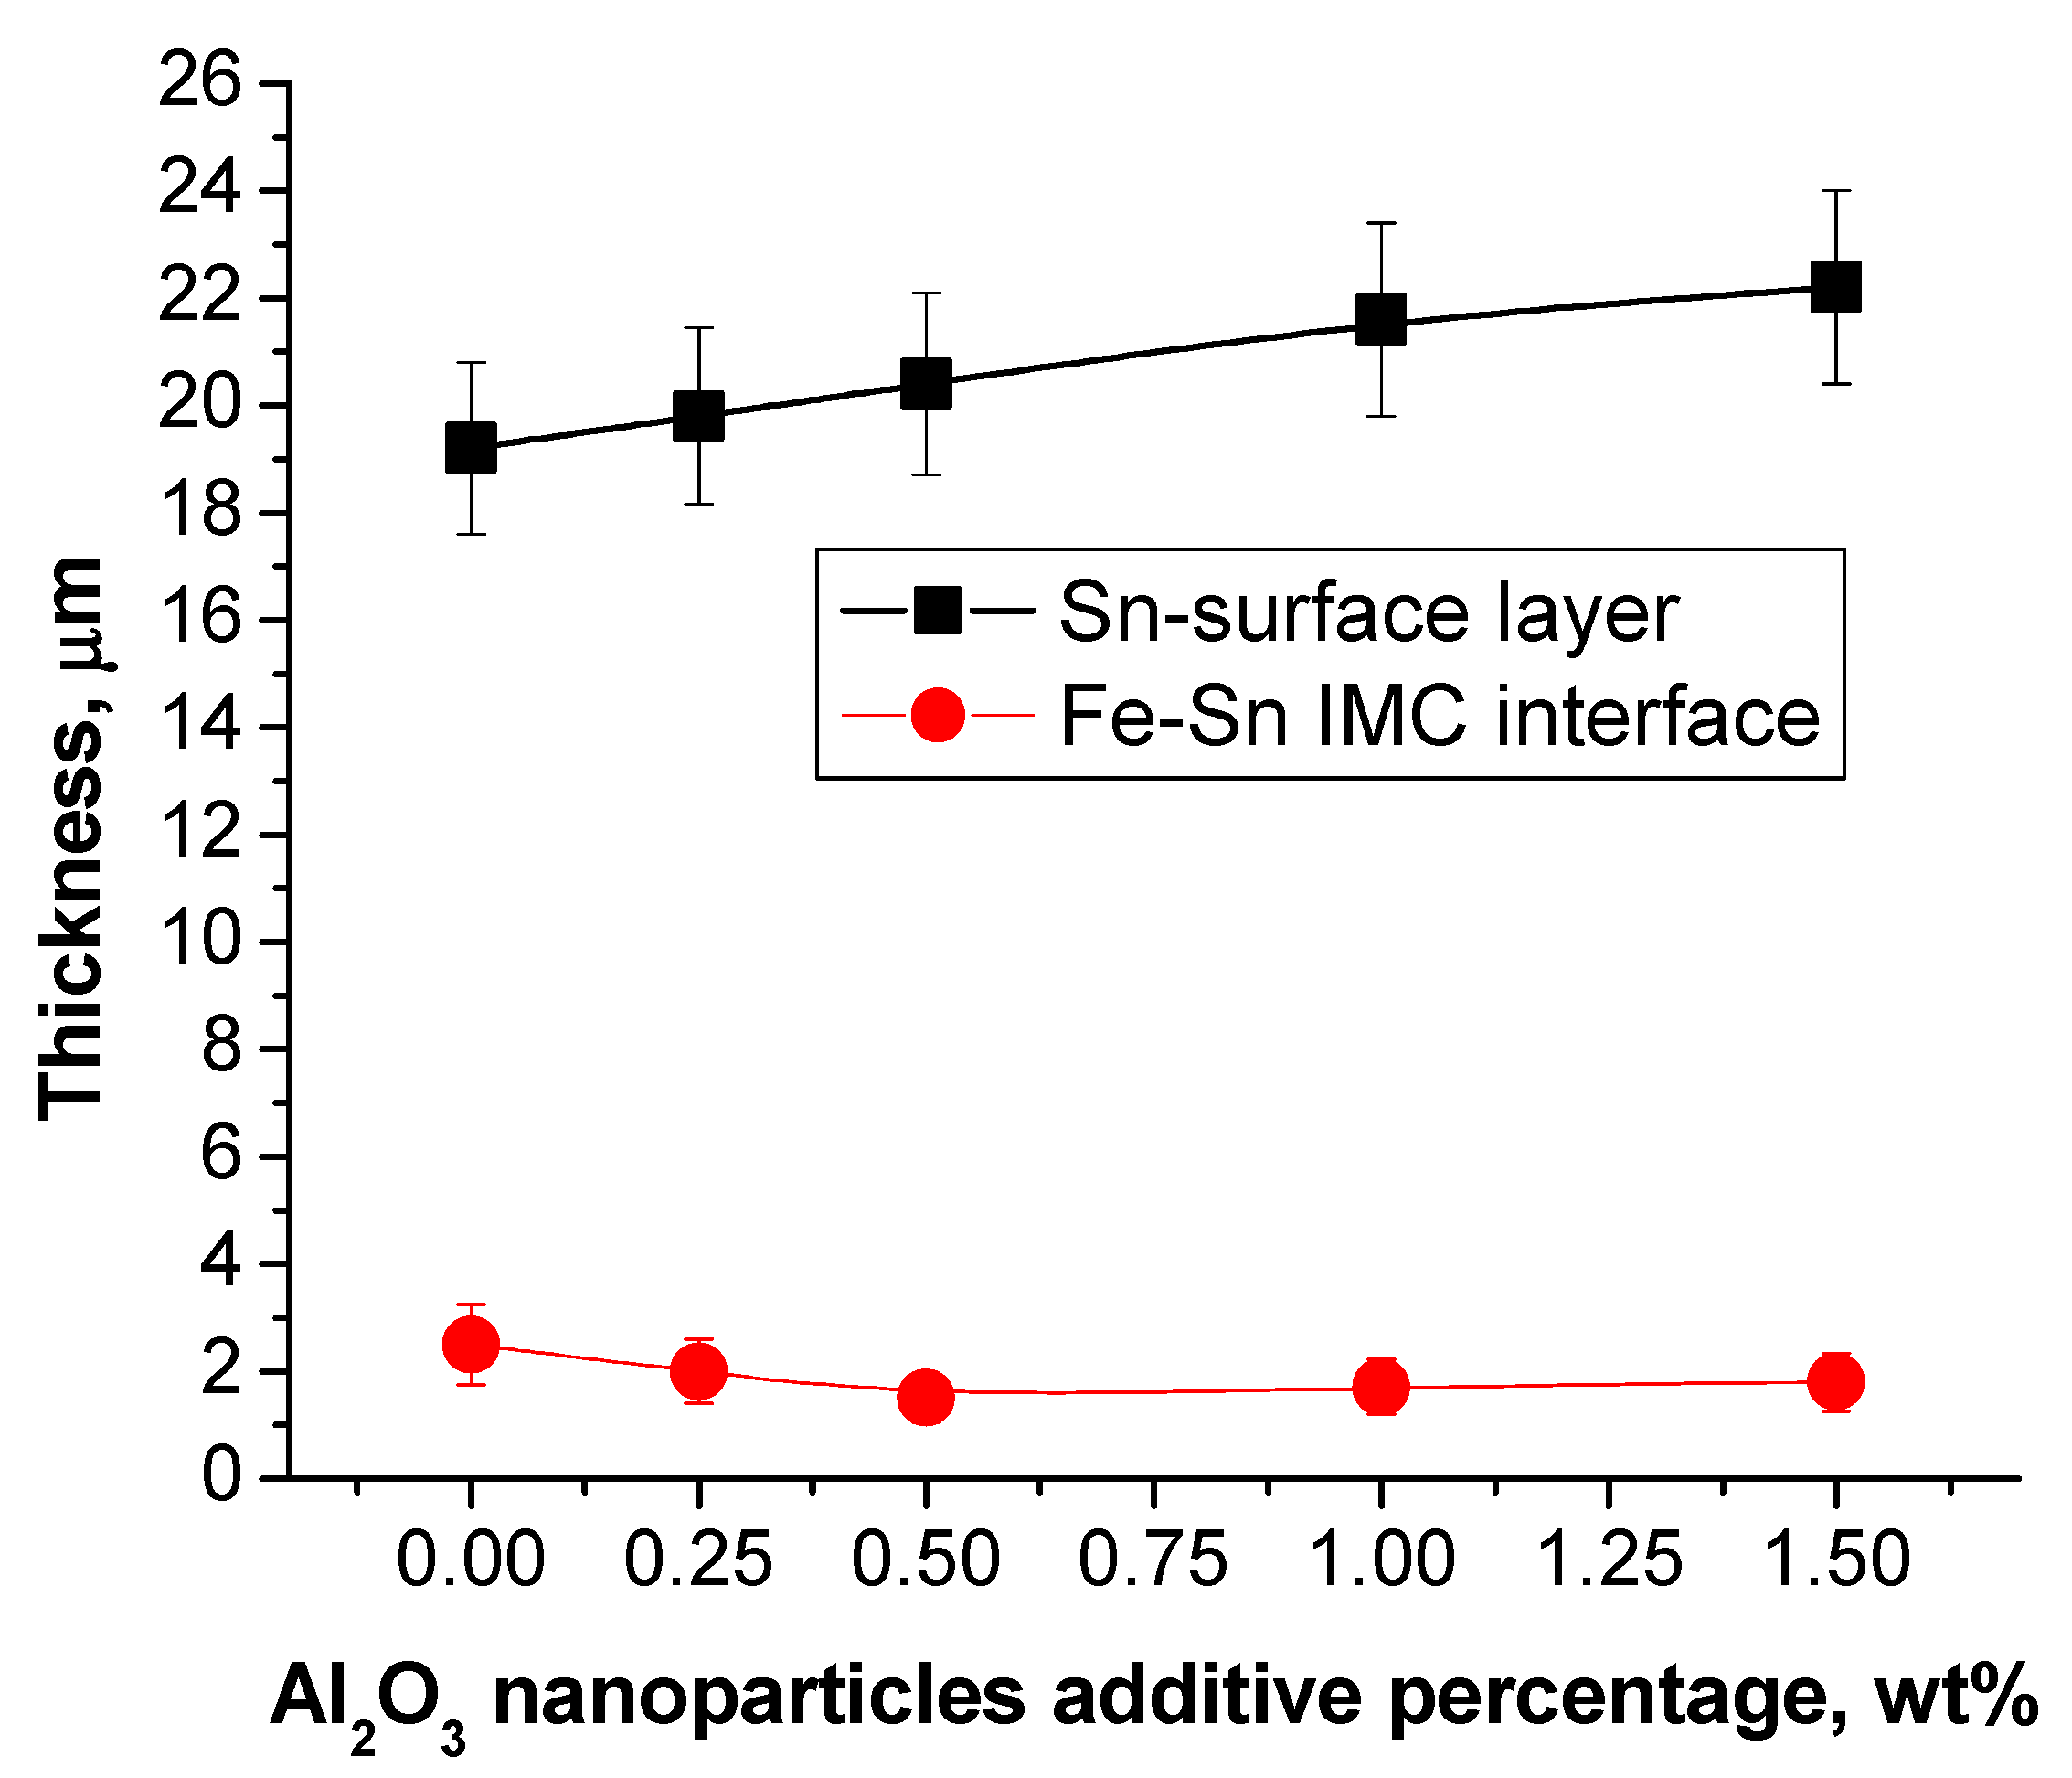
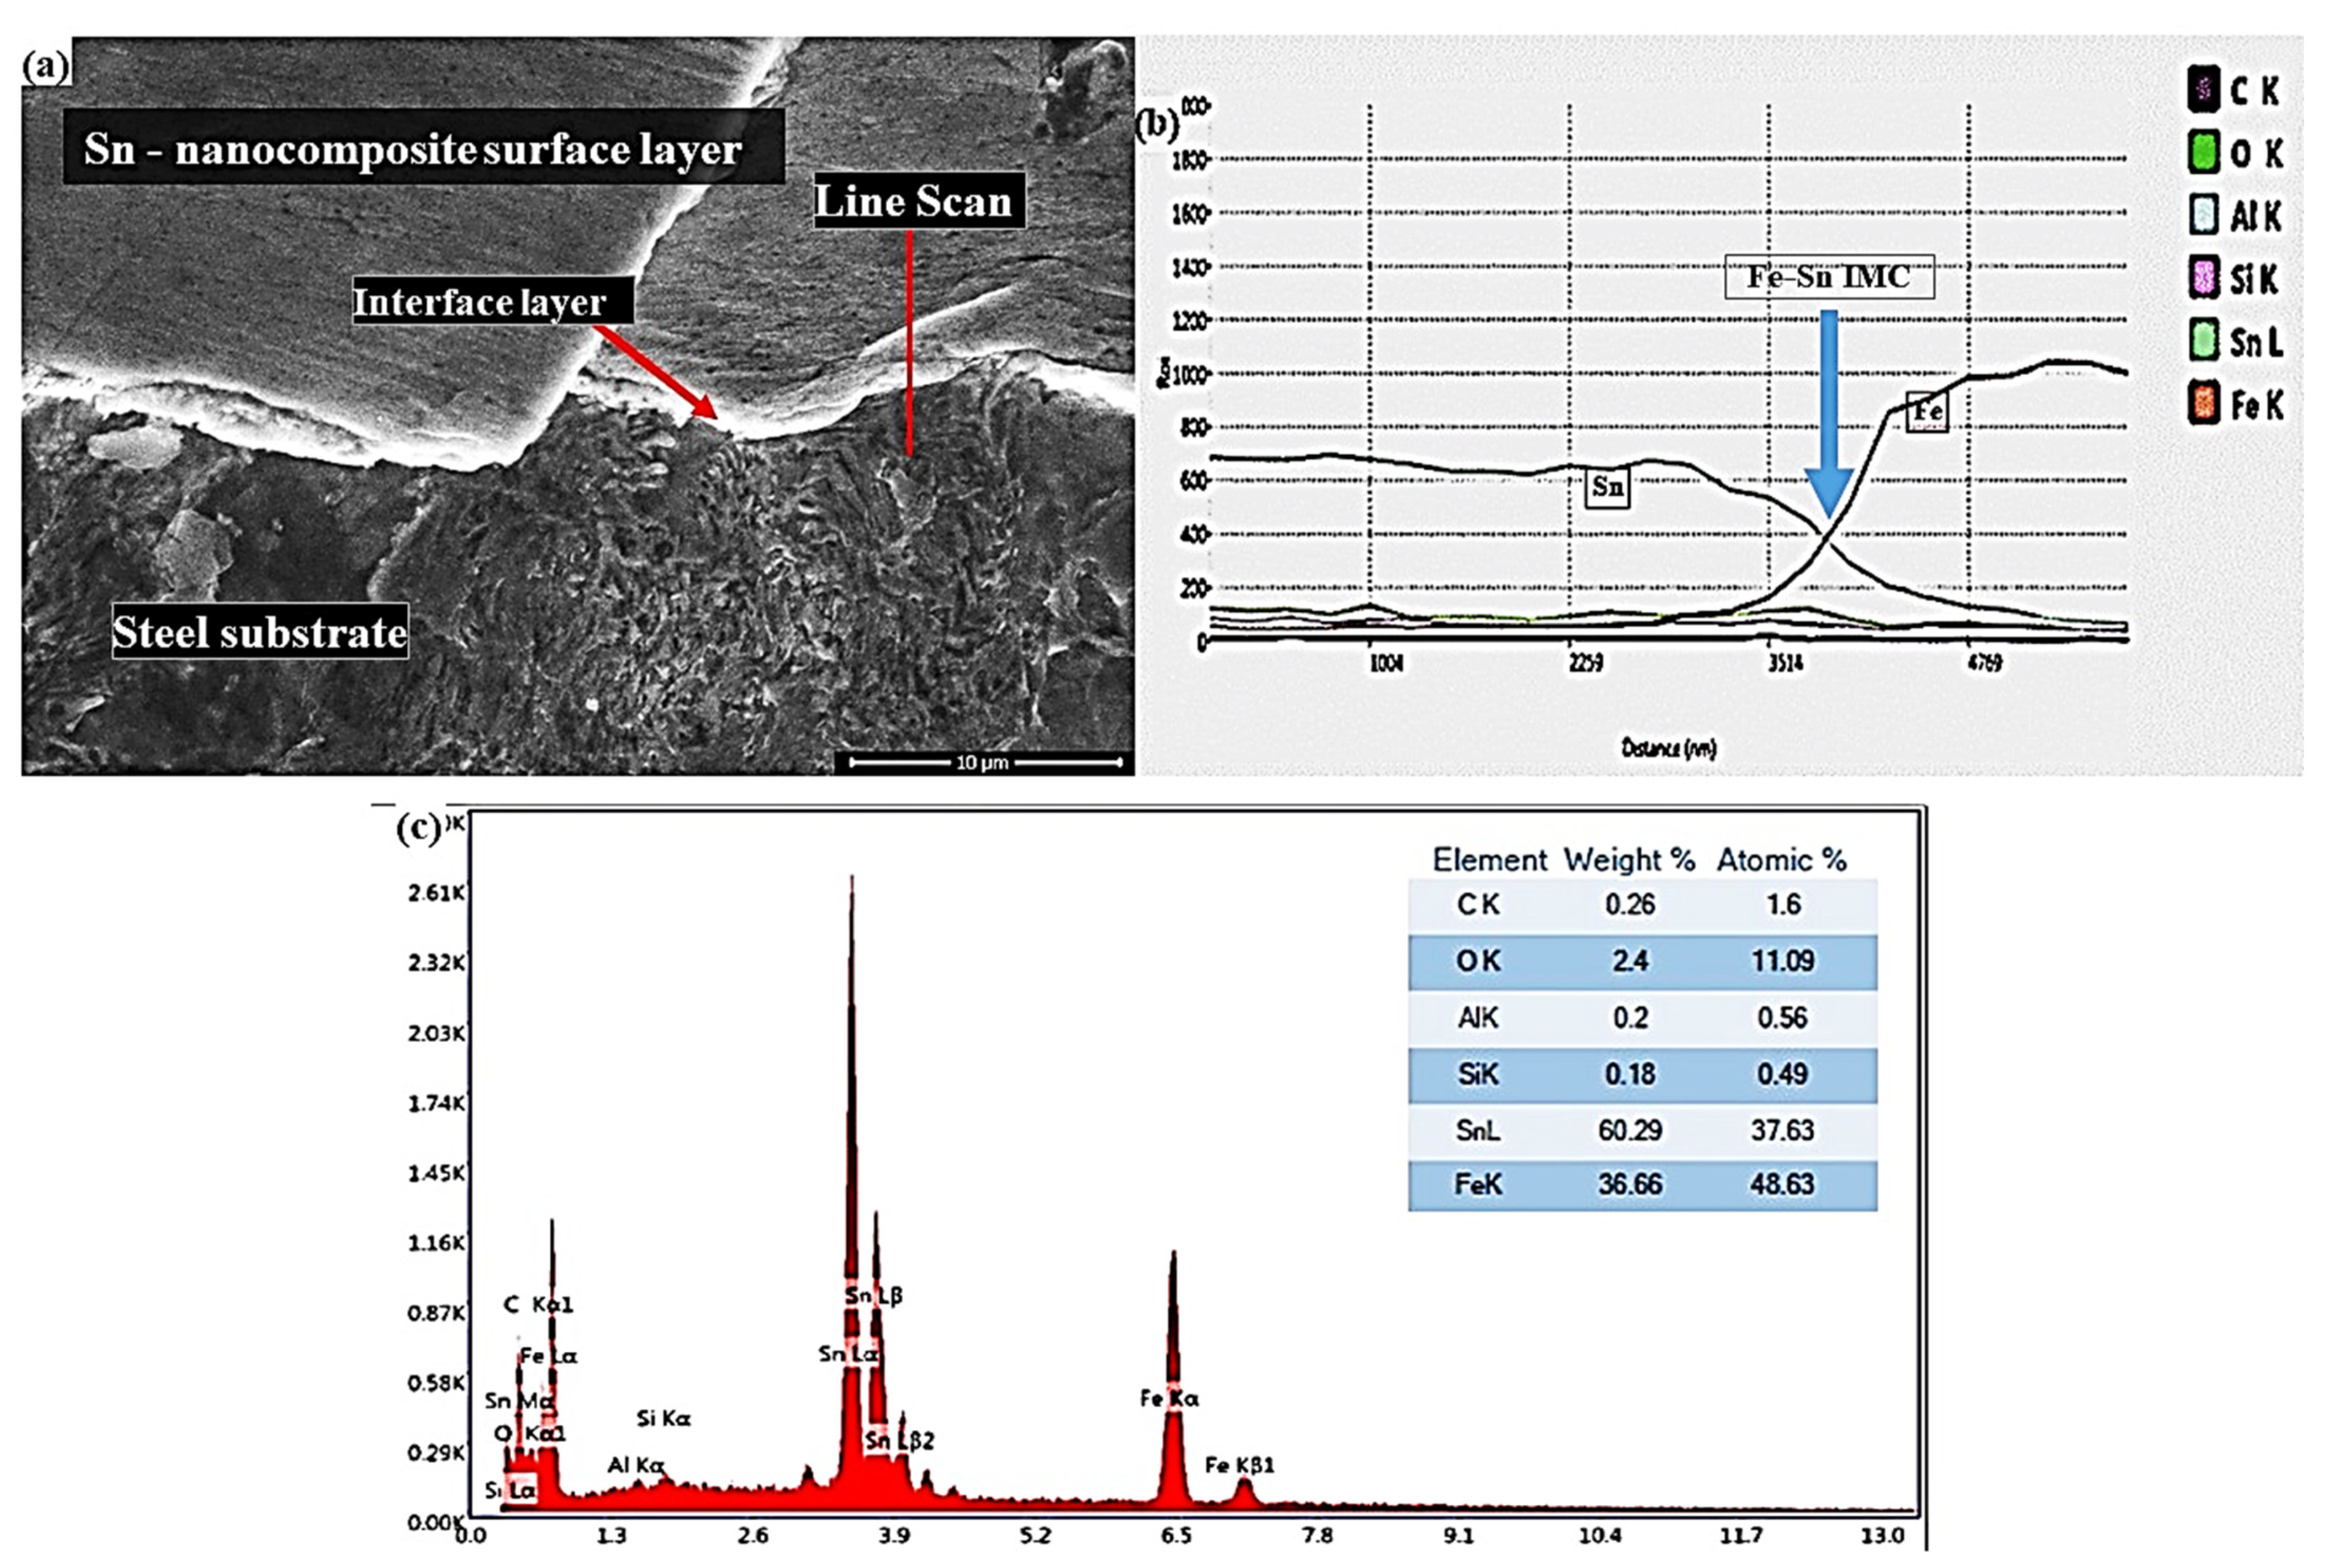
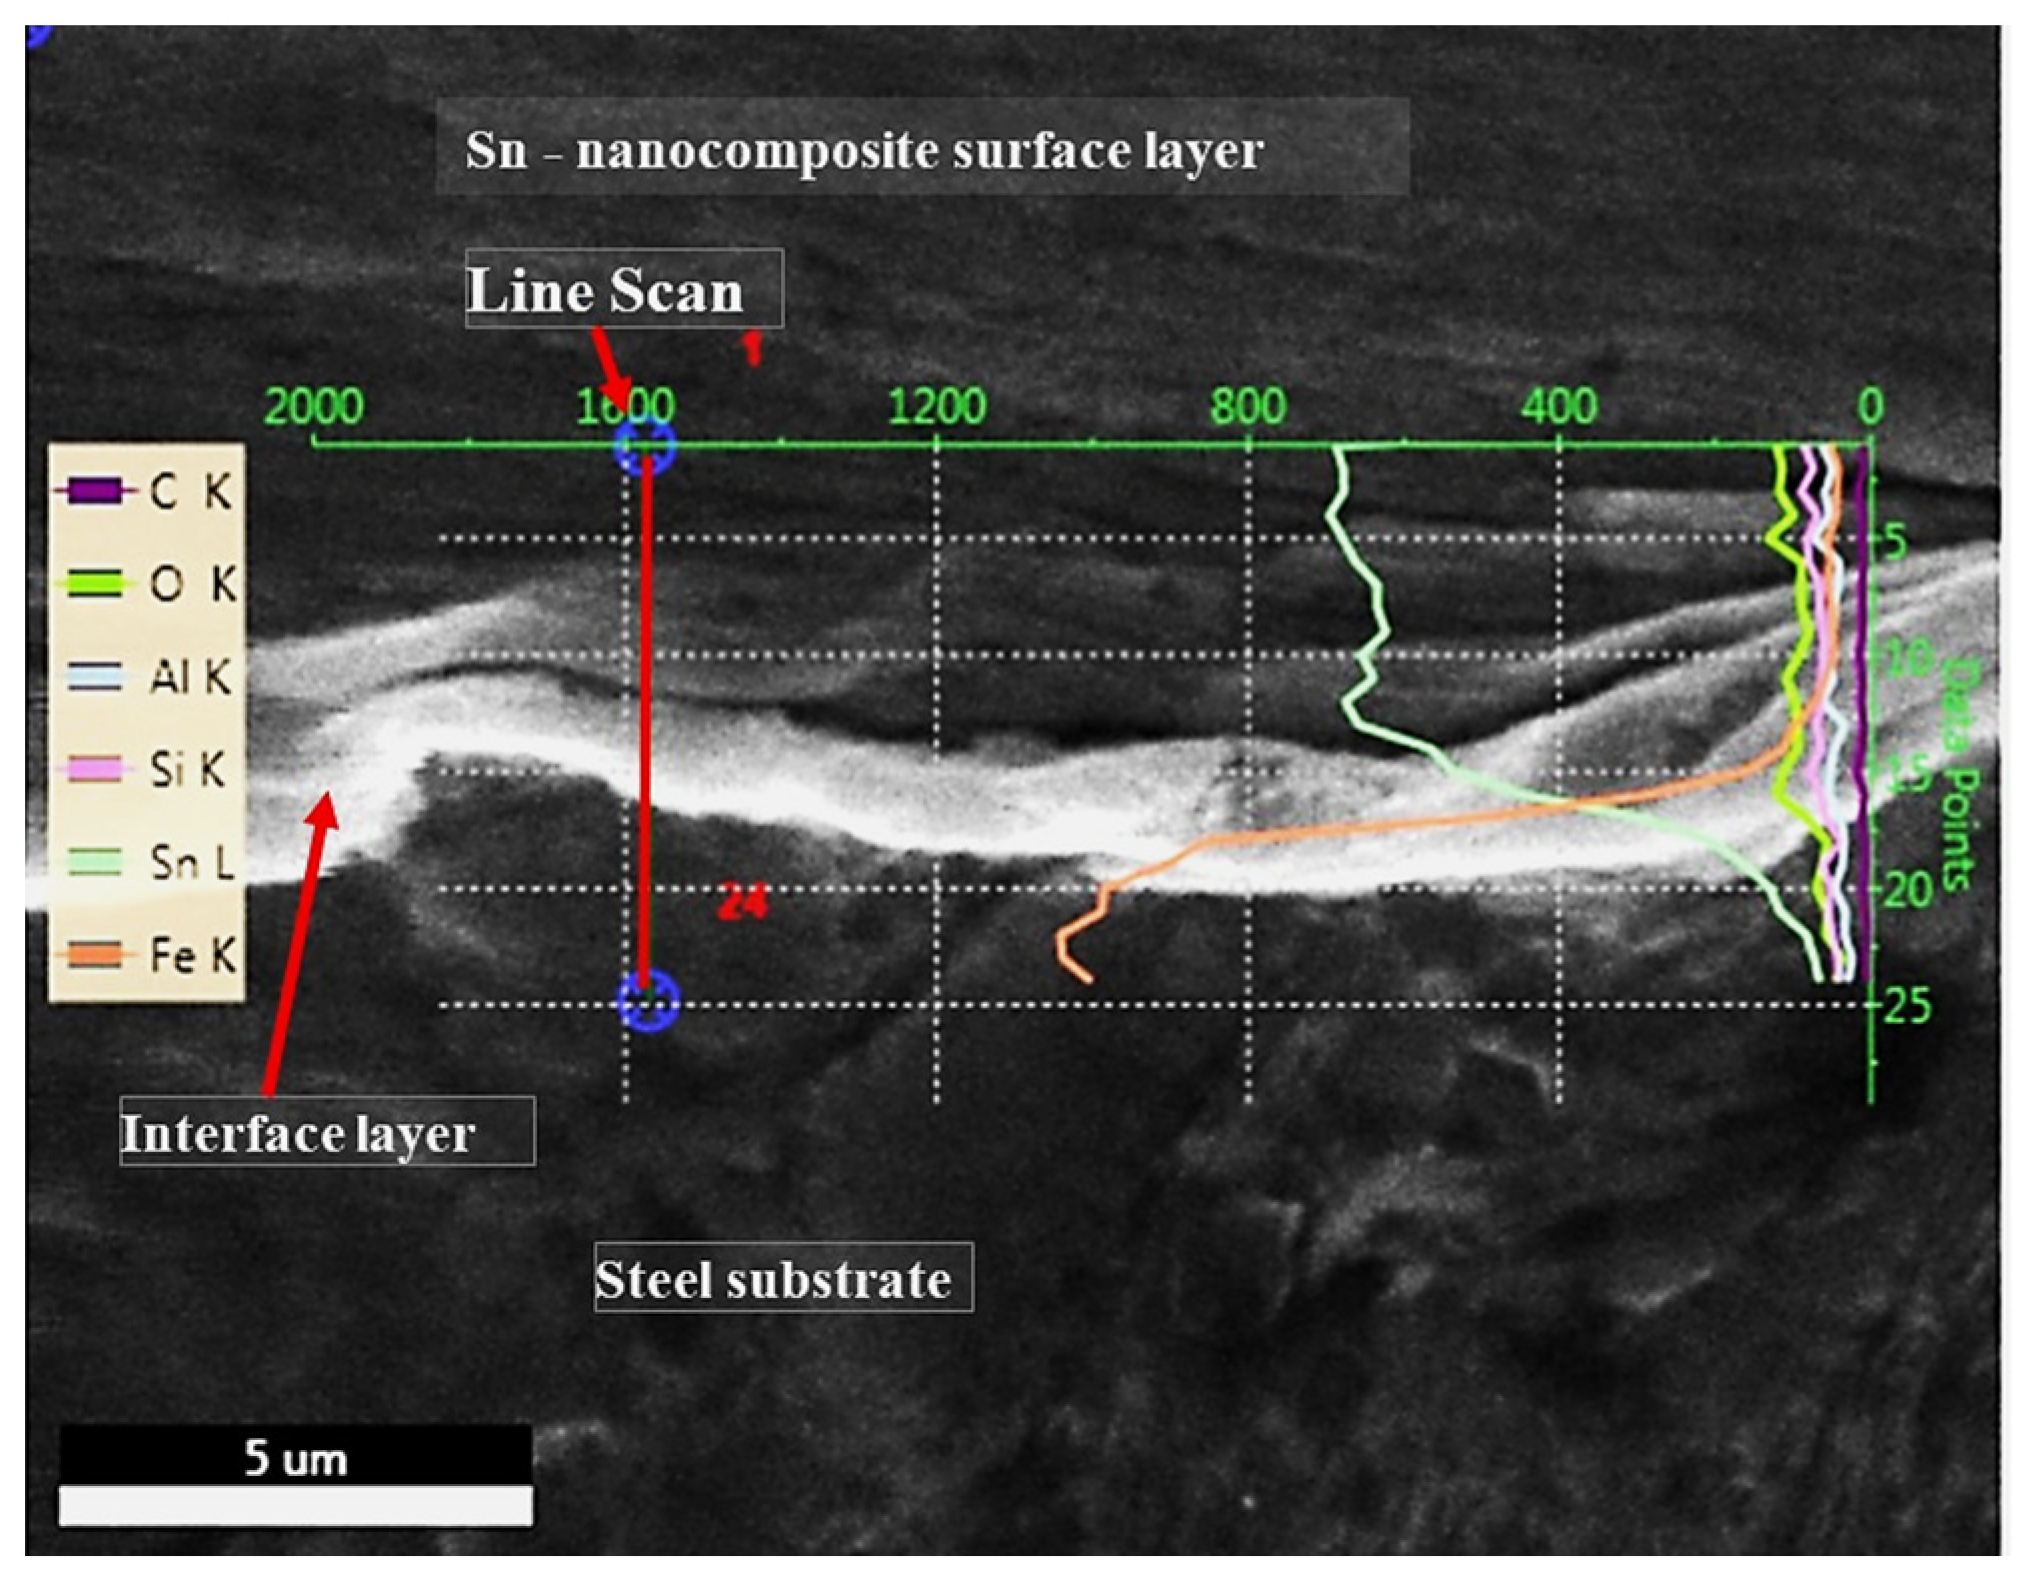
3.1. Microstructural Changes Accompanying Coating Process

The microstructure of mild steel (S0 substrate) used in the current study is shown in Figure 2, in which the common phases of ferrite and pearlite can be observed. The percentage of the two phases primarily verifies the carbon % in the mild steel. Among a huge variety of metallic materials, mild steel is the most extensively used engineering material for its outstanding mechanical properties, its reasonable conductivity and its cost efficiency [32]. However, mild steel and other types of steel alloys are considered reactive metals that easier to corrode in different environmental systems. Barrier coatings [33] have been used to protect the carbon from corrosion.
Cross-section microstructures of mild steel with tin coating and tin-nanocomposites coating, containing 0.25 wt.%, 0.50 wt.%, 1.00 wt.% and 1.50 wt.% alumina nanoparticles, are presented in Figure 3. It is evident that the morphology and thickness of Sn-composites coating layers are highly affected by the presence of alumina nanoparticles. The mild steel coated only with tin (without alumina nanoparticles addition) shows irregular and relatively lower coated layer thickness (Figure 3a). However, the mild steel coating with tin doped nanoparticles containing 0.25 wt.% and 0.50 wt.% alumina shows regular and higher coated layer thicknesses (see Figure 3b,c). By increasing the alumina nanoparticles addition to 1.00 wt.% and 1.50 wt.% in tin paste, a remarkable change in the coated layer is observed, as they become irregular in shape and lessen in their thicknesses (see Figure 3d,e). It was reported [34] that the addition of Al2O3 nanoparticles in a lower percentage resulted in an increase in the wetting area and an increase in the microhardness of the Sn- based SAC0307 solder alloy that contains a lower percentage of Ag and Cu. The regularity of Sn-composites coating layers is improved due to the improvement in wettability between the coating layer and the steel for lower addition conditions. Otherwise, for a higher addition of alumina nanoparticles (1.00 and 1.5 wt.%), the wettability decreases due to alumina particle agglomerations, resulting in irregular tin-composite coating [34].
SEM images of a cross section of mild steel substrate coating with tin composite without any addition of alumina nanoparticles (S1 substrate) alongside the presentation of an EDS microanalysis are shown in Figure 4. The typical microstructures of a tin coating layer can be detected at the Fe-Sn IMC interface and a ferrite–pearlite matrix is observed (Figure 4a). The EDS patterns in the tin coating surface layer near the coating outer surface, adjacent to the interface layer in the tin-coating surface layer/ mild steel are shown in Figure 4b,c. The EDS pattern of tin coating surface layer adjacent to interface layer displays Fe element due to a diffusion from higher concentrations of iron and mild steel to Sn-coating (Figure 4c). The interfacial SEM image (Figure 4a) shows the presence of a clear and relatively thick interface between the tin coating surface layer/mild steel indicating the presence of intermetallic phases [35] (Fe-Sn intermetallic phases) due to the reaction of tin with iron, as revealed in Figure 4d. In the jointing process, the molten tin metal can react with the steel substrates to form Fe-Sn IMCs at the interface. The evolution and growth of IMCs play an important role in the mechanical properties and reliability of the joints, due to their inherent and brittle properties [36].
Figure 5 shows the effect of alumina nanoparticles additive on the thickness of tin surface layer and an iron-tin IMC interface. It can be observed that the thickness of the tin surface layer increases with an increase in the alumina nanoparticles additives. Such a trend can be explained in terms of morphology changes of the surface layer during the tinning process. At lower additions of alumina nanoparticles (from 0.0 wt.% and up to 0.50 wt.%), the thickness of the tin surface layer increases due to IMC repression. For higher additions of alumina nanoparticles (1.25–1.50 wt.%), an increase of the tin surface layer could be attributed to higher porosity formation. Previous studies [37,38] reported that the porosity percentage of the pore morphology of the Sn–0.7Cu alloy-based nanocomposite solders increased with the weight of the percentage of Al2O3 reinforcement. On the other hand, the effect of the addition of alumina nanoparticles on the thickness of Fe-Sn IMC interface seems to be minimal, particularly for a higher content of alumina nanoparticles (1.25–1.50 wt.%). At lower amounts of nanoparticles (0.0–0.25–0.50 wt.%), a remarkable decrease in the thickness of the IMC interface is observed. In conclusion, a higher concentration of alumina nanoparticles facilitated the Fe and Sn reaction, due to particles agglomeration phenomena.
Figure 6a presents the SEM image for a cross-section of mild steel, coated with 0.25 wt.% alumina nanoparticles doped tin-composite (S2). The EDS analysis results across the interface of the S2 sample are displayed in Figure 6b,c, respectively. The analysis confirms the formation of the intermetallic Fe-Sn at the interface layer. The EDS analysis shows the presence of composition of the tin-composite coating surface layer and minor percentages of Al and O with almost constant values through the line proofing representing a good distribution. Figure 6b indicates a comparative Al and O at the tin-composite coating surface layer, which was verified in the graph of the EDS line analysis detecting for the presence of Al2O3 reinforcement.
The SEM image of a mild steel that is coated with a tin-composite doped with 0.5 wt.% alumina nanoparticles alongside a line scan analysis is shown in Figure 7. The same observation as that of the previous figure is detected for Sn-composite coating. It contains 0.5 wt.% Al2O3, a minor percentage of Al and O with almost constant values across the line, again confirming their good distribution.
Figure 8 shows the SEM image and graphical representation of the EDS microanalysis of the tin coating surface layer and interface layer in the mild steel for sample S4 (1.0 wt.% alumina nanoparticles). A relatively higher percentage of micropores are observed (Figure 8a). It has been reported [37] that a higher percentage of Al2O3 reinforcement particulates in the lead-free Sn–0.7Cu composite, a higher aspect ratio and shape factor that results in a higher irregularity of the pores. The EDS point analyses (Figure 8b–d) of the sub-surface coating (point 1), the near interface (point 2) and an interface (point 3) confirm the inhomogeneity and uneven distribution of Al and O (Al2O3 nanoparticles) in the coating surface layer.
Similarly to our current tinning process, solders prepared through paste mixing contain a percentage of nanoparticles, and the rest of the nanoparticles remain in the flux residue after the reflow, showing a smaller percentage compared with the nominal percentage added [39]. Many processing factors may affect the difference between the nominal and the actual percentages of the amounts of nanoparticles remaining in the coating layer as well as their distribution in the matrix. Although forming a composite by combining different kinds of materials is a promising technique to obtain performance monolithic materials, the optimum benefits of different kinds of materials are difficult to obtain due to the difficulty of dispersing and distributing the nanometer scale reinforcing materials uniformly within the matrix [40,41].
Considering the strengthening mechanisms in the metal matrix nanocomposite, a significant enhancement of the nanocomposite properties can be achieved through a combination of the high-strength and the thermal stability of the ceramic nanoparticles with the metal matrix [41]. The expected improvements were rarely achieved to attain the high percentage of nanoparticles additions, due to the difficulty in achieving dispersion and a uniform distribution of the nanoparticles in the metal matrix [42]. The SEM image of the mild steel coated with 1.5 wt.% alumina nanoparticles doped tin-composite and the graphical presentation of the EDS microanalysis of alumina nanoparticles agglomeration and tin oxide in a thin coating layer are shown in Figure 9. The large subsurface voids and surface coating nanoparticles agglomeration can be easily detected (Figure 9a). The EDS microanalysis of agglomerated particles confirms the presence of Al2O3 nanoparticles along with a small amount of tin oxides (Figure 9b).
Based on the above analysis and results, obtaining a high fraction (1 wt.% and 1.5 wt.%) of alumina nanoparticles is becoming difficult to achieve using the current tinning process of mild steel using alumina nanoparticles-doped Sn-coating composite. The Al2O3 nanoparticles agglomeration and flotation observed in the Sn-coating surface could be related to high fraction nanoparticles loading and the difference in specific gravity between the Sn and Al2O3 nanoparticles.

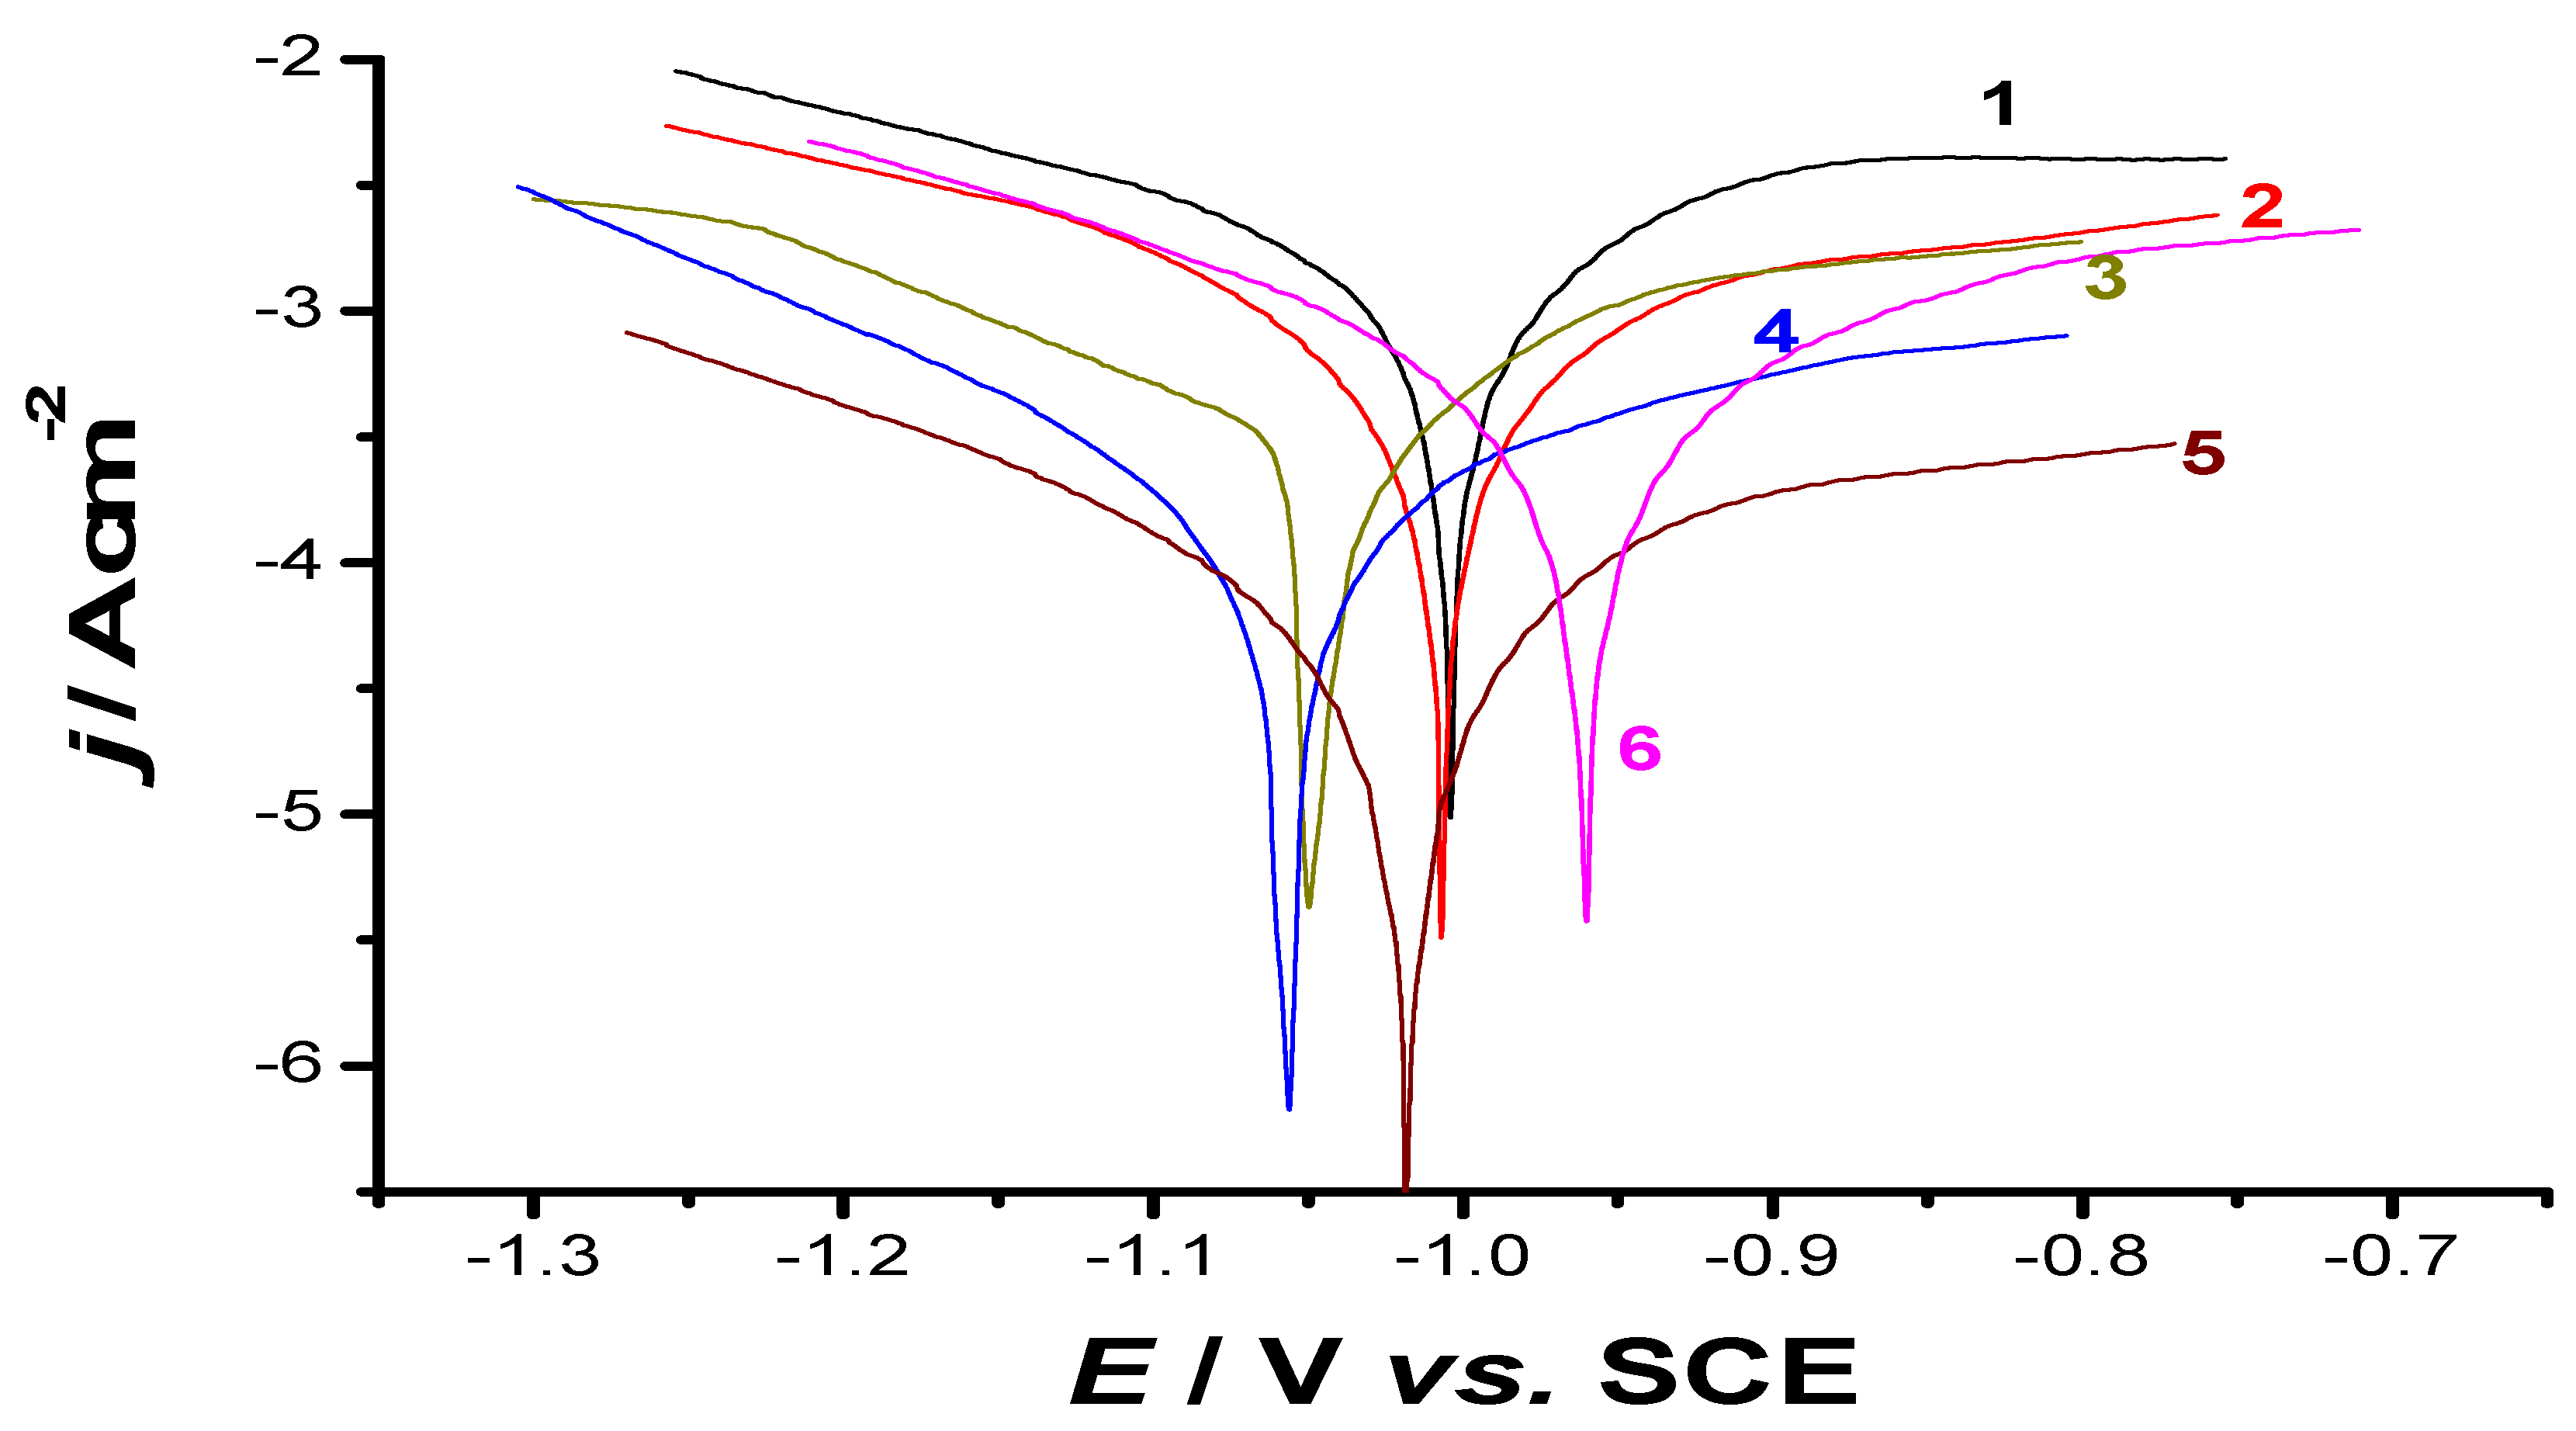
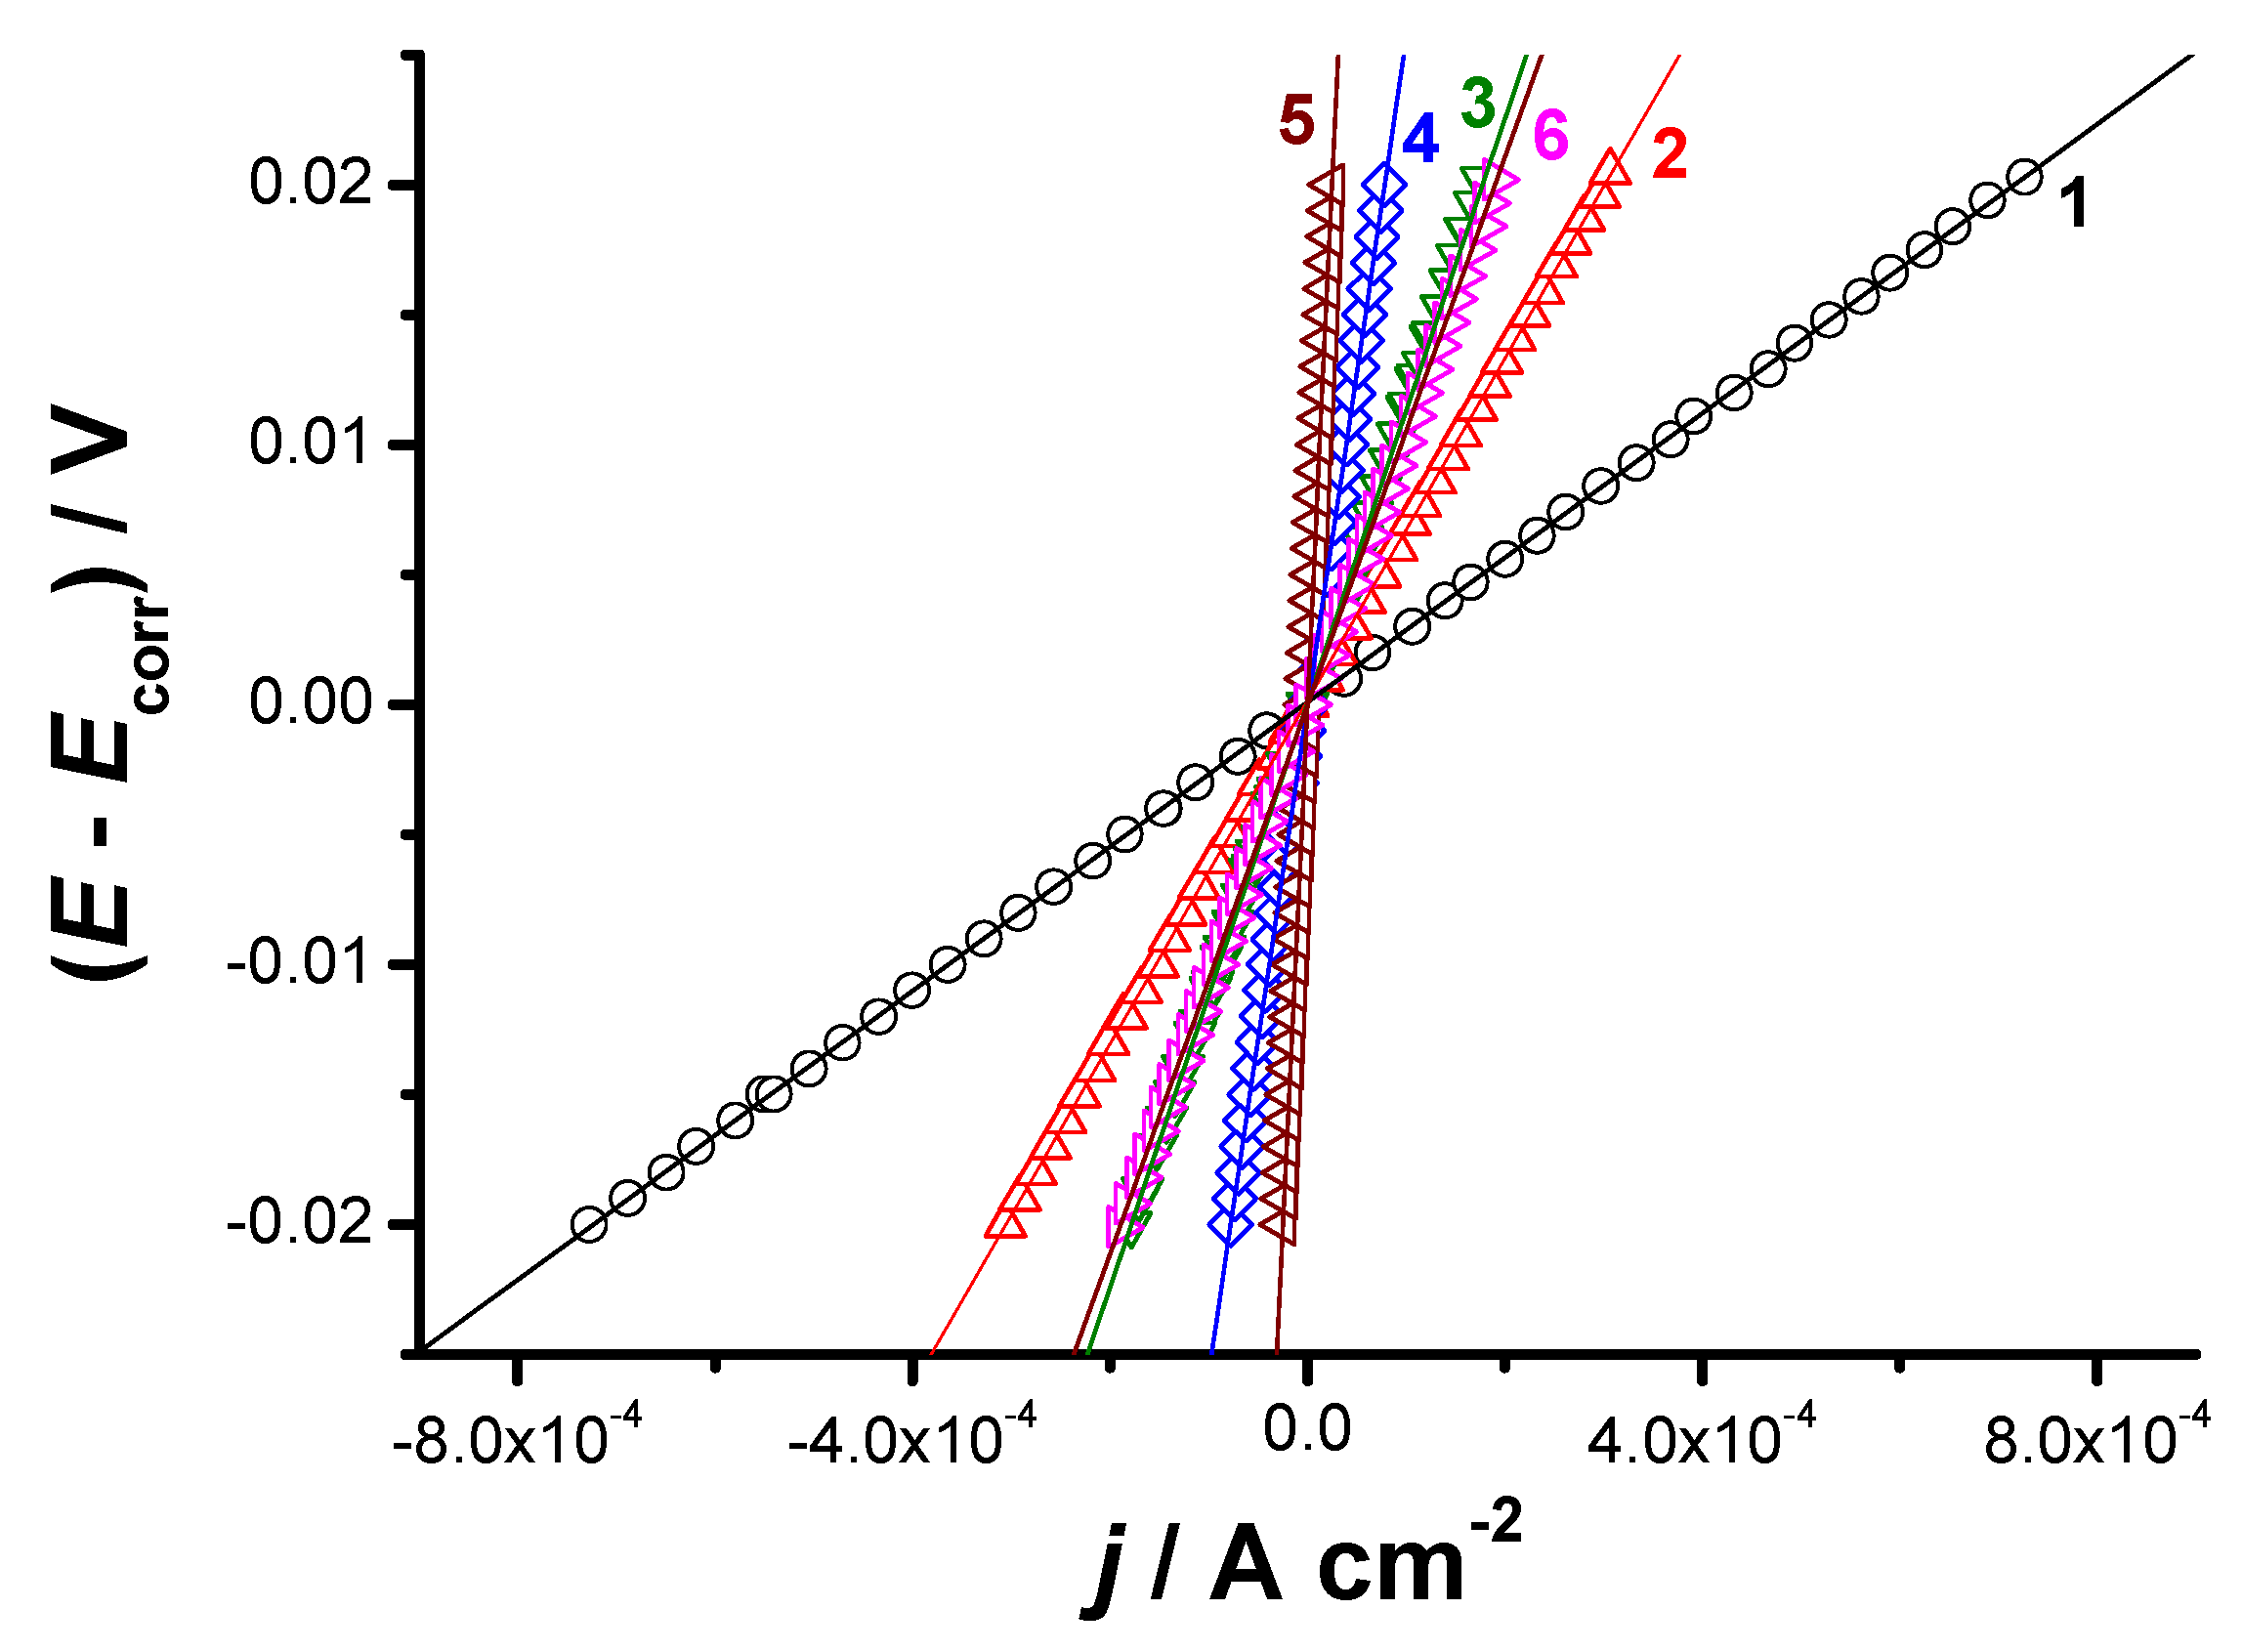
3.2. Corrosion Resistance Enhancement

Figure 10 depicts the cathodic and anodic polarization curves recorded for the five-coated mild steel samples (S1–S5) through a comparison with the uncoated mild steel substrate sample (S0). Measurements were performed in a 3.5 wt.% NaCl solution at a potential scan rate of 1.0 mV s−1 at 25 °C.
It is inferable from Figure 10 that between S0 and S4 the current associated with both the cathodic and anodic polarization plots decreases without a definite trend for the corrosion potential (Ecorr). In addition, the current density accompanying both the anodic and cathodic polarization curves is markedly reduced. Such results suggest that the coatings employed inhibit both the anodic and cathodic processes on the substrate surface.
A further examination of the cathodic and anodic polarization curves revealed that, in all cases, a typical Tafel response (linear E-log j relationship) is displayed by the cathodic curves, whereas the anodic curves contradict Tafel behavior. The absence of the linear E-log j relationship on the anodic polarization curves can be attributed to a corrosion product deposition and/or passivation. The cathodic polarization curves’ Tafel region makes it possible to undertake a precise evaluation of the cathodic Tafel slope (βc), and therefore, the rate of the uniform corrosion in terms of corrosion current density (jcorr), via the Tafel extrapolation method. However, the anodic Tafel slope (βa) values, estimated from the software, are thought to be inaccurate due to the absence of the Tafel response on the anodic domains [43,44,45,46,47,48].
The various electrochemical kinetic parameters, derived from fitting the cathodic and anodic polarization curves with the Tafel equation, are displayed in Table 2. The estimated βc values are higher than anticipated. The coated steel samples recorded high βc values ranging from −190 to 366 mV dec−1 for the cathodic processes, (i.e., the reduction of both water molecules and the dissolved O2 occurring on its surface) in a 3.5 wt.% NaCl solution. The estimated βa values were also considerable, covering the range of 173–727 mV dec−1. There is no apparent change or behavior of the Tafel slope values of the studied coated steel samples. Analogous data were previously reported by M. Metikos-Hukovic et al. [49] who incorporated organic additives to effectively control the perchloric acid corrosion of Al. High βc values (235–245 mV dec−1) were estimated during the described study [49]. High Tafel slope values are commonly considered irregular as such great Tafel slopes cannot be predicted for any given mechanism [49]. The higher values of βc were attributed by Metikos-Hukovic and his coworkers [49] to the Al passivity that occurs instantaneously, forming a virtually stable ineffectual passive layer, which restricts the reduction capacity of Al [50]. This, in turn, slows any potential reduction process occurring at the surface by influencing the energy of the double-layer reaction and/or through the introduction of a barrier to the transfer of the charge through the film [51]. An accurate way of describing the high Tafel slopes is through the barrier-film model for the observed HER [51].
The corrosion-current density (jcorr) values, and the uniform corrosion rate, decrease in the sequence: bare steel substrate (1.51 mA cm−2) > tin-coated steel (1.07 mA cm−2) > Al2O3 (0.25%)-tin-steel (0.29 mA cm−2) > Al2O3 (0.5%)-tin-steel (0.16 mA cm−2) > Al2O3 (1.0%)-tin-steel (0.076 mA cm−2). A further increase in the Al2O3 content within the coating, namely the Al2O3 (1.5%)-tin-steel sample, significantly enhanced the corrosion current density by up to 0.45 mA cm−2, a value that is between those of the tin-coated steel and Al2O3 (0.25%)-tin-steel, presenting an enhanced uniform corrosion rate than compared with Al2O3 (0.25%)-tin-steel, Al2O3 (0.5%)-tin-steel, and Al2O3 (1.0%)-tin-steel samples.
To clarify and further assess the high uniform corrosion resistance of the investigated Al2O3 (x%)-tin-steel samples (x = 0.25, 0.5, and 1.0%), samples S2–S4, versus the uncoated steel substrate (sample S0), linear polarization resistance (LPR) plots were constructed (Figure 11).
The slopes of such linear plots define the polarization resistance Rp (the polarization curve’s tangent at Ecorr), Equation (1) [52].
Rp = (dE/dj)E = Ecorr
The value of Rp significantly increased, corresponding to an enhanced corrosion resistance, from 40.97 Ω cm2 for the uncoated steel substrate (sample S0) to 109.05, 162.8, 340.7, and 831.47 Ω cm2 for samples S1–S4, respectively. These findings present further evidence with regard to the outstanding uniform corrosion resistance of the Al2O3-tin-coated steel samples in NaCl solutions, which enhances with the Al2O3 content by up to 1.0%. Once again, a further increase in the Al2O3 content (up to 1.5%) within the coating, such as in sample S5, which is an an Al2O3 (1.5%)-tin-steel, decreases the polarization resistance value to 143.4 Ω cm2, corresponding to an accelerated rate of corrosion. These findings confirm the results derived from the Tafel extrapolation method.
The rates of the uniform corrosion, ν (expressed in mm y−1) and the coatings’ inhibition efficiency (I %) values are also depicted in Table 2. Equation (2) is employed to convert the values of jcorr (measured in μA cm−2), which are estimated using the Tafel extrapolation method via the extrapolation of the cathodic Tafel line to Ecorr, to the corrosion rate, υ (given in mm/yr) [52]:
υ = K × (jcorr/ρ) × EW
where K is a constant (3.27 × 10⁻³ mm/μA cm yr), EW is the equivalent weight of Fe (27.9225 g), and ρ is its density (7.86 g/cm3).
A pronounced correlation exists between the LPR method’s corrosion rate values and those derived from the Tafel extrapolation method. These findings affirm the validity of the Tafel extrapolation method in evaluating uniform corrosion rates [46].
The value of I (%) is calculated using the corrosion current densities for the uninhibited (jocorr) and inhibited (jcorr) NaCl solutions using Equation (3):
I (%) = {(jocorr − jcorr)/jocorr} × 100
In order to obtain the precise values of jcorr and accurately to measure the corrosion rate, the values of βa and βc, which are calculated from the analysis of the experimental anodic and calculated cathodic Tafel segments, have been included in the Stern—Geary equation, Equation (4) [53] along with the Rp values derived from the LPR method.
jcorr = B/Rp = {(βa × βc)/2:303 (βa + βc)}/Rp
However, unlike other methods that use different techniques to protect the surfaces of metallic materials such as welding [54], the use of expensive alloys containing Cr, Ni, Mo and Ti [55], or even using heat treatment [56], the direct tinning method used in this research is a simple and low-cost technique that can be applied to flat horizontal surfaces. The percentage of different nanoparticles that are added can also be controlled easily and optimized as desired.
Through this research, it has become clear that an increase in the percentage of alumina nanoparticles by up to 1% to the tin coating layer improves the general corrosion resistance. However, to maximize the benefits of adding nanoparticles, to obtain the ideal properties for the coating layer, and for ensuring that it is free of voids along with a significant resistance level to corrosion, we recommend the addition of 0.5% of alumina nanoparticles to the tin coating layer.

4. Conclusions

Tin-based alumina nanocomposite coatings were successfully fabricated via a direct, simple and low-cost tinning process route to protect mild steel from corrosion. Tin-composite surface layers that contained a range of 0.25 wt.% to 1.5 wt.% alumina nanoparticles coated on mild steel were investigated in detail. It was observed that the morphology and the thickness of the Fe-Sn intermetallic layer at the coated Sn/Fe interface were highly affected by alumina nanoparticles additions that effectively inhibit the diffusion of Sn atoms into the Fe substrate. The thickness of the Fe-Sn IMC layer is decreased at lower additions of alumina nanoparticles (0.25 wt.% and 0.50 wt.%) because of an Fe-Sn IMC suppression, while it is slightly increased for higher additions of alumina nanoparticles (1.00 wt.% and 1.50 wt.%) due to nanoparticle agglomeration and flotation. The nanocomposite tin coating containing 1.00 wt.% alumina nanoparticles promoted a superior corrosion resistance in comparison with other amounts used in the current study. However, for a long lasting and high-performance corrosion resistant tin-nanocomposite coating and for a coating layer with minimum defects (voids and particles agglomerations), a coating layer containing 0.50 wt % alumina nanoparticles is highly recommended.

Author Contributions

Conceptualization, K.S.A.H. and M.R.; Data curation, A.S.A. (Abdulaziz S. Alghamdi) and M.A.A.; Formal analysis, M.A.A., A.S.A. (Abdulaziz S. Alghamdi), N.F., and M.R.; Investigation, M.A.A., A.S.A. (Abdulaziz S. Alghamdi), and M.R.; Methodology, A.S.A. (Abdulaziz S. Alghamdi), K.S.A.H., A.S.A. (Abdullah S. Alshammari), N.F., and M.R.; Project administration, A.S.A. (Abdulaziz S. Alghamdi) and K.S.A.H.; Software, A.S.A. (Abdullah S. Alshammari); Writing – review & editing, A.S.A. (Abdulaziz S. Alghamdi), K.S.A.H., M.A.A., N.F., and M.R. All authors have read and agreed to the published version of the manuscript.

Funding

This research has been funded by Scientific Research Deanship at the University of Ha’il—Saudi Arabia through project number RG- 20 027.

Institutional Review Board Statement

Not applicable.

Informed Consent Statement

Not applicable.

Data Availability Statement

Data available in a publicly accessible.

Conflicts of Interest

The authors declare no conflict of interest.

References

  1. Zhang, Z.; Wang, Y.; Xiao, L.; Zhang, L.; Su, Y.; Lin, J.S. High-temperature oxidation of hot-dip aluminizing coatings on a Ti3Al–Nb alloy nd the effects of element additions. J. Corros. Sci. 2012, 64, 137–144. [Google Scholar] [CrossRef]
  2. Li, Y.J.; Liang, T.Q.; Ao, R.; Zhao, H.; Chen, X.; Zeng, J. Oxidation resistance of iron-based coatings by supersonic arc spraying at high temperature. J. Surf. Coat. Technol. 2018, 347, 99–112. [Google Scholar] [CrossRef]
  3. Zhang, B.; Cai, H.; Zhang, Y.; Sun, W.; Zhang, J.M. Effect of Oxide Film Thickness on Electrical and Thermal Conductivity of Micro-arc Oxidize Aluminium Substrates. J. Surf. Technol. 2017, 46, 23–27. [Google Scholar]
  4. Fan, X.M.; Li, L.; Wen, H.Y.; Liu, S.F.; Li, Z.Q. Study on hot-diffusion aluminzing of cast iron and its high temperature oxidation resistance. Mater. Prot. 2005, 38, 48–50. [Google Scholar]
  5. Bozza, F.; Bolelli, G.; Giolli, C.; Giorgetti, A.; Lusvarghi, L.; Sassatelli, P.; Scrivani, A.; Candeli, A.; Thoma, M. Diffusion mechanisms and microstructure development in pack aluminizing of Ni-based alloys. Surf. Coat. Technol. 2014, 239, 147–159. [Google Scholar] [CrossRef]
  6. Amaya, A.; Piamba, O.; Olaya, J. Improvement of Corrosion Resistance for Gray Cast Iron in Palm Biodiesel Application Using Thermoreactive Diffusion Niobium Carbide (NbC) Coating. J. Coat. 2018, 8, 216. [Google Scholar] [CrossRef] [Green Version]
  7. Amaya, A.; Piamba, O.; Olaya Florez, J.J. Vanadium carbide coatings produced on gray cast iron using the thermo-reactive deposition/diffusion technique. J. Ing. Mec. Tecnol. Desarro. 2015, 5, 333–338. [Google Scholar]
  8. Arai, T.; Harper, S. ASM Handbook: Steel Heat Treating Fundamentals and Processes; ASM International: Materials Park, OH, USA, 2017; Volume 4A. [Google Scholar]
  9. Arai, T.; Fujita, H.; Sugimoto, Y.; Ohta, Y. Heat Treatment and Surface Engineering, 1st ed.; ASM International: Metal Park, OH, USA, 1988. [Google Scholar]
  10. Cheng, W.; Wang, C. Microstructural evolution of intermetallic layer in hot-dipped aluminide mild steel with silicon addition. Surf. Coat. Technol. 2011, 205, 4726–4731. [Google Scholar] [CrossRef]
  11. Chang, Y.Y.; Tsaur, C.C.; Rock, J.C. Microstructure studies of an aluminide coating on 9Cr-1Mo steel during high temperature oxidation. Surf. Coat. Technol. 2006, 200, 6588. [Google Scholar] [CrossRef]
  12. Richards, R.W.; Jones, R.D.; Clements, P.D.; Clarke, H. Metallurgy of continuous hot dip aluminizing. Int. Mater. Rev. 1994, 39, 191. [Google Scholar] [CrossRef]
  13. Wang, C.J.; Chen, S.M. The high-temperature oxidation behavior of hot-dipping Al–Si coating on low carbon steel. Surf. Coat. Technol. 2006, 200, 6601. [Google Scholar] [CrossRef]
  14. Bosselet, F.; Pontevichi, D.; Sacerdote-Peronnet, M.; Viala, J.C. Affinement expérimental de l’isotherme Al-Fe-Si à 1000 K. J. Phys. IV Fr. 2004, 122, 41. [Google Scholar] [CrossRef] [Green Version]
  15. Deqing, W.; Ziyuan, S.; Longjiang, Z. A liquid aluminum corrosion resistance surface on steel substrate. Appl. Surf. Sci. 2003, 214, 304. [Google Scholar] [CrossRef]
  16. Mevrel, R.; Duret, C.; Pichoir, R. Pack cementation processes. Mater. Sci. Technol. 1986, 2, 201–206. [Google Scholar] [CrossRef]
  17. Xiang, Z.D.; Datta, P.K. Relationship between pack chemistry and aluminide coating formation for low-temperature aluminisation of alloy steels. Acta Mater. 2006, 54, 4453–4463. [Google Scholar] [CrossRef]
  18. Rohr, V. Development of Novel Protective High Temperature Coatings on Heat Exchanger. Ph.D. Thesis, Karl-Winnacker Institute, Frankfurt, Germany, 2005. [Google Scholar]
  19. Lou, D.C.; Akselsen, O.M.; Onsqien, M.I.; Solberg, J.K.; Berget, J. Surface modification of steel and cast iron to improve corrosion resistance in molten aluminium. J. Surf. Coat. Technol. 2006, 200, 5282–5288. [Google Scholar] [CrossRef]
  20. Ramadan, M.; Alghamdi, A.S.; Subhani, T.; Halim, K.S.A. Fabrication and characterization of Sn-based babbitt alloy nanocomposite reinforced with Al2O3 nanoparticles/carbon steel bimetallic material. Materials 2020, 13, 2759. [Google Scholar] [CrossRef]
  21. Ramadan, M.; Ayadi, B.; Rajhi, W.; Alghamdi, A.S. Influence of Tinning Material on Interfacial Microstructures and Mechanical Properties of Al12Sn4Si1Cu /Carbon Steel Bimetallic Castings for Bearing Applications. Key Eng. Mater. 2020, 835, 108–114. [Google Scholar] [CrossRef]
  22. Ramadan, M.; Hafez, K.M.; Alghamdi, A.S.; Ayadi, B.; Halim, K.S.A. Novel Approach for Using Ductile Iron as Substrate in Bimetallic Materials for Higher Interfacial Bonding Bearings. Inter. Met. Cast 2021, 11, 145. [Google Scholar] [CrossRef]
  23. Ramadan, M.; Fathy, N.; Halim, K.S.A.; Alghamdi, A.S. New trends and advances in bi-metal casting technologies. Int. J. Adv. Appl. Sci. 2019, 6, 75–80. [Google Scholar] [CrossRef] [Green Version]
  24. Ramadan, M.; Subhani, T.; Rajhi, W.; Ayadi, B.; Al-Ghamdi, A.S. A Novel Technique to Prepare Cast Al-bearing alloy/Wrought Steel Bimetallic Specimen for Interfacial Shear Strength. Int. J. Eng. Adv. Technol. 2020, 9, 2020. [Google Scholar] [CrossRef]
  25. Ramadan, M.; Alghamdi, A.S.; Hafez, K.M.; Subhani, T.; Halim, K.S.A. Development and Optimization of Tin/Flux Mixture for Direct Tinning and Interfacial Bonding in Aluminum/Steel Bimetallic Compound Casting. Materials 2020, 13, 5642. [Google Scholar] [CrossRef]
  26. El-Meligi, A.A. Corrosion Preventive Strategies as a Crucial Need for Decreasing Environmental Pollution and Saving Economics. Recent Pat. Corros. Sci. 2010, 2, 22. [Google Scholar] [CrossRef] [Green Version]
  27. Heusler, K.E. Present state and future problems of corrosion science and engineering. Corros. Sci 1990, 31, 753. [Google Scholar] [CrossRef]
  28. Xie, Z.; Zhang, Y.; Zhou, J.; Zhu, W.D. Theoretical and experimental research on the micro interface lubrication regime of water lubricated bearing. Mech. Syst. Signal. Process. 2021, 151, 107422. [Google Scholar] [CrossRef]
  29. Li, J.S.; Qu, Y.; Hua, H. Numerical analysis of added mass and damping of elastic hydrofoils. J. Hydrodyn. 2020, 32, 1009–1023. [Google Scholar] [CrossRef]
  30. Xie, Z.; Zhu, W.D. An investigation on the lubrication characteristics of floating ring bearing with consideration of multi-coupling factors. Mech. Syst. Signal. Process. 2022, 162, 108086. [Google Scholar] [CrossRef]
  31. Wen, J.; Zhang, W.; Ren, L. Controlling the number of vortices and torque in Taylor-Couette flow. J. Fluid Mech. 2020, 901, A30. [Google Scholar] [CrossRef]
  32. Wang, H.; Zhu, Y.; Hu, Z.; Zhang, X.; Wu, S.; Wang, R.; Zhu, Y. A novel electrodeposition route for fabrication of the superhydrophobic surface with unique self-cleaning, mechanical abrasion and corrosion resistance properties. Chem. Eng. J. 2016, 303, 37–47. [Google Scholar] [CrossRef] [Green Version]
  33. Huang, J.; Lou, C.; Xu, D.; Lu, X.; Xin, Z.; Zhou, C. Cardanol-based polybenzoxazine superhydrophobic coating with improved corrosion resistance on mild steel. Prog. Org. Coat. 2019, 136, 105191. [Google Scholar] [CrossRef]
  34. Tikale, S.; Prabhu, K.N. Development of low-silver content SAC0307 solder alloy with Al2O3 nanoparticles. Mater. Sci. Eng. A 2020, 787, 139439. [Google Scholar] [CrossRef]
  35. Zhou, L.; Wang, N.; Zhang, L.; Yao, W.J. The effects of the minority phase on phase separation in Fe–Sn hypermonotectic alloy. J. Alloys Compd. 2013, 555, 88–94. [Google Scholar] [CrossRef]
  36. Horvath, B.; Illes, B.; Shinohara, T. Growth of intermetallics between Sn/Ni/Cu, Sn/Ag/Cu and Sn/Cu layered structures. Thin Solid Film. 2014, 556, 345–353. [Google Scholar] [CrossRef]
  37. Zhong, X.L.; Gupta, M. Development of lead-free Sn–0.7Cu/Al2O3 nanocomposite solders with superior strength. J. Phys. D Appl. Phys. 2008, 41, 095403. [Google Scholar] [CrossRef]
  38. Haseeb, A.S.M.A.; Arafat, M.M.; Tay, S.L.; Leong, Y.M. Effects of Metallic Nanoparticles on Interfacial Intermetallic Compounds in Tin-Based Solders for Microelectronic Packaging. J. Electron. Mater. 2017, 46, 10. [Google Scholar] [CrossRef]
  39. Zhou, M. Exceptional Properties by Design. Science 2013, 339, 1161–1162. [Google Scholar] [CrossRef]
  40. Tjong, S.C. Novel nanoparticle-reinforced metal matrix composites with enhanced mechanical properties. Adv. Eng. Mater. 2007, 9, 639–652. [Google Scholar] [CrossRef]
  41. Ferguson, J.B.; Sheykh-Jaberi, F.; Kim, C.S.; Rohatgi, P.K.; Cho, K. On the strength and strain to failure in particle-reinforced magnesium metal-matrix nanocomposites (Mg MMNCs). Mater. Sci. Eng. A 2012, 558, 193–204. [Google Scholar] [CrossRef]
  42. Flitt, H.J.; Schweinsberg, D.P. A guide to polarization curve interpretation: Deconstruction of experimental curves typical of the Fe/H2O/H+/O2 corrosion system. Corros. Sci. 2005, 47, 2125. [Google Scholar] [CrossRef]
  43. Flitt, H.J.; Schweinsberg, D.P. Evaluation of corrosion rate from polarization curves not exhibiting a Tafel region. Corros. Sci. 2005, 47, 3034. [Google Scholar] [CrossRef]
  44. Mansfeld, F. Tafel slopes and corrosion rates obtained in the pre-Tafel region of polarization curves. Corros. Sci. 2005, 47, 3178. [Google Scholar] [CrossRef]
  45. Rosborg, B.; Pan, J.; Leygraf, C. Tafel slopes used in the monitoring of copper corrosion in a bentonite/groundwater environment. Corros. Sci. 2005, 47, 3267. [Google Scholar] [CrossRef]
  46. McCafferty, E. Validation of corrosion rates measured by the Tafel extrapolation method. Corros. Sci. 2005, 47, 3202. [Google Scholar] [CrossRef]
  47. Amin, M.A.; Khaled, K.F.; Fadl-Allah, S.A. Testing validity of the Tafel extrapolation method for monitoring corrosion of cold-rolled steel in HCl solutions–Experimental and theoretical studies. Corros. Sci. 2010, 52, 140. [Google Scholar] [CrossRef]
  48. Metikos-Hukovic, M.; Grubac, Z.; Stupnisek-Lisac, E. Organic corrosion inhibitors for aluminum in perchloric acid. Corrosion 1994, 50, 146. [Google Scholar] [CrossRef]
  49. Li, W.; Cochell, T.; Manthiram, A. Activation of aluminum as an effective reducing agent by pitting corrosion for wet-chemical analysis. Sci. Rep. 2013, 3, 145. [Google Scholar]
  50. Vigh, A.K. Oxide Films: Influence of Solid-State Properties on Electrochemical Behavior. In Oxide and Oxide Films; Marcel Dekker, Inc.: New York, NY, USA, 1972; pp. 1–92. [Google Scholar]
  51. Mansfeld, F. Recording and analysis of AC impedance data for corrosion studies. Corrosion 1981, 37, 301. [Google Scholar] [CrossRef]
  52. ASTM. Standard Practice for Calculation of Corrosion Rates and Related Information from Electrochemical Measurements (G 102-89). In ASTM Book of Standards; ASTM: West Conshohocken, PA, USA, 1994. [Google Scholar]
  53. Stern, M.; Geary, A.L. A theoretical analysis of the shape of polarization curves. J. Electrochem. Soc. 1957, 104, 56–63. [Google Scholar] [CrossRef]
  54. Hafez, K.M. The effect of welding atmosphere on the pitting corrosion of AISI 304L resistance spot welds. Int. J. Adv. Manuf. Technol. 2020, 97, 243–251. [Google Scholar] [CrossRef]
  55. Ramadan, M.; Hafez, K.M.; Halim, K.S.A.; Fathy, N.; Chiba, T.; Sato, H.; Watanabe, Y. Influence of Heat Treatment on Interface Structure of Stainless Steel /Gray Iron Bimetallic layered Castings. Appl. Mech. Mater. 2017, 873, 3–8. [Google Scholar] [CrossRef]
  56. Fathy, N.; Ramadan, M.; Hafez, K.M.; Alghamdi, A.S.; Halim, K.S.A. Microstructure and Induced Defects of 6061 Al Alloy after Short Times Cyclic Semi-solid Heat Treatment. MATEC Web Conf. 2016, 67, 05012. [Google Scholar] [CrossRef] [Green Version]
Figure 1. The electrochemical setup utilised for the electrochemical measurements. The setup includes: (A) The personal computer; (B) The Autolab (potentiostat/Galvanostat); (C) The Rotating Disc Unit (RDU) (in the present work, the working electrode was immobile, rpm = 0.0) (D) The electrochemical cell including the working electrode (WE), the reference electrode (RE), and the counter electrode (CE).
Coatings 11 01318 g001
Figure 2. Microstructure of carbon steel used in the current study (S0).
Coatings 11 01318 g002
Figure 3. Cross—section microstructures of mild steel with tin coating (a) and tin—nanocomposites coating containing (b) 0.25 wt.%, (c) 0.50 wt.%, (d) 1.00 wt.% and (e) 1.50 wt.% alumina nanoparticles correspondingly (S1–S5).
Coatings 11 01318 g003
Figure 4. (a) SEM images of cross section tin coating surface layer/mild steel and (bf) graphical presentation of EDS microanalysis of tin coating surface layer (points 1 & 2), interface layer (points 3) and steel substrate (points 4 & 5) in mild steel with tin coating without alumina nanoparticles (S1).
Coatings 11 01318 g004
Figure 5. Effect of alumina nanoparticles additives on the thickness of the tin surface layer and Fe-Sn IMC interface coatings.
Coatings 11 01318 g005
Figure 6. (a) SEM image of the cross—section of mild steel coated with tin-composite doped 0.25 wt.% alumina nanoparticles (S2), (b,c) line scan and EDS analysis results across the interface of S2.
Coatings 11 01318 g006
Figure 7. SEM image of cross—section of mild steel coated with 0.5 wt.% alumina nanoparticles doped tin-composite across the interface of S3.
Coatings 11 01318 g007
Figure 8. (a) SEM images of the cross—section of mild steel coated with tin-composite doped 1.0 wt.% alumina nanoparticles across the interface of S4 and (bd) graphical presentation of EDS microanalysis of tin coating surface layer (points 1 & 2) and interface layer (points 3) in mild steel.
Coatings 11 01318 g008
Figure 9. (a) SEM images of the cross—section of mild steel coated with 1.5 wt.% alumina nanoparticles doped tin-composite and (b) graphical presentation of EDS microanalysis of alumina nanoparticles agglomeration and tin oxide in coating layer (S5).
Coatings 11 01318 g009
Figure 10. Cathodic and anodic polarization curves recorded for the uncoated and coated steel samples in 3.5 wt.% NaCl solution at a potential scan rate of 1.0 mV s−1 at 25 °C, (1) Uncoated mild steel substrate (S0); (2) Mild steel coated with tin-composite (S1); (3) Mild steel coated with 0.25 wt.% alumina nanoparticles doped tin-composite (S2); (4) Mild steel coated with 0.5 wt.% alumina nanoparticles doped tin-composite (S3); (5) Mild steel coated with 1.0 wt.% alumina nanoparticles doped tin-composite (S4) and (6) Mild steel coated with 1.5 wt.% alumina nanoparticles doped tin-composite (S5).
Coatings 11 01318 g010
Figure 11. Linear polarization resistance (LPR) plots recorded for the uncoated and coated steel samples in 3.5 wt.% NaCl solution at a potential scan rate of 1.0 mV s−1 at 25 °C.
Coatings 11 01318 g011
Table 1. Chemical composition of carbon steel substrate, wt.%.
Chemical
Composition
CSiMnCuCrNiFe
Steel substrate0.140.300.410.200.140.09Bal.
Table 2. Mean value (standard deviation) of the various electrochemical kinetic parameters, recorded for the investigated coated steel samples in comparison with the uncoated steel substrate. These parameters were derived from polarization measurements employing the Tafel extrapolation and LPR methods.
Tested SampleTafel Extrapolation MethodLPR Method
Ecorr/
mV (SCE)
jcorr/
mA cm−2
βc/
mV dec−1
βa/
mV dec−1
υ/
mm/yr
I (%)jcorr/
mA cm−2
Rp/
Ω cm2
υ/
mm/yr
I (%)
S0−1004 (11)1.51 (0.03)−330 (7)282 (5.2)18.1 (0.22)-1.44 (0.02)40.97 (1.1)17.3 (0.2)-
S1−1008 (9)1.072 (0.02) −366 (8)727 (10)12.9 (0.15)29.0 (0.35)0.97 (0.018) 109.1 (2.1)11.6 (0.2)32.6 (0.4)
S2−1050 (13)0.29 (0.005)−207 (4)173 (3.2)3.5 (0.06)80.8 (1.15)0.25 (0.004)162.8 (3)3.0 (0.05)82.6 (1.2)
S3−1060 (12)0.16 (0.003)−190 (3.6)260 (5)1.9 (0.03)89.4 (1.3)0.14 (0.002)340.7 (6.4)1.7 (0.04)90.3 (1.5)
S4−1020 (11)0.076 (0.002)−243 (4.2)284 (4.7)0.9 (0.02)95.0 (1.5)0.068 (0.0022)831.5 (11)0.8 (0.01)95.3 (1.3)
S5−960 (8)0.45 (0.01)−250 (4.8)281 (5.3)5.4 (0.08)70.2 (1.1)0.40 (0.009)143.4 (2.8)4.8 (0.07)72.2 (0.9)
Publisher’s Note: MDPI stays neutral with regard to jurisdictional claims in published maps and institutional affiliations.

