
A Novel Comparative Study Based on the Economic Feasibility of the Ceramic Nanoparticles Role’s in Improving the Properties of the AA5250 Nanocomposites


 ,
,  and
and 
Abstract
:
1. Introduction
2. Materials and Methods
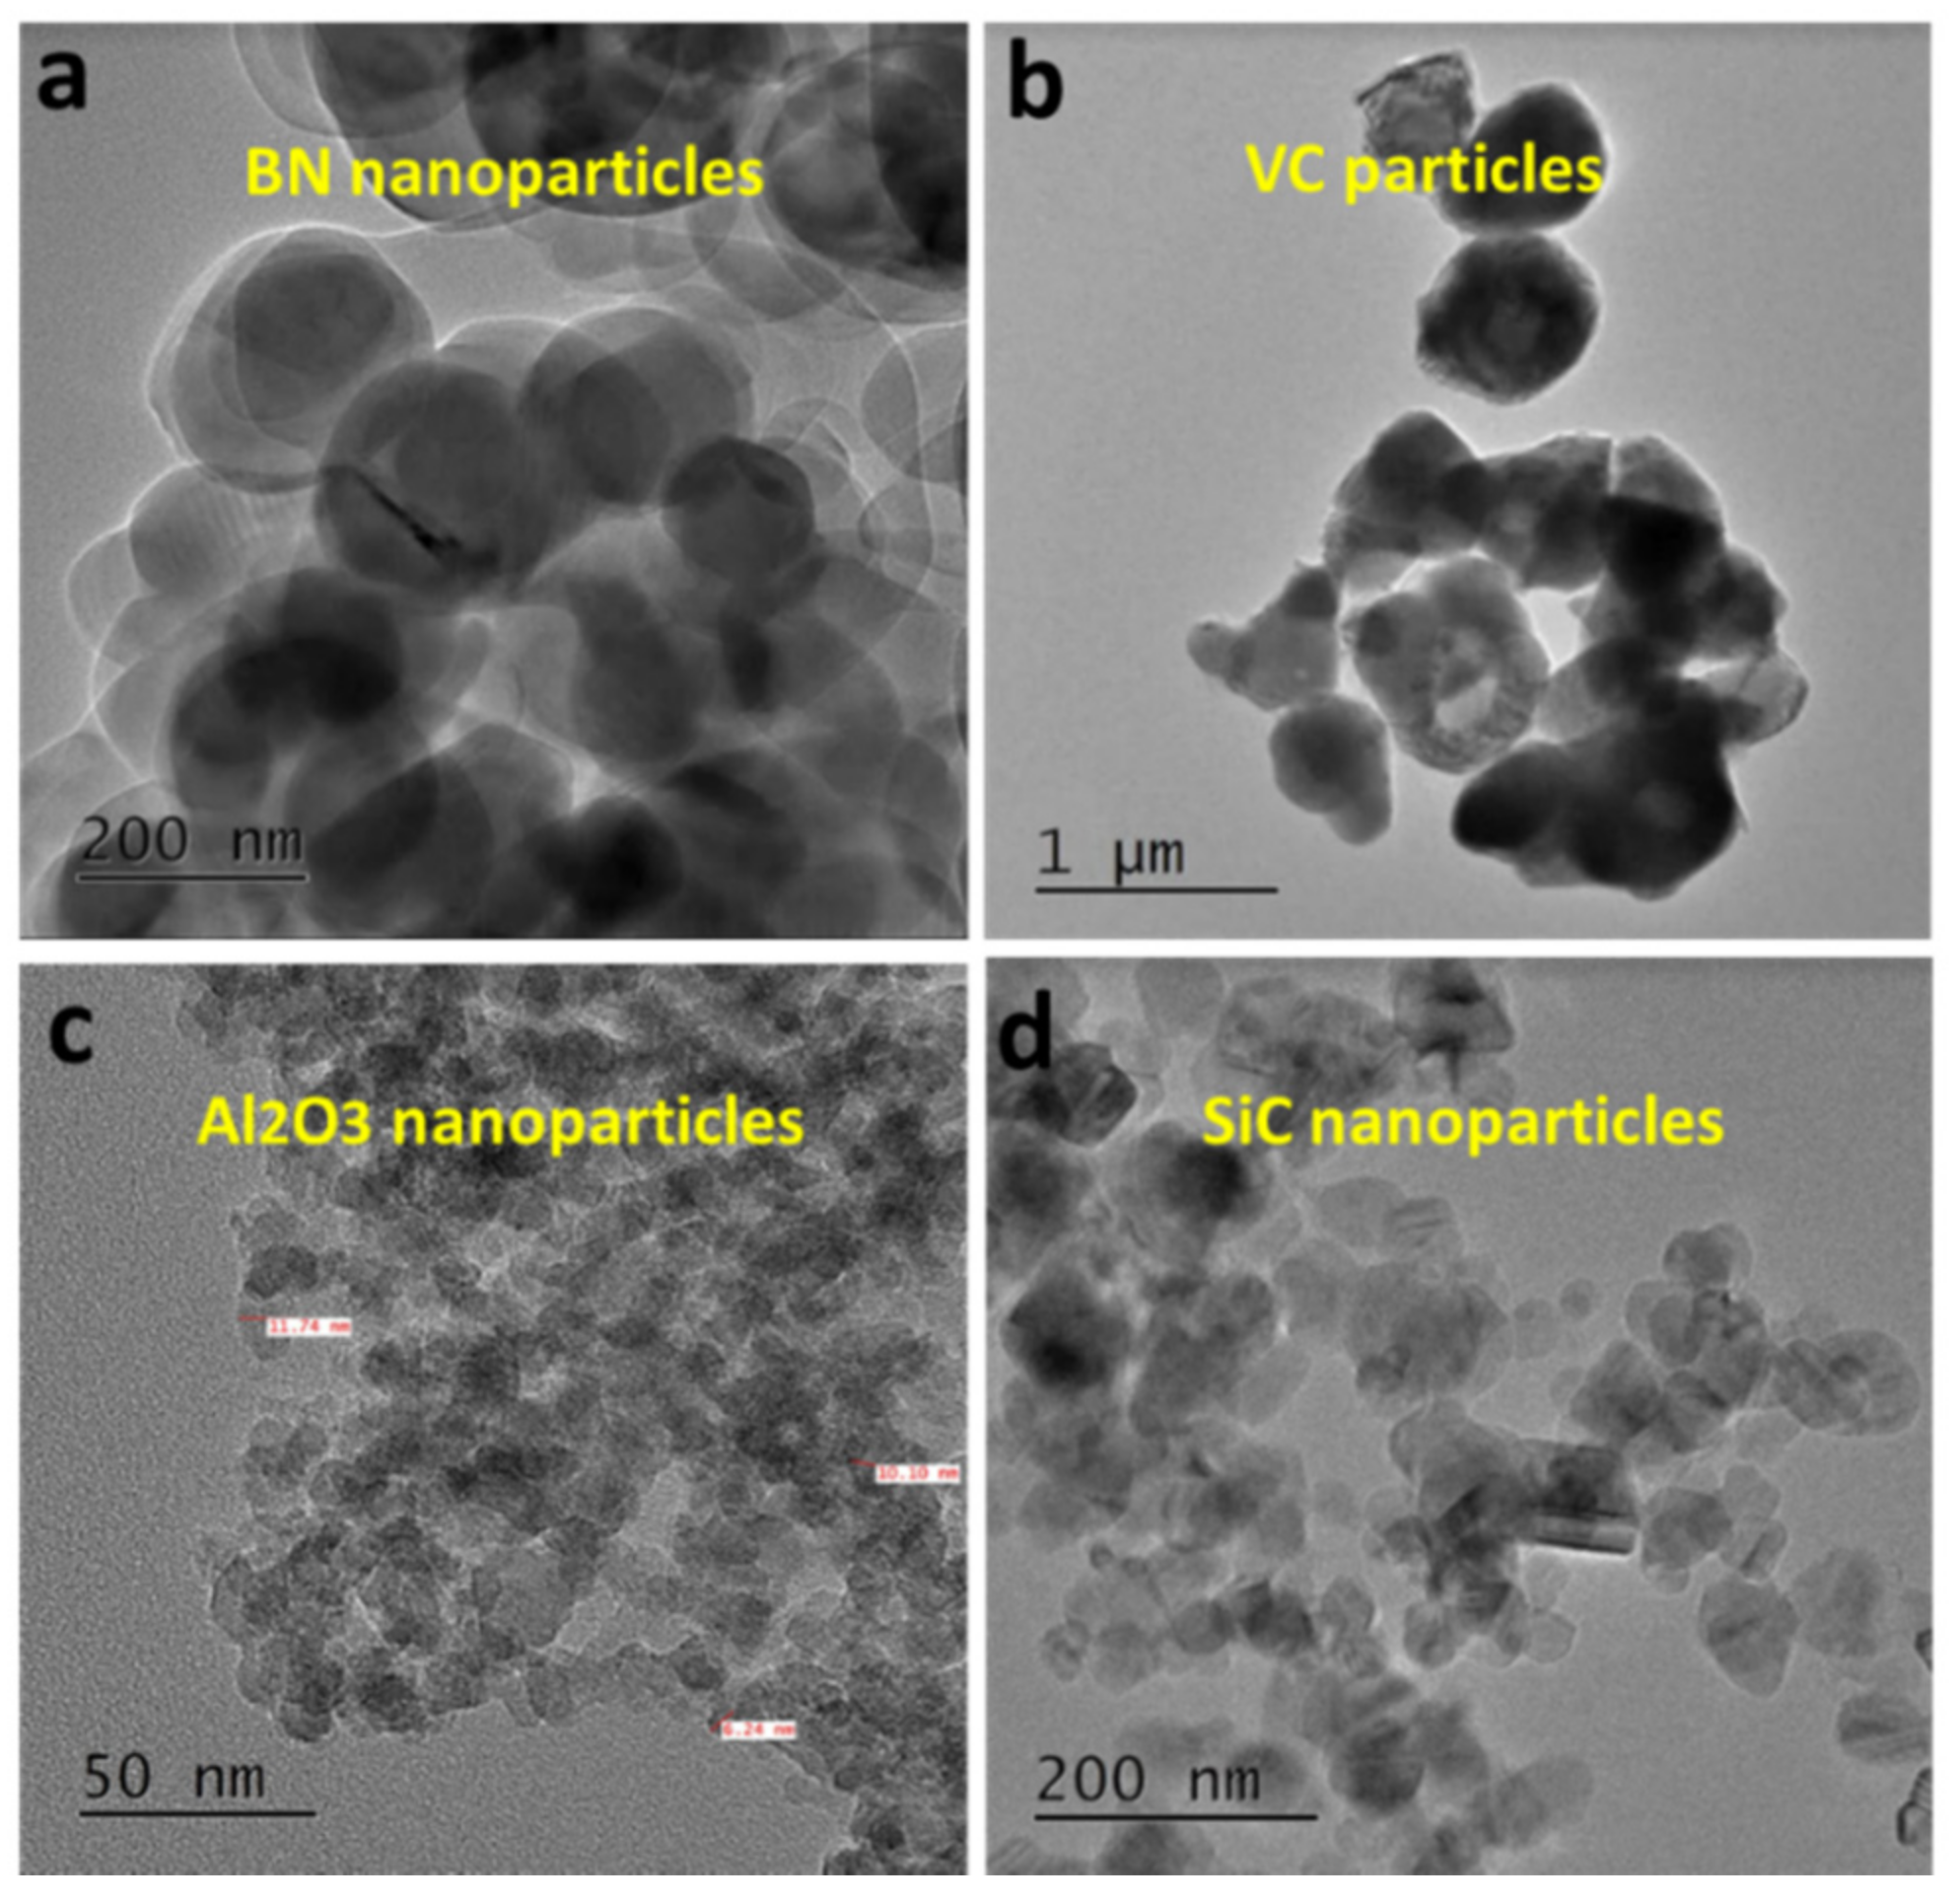
2.1. Materials
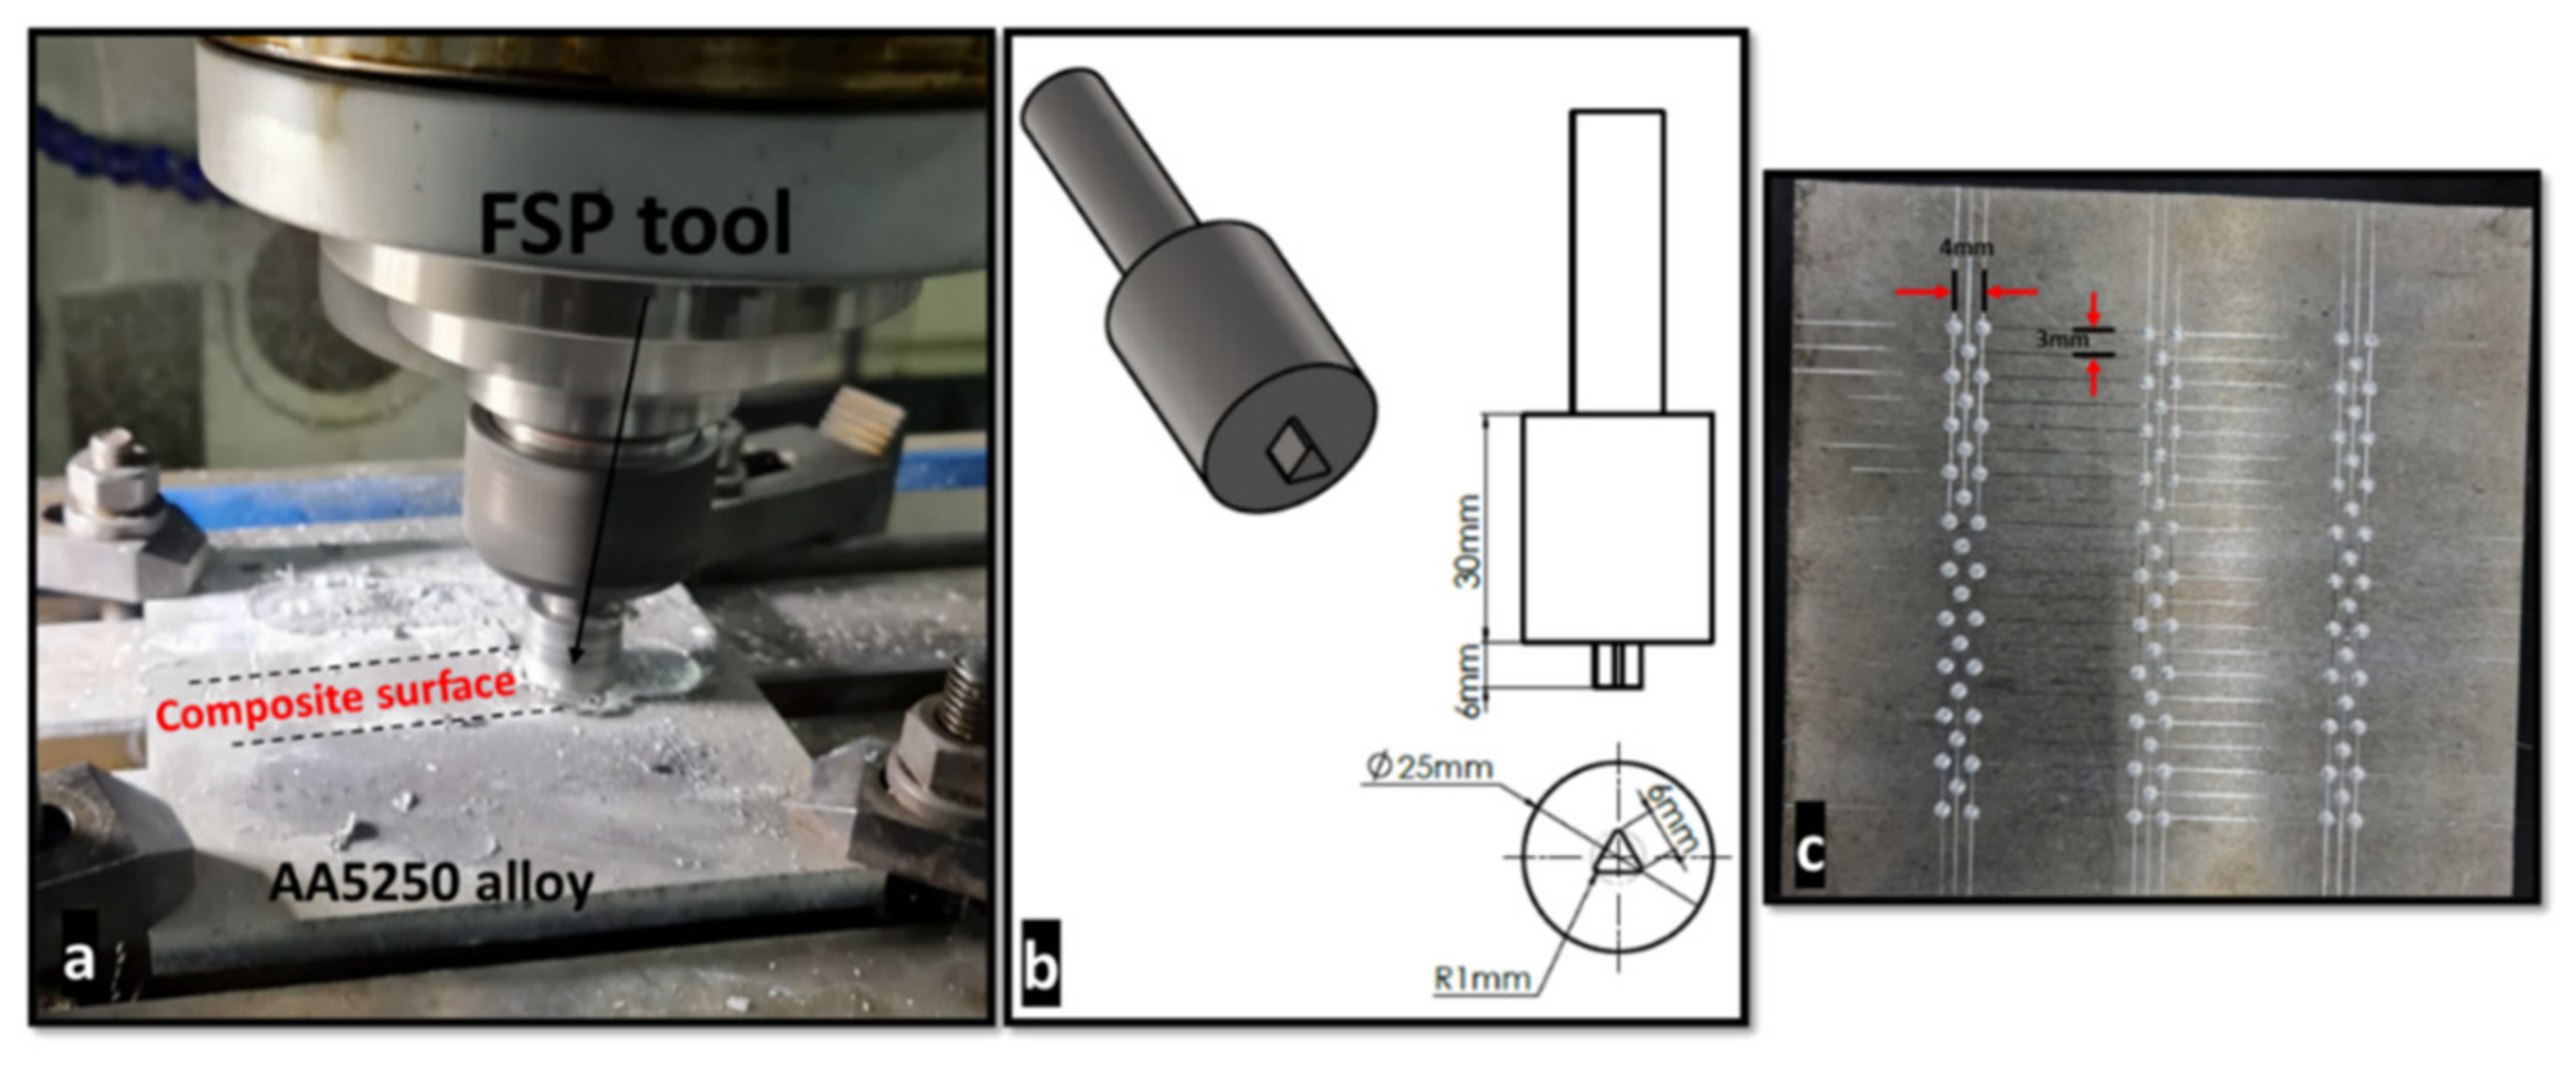
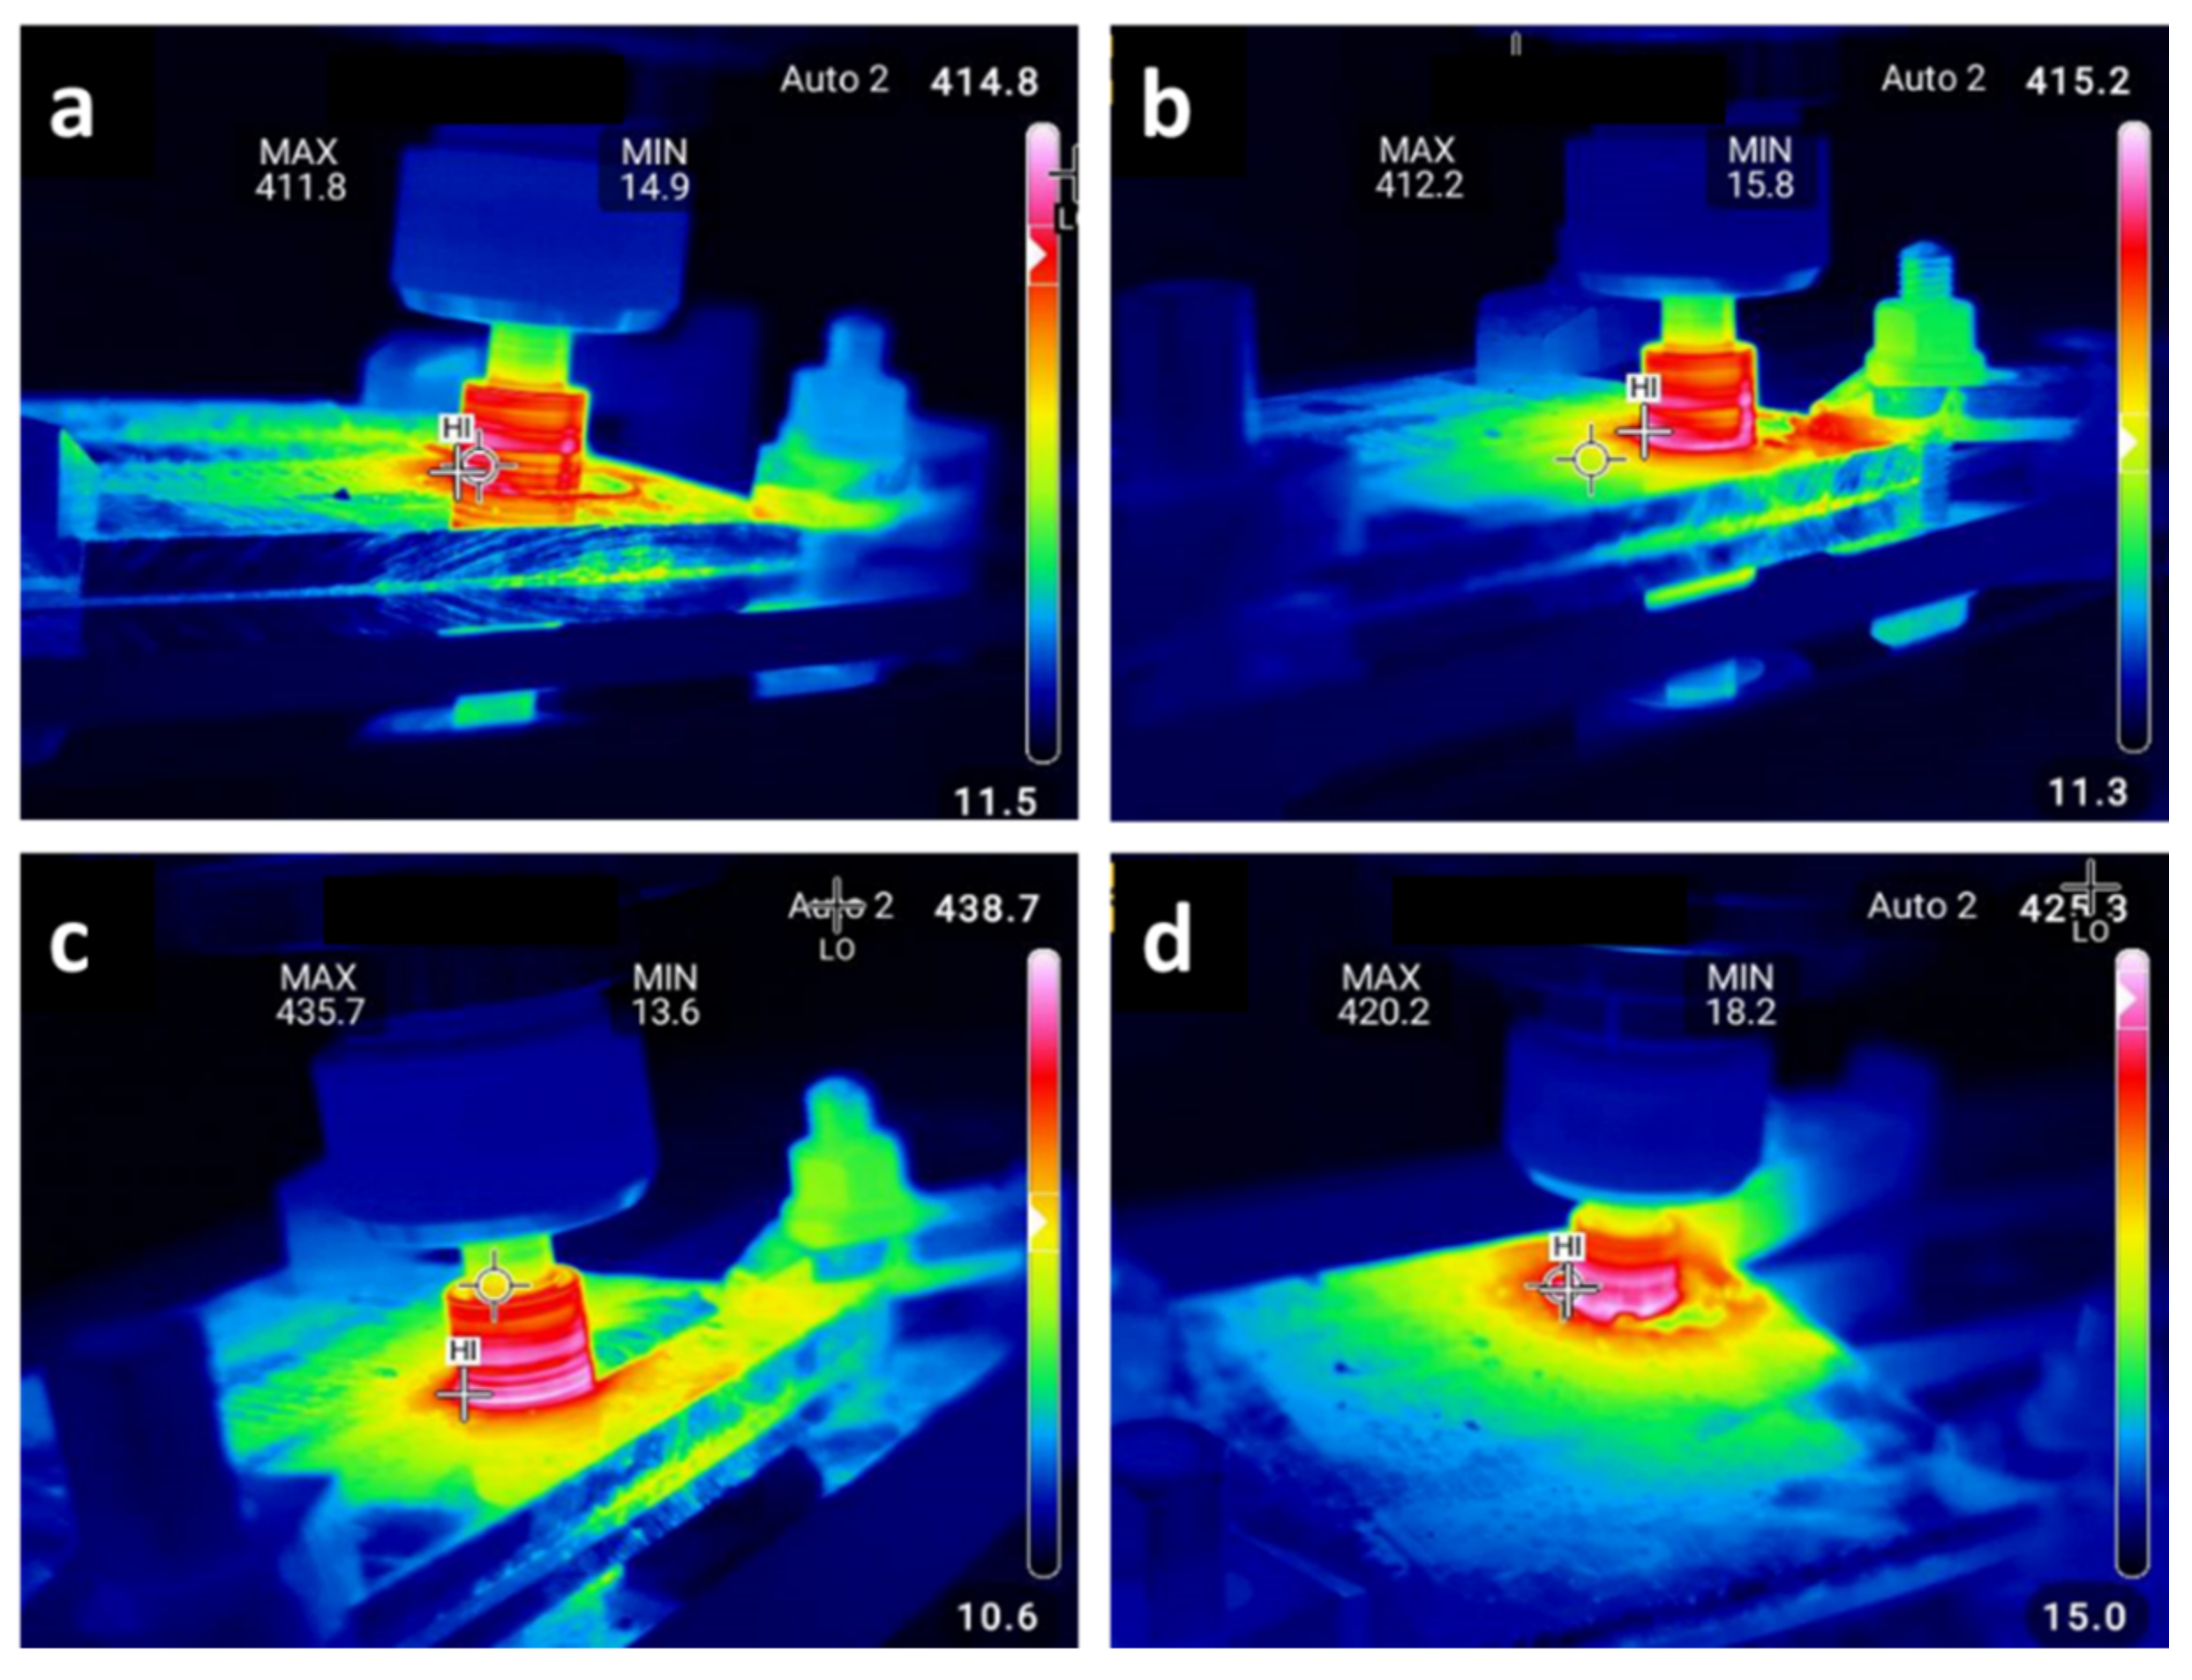
2.2. Surface Composite Fabrication Process
2.3. Characterization and Tests
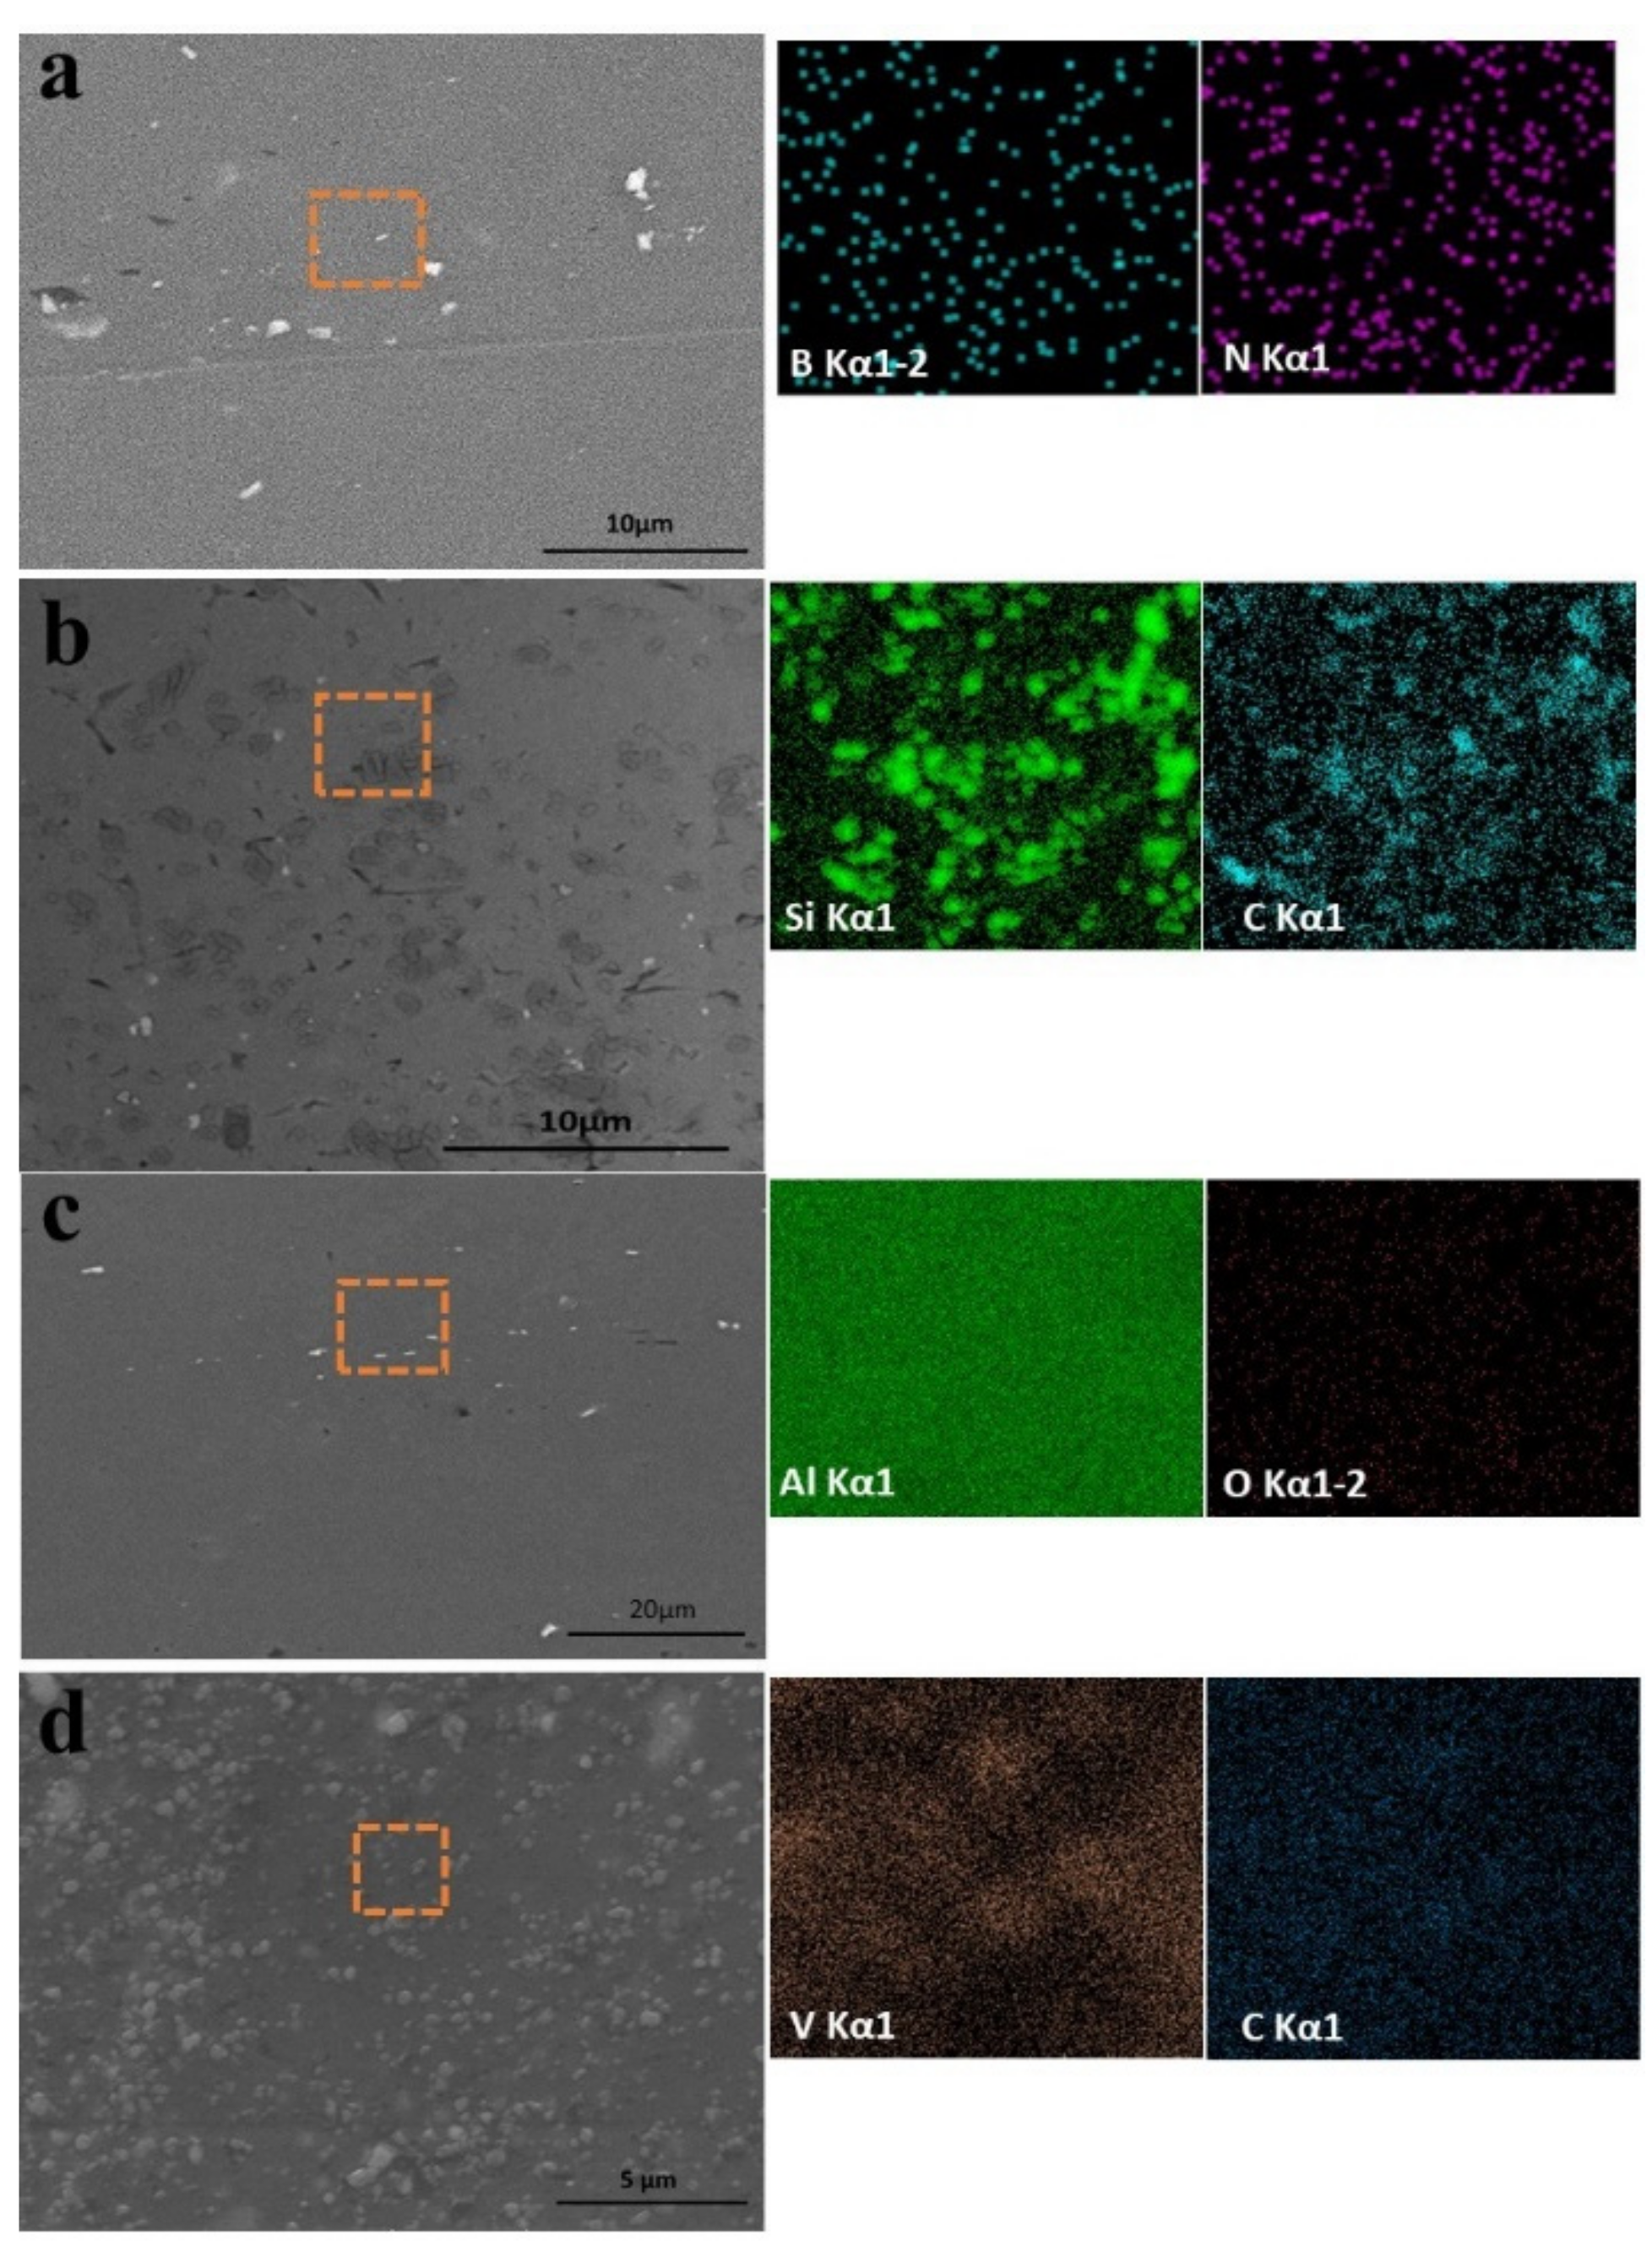
2.3.1. Microstructure Analysis
2.3.2. Wear and Friction Tests
2.3.3. Micro-Hardness Test
3. Results and Discussion
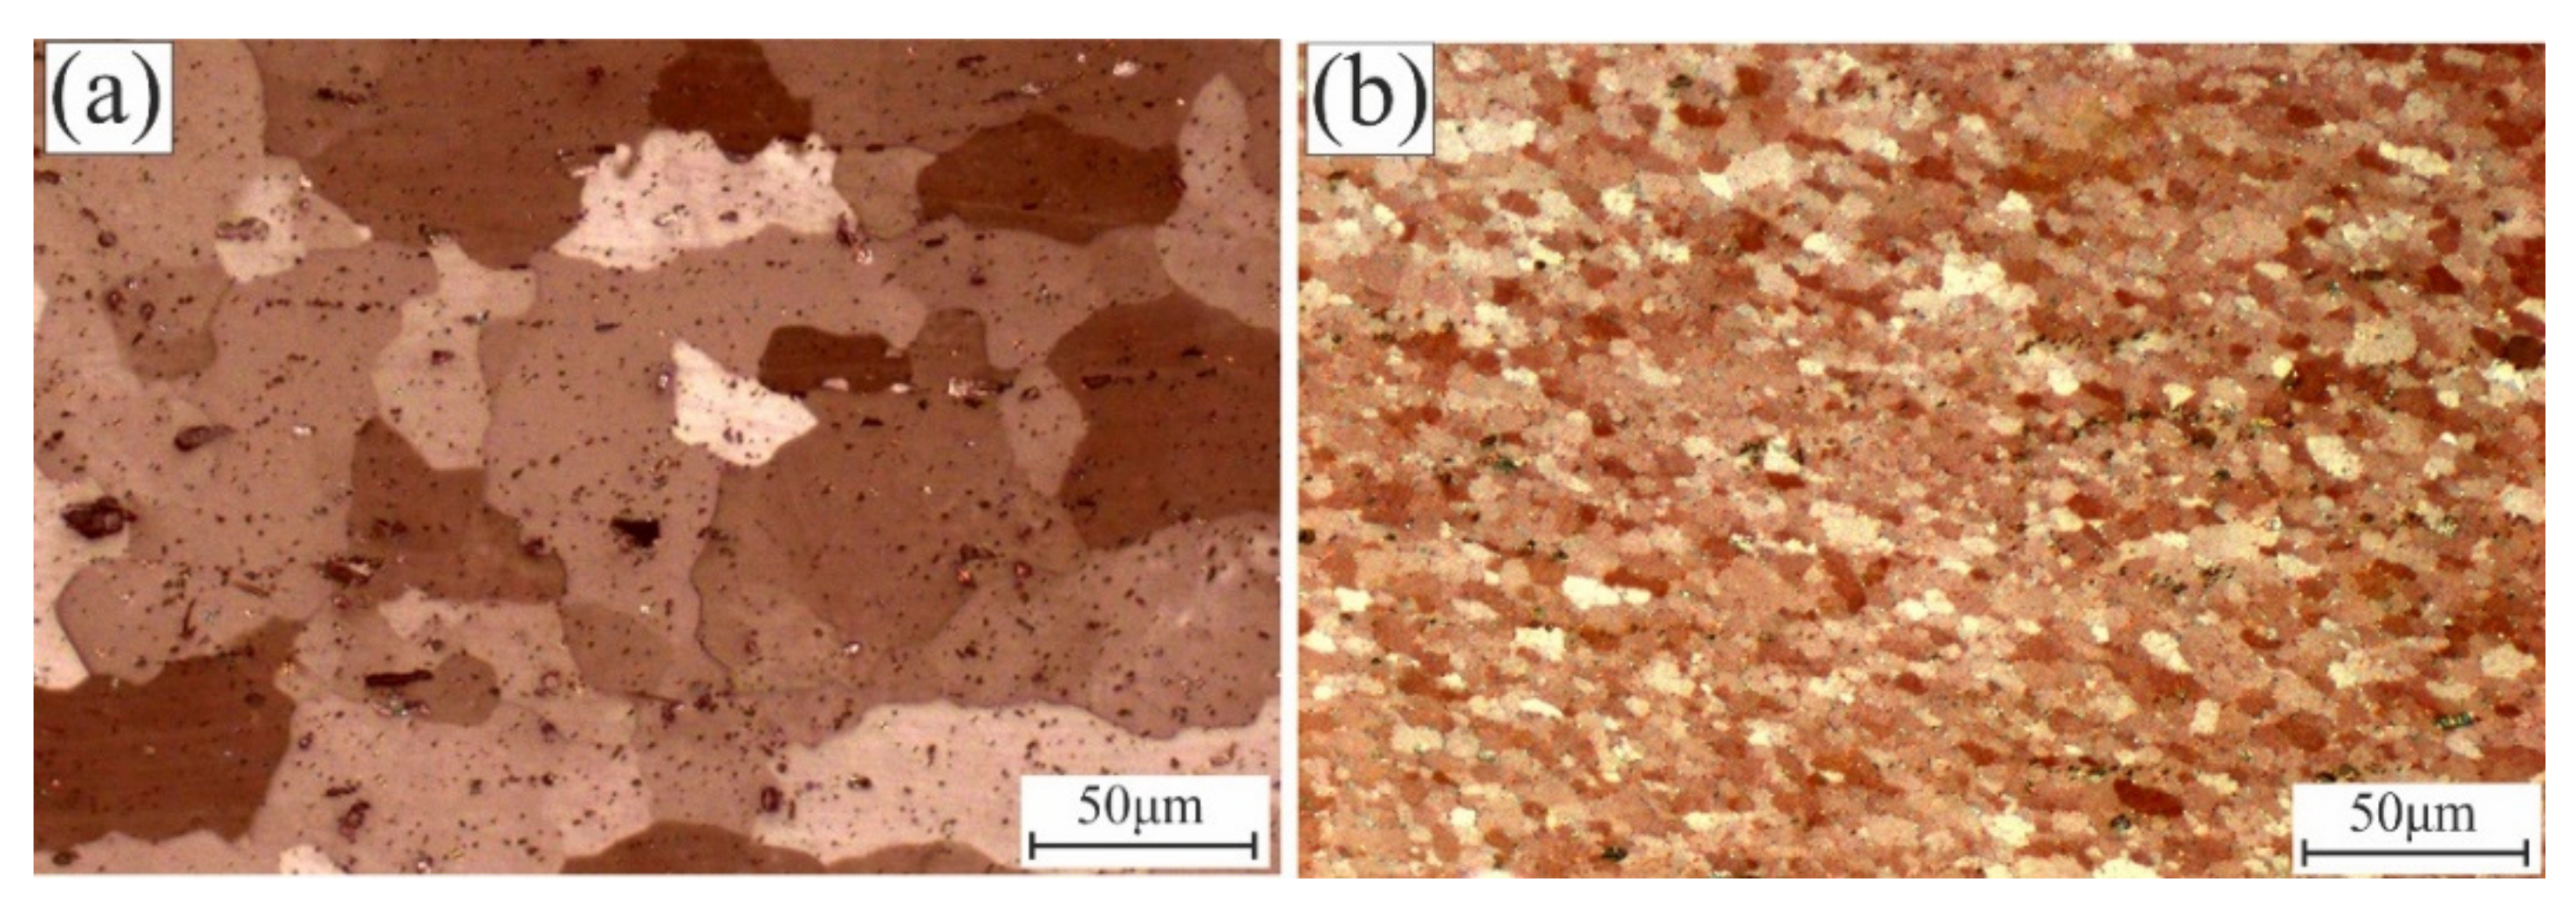
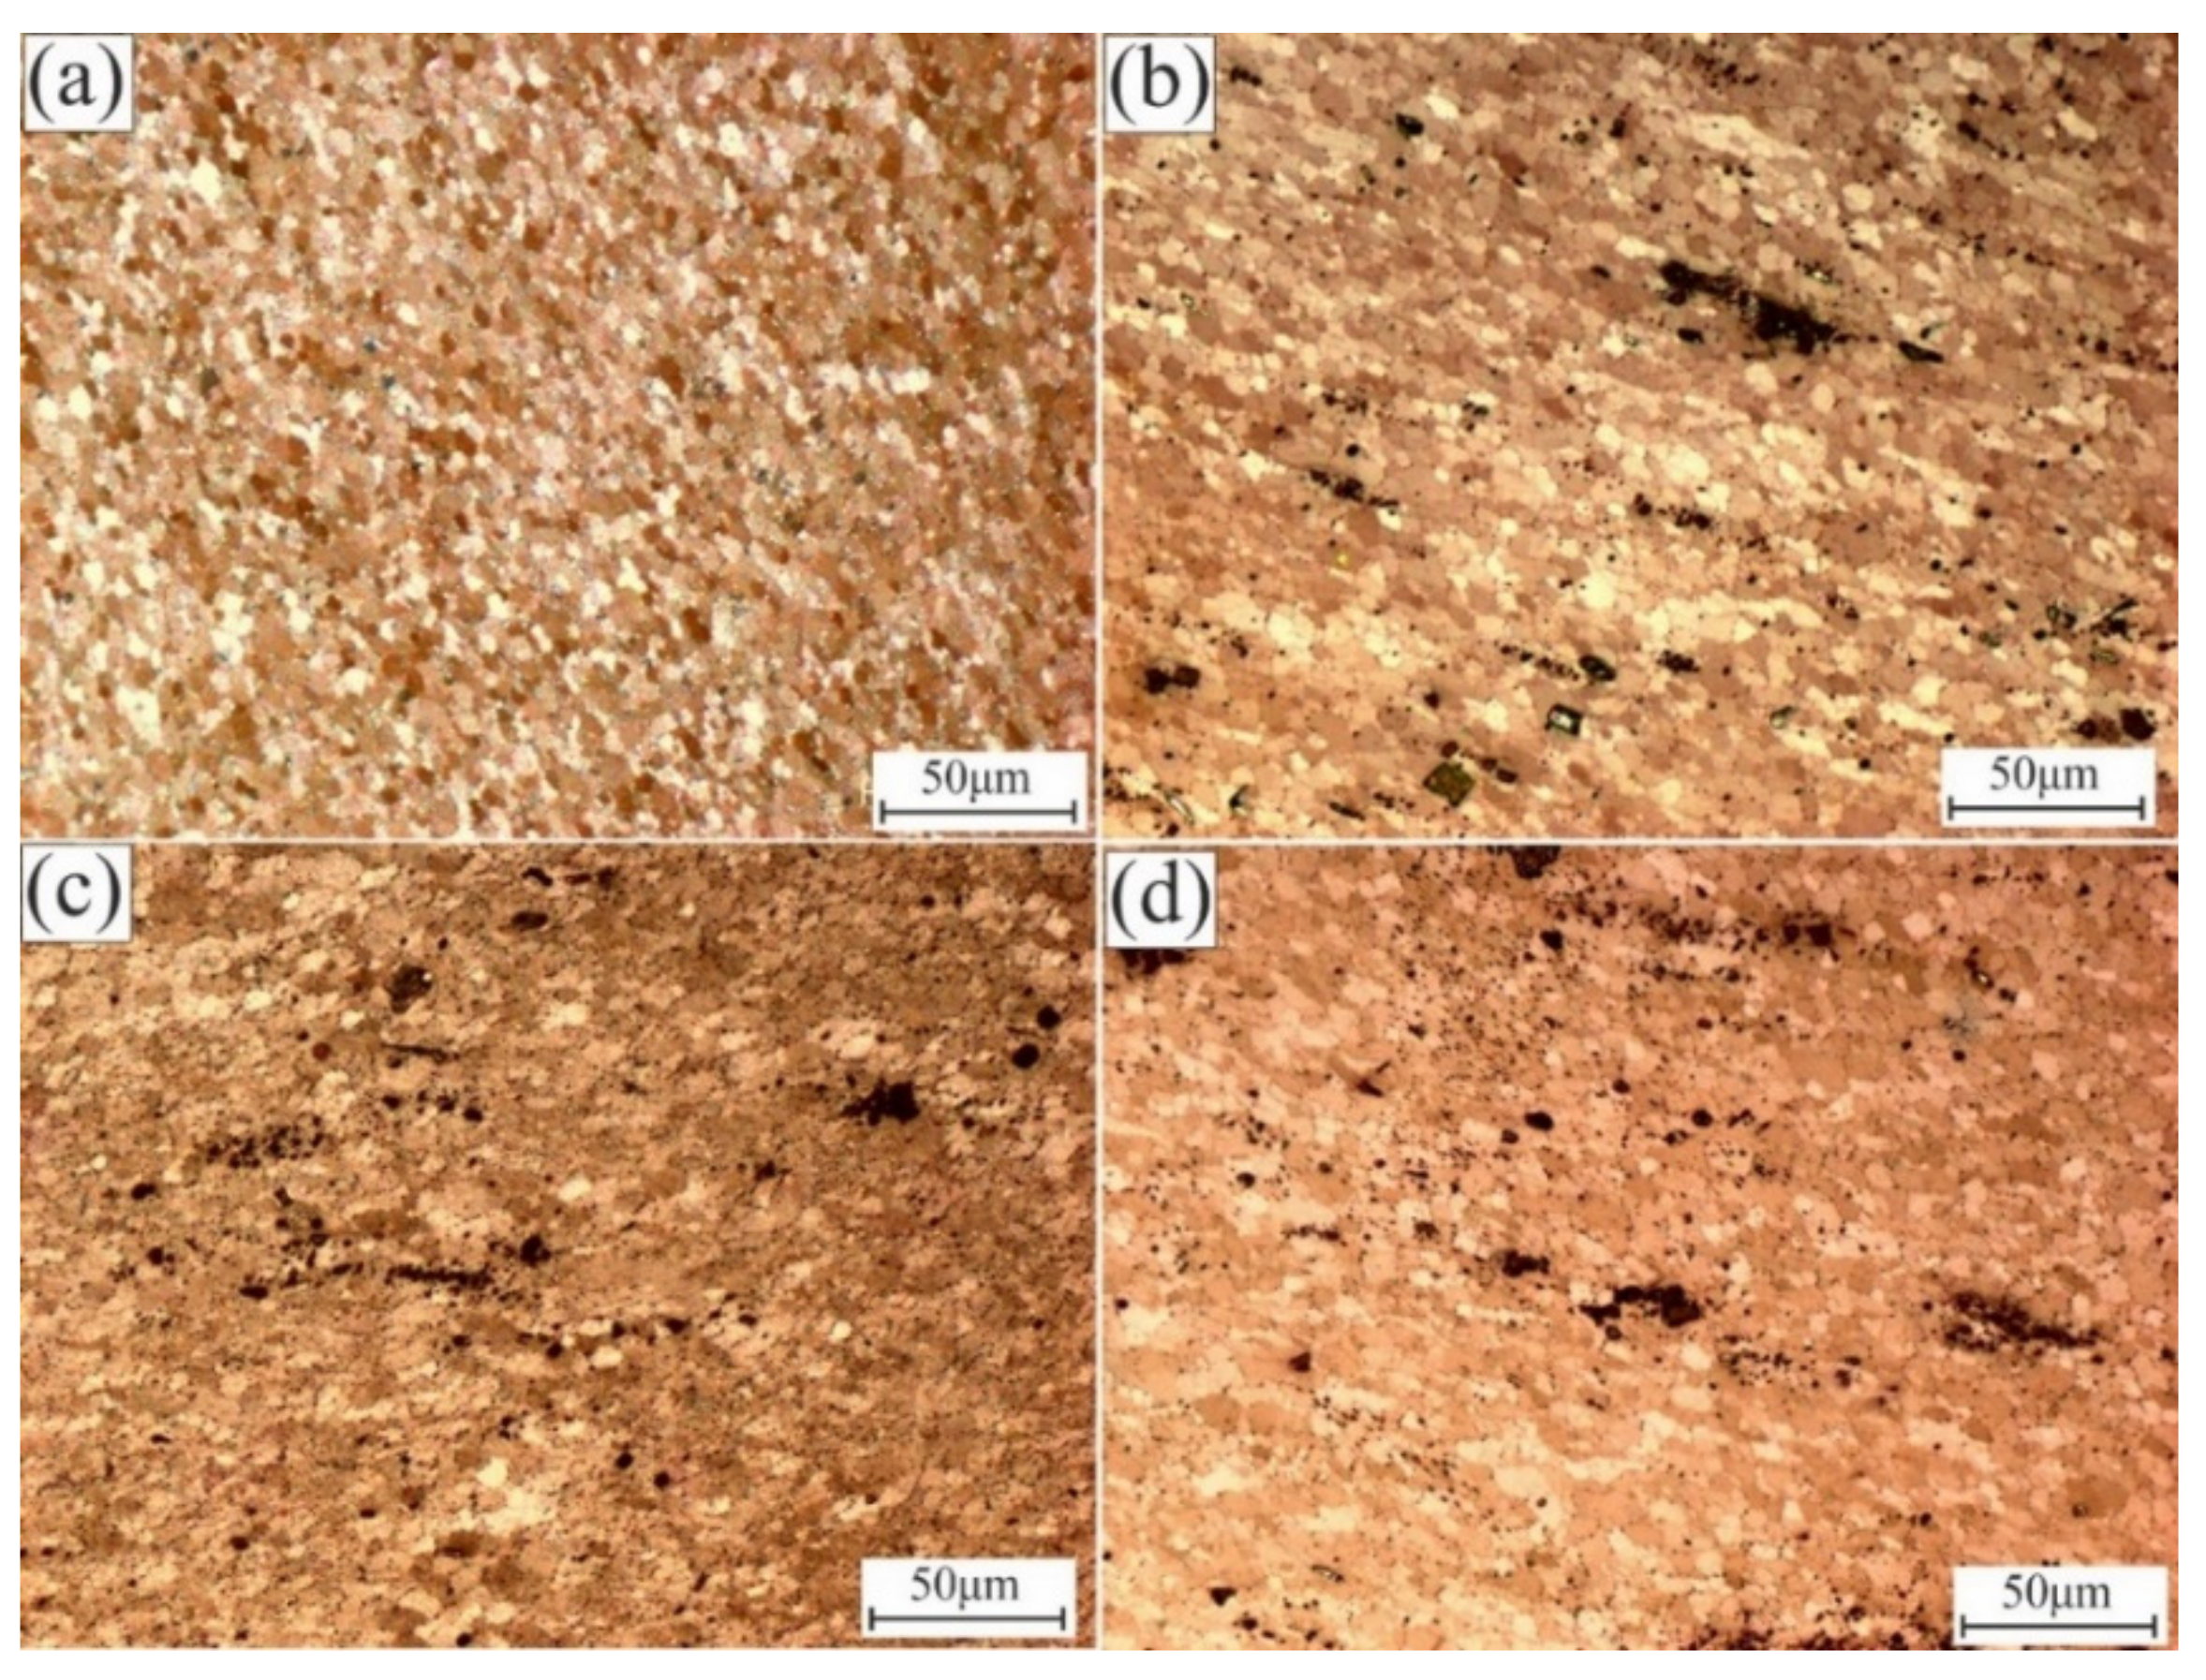
3.1. Microstructure Analysis
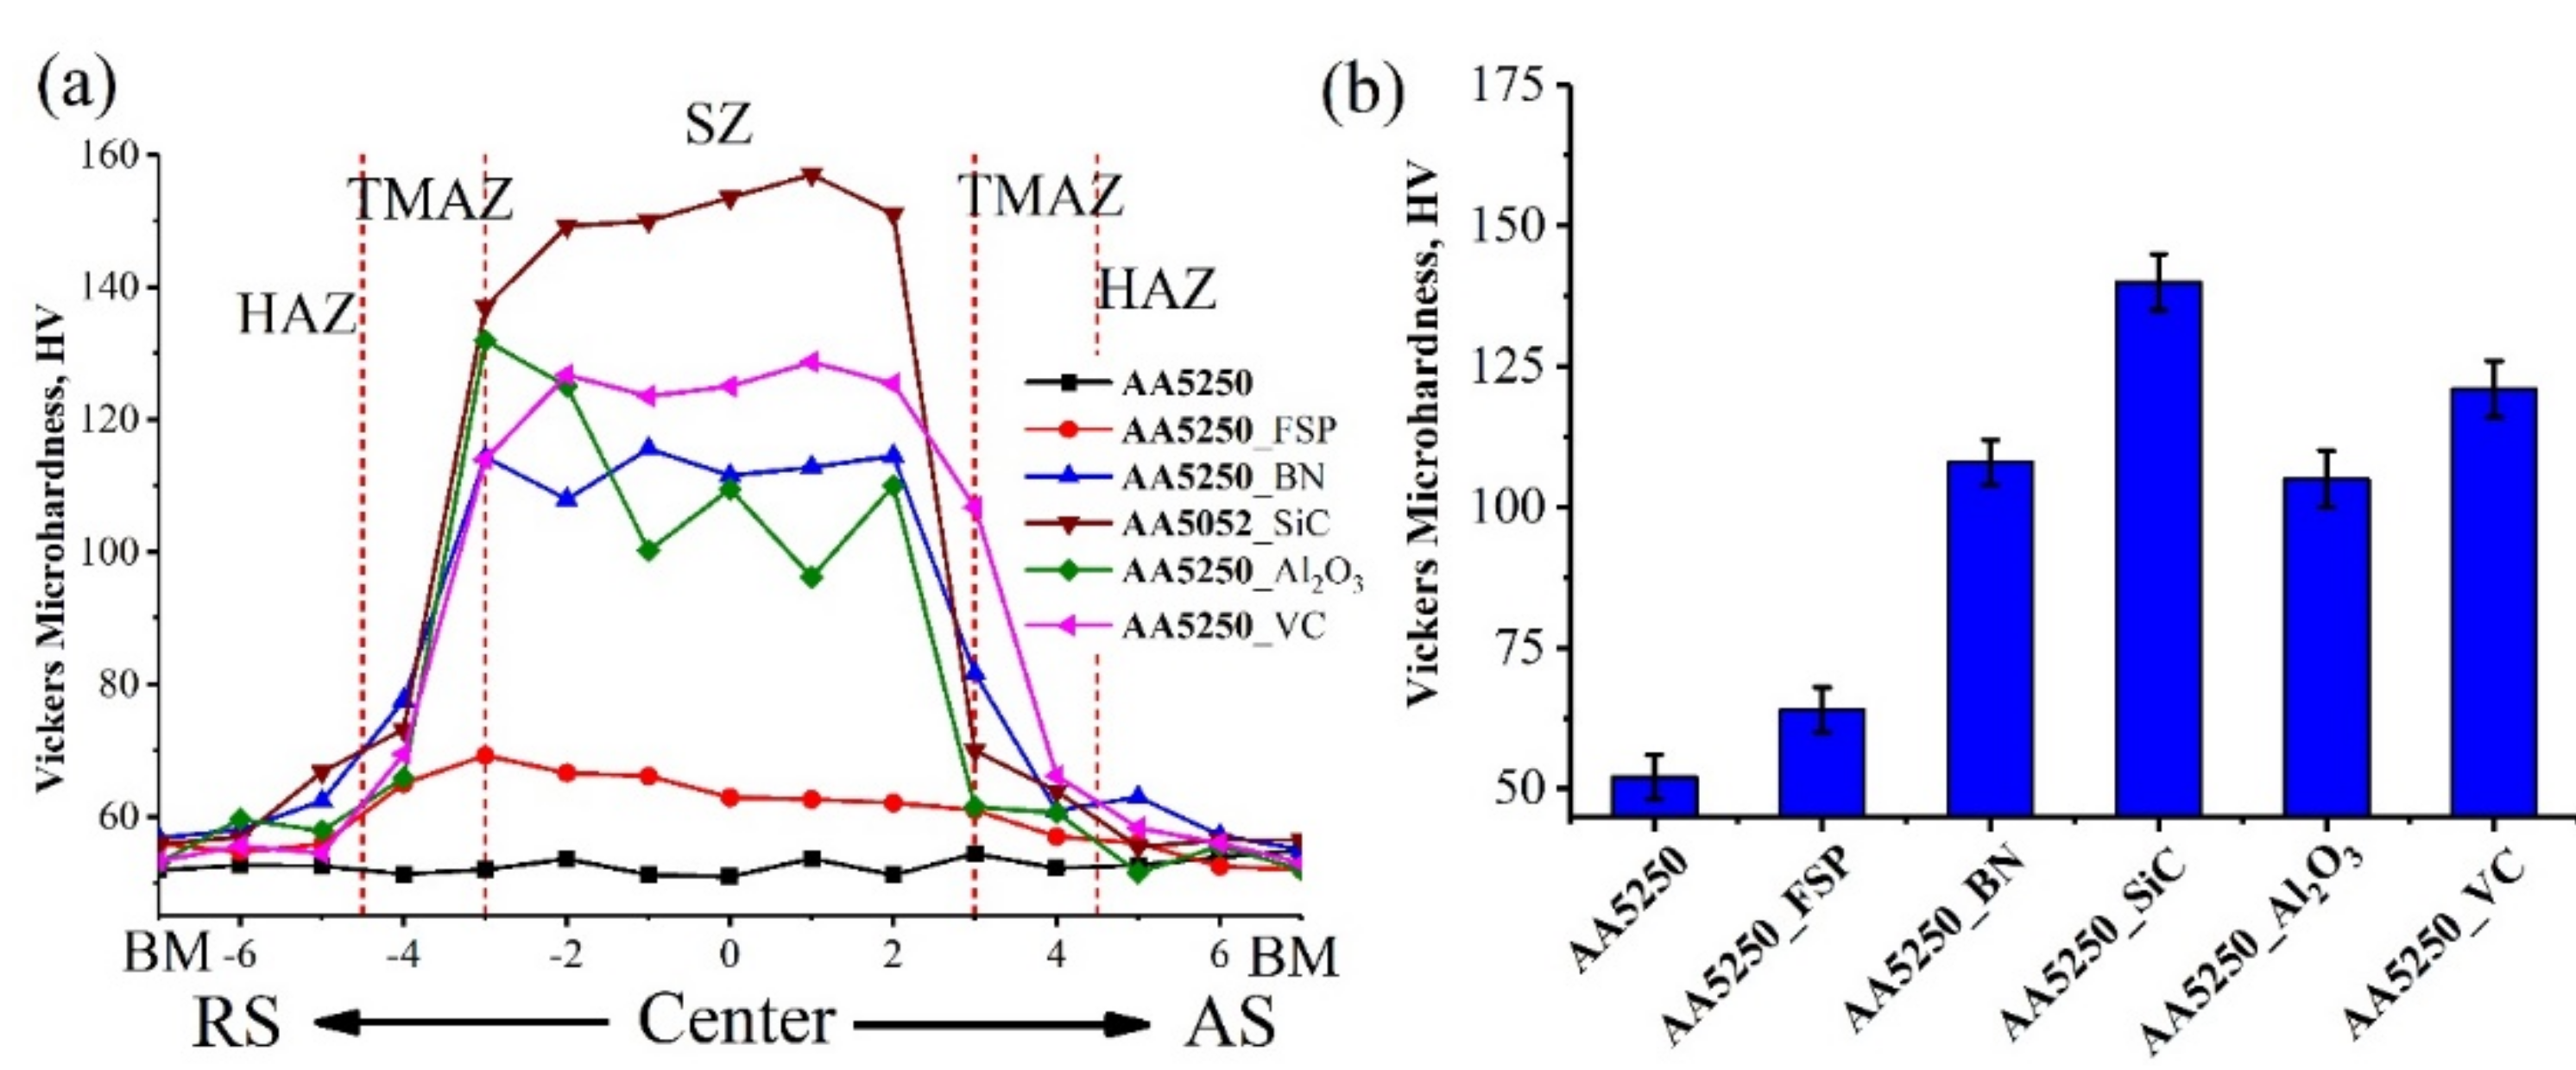
3.2. Micro-Hardness
3.3. Tribological (Wear and Coefficient of Friction) Behavior
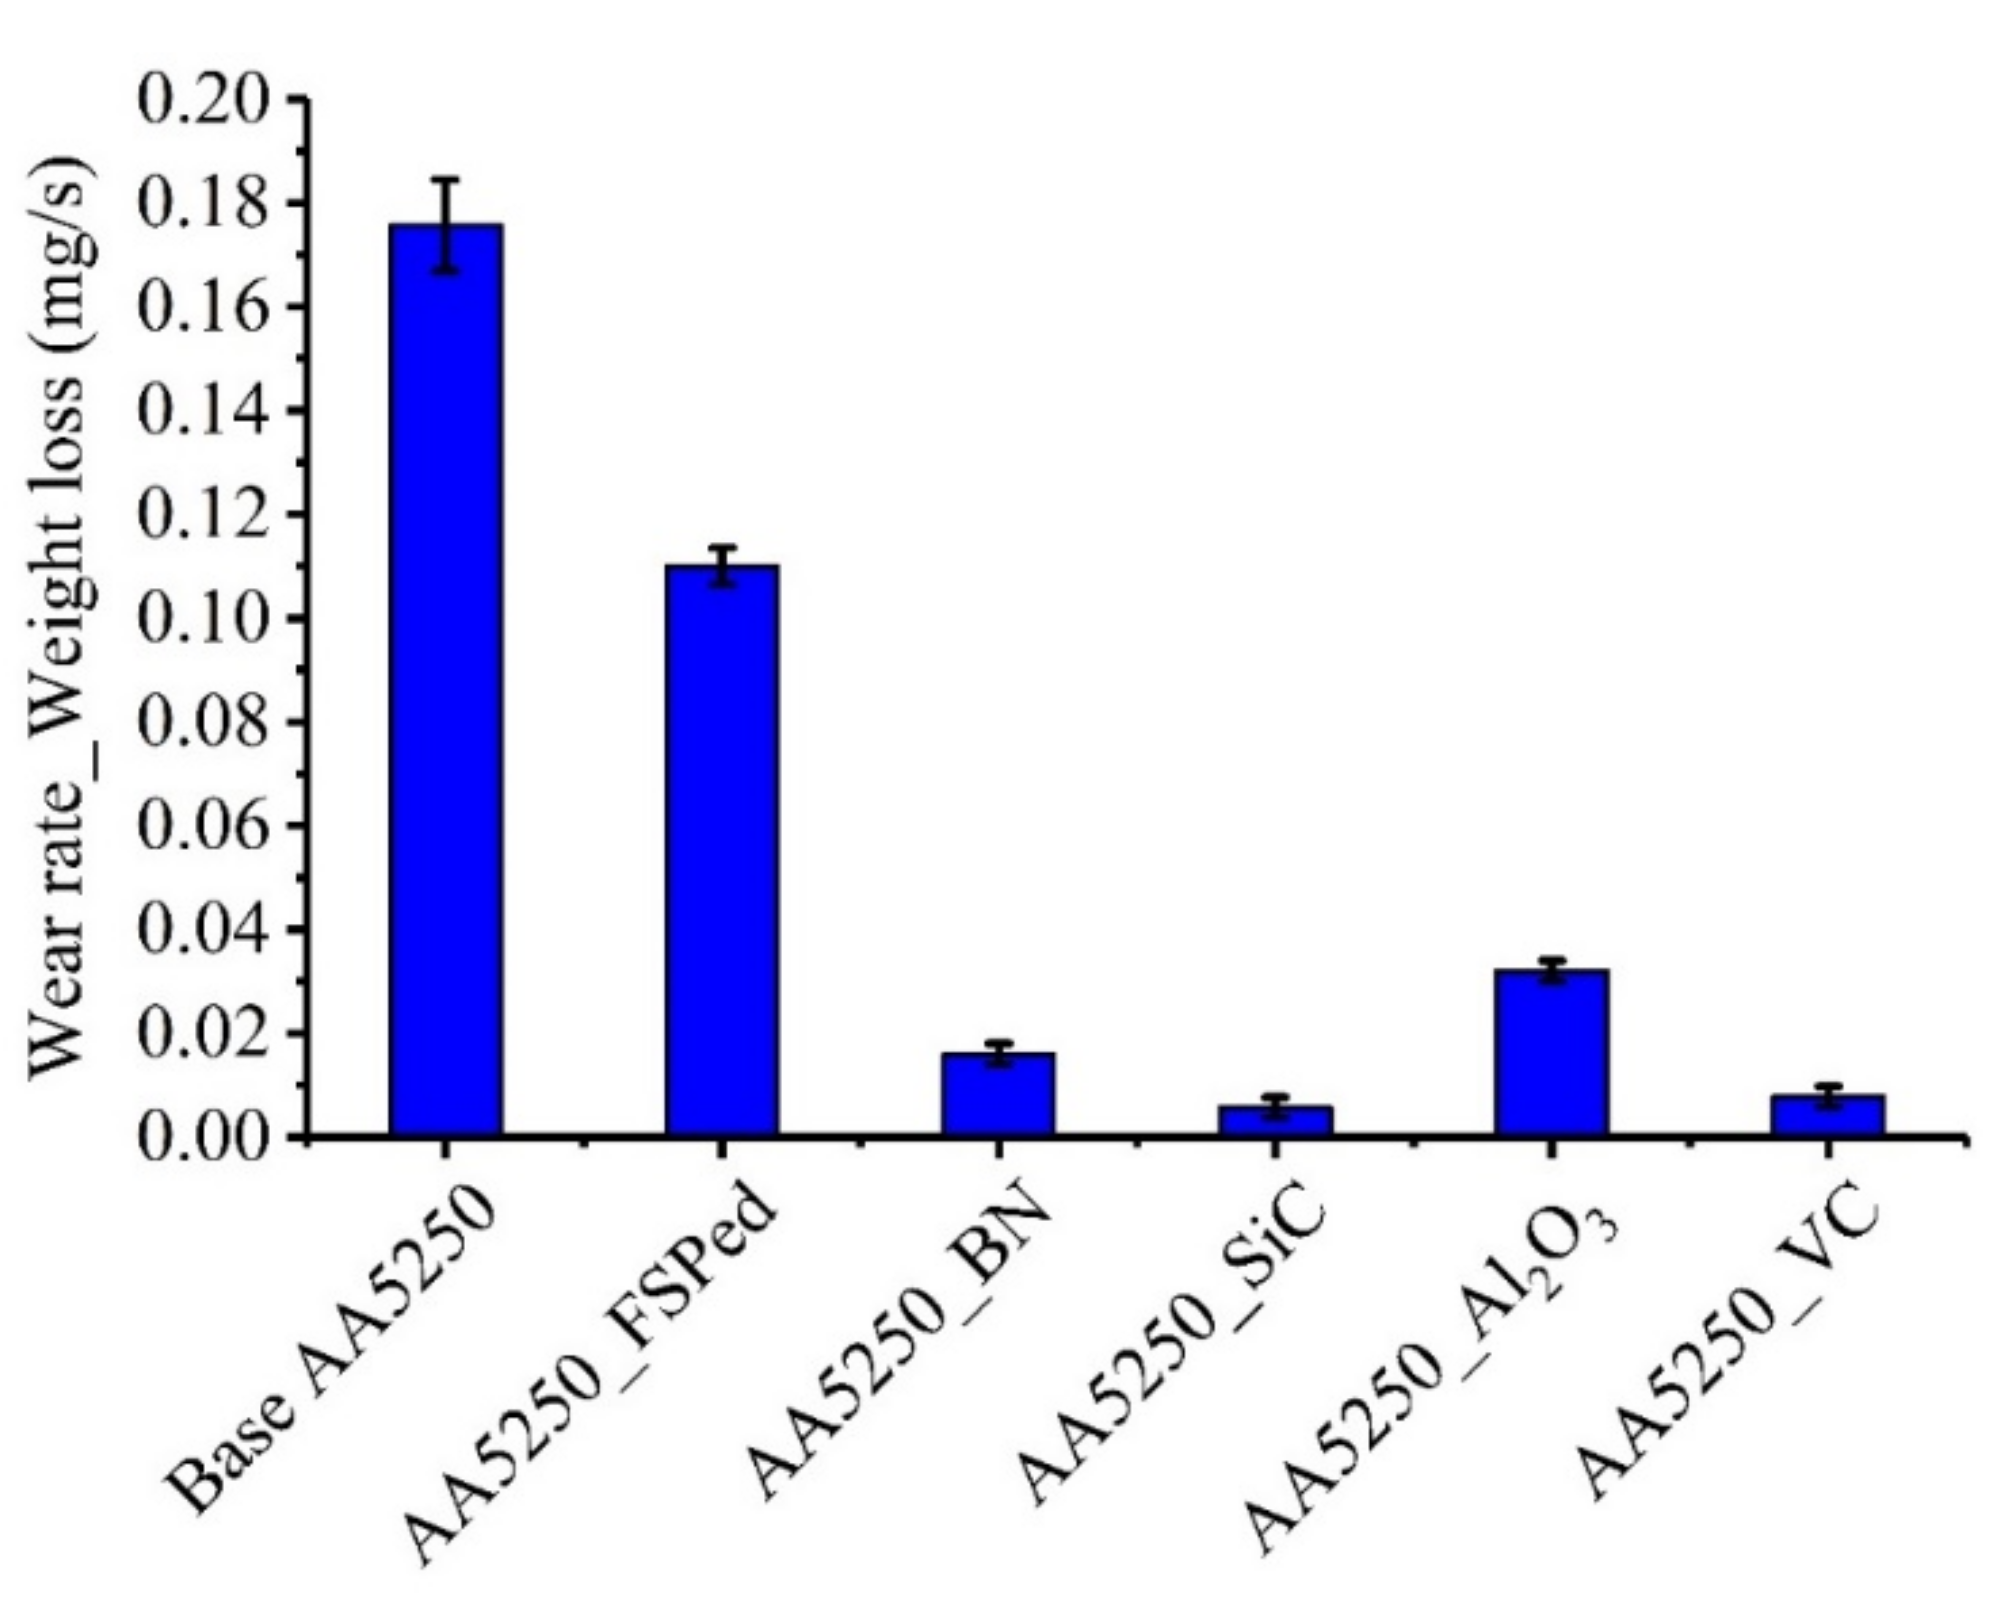
3.3.1. Wear Characterization by Weight Loss
3.3.2. Wear Characterization by Volume Loss
3.4. Weight and Cost Analysis of the Manufactured Composites
3.5. Overall Assessment of Fabricated Nanocomposites
- X is the unified value corresponding to Y;
- Y is the relative strength and weakness points values;
- Ymax is the maximum value in strength points, in hardness, wear resistance, and COF;
- Ymin is the minimum value in weakness points, in density, and cost.For example, normalizing strength points, in the case of hardness, the Ymax = 169.2, so we take it = 20. For the AA5250/BN composite, the Y= 107.7, then the . In the same way, all the values for hardness, wear, and COF can be calculated.
- For example, in the case of cost, normalizing weakness points, Ymin = 2222.2, so we take it = 20. For the AA5250/BN composite, the Y= 10,000, then the . In the same way, all the values for cost and densities can be calculated.
4. Conclusions
- The manufactured composites reinforced with SiC and VC nanoparticles have the maximum wear resistance and hardness behavior than the other investigated composites.
- The BN nanoparticles significantly affected the dry friction behavior when impeded into the AA5250 metal matrix. Hence, the lower friction coefficient value was achieved in the AA5250/BN nanocomposite, which was μ = 0.28.
- BN nanoparticles reduced the composite density by 2.7%. While, SiC, Al2O3, and VC increased the nanocomposite density.
Author Contributions
Funding
Institutional Review Board Statement
Informed Consent Statement
Data Availability Statement
Acknowledgments
Conflicts of Interest
Nomenclature
| Al2O3 | Aluminum oxide |
| AMM | Aluminum metal matrix |
| AMMCs | Aluminum metal matrix composites |
| BM | Base metal |
| BN | Boron nitride |
| EDS | Energy-dispersive spectroscopy |
| FSP | Friction stir processing |
| HAZ | Heat-affected zone |
| HBN | Hexagonal boron nitride |
| MMC | Metal matrix composite |
| OM | Optical microscopy |
| SD | Standard deviation |
| SEM | Scanning electron microscopy |
| SiC | Silicon carbide |
| SZ | Nugget or stirred zone |
| TEM | Transmission electron microscopy |
| TMAZ | Thermomechanical affected zone |
| VC | Vanadium carbide |
| Vc, p,m | Volume of composite, nanoparticles, and matrix |
| L | Length of the composite |
| VFP,m | Volume fraction of the nanoparticles and matrix |
| ρc, p,m | Density composite, nanoparticles, and matrix |
| Mc, p, m | Mass of the composite, nanoparticles, and matrix |
| Wh,w,f,d,c | Weight fraction of hardness, wear resistance, COF, density, and cost |
| Y | The relative strength and weakness points values |
| X | The unified value corresponding to Y |
| Ymax | The maximum value in strength points, hardness, wear resistance, and COF |
| Ymin | The minimum value in weakness points, density, and cost |
References
- Ervina Efzan, M.N.; Siti Syazwani, N.; Al Bakri Abdullah, M.M. Fabrication method of aluminum matrix composite (AMCs): A review. Key Eng. Mater. 2016, 700, 102–110. [Google Scholar] [CrossRef]
- Chao, W.; Xue, X.; Cao, X.; He, Y.; Gongjin, C. The effect of Ti addition on the microstructure and fracture toughness of Bn-Al composite materials synthesized by vacuum infiltration. Arch. Metall. Mater. 2013, 58, 509–512. [Google Scholar] [CrossRef] [Green Version]
- Xiaozhou, C.; Chao, W.; Xiangxin, X.; Cheng, G. Effect of Ti addition on the residual aluminium content and mechanical properties of the B4C-Al composites produced by vacuum infiltration/wpływ dodatku tytanu na resztkową zawartość aluminium i właściwości mechaniczne kompozytów B4C-Al wytworzonych przez infiltrację próżniową. Arch. Metall. Mater. 2015, 60, 2493–2498. [Google Scholar]
- Essam Moustafa, S.A.-W.; Tamer Mahmoud, E.-S.E.-K. Review multi pass friction stir processing. Am. Sci. Res. J. Eng. Technol. Sci. 2006, 22, 98–108. [Google Scholar]
- Mishra, R.S.; Ma, Z.Y.; Charit, I. Friction stir processing: A novel technique for fabrication of surface composite. Mater. Sci. Eng. A 2003, 341, 307–310. [Google Scholar] [CrossRef]
- AbuShanab, W.S.; Moustafa, E.B. Detection of friction stir welding defects of AA1060 aluminum alloy using specific damping capacity. Materials 2018, 11, 2437. [Google Scholar] [CrossRef] [PubMed] [Green Version]
- Nirmal Kumar, K.; Aravindkumar, N.; Eswaramoorthi, K. Fabrication of AA6016/(Al2O3 + AlN) hybrid surface composite using friction stir processing. Mater. Today Proc. 2020, 33, 315–319. [Google Scholar] [CrossRef]
- Moustafa, E. Effect of multi-pass friction stir processing on mechanical properties for AA2024/Al2O3 nanocomposites. Materials 2017, 10, 1053. [Google Scholar] [CrossRef] [Green Version]
- El-Danaf, E.A.; El-Rayes, M.M.; Soliman, M.S. Friction stir processing: An effective technique to refine grain structure and enhance ductility. Mater. Des. 2010, 31, 1231–1236. [Google Scholar] [CrossRef]
- Moustafa, E.B.; Taha, M.A. Preparation of high strength graphene reinforced Cu-based nanocomposites via mechanical alloying method: Microstructural, mechanical and electrical properties. Appl. Phys. A 2020, 126, 220. [Google Scholar] [CrossRef]
- Moustafa, E.B.; Mosleh, A.O. Effect of (Ti–B) modifier elements and FSP on 5052 aluminum alloy. J. Alloys Compd. 2020, 823, 153745. [Google Scholar] [CrossRef]
- Moustafa, E.B. Dynamic characteristics study for surface composite of AMMNCs matrix fabricated by friction stir process. Materials 2018, 11, 1240. [Google Scholar] [CrossRef] [PubMed] [Green Version]
- AbuShanab, W.S.; Moustafa, E.B. Effects of friction stir processing parameters on the wear resistance and mechanical properties of fabricated metal matrix nanocomposites (MMNCs) surface. J. Mater. Res. Technol. 2020, 9, 7460–7471. [Google Scholar] [CrossRef]
- Otitoju, T.A.; Okoye, P.U.; Chen, G.; Li, Y.; Okoye, M.O.; Li, S. Advanced ceramic components: Materials, fabrication, and applications. J. Ind. Eng. Chem. 2020, 85, 34–65. [Google Scholar] [CrossRef]
- Pol, N.; Verma, G.; Pandey, R.P.; Shanmugasundaram, T. Fabrication of AA7005/TiB2-B4C surface composite by friction stir processing: Evaluation of ballistic behaviour. Def. Technol. 2019, 15, 363–368. [Google Scholar] [CrossRef]
- Zayed, A.S.; Kamel, B.M.; Abdelsadek Osman, T.; Elkady, O.A.; Ali, S. Experimental study of tribological and mechanical properties of aluminum matrix reinforced by Al2O3/CNTs. Fuller. Nanotub. Carbon Nanostruct. 2019, 27, 538–544. [Google Scholar] [CrossRef]
- Heidarpour, A.; Mazaheri, Y.; Roknian, M.; Ghasemi, S. Development of Cu-TiO2 surface nanocomposite by friction stir processing: Effect of pass number on microstructure, mechanical properties, tribological and corrosion behavior. J. Alloys Compd. 2019, 783, 886–897. [Google Scholar] [CrossRef]
- Kumar, P.A.; Madhu, H.C.; Pariyar, A.; Perugu, C.S.; Kailas, S.V.; Garg, U.; Rohatgi, P. Friction stir processing of squeeze cast A356 with surface compacted graphene nanoplatelets (GNPs) for the synthesis of metal matrix composites. Mater. Sci. Eng. A 2020, 769, 138517. [Google Scholar] [CrossRef]
- Deore, H.A.; Bhardwaj, A.; Rao, A.G.; Mishra, J.; Hiwarkar, V.D. Consequence of reinforced SiC particles and post process artificial ageing on microstructure and mechanical properties of friction stir processed AA7075. Def. Technol. 2020, 16, 1039–1050. [Google Scholar] [CrossRef]
- Patil, N.A.; Pedapati, S.R.; Mamat, O.; Lubis, A.M.H.S. Morphological characterization, statistical modeling and wear behavior of AA7075-titanium carbide-graphite surface composites via friction stir processing. J. Mater. Res. Technol. 2021, 11, 2160–2180. [Google Scholar] [CrossRef]
- Mondal, S. Aluminum or its alloy matrix hybrid nanocomposites. Met. Mater. Int. 2020, 27, 1–17. [Google Scholar] [CrossRef]
- Arab, M.; Marashi, S.P.H. Graphene nanoplatelet (GNP)-incorporated AZ31 magnesium nanocomposite: Microstructural, mechanical and tribological properties. Tribol. Lett. 2018, 66, 1–11. [Google Scholar] [CrossRef]
- Al-Salihi, H.A.; Mahmood, A.A.; Alalkawi, H.J. Mechanical and wear behavior of AA7075 aluminum matrix composites reinforced by Al2O3nanoparticles. Nanocomposites 2019, 5, 67–73. [Google Scholar] [CrossRef] [Green Version]
- Moustafa, E.B.; Melaibari, A.; Basha, M. Wear and microhardness behaviors of AA7075/SiC-BN hybrid nanocomposite surfaces fabricated by friction stir processing. Ceram. Int. 2020, 46, 16938–16943. [Google Scholar] [CrossRef]
- Kheirkhah, S.; Imani, M.; Aliramezani, R.; Zamani, M.H.; Kheilnejad, A. Microstructure, mechanical properties and corrosion resistance of Al6061/BN surface composite prepared by friction stir processing. Surf. Topogr. Metrol. Prop. 2019, 7, 035002. [Google Scholar] [CrossRef]
- Moustafa, E.B.; AbuShanab, W.S.; Ghandourah, E.; Taha, M.A. Microstructural, mechanical and thermal properties evaluation of AA6061/Al2O3-BN hybrid and mono nanocomposite surface. J. Mater. Res. Technol. 2020, 9, 15486–15495. [Google Scholar] [CrossRef]
- Bodrova, L.E.; Pastukhov, E.A. Interaction between vanadium carbide and aluminum and copper melts. Russ. Metall. 2013, 2013, 112–114. [Google Scholar] [CrossRef]
- Ghasali, E.; Pakseresht, A.H.; Alizadeh, M.; Shirvanimoghaddam, K.; Ebadzadeh, T. Vanadium carbide reinforced aluminum matrix composite prepared by conventional, microwave and spark plasma sintering. J. Alloys Compd. 2016, 688, 527–533. [Google Scholar] [CrossRef]
- Babu, N.A.; Ravi, B.; Rajkumar, G. Process Parameter optimization for Producing AA7075/WC composites by Friction stir welding. Mater. Today Proc. 2018, 5, 18992–18999. [Google Scholar] [CrossRef]
- Humphreys, J.; Rohrer, G.S.; Rollett, A. Hot Deformation and Dynamic Restoration. In Recrystallization and Related Annealing Phenomena; Elsevier: Amsterdam, The Netherlands, 2017; pp. 469–508. [Google Scholar]
- Valiev, R.Z. 1—Producing bulk nanostructured metals and alloys by severe plastic deformation (SPD). In Nanostructured Metals and Alloys; Whang, S.H., Ed.; Woodhead Publishing: Cambridge, UK, 2011; pp. 3–39. [Google Scholar]
- Whang, S.H. (Ed.) Nanostructured Metals and Alloys: Processing, Microstructure, Mechanical Properties and Applications; Woodhead Publishing: Cambridge, UK, 2011; pp. 178–208. [Google Scholar]
- Thorsen, P.A.; Bilde-Sørensen, J.B. The Influence of Grain Boundary Structure on Diffusional Creep. Mater. Sci. Forum 1998, 131–134. [Google Scholar] [CrossRef]
- Abdel Aziz, S.S.; Abulkhair, H.; Moustafa, E.B. Role of hybrid nanoparticles on thermal, electrical conductivity, microstructure, and hardness behavior of nanocomposite matrix. J. Mater. Res. Technol. 2021, 13, 1275–1284. [Google Scholar] [CrossRef]
- Mucelin, K.J.; da Costa Gonçalves, P.; Hammes, G.; Binder, R.; Janssen, R.; Klein, A.N.; de Mello, J.D.B. Tribological Study of Self-Lubricating Composites with Hexagonal Boron Nitride and Graphite as Solid Lubricants. In Proceedings of the 2nd International Brazilian Conference on Tribology, Foz do Iguaçu, Brazil, 3–5 November 2014; pp. 3772–3781. [Google Scholar]
- Menezes, P.L.; Kailas, S.V. Studies on friction and transfer layer using inclined scratch. Scratch. Mater. Appl. 2006, 29, 262–279. [Google Scholar]
- Cowap, M.J.; Moghaddam, S.R.; Menezes, P.L.; Beschorner, K.E. Contributions of adhesion and hysteresis to coefficient of friction between shoe and floor surfaces: Effects of floor roughness and sliding speed. Tribol. Mater. Surf. Interfaces 2015, 9, 77–84. [Google Scholar] [CrossRef]
- Totten, G.E. (Ed.) Handbook, ASM in Friction, Lubrication, and Wear Technology; ASM International: Novelty, OH, USA, 2017. [Google Scholar]
- Manivannan, I.; Ranganathan, S.; Gopalakannan, S.; Suresh, S.; Nagakarthigan, K.; Jubendradass, R. Tribological and surface behavior of silicon carbide reinforced aluminum matrix nanocomposite. Surf. Interfaces 2017, 8, 127–136. [Google Scholar] [CrossRef]
- Gostariani, R.; Ebrahimi, R.; Asadabad, M.A.; Paydar, M.H. Mechanical properties of Al/BN nanocomposites fabricated by planetary ball milling and conventional hot extrusion. Acta Metall. Sin. Engl. Lett. 2017, 31, 245–253. [Google Scholar] [CrossRef]
- Öner, M.; Kızıl, G.; Keskin, G.; Pochat-Bohatier, C.; Bechelany, M. The Effect of boron nitride on the thermal and mechanical properties of poly(3-hydroxybutyrate-co-3-hydroxyvalerate). Nanomaterials 2018, 8, 940. [Google Scholar] [CrossRef] [PubMed] [Green Version]
- El-Tantawy, A.; Daoush, W.M.; El-Nikhaily, A.E. Microstructure and properties of BN/Ni-Cu composites fabricated by powder technology. J. Exp. Nanosci. 2018, 13, 174–187. [Google Scholar] [CrossRef] [Green Version]
- Paulraj, P.; Harichandran, R. The tribological behavior of hybrid aluminum alloy nanocomposites at high temperature: Role of nanoparticles. J. Mater. Res. Technol. 2020, 9, 11517–11530. [Google Scholar] [CrossRef]


| Si | Fe | Cu | Mn | Mg | Cr | Zn | Ti | Al |
|---|---|---|---|---|---|---|---|---|
| 0.1 | 0.21 | 0.1 | 0.05 | 1.83 | 0.25 | 0.03 | 0.04 | remain |
| C | Si | Mn | Cr | Mo | V | Fe |
|---|---|---|---|---|---|---|
| 0.39 | 0.90 | 0.40 | 5.20 | 1.40 | 0.95 | remain |
| Samples | BM | AA5250_FSP | AA5250_BN | AA5250_SiC | AA5250_Al2O3 | AA5250_VC |
|---|---|---|---|---|---|---|
| Average grain size (μm) | 70 ± 10 | 8 ± 1.1 | 3.5 ± 1 | 4 ± 0.8 | 5 ± 1.3 | 4.2 ± 0.9 |
| Aspect ratio | 4 ± 0.4 | 1.05 ± 0.02 | 1.04 ± 0.02 | 1.03 ± 0.02 | 1.04 ± 0.02 | 1.05 ± 0.02 |
| Sample | Volume Loss (mm3) | Sample | Volume Loss (mm3) |
|---|---|---|---|
| Base AA5250 | 3.41 × 10⁻³ | AA5250_VC | 3.65 × 10⁻⁴ |
| FSP AA5250 | 1.70 × 10⁻³ | AA5250_BN | 4.24 × 10⁻⁴ |
| AA5250_SiC | 2.12 × 10⁻⁴ | AA5250_Al2O3 | 1.32 × 10⁻³ |
| Composite | , g/cm3 | , cm3 | ||||
|---|---|---|---|---|---|---|
| AA5250/BN | 2.1 | 0.42 | 2.68 | 3.33 | 3.75 | 2.61 |
| AA5250/SiC | 3.21 | 0.42 | 2.68 | 3.33 | 3.75 | 2.74 |
| AA5250/Al2O3 | 3.93 | 0.42 | 2.68 | 3.33 | 3.75 | 2.82 |
| AA5250/VC | 5.77 | 0.42 | 2.68 | 3.33 | 3.75 | 3.03 |
| Composite | Ceramics Cost, $/g | Matrix Cost, $/g | Total Nanocomposite Cost $/g | ||
|---|---|---|---|---|---|
| AA5250/BN | 0.88 | 4.5 | 8.92 | 0.045 | 4.545 |
| AA5250/SiC | 1.35 | 1.8 | 8.92 | 0.045 | 1.845 |
| AA5250/Al2O3 | 1.65 | 1 | 8.92 | 0.045 | 1.045 |
| AA5250/VC | 2.42 | 1.6 | 8.92 | 0.045 | 1.645 |
| Composite | Hardness, % | Wear Resistance, % | COF, % | Density, % | Cost, % |
|---|---|---|---|---|---|
| AA5250/BN | 107.7 | 850.5 | 161.2 | −2.7 | +10,000 |
| AA5250/SiC | 169.2 | 2244.5 | 92.4 | +2.2 | +4000 |
| AA5250/Al2O3 | 101.9 | 303.4 | 69.6 | +5.0 | +2222.2 |
| AA5250/VC | 132.7 | 1492.6 | 58.0 | +11.6 | +3555.6 |
| Composite | Strength Points (Positive or Desirable) | Weakness Points (Negative or Undesirable) | Overall Assessment, % | Rank | |||
|---|---|---|---|---|---|---|---|
| Hardness, % | Wear Resistance, % | COF, % | Density, % | Cost, % | |||
| AA5250/BN | 12.8 | 7.6 | 20 | 20 | 4.4 | 64.8 | 2 |
| AA5250/SiC | 20 | 20 | 11.4 | 16.3 | 11.2 | 78.9 | 1 |
| AA5250/Al2O3 | 12 | 2.7 | 8.6 | 10.8 | 20 | 54.1 | 3 |
| AA5250/VC | 15.6 | 13.3 | 6.8 | 4.6 | 12.5 | 52.8 | 4 |
Publisher’s Note: MDPI stays neutral with regard to jurisdictional claims in published maps and institutional affiliations. |
© 2021 by the authors. Licensee MDPI, Basel, Switzerland. This article is an open access article distributed under the terms and conditions of the Creative Commons Attribution (CC BY) license (https://creativecommons.org/licenses/by/4.0/).
Share and Cite
Abushanab, W.S.; Moustafa, E.B.; Melaibari, A.A.; Kotov, A.D.; Mosleh, A.O. A Novel Comparative Study Based on the Economic Feasibility of the Ceramic Nanoparticles Role’s in Improving the Properties of the AA5250 Nanocomposites. Coatings 2021, 11, 977. https://doi.org/10.3390/coatings11080977
Abushanab WS, Moustafa EB, Melaibari AA, Kotov AD, Mosleh AO. A Novel Comparative Study Based on the Economic Feasibility of the Ceramic Nanoparticles Role’s in Improving the Properties of the AA5250 Nanocomposites. Coatings. 2021; 11(8):977. https://doi.org/10.3390/coatings11080977
Chicago/Turabian StyleAbushanab, Waheed Sami, Essam B. Moustafa, Ammar A. Melaibari, Anton D. Kotov, and Ahmed O. Mosleh. 2021. "A Novel Comparative Study Based on the Economic Feasibility of the Ceramic Nanoparticles Role’s in Improving the Properties of the AA5250 Nanocomposites" Coatings 11, no. 8: 977. https://doi.org/10.3390/coatings11080977
APA StyleAbushanab, W. S., Moustafa, E. B., Melaibari, A. A., Kotov, A. D., & Mosleh, A. O. (2021). A Novel Comparative Study Based on the Economic Feasibility of the Ceramic Nanoparticles Role’s in Improving the Properties of the AA5250 Nanocomposites. Coatings, 11(8), 977. https://doi.org/10.3390/coatings11080977