1. Introduction
The dynamically growing transport market requires the manufacture of dependable vehicles whose subassemblies are distinguished by durability permitting long-term safe operation. The widely developed production technology with the use of precision machine tools and various engineering robots meets that requirement to a considerable extent. However, the various components are fitted into subassemblies by various methods, from threaded connections through welded joints to push-fit joints, which may be a weak link reducing the reliability of the device. The latter joints are often used in the manufacture of motor and rail vehicles, sea-going vessels and aircraft. Examples include the wheel set’s wheel/axle assembly and the traction motor gear wheel/axle, brake disc/axle and piston pin/connecting rod assemblies. Push-fit joints are also used in other industries such as the medical [
1] or municipal industry, for example in gas engines built into cogeneration systems [
2,
3,
4]. The components in which the elements are connected by the push-fit method will frequently operate in harsh conditions and affect human safety. Rail vehicle wheel sets may be given as an example of such a situation. Those elements operate under a static load from the rail car body and dynamic forces from the contact surface between the wheel and rail at the same time. Premature wheel set damage during operation may lead to great disasters, as the world has witnessed many times over the years.
Although, owing to its advantages, the forcing method predominates over other processes, the method has several disadvantages which may disqualify that joint from operation. The disadvantages include, without limitation, plastic deformation of the material during the assembly process [
5]. Damage may also occur during repeated joint disassembly and assembly, which is why the authors of [
6] proposed an innovative solution permitting joint disassembly in a relatively only slightly invasive way. Those authors use low-frequency vibrations. Investigations demonstrated the increase of microhardness in the joint area and of roughness parameters, which permitted the avoidance of damage during disassembly and the extension of the product life cycle. Top layer microcracks, which may transform themselves into fretting [
7].
In light of the fact that forced-in and shrink push-fit joints are widely used to connect many elements important from a safety point of view, structural engineers and scientists are trying to find solutions permitting the elimination of disadvantageous phenomena connected with the forcing process. Mathematical analyses and those with the use of finite elements are performed at the design stage. One example is [
8], in which the authors provide simplified Lame’s equations for determining assembly pressures and stresses in thin wall rims. By means of the FEM (Finite Element Method) analysis, the authors of [
9] performed a simulation of the maximum forces needed to press one element onto another in relation to match values. Determining those values enables the above-discussed phenomena accompanying the forcing process to be minimised. The authors of [
10,
11] suggested an analytical method for designing a push-fit joint for the retention sleeves used for mounting the rotor with fixed magnets. With the use of that method, it is possible to determine the sleeve parameter fluctuation range quickly and easily and thus eliminate, for example, manufacturing imperfections.
One attempt to improve forced-in joint reliability at the manufacturing stage consists of the use of additional finish treatment to increase hardness or change roughness parameters. The most popular processing procedures include surface hardening, nitriding and finish rolling [
12,
13]. These are processes that do not generate additional high manufacturing costs for the items. In the case of the wheel/axle joint of a rail vehicle wheel set, the processes mentioned above are used on the axle, as its manufacturing costs are high, and the axle is used many times. It is, therefore, assumed that, in that pair, the axle should be able to fulfil its tasks for a specified period of time, and withstand several wheel exchanges. Other engineering processes that may improve axle fatigue strength include the application of PVD (Physical Vapour Deposition) coatings. It follows from the review of reference literature that DLC (Diamond Like Carbon) and TiSiN coatings are highly resistant to friction wear and oxidation [
14,
15,
16,
17].
TiSiN coatings have been widely researched and used to increase the mechanical performance of structural elements due to their excellent physical and chemical properties over other PVD coatings. They are characterized by high hardness and modulus of elasticity, a lower coefficient of friction, high resistance to oxidation, and better thermal stability [
18].
At the operation stage, joint wear may be monitored by keeping an operation time database until the occurrence of unserviceability and the type of damage and the consequences of unserviceability can be analysed. Such a database would enable the structural or processing errors to be corrected to avoid similar cases in the future. The data may be used, for example, to analyse reliability indicators.
The aim of this article is to present the most frequent types of damage to forced-in joints and to analyse reliability indicators according to the Weibull distribution. The results of macro- and microscopic observations of the surfaces and the top layers of shafts with various surface finishes have been compared. Wear test results are presented for shafts without additional finish treatment, rolled shafts and those with a TiSiN coating. Reliability indicators are treated similarly.
2. Reliability Indicators
The Weibull distribution was used to process the obtained data, which is one of the most frequently used in solving reliability issues. The Weibull distribution is flexible and adaptable to data in a wide range, whether the failure rate is increasing, decreasing or constant [
19,
20,
21]. The procedure for processing reliability data consists of the following steps:
Ascending organisation of input data;
Bernard’s approximation,
Insertion into the modified cumulation distribution function F(t);
Linear regression—equation of a straight line;
Calculation of the parameters of the shape α and the scale β of the Weibull distribution.
The arrangement of the values in ascending order is followed by an estimation of the cumulative distribution function
F(t) based on ordinal statistics, denoted median order. As a rule, Bernard’s approximation (1) is used for the median order.
where:
Fi(t)—estimate of median value (-);
i—number serial number of Operation time until failure t;
n—selection range.
Subsequently, a linear regression is used, which represents the approximation of the given values by a straight line by the method of least squares. The following Relations (2) to (6) represent the derivation of the calculations of the α shape parameter and the β scale parameter of the Weibull distribution from the cumulative function
F(
t) [
22,
23].
After simple mathematical adjustments and double logarithm, the cumulative function
F(t) can be transformed into the form of the equation of the straight line (7).
where:
y—dependent variable;
x—independent variable;
k—slope of a straight line, gradient;
q—the intercept of the line with the Y-axis, the absolute term.
To find the slope intercept the least squares method is used, when it is necessary to solve the system of regular Equations (8) and (9).
Then, the coefficients
k and
q can be calculated by Relations (10) and (11).
From the derived Relations (6) and (7), it is apparent that the value of the parameter of the form
α is equal to the slope of the line K (12).
The scale
β parameter can be calculated from the equation of the straight line using Relations (13) to (15) [
24,
25].
Based on the derived relations, it is possible to write the reliability rate indicators using the parameters
α and
β. The relationships are shown in
Table 1.
The expected correct operation time E(t) [
26] is one of the major reliability indicators. In this article, the value of the operation time median was determined graphically, following the previous collation of the cumulative distribution function F(t) and reliability function R(t). The indicator may be determined analytically using Formula (16).
3. The Object of Investigations and the Methodology
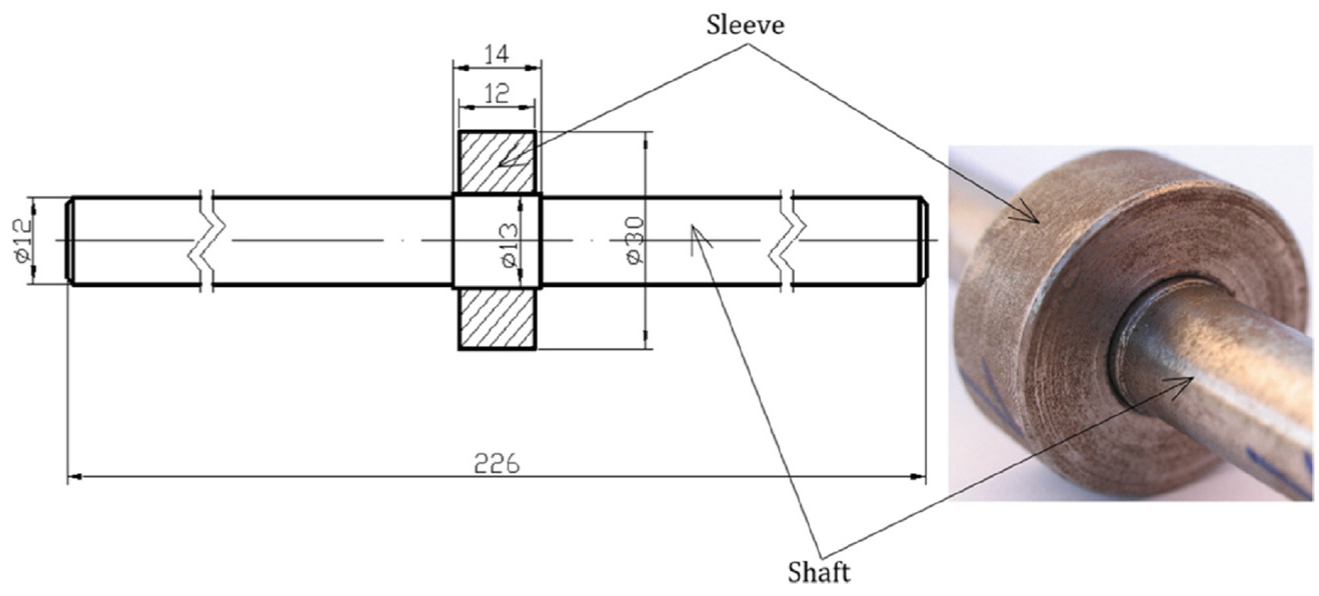
The reliability of forced-in joints consisting of a shaft and sleeve and made of C45 steel was analysed. The value of interference of the sleeve onto the shaft was 0.02 mm.
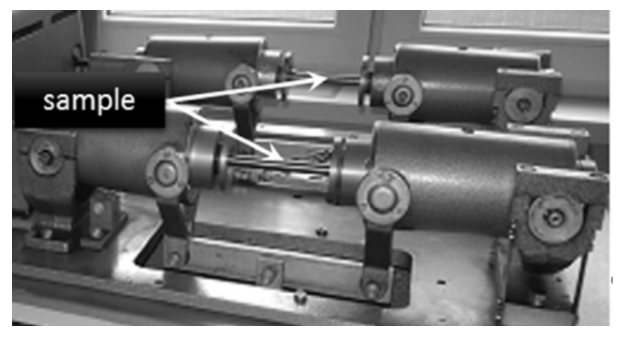
Figure 1 shows the diagram and appearance of the tested samples with dimensions. Joints of that type are used in rail transport vehicles. Those joints are used for joining the wheel or brake disc with the axle. The joint analysed in this article operates in conditions similar to those of wheel/axle joint operation. In view of the large dimensions of the real object, tests would cause many difficulties of a technical and economic nature. That is why fatigue tests were conducted on a model under conditions similar to real item operation conditions. Appropriate proportions with respect to joint dimensions were maintained, and static loads were selected that were proportional to the actual ones.
Three sample groups were subjected to fatigue tests. Tribological kinematic pairs consisting of a sleeve and shaft without additional strengthening treatment, a shaft with the surface layer hardened by finish rolling, as well as shafts with a TiSiN coating, were tested. Thirty tests, ten for each group, were conducted in total. The above engineering processes were chosen for wear and failure analysis as there is no information in reference literature about the impact of those processes on object operation time. The shaft rolling process is used in railway engineering to increase the hardness of the top layer of certain wheel set axles. However, TiSiN coatings have not been used so far as a method to improve the functionality of the wheel/axle joint in rail vehicles. Meanwhile, reports based on reference literature indicate the increasingly wide use of PVD coatings to mitigate the development of the wear of elements operating in various fields and branches of technology.
The surface roughness parameters of the top layer of the elements to be joined together, and the values of forces needed for pressing the sleeve onto the shaft, are shown in
Table 2.
Shafts and sleeves were made of structural steel, which is commonly used for the manufacture of many items, including those of considerable importance in light of user safety. Shafts without additional treatment were made by turning, which is why their surface is distinguished by high roughness parameters.
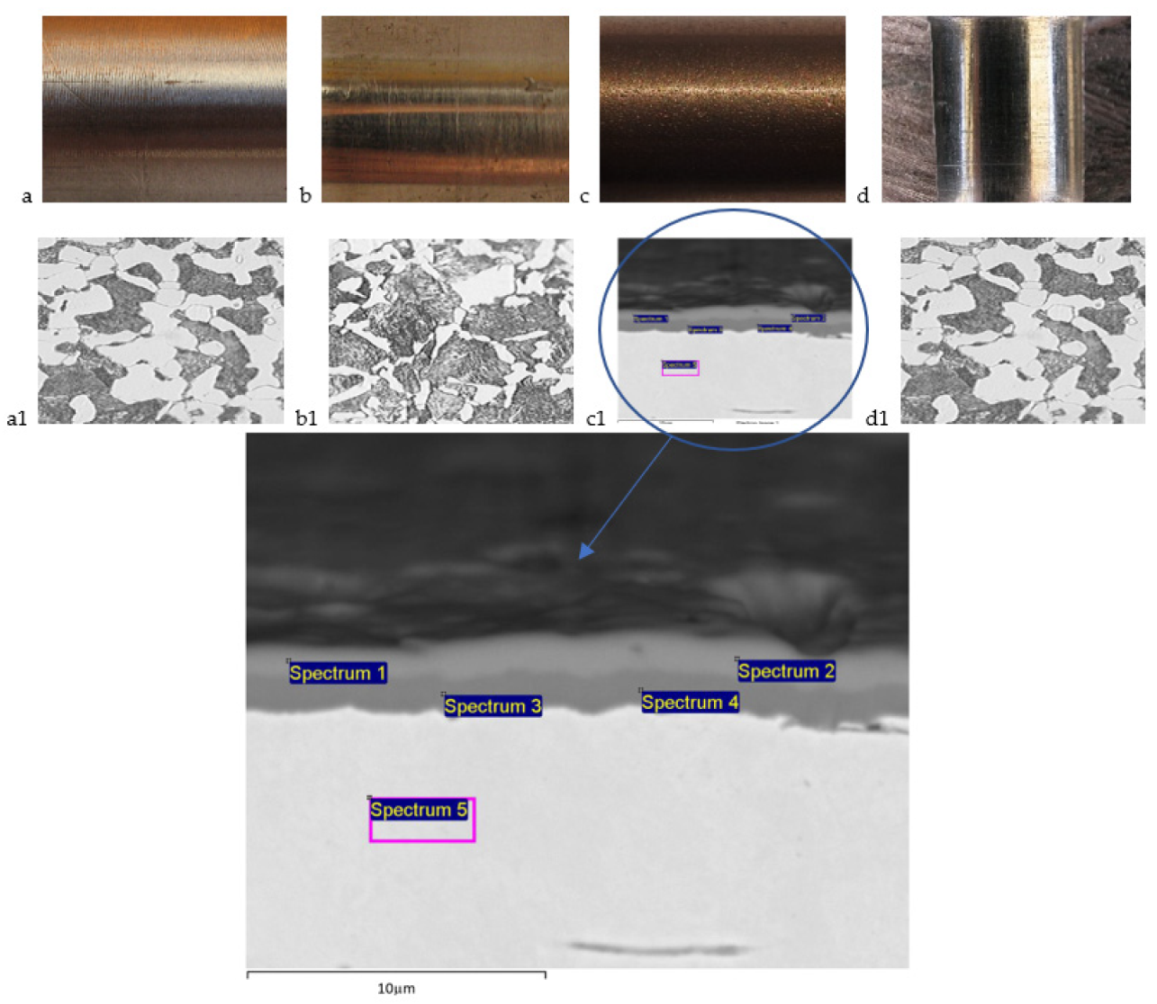
Figure 2a,d present a view of the surface and top layer of shafts without additional treatment and of the sleeves. The sleeve inner surface was, however, treated by grinding, which caused a reduction in the sleeve roughness parameters.
3.1. Shaft Top Layer Finish Technology
The finish rolling process was conducted with the use of an instrument especially designed for the purpose, following the installation of the instrument and shafts in a lathe. The rollers of the instrument were made of a material harder than the treated material, which ensured that the process would be accurate, and the instrument would be non-degradable. As a result of the specified interaction of the tool and treated surface, the local plastic deformation of the shaft top layer was obtained, which caused a change of the shaft strength characteristics. Owing to finish rolling, the treated item is distinguished by increased resistance to friction wear, fatigue wear and corrosion. The finish rolling process led to surface smoothing and to the reduction of surface roughness parameters to the values very close to those pertaining to the surface of ground shafts.
The finish rolling process is one of the simpler and cheaper processes, which is an implication of its advantages. The process is distinguished, for example, by the minimum labour consumption of the finishing operations, by the possibility of combining the finish rolling process with preliminary machining into one operation and by the high hardness of burnishing tools. The view of the surface and top layer of rolled shafts is shown in
Figure 2b.
The TiSiN coating was applied to the shaft by means of physical vapour deposition in vacuum ovens. The process took place at 410 °C. The coating has a low coefficient of friction, which is 0.4 µm. At the shaft surface, numerous voids of various shapes and sizes are noted, which are a natural outcome of the process. The coating has appropriate tenacity, owing to which the coating adheres to the shaft surface firmly, which minimizes the risk of tearing off during fatigue tests. The coating applied has one layer; however, there is aluminium between the shaft and coating, which improves adhesion. The thickness of the coating is 3 µm, and it is coppery. The view of the surface and top layer of shafts with the TiSiN coating is shown in
Figure 2c.
Table 3 shows the chemical composition of the TiSiN coating whose cross section and survey points are shown in
Figure 2c. The analysis was conducted by means of an electron scanning microscope equipped with an EDS analyser.
The average microhardness values (in the case of coated shafts) of the shaft surfaces under analysis are presented in
Figure 3. The tests were performed by means of the Vickers method. The finish rolling technology caused the increase of the shaft surface hardness by approximately 20% in relation to the shafts without additional treatment. The TiSiN is distinguished by very high hardness which should, on the one hand, improve the shaft life but, on the other hand, too large a difference between shaft and sleeve surface hardness may lead to sleeve damage and, consequently, to the destruction of the entire joint.
3.2. Tribological Kinematic Pair Operating Conditions
Fatigue tests were conducted on a laboratory bench equipped with a fatigue testing machine (
Figure 4), which permits a periodically variable load to be obtained with pure bending of a rotating sample. The fatigue testing machine is designed in such a way as to enable the simulation of the operation conditions of the majority of real objects, including the load on rail vehicle wheel sets. The sample rotational speed was 1360 rev./min. A constant load of 400 N on samples was taken. Each of the samples performed 10
7 cycles, above this number of cycles, the samples are subject to fatigue wear. The maximum noted number of cycles was 8 × 10
7. When that value is exceeded, all of the tested samples will become fatigue-cracked.
During fatigue tests, each sample was monitored in search of possible phenomena which could confirm sample damage. Moreover, fatigue tests would be stopped at random intervals and samples examined for cracks or other damage.
It may therefore be stated that the test programme assumed the reflection of at least the operation of the rail vehicle wheel sets mentioned before. A continuous measurement of assembly stresses was conducted. Fatigue tests would be stopped at random intervals to assess joint quality, which is also the case during the operation of rail vehicles scheduled for periodic inspections.
The results of the observations were recorded in the database on the basis of which the schedule presented in
Table 2 was made. In turn, the schedule was used as input data for the analysis of reliability indicators of the forced-in joint.
Table 4 shows the operation time of the various samples until such time as the phenomena which could prove joint damage were noted.
Following the analysis of the table, it may be noted that the shafts with the TiSiN coating are distinguished by the longest operation period, which is approximately 7.5 × 10⁷ cycles. The common feature of all the tested samples is that more frequent damage is noted when 107 cycles are exceeded. Over a short time, that damage leads to the sudden occurrence of fatigue microcracks and, consequently, to shaft cracking.
Following the completion of fatigue investigations, laboratory tests were conducted that permitted the assessment of the actual condition of the shaft and sleeve surface and top layer prior to and after assembly, and the determination of the influence of the proposed engineering processes on damage development and intensity. The macroscopic and microscopic observations and chemical composition analysis, as well as the macroscopic and microscopic observations of the fractures were conducted.
4. Laboratory Test Results
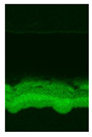
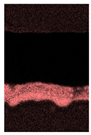
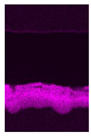
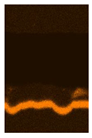
Macroscopic observations were first performed. The results of those observations were recorded with a NIKON P900 camera (NIKON, Tokyo, Japan) with the maximum 83× magnification. Sample images are presented in
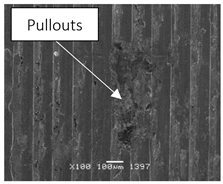
Table 5, line 1. Next, the microscopic observations of the shaft surface at the place of wear were conducted with the use of the JEOL JSM-6460LV (Cracow Technical Institute, Cracow, Poland) electron scanning microscope. Sample images are presented in
Table 5, line 2. The observations were performed in the backscattered electron composition (BEC), backscattered electron shadow (BES) and secondary electron image (SEI) modes with the electron beam acceleration voltage equal to 15 kV and 20 kV. Microscopic observations were also conducted in the zone comprising the shaft and sleeve joint contact surface. The observations were performed with the use of the same scanning microscope as in the case of the shaft surface observations, and sample results are presented in
Table 5, line 3.
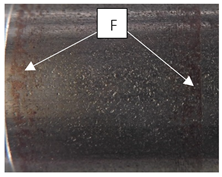
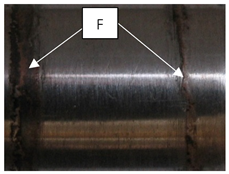
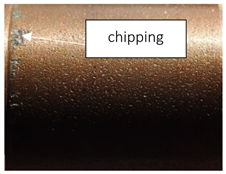
All the surfaces viewed macroscopically have marks in the form of scratches resulting from the forcing process. The size of those marks depends on the surface type and treatment. Coated shafts are distinguished by the smallest number of joint assembly marks, and the biggest number of marks of the biggest depth were noted on shafts without additional treatment. Local chipping of the material, particularly conspicuous on the left sample edge, is also noted on the surface of coated shafts. It is from that side that sleeve forcing onto the shaft was started; therefore, adhesive bonds disappearing later during assembly may be the most probable cause of such a state.
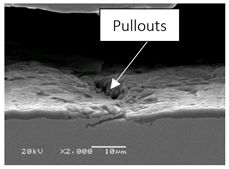
In addition to assembly scratches, numerous pull-outs of the surface fragments or deep grooves are noted. They are the outcome of adhesive wear. Despite the increase of surface hardness obtained as a result of finish rolling, local adhesive bonds came into being. When comparing the surface hardness of the rolled shaft and sleeve hub, an insignificant difference of only 50 HV may be noted. Such a difference does not ensure full protection against damage. The next factor to the disadvantage of the rolled shaft is the considerable surface “smoothing”, which is, as mentioned before, a side effect of finish rolling. It follows from the measurements that the Ra parameter of both mating surfaces is very similar, and hence there occurs a greater contact surface area and the affinity of the materials of both elements being joined together. It is precisely those factors which will be decisive for the rise of adhesive bonds to a large extent. The results of the measurement of the force needed to press the sleeve onto the shaft support that theory. That force is the biggest of all forces, and is in the range of 10–11 kN. Therefore, it may be stated that the adhesion attraction forces depend on the value of intermolecular forces and on the actual joint contact surface area, and the wear is only caused by adhesion attraction with the durable intersurface bonds.
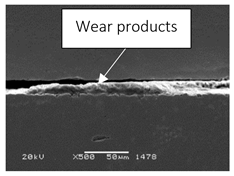
Wear in the form of a ring comprising the entire shaft circumference is noted at the surface of shafts without additional treatment and rolled shafts. The ring width depends on the side and surface finish method. Those traces occur on either side of the axle seat, 3–4 mm from the edge, and are grey-brownish, a colour typical of the atmospheric corrosion of metal. That fact confirms the presence of a gap between the surfaces joined together and the possible contact of the damaged surfaces with oxygen. Such wear traces were not noted in the case of coated shafts. The visible traces confirm the development of fretting, which occurs in the case of the rise of oscillatory tangential microdisplacements between the mating surfaces [
29,
30]. However, the wear mechanism has not been fully identified so far due to the diversity of factors which influence the development of that mechanism. This means that each test case should be treated individually. In the reference literature, there are many publications in which the relationship between wear development and the operation conditions of objects has been investigated [
31,
32,
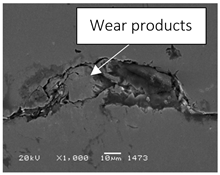
33]. In the case of forced-in joints operating in rotational bending conditions, wear traces occur precisely on the joint edges, a fact which stems from the specific nature of the load and from the generated bending moment. Shaft deflection under a load causes smaller contact between the mating surfaces in the central part of the joint, which limits the mutual tangential displacement necessary for the development of fretting wear. The situation with respect to joint edges is different. The contact is present there; moreover, the gap between the elements is not fully filled with wear products (they are removed from the joint contact surface during operation) [
34,
35].
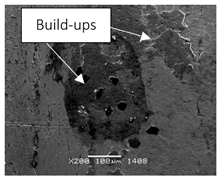
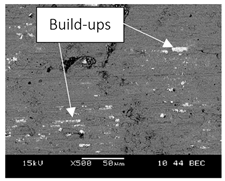
Shaft surfaces affected by fretting wear traces seen through a microscope demonstrated a similar nature of wear. Build-ups in the form of ground and oxidised particles of the material were present on all the surfaces. The analysis of the chemical composition of wear products on coated shafts demonstrated that the prevailing element was iron. This confirms that it is mainly the sleeve hub surface that is destroyed during operation. In view of high hardness and roughness of the shaft surface, the shaft wears out much less than the sleeve. Because of oxidation, the noted build-ups are harder than the native material and result from adhesive bond breaking. During operation in normal conditions, they act like microblades, causing the further destruction of the surfaces joined together. Wear products are not prone to tack together; on the contrary, they are fragmented and transferred to other places. Moreover, randomly spaced micropits and microcracks are visible on the surfaces.
The observations of the surface layer wear on the shaft and sleeve joint contact surface provided a diversified image depending on the type of shaft surface and the place of observation. The direct contact between the mating surfaces and the gaps of various widths, filled with wear products, are noted interchangeably. In the case of sleeve hub surfaces mating with rolled and coated shafts, visible are distinctive top layer deformations caused by the smaller hardness of the surface compared with the mating shaft. Their development started as early as at the joining process stage and was enhanced during wear tests. In addition to plastic deformations, microcracks occur locally that originate close to the contact surface of the elements joined together and develop deeper into the material at 30°. In the case of coated shafts, coating cavities and shaft cracks under the coating were also visible in places. Coating tearing off from the substrate was not noted, however.
The data permitting the determination of the number of cycles necessary for the intensive development of fatigue wear and, consequently, sample cracking, were saved for each tribological kinematic pair under investigation. The averaging numbers of cycles needed for joint cracking were respectively as follows: shafts without additional treatment—2 × 10
7; rolled shafts—3 × 10
7; shafts with a TiSiN coating—8 × 10
7. Shafts have one distinctive common part, that being the location of the focus of fatigue. Namely, shafts would crack at the place where their section area changes, the reason for that most probably being the concentration of stresses causing the technological notch.
Figure 5 shows the sample macrographic image of the cracked shaft and the microscopic image of the ad hoc fracture.
The cracking mechanism in all the tribological kinematic pairs is similar, and is typical of periodically variable loads. Two zones develop in fatigue fractures. The first zone is the ad hoc fracture and the other one is the fatigue zone. In the ad hoc fracture zone, samples demonstrate a coarse-graded fracture, with one or several focusses of fatigue at the surface, and the fracture is distinguished by the ductile fracture topography. The fracture fatigue zone is distinguished by the fissile fracture topography and orientated perpendicularly to the direction of the load applied. Most often, grain and phase boundaries or hard precipitates of the dispersed phase are the places of crack nucleation.
When summarising this chapter, it should be noted that the main kind of damage noted in all the shaft/sleeve joints which were tested, except shafts with a TiSiN coating, is fretting wear, which develops as the number of fatigue cycles increases. Wear comprises such damage as material buildups, microcracks and micropits. Less conspicuous damage on the surface of elements joined together includes scratches and other traces resulting from the pressing (joint assembly) process. Those are the kinds of damage which do not significantly affect the deterioration of joint functional properties. Special attention should be paid in further scientific research to fretting wear occurring in the joint. Investigations are conducted to recognize fretting wear mechanism and works [
36,
37] may be mentioned as examples; however, there is little research on the influence of various engineering processes on the development of fretting wear and its effective mitigation or full elimination. It seems that the use of PVD coatings is an effective way to do so, as confirmed by these test results; however, high coating hardness in relation to the surface hardness of the mating element may lead, as early as at the assembly stage, to surface damage, which will become more and more serious and lead to premature joint destruction. It is, therefore, suggested that other engineering methods should be sought, which will permit the similar hardness of the surface of the elements being joined together to be maintained, or that coatings ought to be used on both elements joined together. Attention should be paid, however, to the costs of the coating technology, and the economic viability analysis of the other proposal should be performed.
5. Results of Failure Analysis
The stored data concerning the number of cycles of shaft/sleeve tribological kinematic pair performance permitted the preparation of the failure analysis of the forced-in joints. As mentioned at the beginning of this work, failure indicators determined by means of the Weibull method were used for the analysis in question.
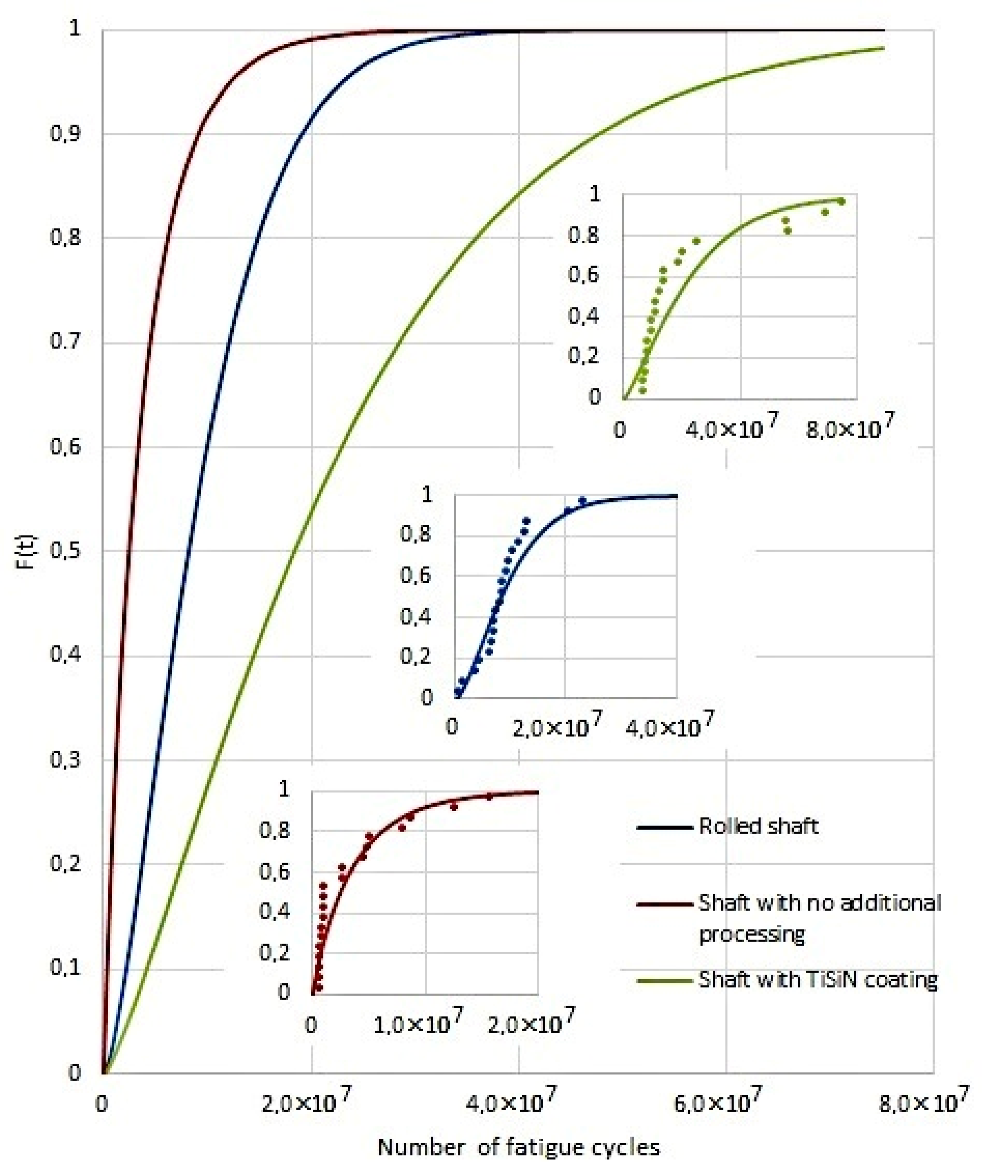
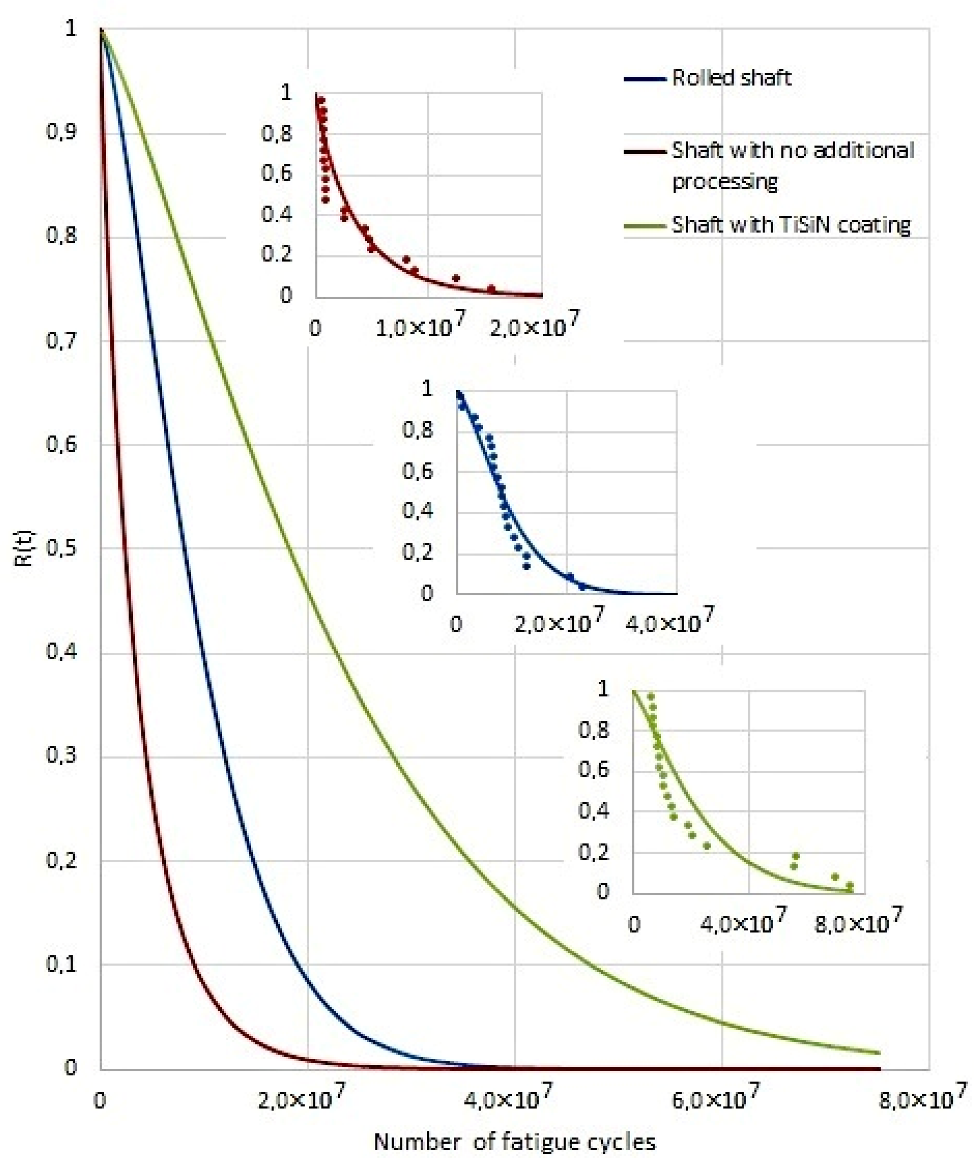
Figure 6 shows the cumulative distribution function and
Figure 7 shows the reliability function of trouble-free operation for all the studied variants (shaft without surface treatment, roller shaft, shaft with TiSiN coating).
Figure 6 and
Figure 7 also show the measured points according to table number 4. In terms of the quality of the regression model, it can be stated that the coefficient of determination is 75% for the shaft without surfacing 93% for the shaft rolled and 74% for the shaft with surfacing by TiSiN.
Table 6 shows the Weibull parameters for each evaluated case (parameter of size—α; and parameter of shape—β).
As can be seen from
Figure 6, the cumulative distribution function of shafts without additional treatment increases quickly. The 50% cumulative distribution function occurs as early as at 3 × 10
4 fatigue cycles. Rolled shafts need a slightly longer operation time. In this case, the 50% cumulative distribution function occurs at 8 × 10
4 cycles. Shafts with a TiSiN coating are the most resistant to damage. In their case, the 50% cumulative distribution function should be expected at 1 × 10
7 fatigue cycles. The cumulative distribution function of shafts without additional finish treatment will occur after 2 × 10
7 fatigue cycles, rolled shafts at 3 × 10
7 and coated shafts after 8 × 10
7 fatigue cycles. The cumulative distribution function and correct operation, as mentioned above, coincides with the actual tests on the fatigue test bench. Such a conclusion may be drawn from the comparison of the values presented in
Figure 6 and
Figure 7 with the data in
Table 7, where the most frequent kinds of damage in relation to the number of fatigue cycles have been compiled.
The cumulative distribution function and correct operation as mentioned above coincides with the actual tests on the fatigue test bench. Such a conclusion may be drawn from the comparison of the values presented in
Figure 6 and
Figure 7 with the data in
Table 6, where the most frequent kinds of damage in relation to the number of fatigue cycles have been compiled.
Figure 8 shows the reliability characteristics for the shaft without modification,
Figure 9 shows characteristics for the shaft after rolling, and
Figure 10 for the shaft with TiSiN coating. Looking at the number of fatigue cycles, it becomes clear that the cumulative distribution function grows fastest for the shaft without surface treatment. On the contrary, the cumulative distribution function increases the slowest for a shaft with a TiSiN coating. The number of fatigue cycles is about 2× higher for the shaft with surface treatment of rolling against the shaft without surface treatment. For the shaft with the TiSiN coating, the number of fatigue cycles against the shaft without treatment is fourfold.
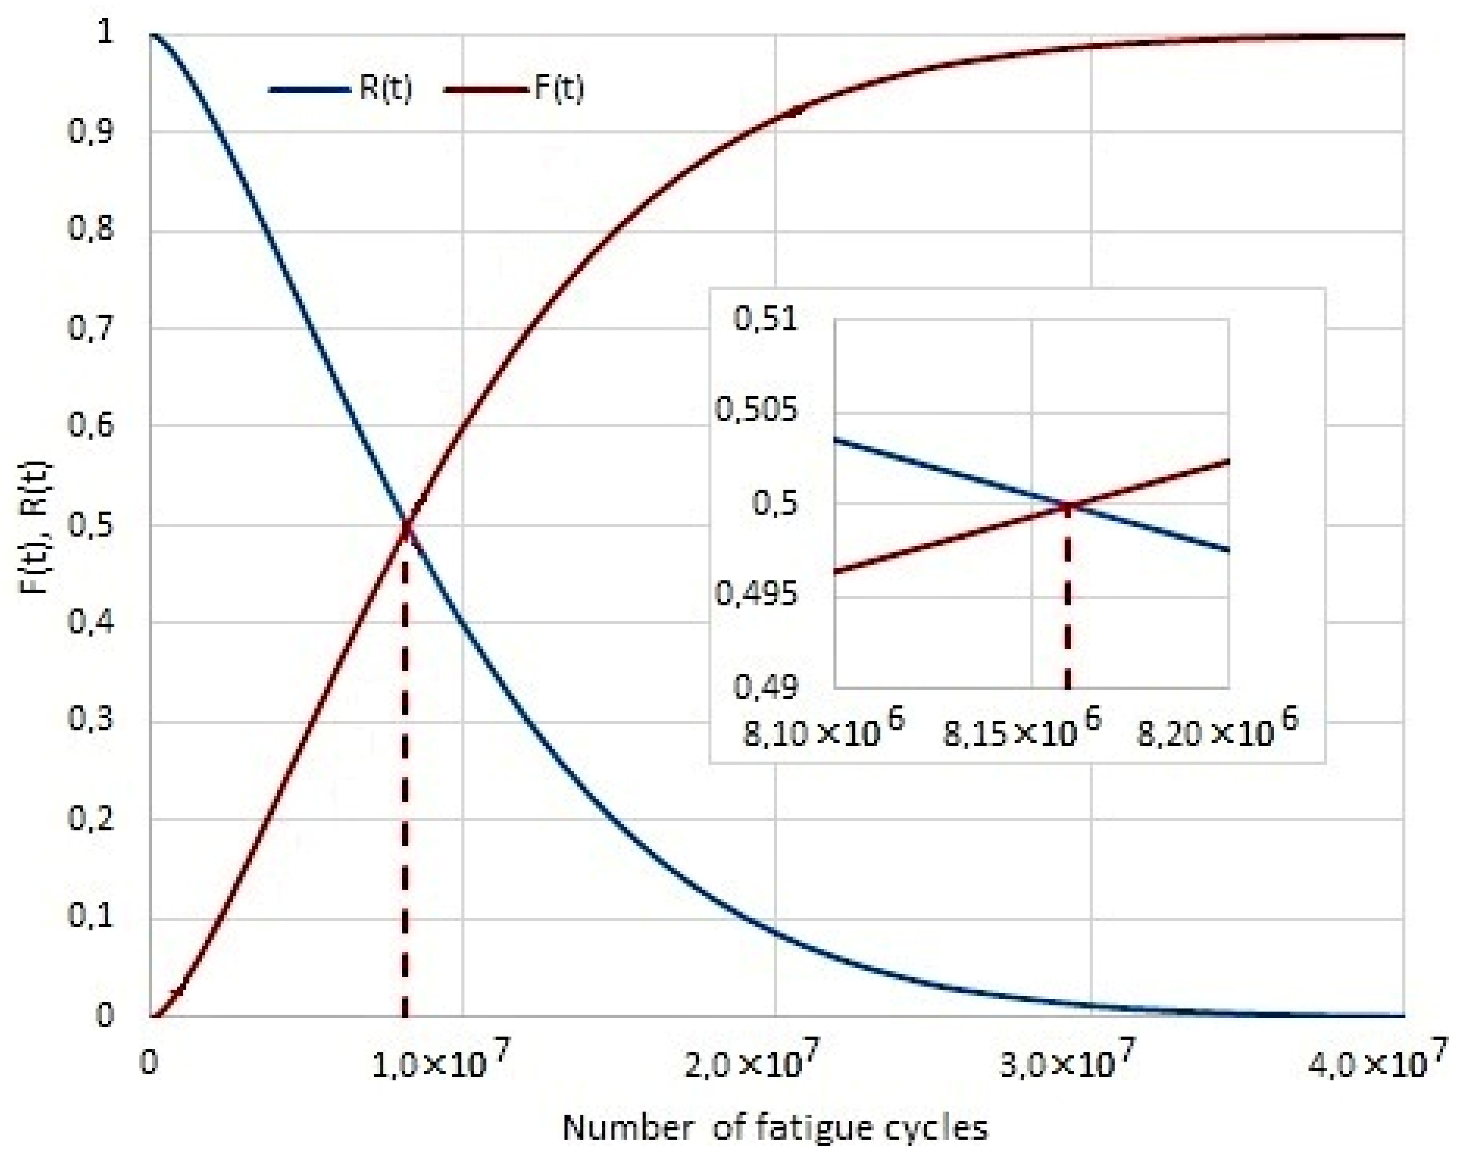
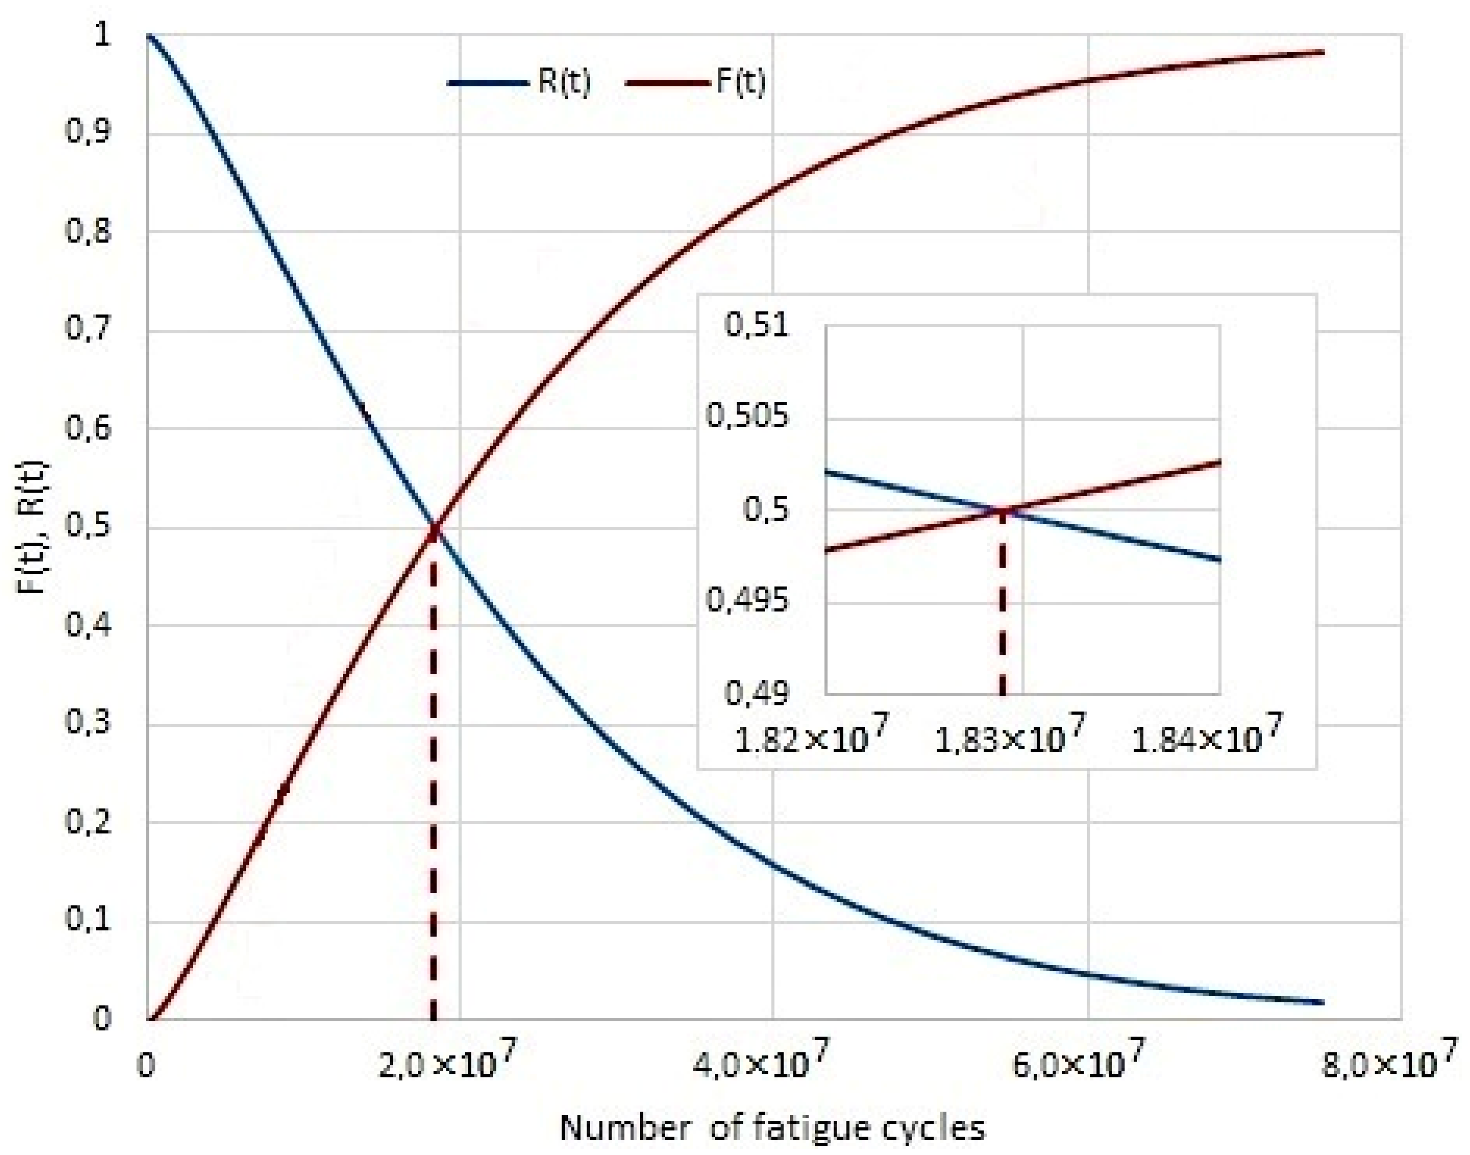
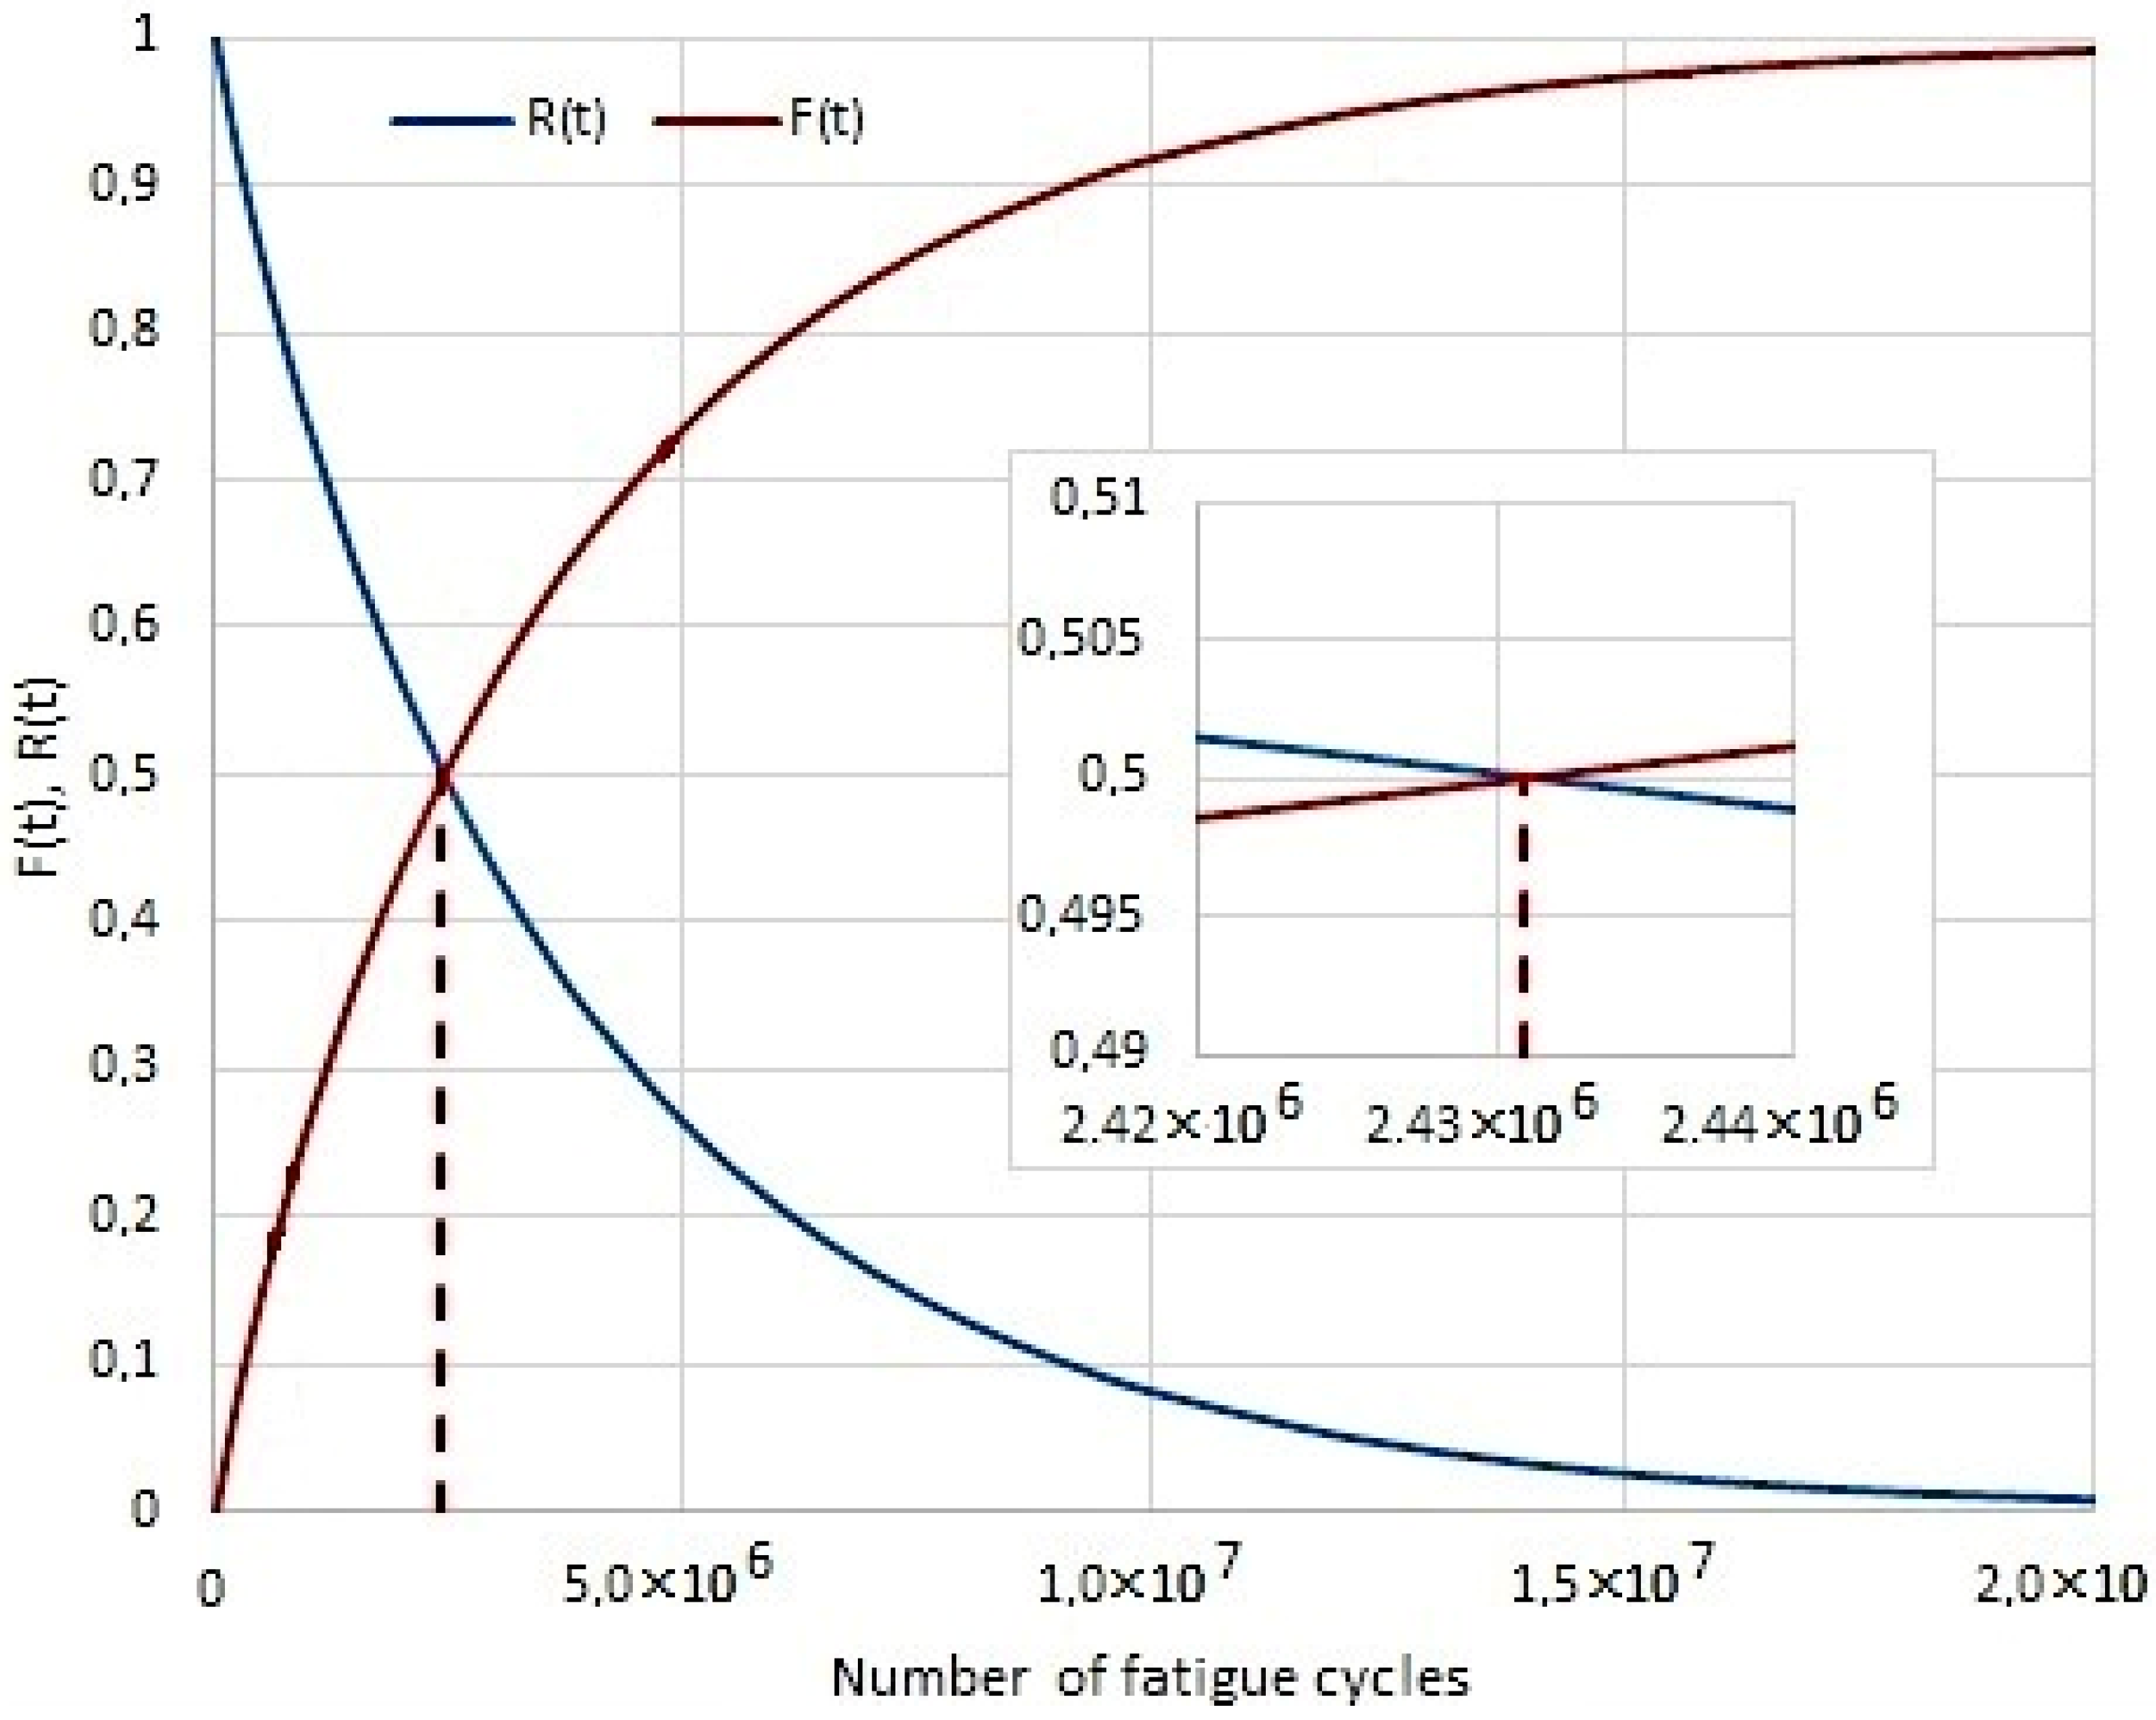
The graphic determination of the operation time median of the shaft/sleeve forced-in joint in rotational bending conditions is shown in
Figure 8,
Figure 9 and
Figure 10. The expected correct joint operation time is as follows: for shafts without additional top layer strengthening treatment—2.44 × 10
6, for rolled shafts—8.15 × 10
6, and for shafts with coating—18.29 × 10
6.
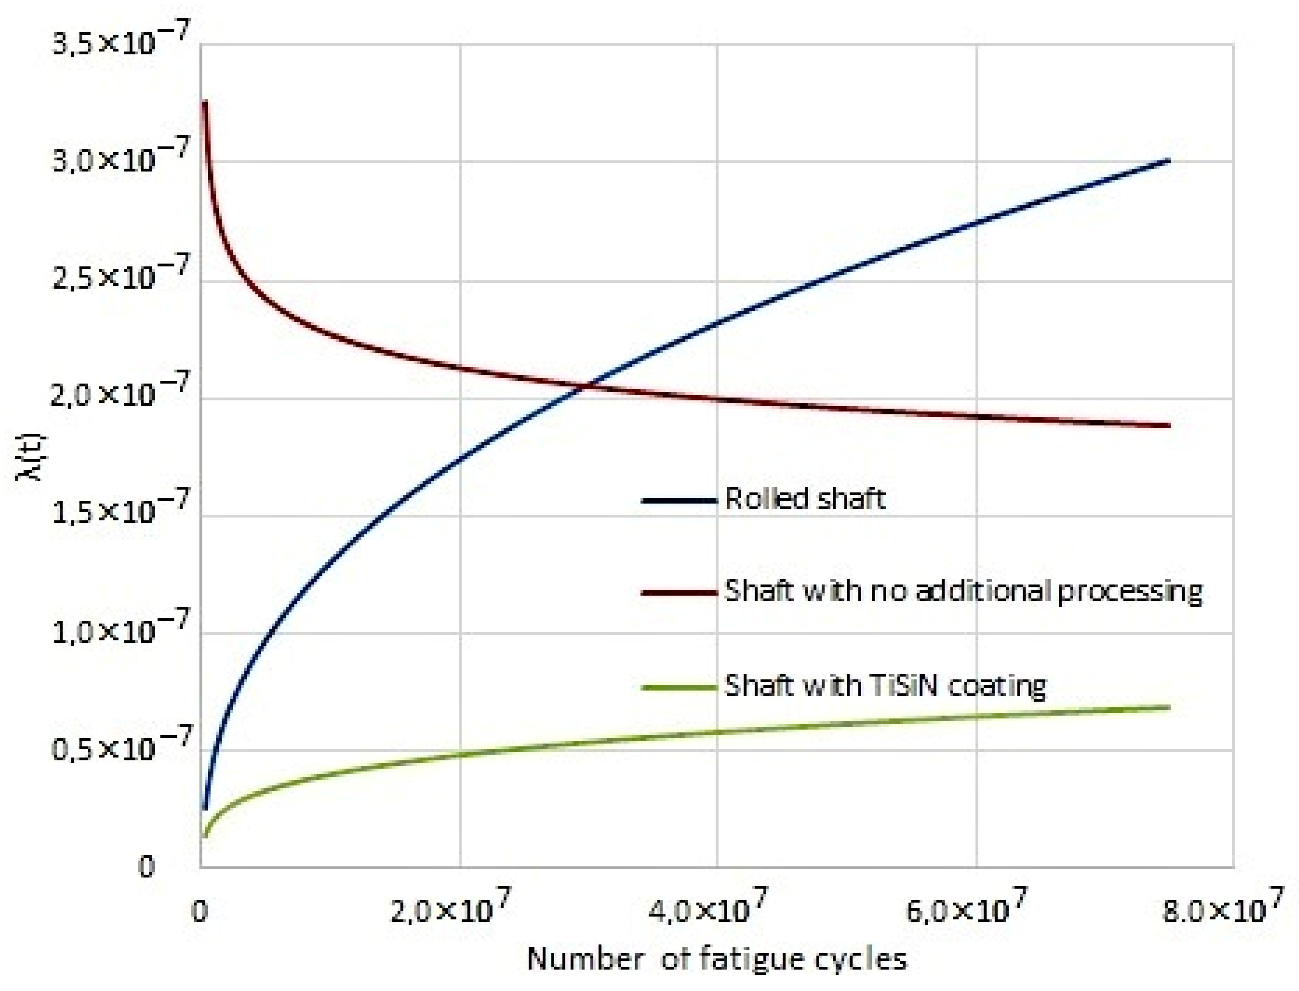
In
Figure 11, the failure rate is shown. In the case of shafts without surface treatment a significant run-in is noticeable, which means higher percentage of failures at the beginning of the load. For the shaft after rolling and the shaft with TiSiN coating there is lack of the initial high number of failures which grows towards a higher load. The failure rate trend results best on the shaft with TiSiN coating.
Based on
Figure 11, it may be concluded that, in the initial operation period, shafts without additional strengthening treatment are distinguished by the highest failure rate. The diagram also confirms the fretting wear development mechanism described by the authors of [
31]. They noted that, in initial fatigue cycles, wear initiates and then develops quickly to become stable at the end of the operation periods. The situation with rolled shafts and those with a TiSiN coating is different. Maximum wear intensity may be expected at the end of the operation period.
6. Conclusions
This article aimed to present a comparison of the operation damage occurring in forced-in joints for three alternative shaft top layer finishes, as well as the analysis of reliability indicators of those joints.
The macroscopic observations of shaft surfaces demonstrated the presence of assembly scratches and fretting wear, the latter manifesting as a ring comprising the entire shaft axle seat circumference. The ring size was dependent on the type of the surface being viewed. The widest ring is visible on rolled shafts, and the smallest on those with a TiSiN coating.
The microscopic observations of the shaft surfaces demonstrated the presence of build-ups in the form of ground and oxidised particles of the material. The observations of the shaft and sleeve contact surface present a diversified image, depending on the surface type and the contact surface location [
38,
39].
Based on the analysis of the database containing the number of fatigue cycles needed for shaft cracking, it may be concluded that shafts without additional treatment are the least durable, and those with a TiSiN coating have the highest fatigue strength.
Consistent maintenance of the machinery is reflected very significantly in the reliability of the equipment. However, the inherent reliability of the device, which is determined by the manufacturer of the device, the technology of production, and the materials used, is also very important. The fault-free indicators, which are determined on the basis of the Weibull distribution, are used to describe the reliability of machinery. The Weibull distribution was also used in the analysis of the measured data, with the following conclusions:
The cumulative distribution function F (t) increased fastest for the shaft without surface treatment and the slowest for the shaft with the TiSiN surface treatment. The number of fatigue cycles with a modified shaft increased for the rolled shaft by 2× and for the shaft with TiSiN coating by 4× compared to the shaft that was not surface-treated (
Figure 8,
Figure 9 and
Figure 10).
In terms of defect intensity, the shaft without a coating exhibited the greatest failure rate in the initial phase of fatigue cycles. For the shafts with rolling coating and TiSiN, the intensity increased gradually from the beginning. The failure rate trend results were the best for the shaft with TiSiN coating (
Figure 11).
Based on this article, it may be concluded that it is reasonable to determine reliability indicators according to the Weibull method for the estimation of the life of the shaft/sleeve forced-in joint operating under rotational bending conditions. The mathematical analysis is in agreement with or is similar to the results obtained in laboratory conditions.


