1. Introduction
Head and neck cancers are the fifth most common cancer type worldwide. They can be categorized by the area where they originate from, e.g., lips, oral cavity (mouth), nasal cavity (inside the nose), paranasal sinuses, pharynx, or larynx. Most of these epithelial tumors are genomic alterations of head and neck squamous cell carcinoma (HNSCC) [
1]. The possible causes include tobacco and alcohol consumption [
2]. Although different therapies exist [
3], including surgery, radiotherapy, and chemotherapy, side effects are inevitable.
The recent elucidation of the genomic landscape of HNSCC has brought hope for the realization of alternative cancer treatment options. The recent identification of novel functional molecular targets enabled pre-clinical evaluation with emerging therapeutic agents in tumors [
3,
4]. The genetic information obtained by biomarker analysis in tumors and individuals is vital for targeting agents molecularly [
5]. The role that the inactivation of the tumor suppressor/suppressant gene
p16 plays in the carcinogenesis of head and neck cancer has prognostic relevance [
6,
7].
Plasma is an ionized form of gas composed of charged particles, electronically excited atoms and molecules, radicals, and UV photons [
8,
9,
10,
11,
12,
13]. The non-thermal micro-plasma can be used in the anti-cancer field [
14,
15]. According to previous studies, the effects of plasma on biological systems are due to reactive oxygen and nitrogen species (ROS/RNS). Since ROS and RNS have an impact on the redox balance of cells, they influence medically relevant cellular processes [
16].
Several studies indicated that plasma exposure increases intracellular ROS/RNS levels, leading to DNA damage and apoptosis in tumor cells [
7,
17]. Vandamme et al. reported a dose-dependent apoptosis of malignant glioma (U87MG) and colorectal carcinoma (HCT-116) cells after subjecting them to plasma exposure. They attributed the apoptosis to ROS/RNS [
16]. Ahn et al. also suggested that the increase in ROS/RNS levels is the reason for induced cell death and for reversing chemo-resistance in cancer cells [
18]. ROS/RNS-mediated mechanisms thus offer an effective and selective cancer treatment [
19].
The application of non-thermal micro-plasma has become a major focus of biomedical research, e.g., blood coagulation, promotion of wound healing, and sterilization of devices. The evidence to date suggests that non-thermal plasma exposure effectively kills many types of cancer cells via oxidative damage, leading to cytotoxicity, but has a lesser impact on normal tissues both in vitro and in vivo [
16]. A recent study also reported that conventional chemoradiotherapy combined with non-thermal plasma exposure could represent helpful treatments for cancer [
20]. Hence, non-thermal micro-plasma exposure is anticipated as a potential and additional option for the treatment of cancer. In this study, the efficacy and mechanism of applying non-thermal micro-plasma against head and neck cancer in vitro is therefore explored.
2. Materials and Methods
2.1. Cell Culture
Human head and neck cancer cells, SAS, CAL27, FaDu, and Detroit 562, were purchased from ATCC (American Type Culture Collection, Manassas, VA, USA). SAS cells were maintained in Dulbecco’s modified Eagle’s medium (DMEM, Thermo Fisher Scientific Inc., Waltham, MA, USA) and Ham’s F12 medium. CAL27 cells were maintained in DMEM. FaDu and Detroit 562 cells were maintained in Eagle’s minimum essential medium (EMEM) (Thermo Fisher Scientific Inc., Waltham, MA, USA). All cells were supplemented with 10% fetal bovine serum (FBS) (Thermo Fisher Scientific Inc., Waltham, MA, USA) and 1% penicillin-streptomycin and grown at 37 °C with 5% CO
2 under humidified conditions (
Table 1).
2.2. Non-Thermal Micro-Plasma Device
A custom-made micro-plasma jet source (US Patent No.: 9318305) was driven by radio-frequency power supply at 13.56 MHz with a device (RF, ENI ACG-3B, MKS Instruments, Inc., Rochester, MA, USA). One capillary electrode was the jet source to inject additive N2. A stainless-steel capillary tube at the center of the quartz tube was used as the inner electrode and the N2 feeding tube. A copper chip connected to a generator was used as the outer electrode. According to the International Commission on Non-Ionizing Radiation Protection (ICNIRP) guidelines, the unprotected skin’s ultraviolet radiation (UVR) exposure should generally not exceed 30 J/m2 in the spectral region of 180 to 400 nm. The applied non-thermal micro-plasma system contains a quartz capillary tube that is used as a gas channel, with outer and inner diameters of ≈7.0 and ≈5.0 mm, respectively. A hollow stainless-steel tube with a diameter of ≈0.8 mm is used as the inner electrode, which is connected to the ground and used as a gas flow channel. A piece of copper is used as the outer electrode, which is connected to the output of the generator. In addition, major species in the non-thermal N2/He micro-plasma were trace amounts of NO (236 nm) and OH (306 nm), He (706 nm), and O (777 nm). The micro-plasma device was compliant with IEC 60601-1, the guidelines for electromagnetic safety standards.
The bio-safety feature of this study preceded/superseded the DIN SPEC 91,315 regulations. A working distance of 4 mm was maintained and an excitation power of 12-14 W with He was used as the first gas for excitation with the addition of 1.0% and 1.5% N2 gas yielded an average plasma temperature below 37 °C. Through plasma measurement, the content of plasma could be characterized. The diagnoses showed that under 13 W of excitation power and with the addition of 1.0% N2, the NO and OH species contents were relatively high. UV intensity and gas emissions were estimated within the safety requirement of DIN standards.
For in vitro experiments involving non-thermal micro-plasma application to cells, cells were seeded on the culture plates and exposed to the plasma. After plasma exposure, the medium was changed with a new fresh one, and incubated for a further 24 h. At the end of the additional incubation, the biological assays of the cells were performed according to the manufacturer’s instructions.
2.3. Intracellular ROS Detection
The OxiSelect™ Intracellular ROS Assay Kit (producer, city, state, country Thermo Fisher Scientific Inc., Waltham, MA, USA) was used as a cell-based assay for evaluating antioxidant or ROS activity. Cells were cultured on a 24-well cell culture plate for 24 h, and then pre-incubated with 2’-7’dichlorofluorescin diacetate DCFH-DA. After 48 h of incubation, the cells were measured by a standard fluorescence plate reader. Afterward, cells were treated with different time dose-micro-plasma exposure. After treatment, intracellular ROS was measured using a ROS detection kit. Cells were washed with PBS twice and incubated with DCFH-DA in a culture medium for 45 min at 37 °C in the dark. Subsequently, cells were washed three times with PBS. A fluorometric plate reader (Thermo Fisher Scientific Inc., Waltham, MA, USA) determined fluorescence results at 480/530 nm. The fluorescence intensity was proportional to the total levels of ROS within the samples. Note that the intracellular ROS assay was performed on cultured cells. Cell-permeable DCFH-DiOxy was added to SAS, CAL 27, FaDu, and Detroit 562 cells, and was hydrolyzed by cellular esterase to become DCFH. Once oxidized by ROS, DCFH becomes fluorescent DCF. This assay only works on live cells or tissues because it requires esterase activity to remove the DA group.
2.4. Intracellular NO Detection
The OxiSelect Intracellular Nitric Oxide (NO) Assay Kit (Cell Biolabs, Inc., San Diego, CA, USA) was used according to the instructions. Cells were cultured on a 24-well for 24 h. The following day, cells were treated with different time doses of micro-plasma exposure for 48 h. Next, intracellular NO was measured by using the NO detection kit according to the manufacturer’s protocols. Note that the assay kit is used for the rapid detection of intracellular NO or NOS activity in cultured cells. The cell-permeant NO probe diffuses into cells, and is deacetylated by cellular esterase to a non-fluorescent intermediate. When intracellular nitric oxide meets this intermediate, this intermediate rapidly oxidizes to a highly fluorescent substance, whose fluorescence intensity is proportional to the NO level.
2.5. MTS Assay
Cell viability with and without plasma exposure was measured via MTS assay (CellTiter 96 AQueous One Solution proliferation, Promega, Madison, WI, USA) which is a colorimetric method for determining the number of viable cells in proliferation. In brief, cells were treated with the micro-plasma jet at 0–90 s. After the treatment, the medium was replaced with new fresh media, and further incubated for 24 h.
2.6. Cell Death Assay
The 4 × 10⁵ cells were seeded in culture dishes. After 24 h, the cells were treated with micro-plasma exposure as indicated. After incubation for an additional 24 h, the cells were harvested in the centrifuge tube. Next, cells were fixed by 70% ethanol/PBS for 48 h. The fixed cells were harvested and incubated in 100 μg/mL RNaseA/PBS at 37 °C for 1 h, and cellular DNA was stained using propidium iodide (PI) solution. Then, the cells were analyzed using a CYTOMICS FC500 flow cytometry system (Beckman Coulter, Inc., Brea, CA, USA).
2.7. TUNEL Assay
In brief, cells were cultured with 4% paraformaldehyde (PFA), permeabilized with 0.5% Triton X-100 (MP Biomedicals, Solon, OH, USA) and blocked with 5% BSA. Subsequently, cells were stained with TUNEL reagent (producer, city, state, country Sigma-Aldrich, Burlington, MA, USA) for 60 min in the dark, followed by observation under a florescent microscope.
2.8. Statistical Analysis
In this study, all experimental data were assumed to be normally distributed. All measurements were expressed as mean ± standard deviation (SD). SD quantifies the amount of variation or dispersion of a set of data around the mean value. Low standard deviation means that the data are settled close to the mean. Student’s t-test was used to establish significance between parts of data. The values of p < 0.05 (*) and p < 0.01 (**) were considered statistically significant. The null hypothesis (HO) was assumed to be the normal distribution of experimental samples. For each kind of measurement, the sampling number was set at n = 6.
3. Results and Discussion
3.1. ROS in Plasma-Exposed Cell-Containing Medium
The ROS concentrations were obtained by measuring the average luminescence in the medium containing (
Figure 1a) SAS, (
Figure 1b) CAL 27, (
Figure 1c) FaDu, and (
Figure 1d) Detroit 562 cells after plasma exposures of 0 (non-treated, NT), 30, 60, and 90 s followed by a cultivation period of 48 h (
Figure 1). Significance was measured as compared with gas flow for similar durations. Significant increases in the average luminescence were found for the exposure times of 30, 60, and 90 s, except for the case of CAL 27 with an exposure time of 30 s (
Figure 1b). ROS concentration in medium increased with plasma exposure time. Alternative cases occurred for CAL 27 and Detroit 562 between 30 and 60 s (
Figure 1b,d). In most cases, ROS concentration increased with exposure to non-oxygen plasma species. Increasing plasma exposure time from 60 to 90 s significantly increased ROS concentration in the medium for all cells [
21]. Gas flow was used to determine whether non-excited N
2/He gas affected the cell response compared with the excited N
2/He gas through micro-plasma exposure.
3.2. RNS in Plasma-Exposed Cell-Containing Medium
The RNS concentrations in the medium with (
Figure 2a) SAS, (
Figure 2b) CAL 27, (
Figure 2c) FaDu, and (
Figure 2d) Detroit 562 cells after plasma exposures of 0, 30, 60, and 90 s followed by a cultivation period of 48 h were measured by chemical reactions involved in the RNS assay, as shown in
Figure 2. As compared with gas flow for similar durations, significant increases in RNS concentrations in the medium were found for the exposure times of 30, 60, and 90 s. RNS concentrations in the medium largely increased with plasma exposure time [
22].
3.3. MTS Assay
The cell viability test with and without plasma exposure was conducted via the MTS assay at a wavelength of 492 nm. The cell viabilities of (
Figure 3a) SAS, (
Figure 3b) CAL 27, (
Figure 3c) FaDu, and (
Figure 3d) Detroit 562 were measured after plasma exposure time of 0, 30, 60, and 90 s followed by a cultivation period of 48 h, as shown in
Figure 3. Significant decreases, as compared with the gas flow for similar durations, were found for the exposure time of 30, 60, and 90 s. Cell viability in the medium significantly decreased with plasma exposure time, as marked in
Figure 3a–c for SAS, CAL 27, and FaDu, respectively. A less significant decrease occurred with Detroit 562 between 30 and 60 s (
Figure 3d). These results correlate with the previous ones regarding ROS/RNS concentrations in the plasma-exposed medium.
Previous studies [
13] indicated that an abnormal migration of cells is initiated after a plasma exposure time longer than 120 s in a medium containing cultured fibroblast cells. This justifies the choice of the plasma exposure time as 90 s to achieve both bio-safety and efficacy.
3.4. Intracellular ROS and RNS
Intracellular ROS and RNS levels of (
Figure 4a) SAS, (
Figure 4b) CAL 27, (
Figure 4c) FaDu, and (
Figure 4d) Detroit 562 were measured after N
2/He plasma exposure of 90 s followed by a cultivation period of 48 h, as presented in
Figure 4. Comparisons were made between the treatment, the non-treatment, and the gas flow groups under similar durations.
Figure 4b,c show the results for CAL 27 and FaDu (compared with the gas flow). Significant ROS increases of 10% for both resulted from the plasma exposure.
Figure 4a–c display the results from SAS, CAL 27, and FaDu (compared with gas flow). Highly significant RNS increases of 470, 70, and 330% resulted from plasma exposure. However, no significant difference in ROS was found for SAS and Detroit 562 and in RNS for the case of Detroit 562 after plasma exposure. The results demonstrate the increase in intracellular ROS level after N
2/He plasma exposure of 90 s for both CAL 27 and FaDu, but no changes were observed for SAS and Detroit 562.
3.5. Cell Apoptosis
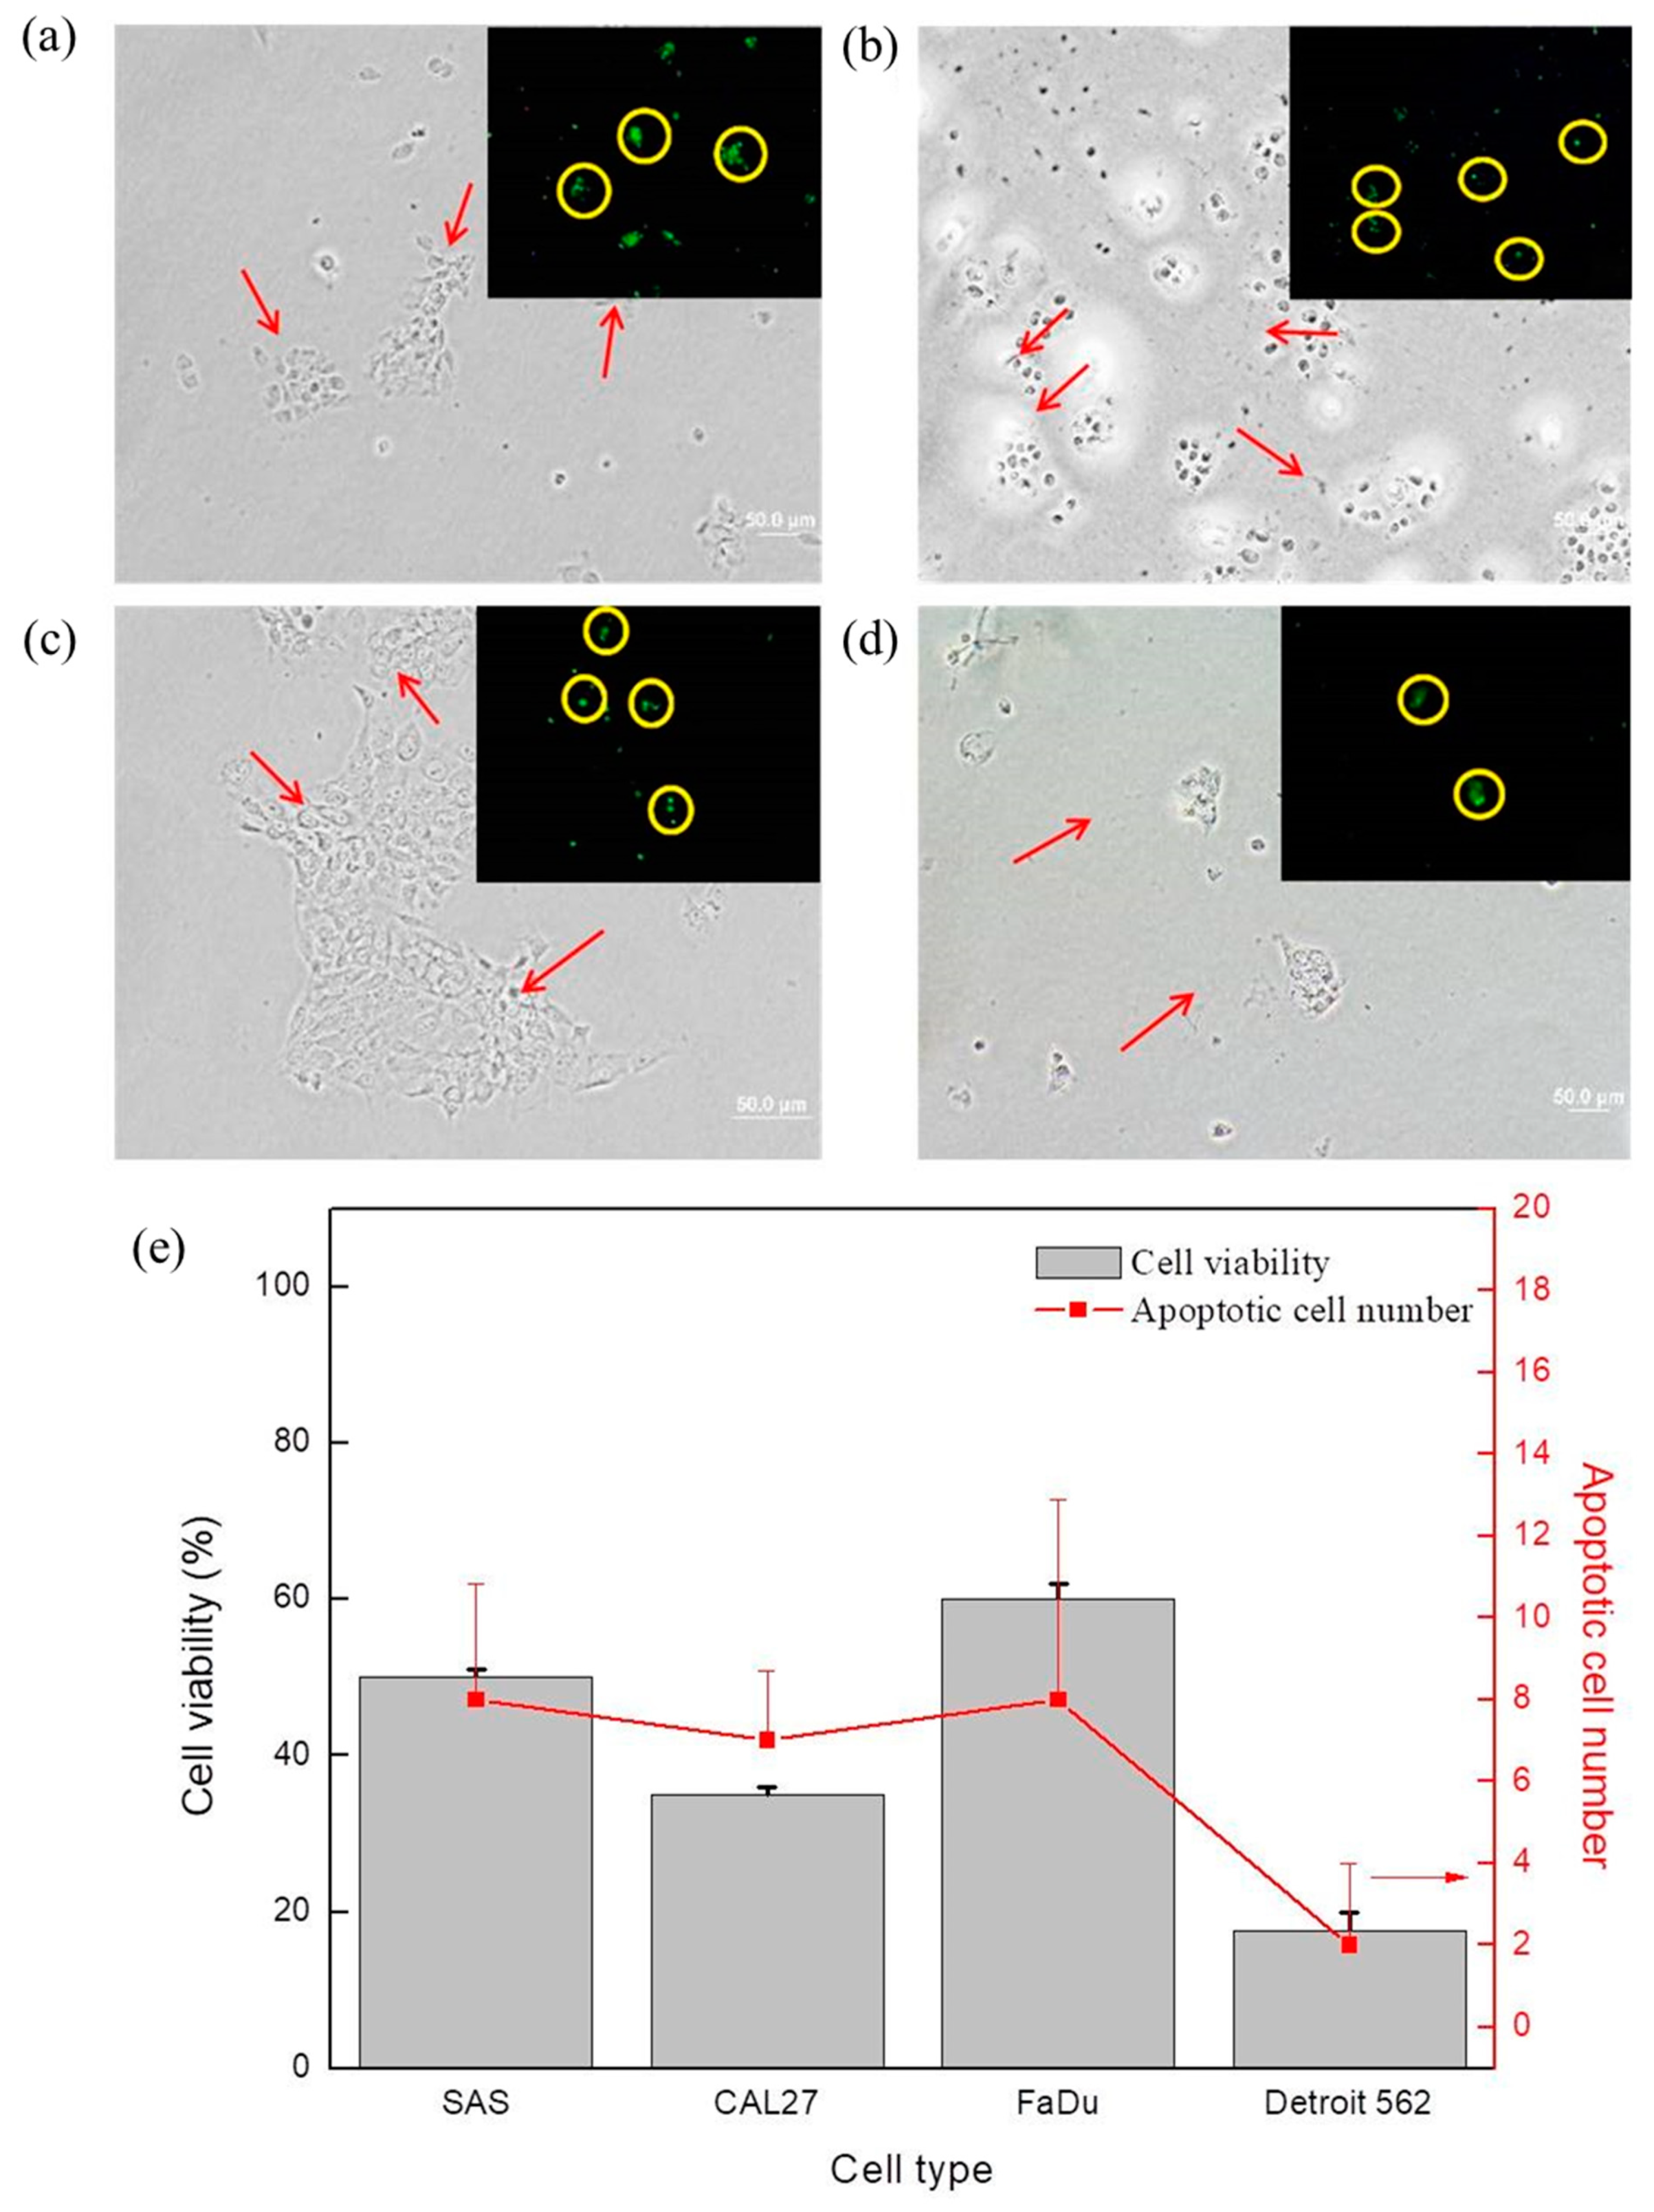
The bright field images and the corresponding confocal microscope images in
Figure 5 display the MTS assay results and the apoptotic cell number counts for (
Figure 5a) SAS, (
Figure 5b) CAL 27, (
Figure 5c) FaDu, and (
Figure 5d) Detroit 562 after N
2/He plasma exposure of 90 s, followed by a cultivation period of 48 h. The cancer cells after plasma exposure are indicated by arrows in the bright field images of
Figure 5. It is believed that the cell apoptotic process resulted from the significant increase in ROS/RNS after plasma exposure and intracellular changes.
There are various morphological changes during apoptosis, which is a cellular response to toxic agents that induce DNA damage [
23]. Recent studies showed that cancer cells with a deregulated cell cycle can respond to DNA damage through initiating suicide programs [
24]. With cell shrinkage, the cytoplasm becomes denser and the organelles become more tightly packed. The apoptotic cell has a round shape and dense purple nuclear chromatin fragments [
25].
In this flow cytometry study, after plasma exposure for 5 min (i.e., a long treatment time for cancer cells), the apoptotic percentage increased by 7.8-fold compared to the non-treatment group. An identical percentage of healthy cells were obtained from the gas flow-only group and non-treatment group. The apoptotic percentages of FaDu cells after plasma exposure for NT, 1, 3, and 5 min and 5 min of gas-only exposure are presented in
Figure 6. With the increase in plasma exposure time, the healthy cell percentage decreases. The apoptotic percentage increased from 0.81 to 10.11% when compared with the non-treatment group, i.e., about 12-fold higher apoptotic percentage.
Furthermore, the gas flow-only group has a higher healthy cell percentage than any plasma exposed groups. Among all of the groups, a larger portion of dead FaDu cells undergo the apoptotic stage than those that undergo the necrotic stage. The early necrotic stage has a relatively small percentage compared to the other phases. It is found that the extracellular and intracellular ROS/RNS increase with the addition of plasma exposure time, whereas only the excited gas amount is increased with the exposure time.
Therefore, the cancer cells underwent apoptosis, possibly due to the generation of the ROS and RNS, having a similar conclusion as the published papers. Based on the experimental results from Molavian et al. [
26], under the condition that cancer cell death is induced by the intracellular ROS level, cancer cell death should have a linear increase with respect to the extracellular ROS level. The cancer cell apoptotic percentage is normalized with respect to the non-treatment group. Interestingly, the gas flow group has a lower extracellular ROS increase than the non-treatment group in all tested cells. Hence, the latter has a lower normalized cancer cell apoptotic percentage.
3.6. ROS/RNS in the Plasma Exposed Medium and after Intracellular Changes
In
Figure 7a, the ROS+RNS content in the plasma-exposed medium is shown. The increases in ROS+RNS content are due to the sensitivity of cancer cells and plasma exposure, which may correlate with the decreased rates of their viability, as shown in
Figure 3 and summarized in
Figure 5e, and the apoptotic cell number, as compared in
Figure 5e. In
Figure 7b, the intracellular ROS/RNS measurements after plasma exposure for 90 s shown in
Figure 4 are summarized. For these cells, the increased rates of the intracellular ROS/RNS are shown in the range of 2.0–2.4%. This demonstrates that although the changes in cells viability and apoptotic cell number are significant, their increased rates of intracellular ROS/RNS after plasma exposure for 90 s are relatively insignificant.
In this study, some factors may have resulted from the effects of gas flow and the clinically approved culture medium for cancer cells. Using, e.g., saline solution containing with plasma-conditioned liquids, can be considered for further study to demonstrate the potential for clinical applications.
Additionally, in summary from
Figure 1,
Figure 2 and
Figure 4, the increases in intracellular ROS/RNS were more significant than those of ROS/RNS in the plasma exposed medium. Importantly, intracellular RNS was much more abundant than intracellular ROS. It is thus suggested that the increase in intracellular RNS contributed the most to cancer cell suppression.
3.7. Cancer Cell Apoptosis with the Concentration Change of Intracellular RNS
The plasma-generated species can activate important biological processes. Studies showed that N
2/He plasma created copious ROS/RNS in their excited phases. These species enter the adjacent aqueous phases and form solvated species—known to engage in rapid reactions with important biomolecules such as proteins and lipids. Therefore, it is also important to understand the interactions between plasma species and the medium [
27].
It was observed that the “indirect” mechanism of micro-plasma inducing cancer cell death is correlated with the increase in ROS/RNS, both of which cause oxidative stress. Therefore, these species are also known as agents associated with cancer [
18].
Many studies indicated that ROS generated by micro-plasma impact on several signaling pathways involved in the control of cell viability. At low doses of ROS in cells, they are essential for the regulation of normal physiological functions involved in cell growth, differentiation, maintenance of the redox balance, and migration [
28]. However, excess cellular levels of ROS can lead to the activation of cell death processes such as apoptosis [
29]. ROS have been closely linked to mitochondrial pathway activation. Mitochondria-derived ROS can target mtDNA, which is susceptible to oxidative damage [
30]. Damaged mtDNA may cause the disruption of respiration chain function, and an increase in ROS leads to the loss of mitochondria membrane potential and impaired ATP synthesis. This may lead to the activation of caspases 7/8/9, and PARP cleavage, which induces cell apoptosis. In addition, ROS is competent to activate the MAPK pathway, which responds to cellular stress and metabolism by phosphorylating JNK and
p38 and leads to cell apoptosis [
31].
3.8. Presumably Dominant Reactive Species Leading to the Inhibition of Cancer Cells
Plasma species may cause mitochondrial dysfunction due to the generation of additional ROS/RNS, including H
2O
2, O
X, OH
2, NO
2, and NO
X. These can lead to the depolarization of the mitochondrial membrane potential and to mitochondrial ROS/RNS accumulation [
32]. Because of the oncogene activation, progression, and metastasis of cancers, intracellular ROS/RNS [
33] is usually increased in cancer cells. The very high concentration of intracellular ROS/RNS is related to many human diseases, including cancers. This high concentration can damage cellular proteins, lipids, and DNA, giving rise to senescent, degenerative or fatal lesions in cells. Therefore, the purpose of introducing plasma species was not to merely increase ROS/RNS around the extracellular environment or to increase intracellular ROS/RNS, but rather to increase the OH concentration, since OH in cells itself has an extremely short half-life [
34].
It is important to identify the compositional changes due to the addition of plasma species. NO species (mostly from RNS species) have several cytotoxic effects, including reactions with proteins and nucleic acids. These effects correlate with cell apoptosis, and eventually lead to cancer cell death.
The findings in this study suggest that plasma can produce reactive species, including nitric oxide, ozone, and singlet delta oxygen in the medium containing cancer cells. These generated species may either directly interact with cancer cells or react in the medium, and produce shorter-lived reactive species such as OH. Thereafter, for the latter, the derivative species may activate cancer cells to generate imbalanced NO species in the intracellular environment responsible for the eventual death of cancer cells.


 ,
, 


