Article

Measurement of Stress Optic Coefficient for Thermal Barrier Coating Based on Terahertz Time-Domain Spectrum

1
Department of Mechanics, Tianjin University, Tianjin 300354, China
2
Tianjin Key Laboratory of Modern Engineering Mechanics, Tianjin University, Tianjin 300354, China
*
Authors to whom correspondence should be addressed.
Co-first author.
Coatings 2021, 11(10), 1265; https://doi.org/10.3390/coatings11101265
Submission received: 13 September 2021 / Revised: 8 October 2021 / Accepted: 13 October 2021 / Published: 18 October 2021
(This article belongs to the Special Issue Mechanical Properties of Advanced Multifunctional Coatings)

Abstract

:
The residual stress introduced inside the thermal barrier coating (TBC) top coating during manufacturing and service processes is one of the main causes of thermal barrier failure. Therefore, a nondestructive and accurate measurement of the residual stress in top coating is essential for the evaluation of TBC life. The terahertz time-domain spectroscopy (THz-TDS) technique, which is based on the calibration or measurement of the stress optical coefficients of the measured materials, is applicable to the measuring of internal stress of nonmetal materials. In this work, to characterize the internal stress in TBC, the stress optic coefficient of the TBC top coating was measured by reflection-type THz-TDS. First, the mechanics model for the internal stress measurement in a TBC top coating was derived based on the photoelastic theory. Then, the THz time-domain spectra of TBC specimens under different loadings were measured in situ by a reflection-type THz-TDS system. Finally, the unimodal fitting, multimodal fitting and barycenter methods were used to carry out the data processing of the THz time-domain spectral-characteristic peaks. By comparing the processed results, the results using the barycenter method were regarded as the calibrated stress optical coefficient of the TBC due to the method’s sufficient accuracy and stability.

1. Introduction

The gas turbine is one of the core pieces of power equipment closely related to the development of the energy and marine industries. The gas temperature in the front of the turbine blade is one of the indicators of the technical level of the gas turbine, which can reach more than 1600 °C. A thermal barrier coating (TBC) is one of the effective means to raise the gas temperature of a gas turbine due to its low cost and excellent comprehensive performance [1,2,3,4]. A TBC is a thermal protective multilayer coating structure formed by spraying materials with low thermal conductivity and high thermal stability onto metal substrates, and mainly includes top coating (TC), bonding coating (BC) and metal substrate. In addition, thermal growth oxide (TGO) may be generated when TBC works at high temperatures. A TBC has a typical multilayer heterostructure; hence, process stress and service stress are inevitably introduced into the coatings during the manufacturing process and by the service environment. For instance, internal stress is generated inside the top coating during the entire service life, owing to the microstructural evolution and thermal mismatch [5,6,7]. Interfacial stress is introduced with the growth of TGO. These internal and interfacial stresses may cause cracks and spalls along the interfaces and/or throughout the layers of the TBC, leading to the structural failure of the whole TBC system, and thus seriously threatening the service safety of the gas turbine [8,9,10,11,12]. Therefore, for the service safety of the gas turbine, it is important to characterize the residual stress in TBC using a nondestructive and accurate method.
For the nondestructive measurement of stress in the TBC top coating, many experimental techniques have been developed, such as X-ray diffraction (XRD), micro-Raman spectroscopy (μRS) and photoluminescence spectroscopy (PL). The XRD technique [13,14,15,16] characterizes the stress using the lattice deformation it causes, which has a high measurement accuracy. The μRS technique [17,18,19] measures stress with a high resolution through the detection of the frequency shift of the characteristic peak of the Raman spectrum line caused by crystal lattice deformation. However, XRD and μRS techniques are limited to surface stress measurements and by low measurement efficiency. Based on the photoluminescence piezo-spectroscopy effect, the PL technique [20,21,22] measures the stress at a certain depth of the TBC top coating instead of that in the whole TC layer of TBC. In addition, the resolution and confidence of the existing PL technique to characterize the internal stress of the TBC top coating are approximately several hundred MPa. Hence, existing nondestructive measurement technologies cannot meet the experimental requirements of high precision, high efficiency and full-field stress measurements.
Terahertz time-domain spectroscopy (THz-TDS) has recently emerged as a novel nondestructive testing method with the advantages of convenience, noncontact, and high precision. Most opaque nonmetallic materials, including the top coating materials of the TBC [23,24,25], have birefringence properties when penetrated by terahertz (THz) waves, which make it possible to quantify the internal stress based on the principle of photoelasticity [26,27,28,29]. Based on a reflection-type THz-TDS system, Chen et al. found that THz waves could penetrate the TBC top coating and reflect back at both the air/TC interface and the TC/BC interface [30]. The transmission-type THz-TDS system was used to measure the transmittance of TBC by Watanabe et al., who found that the coating had a good transmittance of 20% to 80% in the frequency range of less than 0.5 THz [31]. This result indicated that THz-TDS could be used for the measurement of the TBC structure. Based on a transmission-type THz-TDS system, the stress optic coefficient of sintered yttria partially stabilized zirconia (YTZP) ceramic bulk in a tensional state was measured by Schemmel et al. [32]. In this experiment, the phenomenon of stress-induced birefringence in a ceramic under tension was observed, which proved the feasibility of the quantitative measurement of internal stress in a ceramic coating using THz-TDS. Schemmel et al. also extended the THz-TDS study on the TBC to a self-built reflection-type THz-TDS system, which also found the stress-induced birefringence phenomenon in TBC under tension-loading [33].
In fact, a transmission-type THz-TDS system is hardly applicable for the analysis of stress in an actual TBC structure because the metal substrate of TBC is opaque to the THz ‘light’. Hence, a reflection-type THz-TDS system is essential for the stress measurement of an actual TBC.
The kernel problem is the stress optical coefficient of the measured material. The TC layer in TBC is generally a specific ceramic material, such as rare metal-doped zirconia, which is porous, brittle and prepared by means of atmospheric plasma spraying (APS) or electron beam-physical vapor deposition (EB-PVD). The mechanical properties of the TC layer, including its stress optical coefficient, vary greatly due to different stress states (tension or compression), preparation methods and production batches. In particular, in most cases, the stress state of the TBC top coating is compressive stress. The stress optical coefficient under tension in most of existing works was not helpful enough in the actual analysis of the TC layer under compressive stress.
In the present work, the stress optical coefficient of sintered 8 wt.% yttrium oxide partially stabilized zirconia under compression was measured based on a reflection-type THz-TDS system and a uniaxial loading device. Based on the unimodal fitting, the multimodal fitting and the barycenter methods, the stress optical coefficient of the TBC top coating was calibrated by fitting the slope between the refractive index and the stress of the TBC top coating, which is the significant parameter in THz stress analysis. The measurement of the stress optical coefficient provides the basis for the internal stress analysis of the TBC top coating of a gas turbine using THz-TDS.

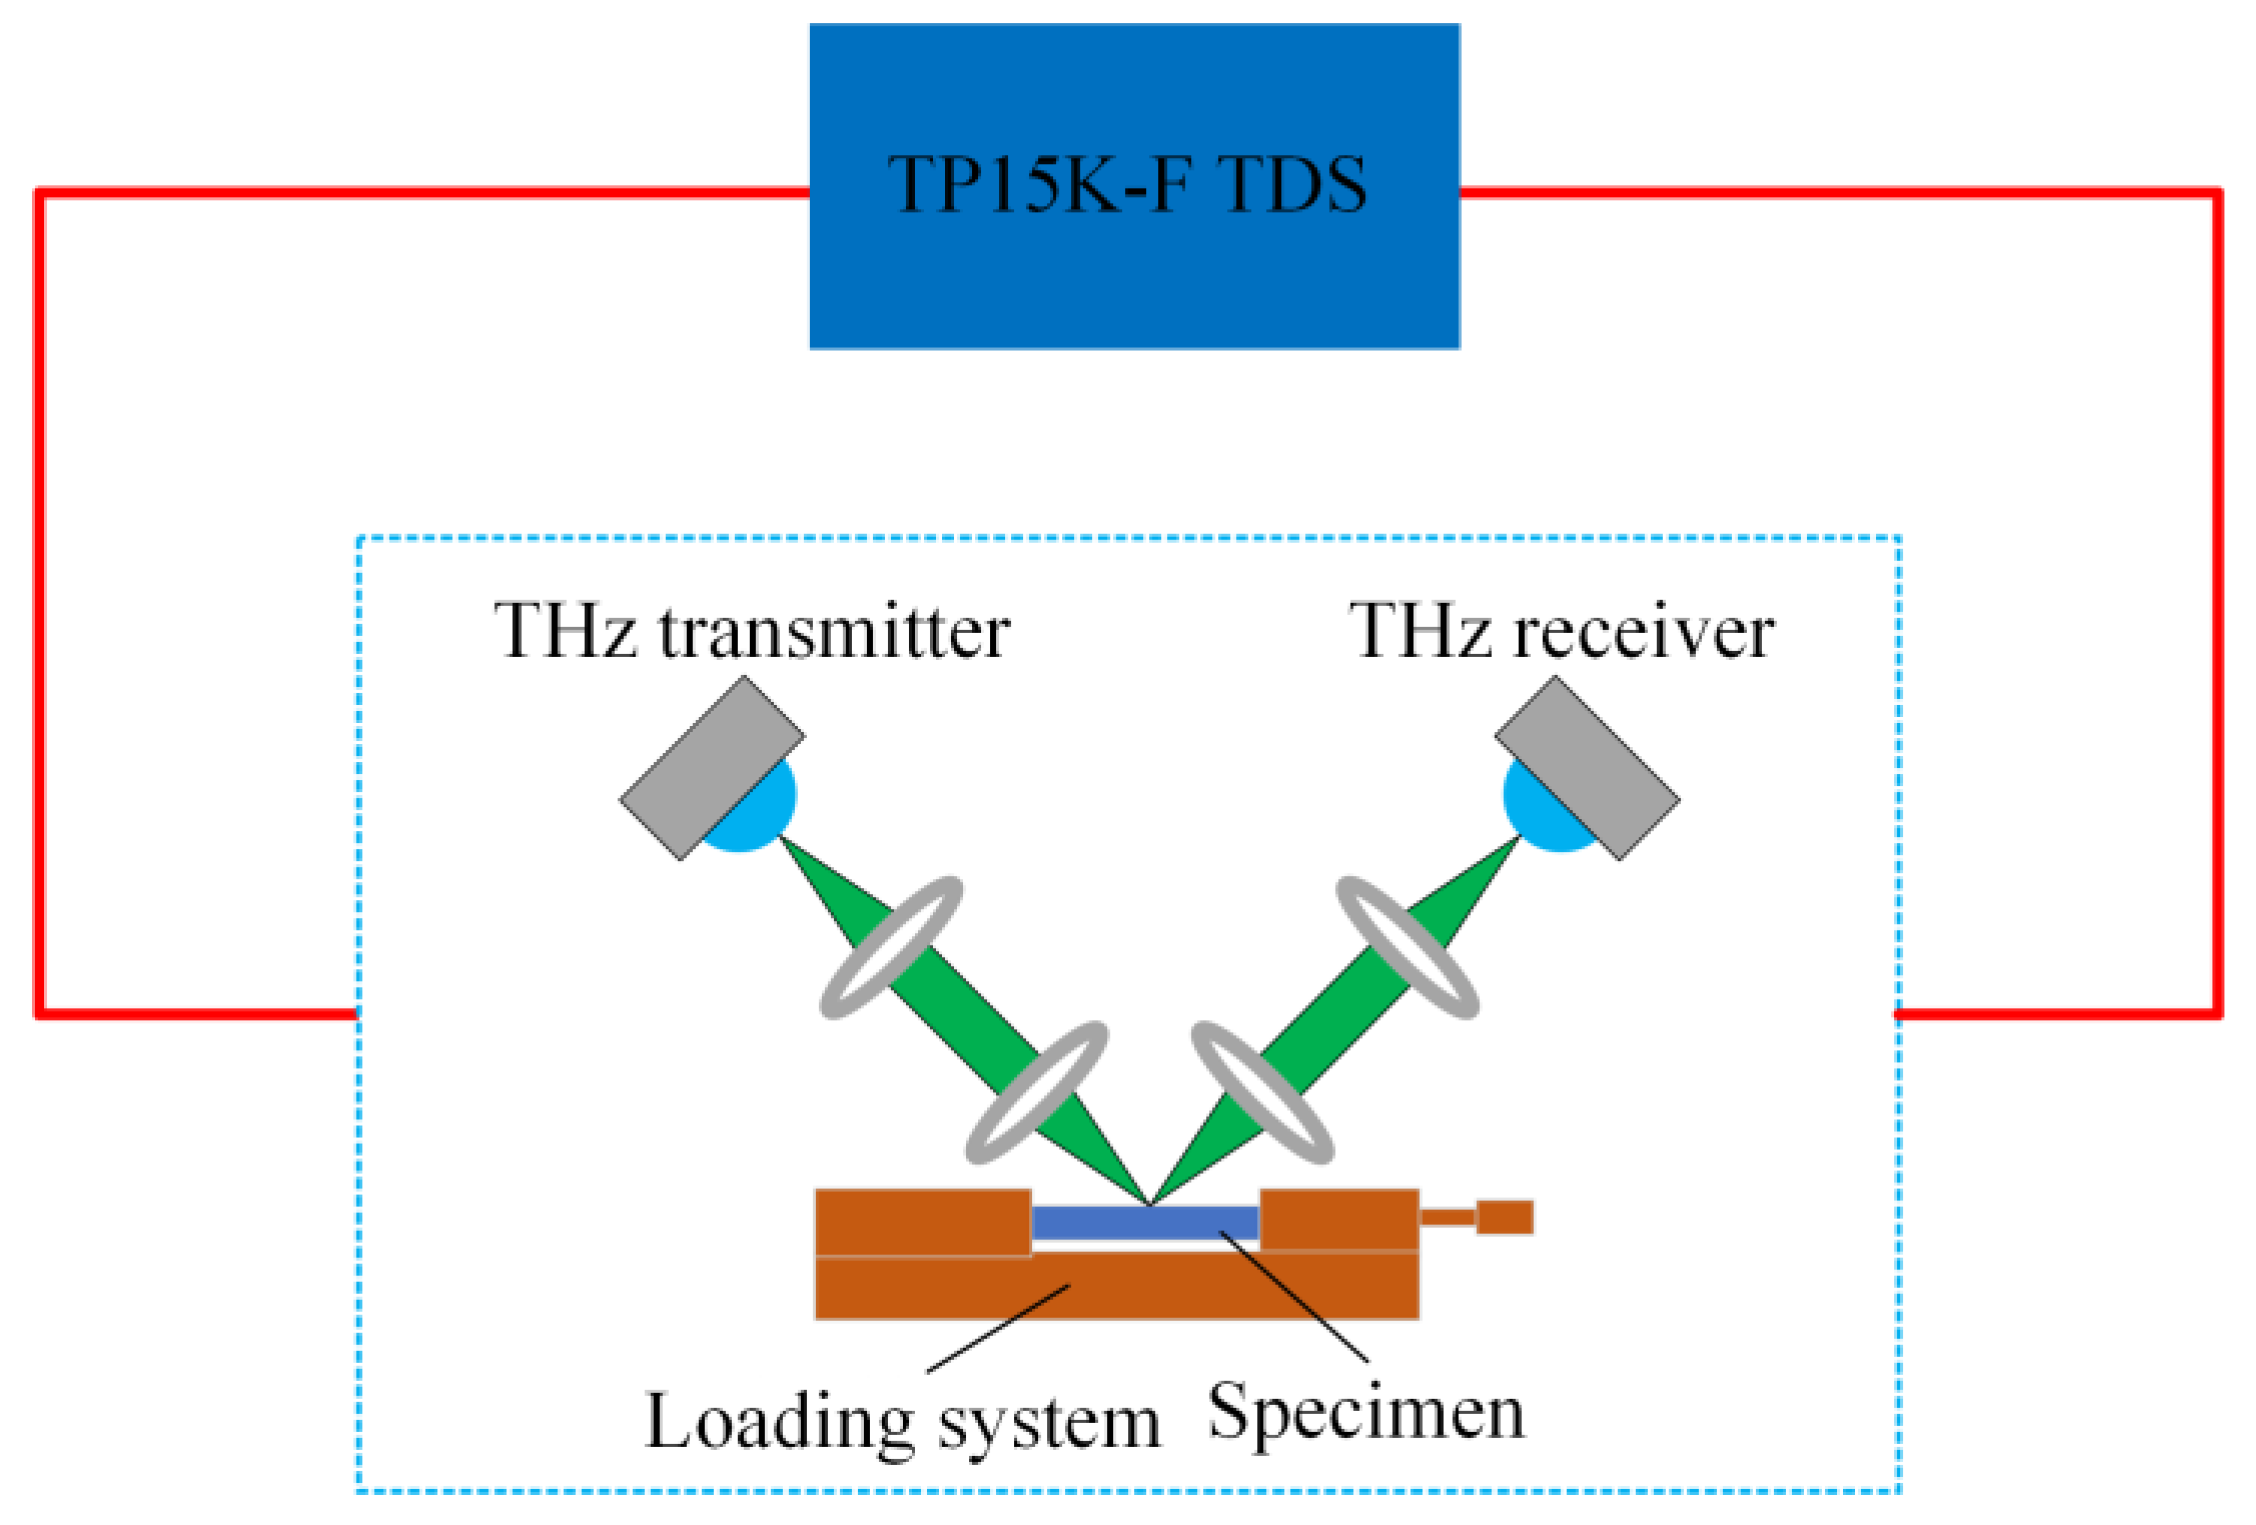
2. Materials and Experiments

The specimens used in this work were prepared as follows. Sintered 8 wt.% yttrium oxide partially stabilized zirconia (8YSZ) powder was put into a mold and pressed into the ceramic embryo body. The 8YSZ powder was supplied by Tianjin Detianzhu Amorphous Nano Technology Ltd. (Tianjin, China). Then, the embryo body was sintered at 1500 °C to form a dense 8YSZ ceramic block. After that, the TBC specimens with high surface flatness were obtained by high-precision wire cutting and fine grinding. Eventually, one side of each specimen was coated with a 1 μm aluminum film using the radio frequency magnetron sputtering system (YCL-50A, Yujie Vacuum Equipment Ltd., Shenyang, China). The uniform thickness of the aluminum film was ensured by rotating the TBC specimen. The power of the equipment was 60 W, the working pressure was 2 Pa, and the deposition time was 2 h. The final dimensions of each specimen are 15 mm × 10 mm × 1 mm. In addition, the specimen has the same composition and preparation process as the actual TBC top coating.
The experimental installation, as shown in Figure 1, consisted of a reflection-type THz-TDS system and a uniaxial loading machine. In detail, the THz-TDS system was an all-fiberized terahertz time-domain spectrometer (TP15K-F, produced by Tianjin Tiertime Ltd., Tianjin, China). Two all-fiberized THz antennas were chosen to generate and detect the THz waves. The femtosecond laser had a 100-fs pulse width, a 1550 nm wavelength, and a 100 MHz repetition rate. The frequency range of available THz pulses in the system was 0.2 to 3.5 THz. The THz wave was focused onto the specimen using a convex lens, and the spot diameter on the specimen was approximately 5 mm. The incidence angle of the THz wave was 45°. In addition, a self-built uniaxial loading machine was used for the experiments.
Before the test, the TBC specimen was fixed on the loading machine using a compressive preload of 30 N and adjusted to ensure that the axis of the specimen along the length direction was perpendicular to the contact surface of the loading block. Then, the specimen was compressively loaded step-by-step to 800 N with a step length of 50 N. The reflective THz time-domain spectra were obtained by averaging 100 in situ collections under each loading step. The THz time-domain spectra of TBC specimens under different loadings collected in this work are shown in Figure 2, where S denotes surface reflection, R1 denotes the first interface reflection, and R2 denotes the second interface reflection.

3. Models and Methods

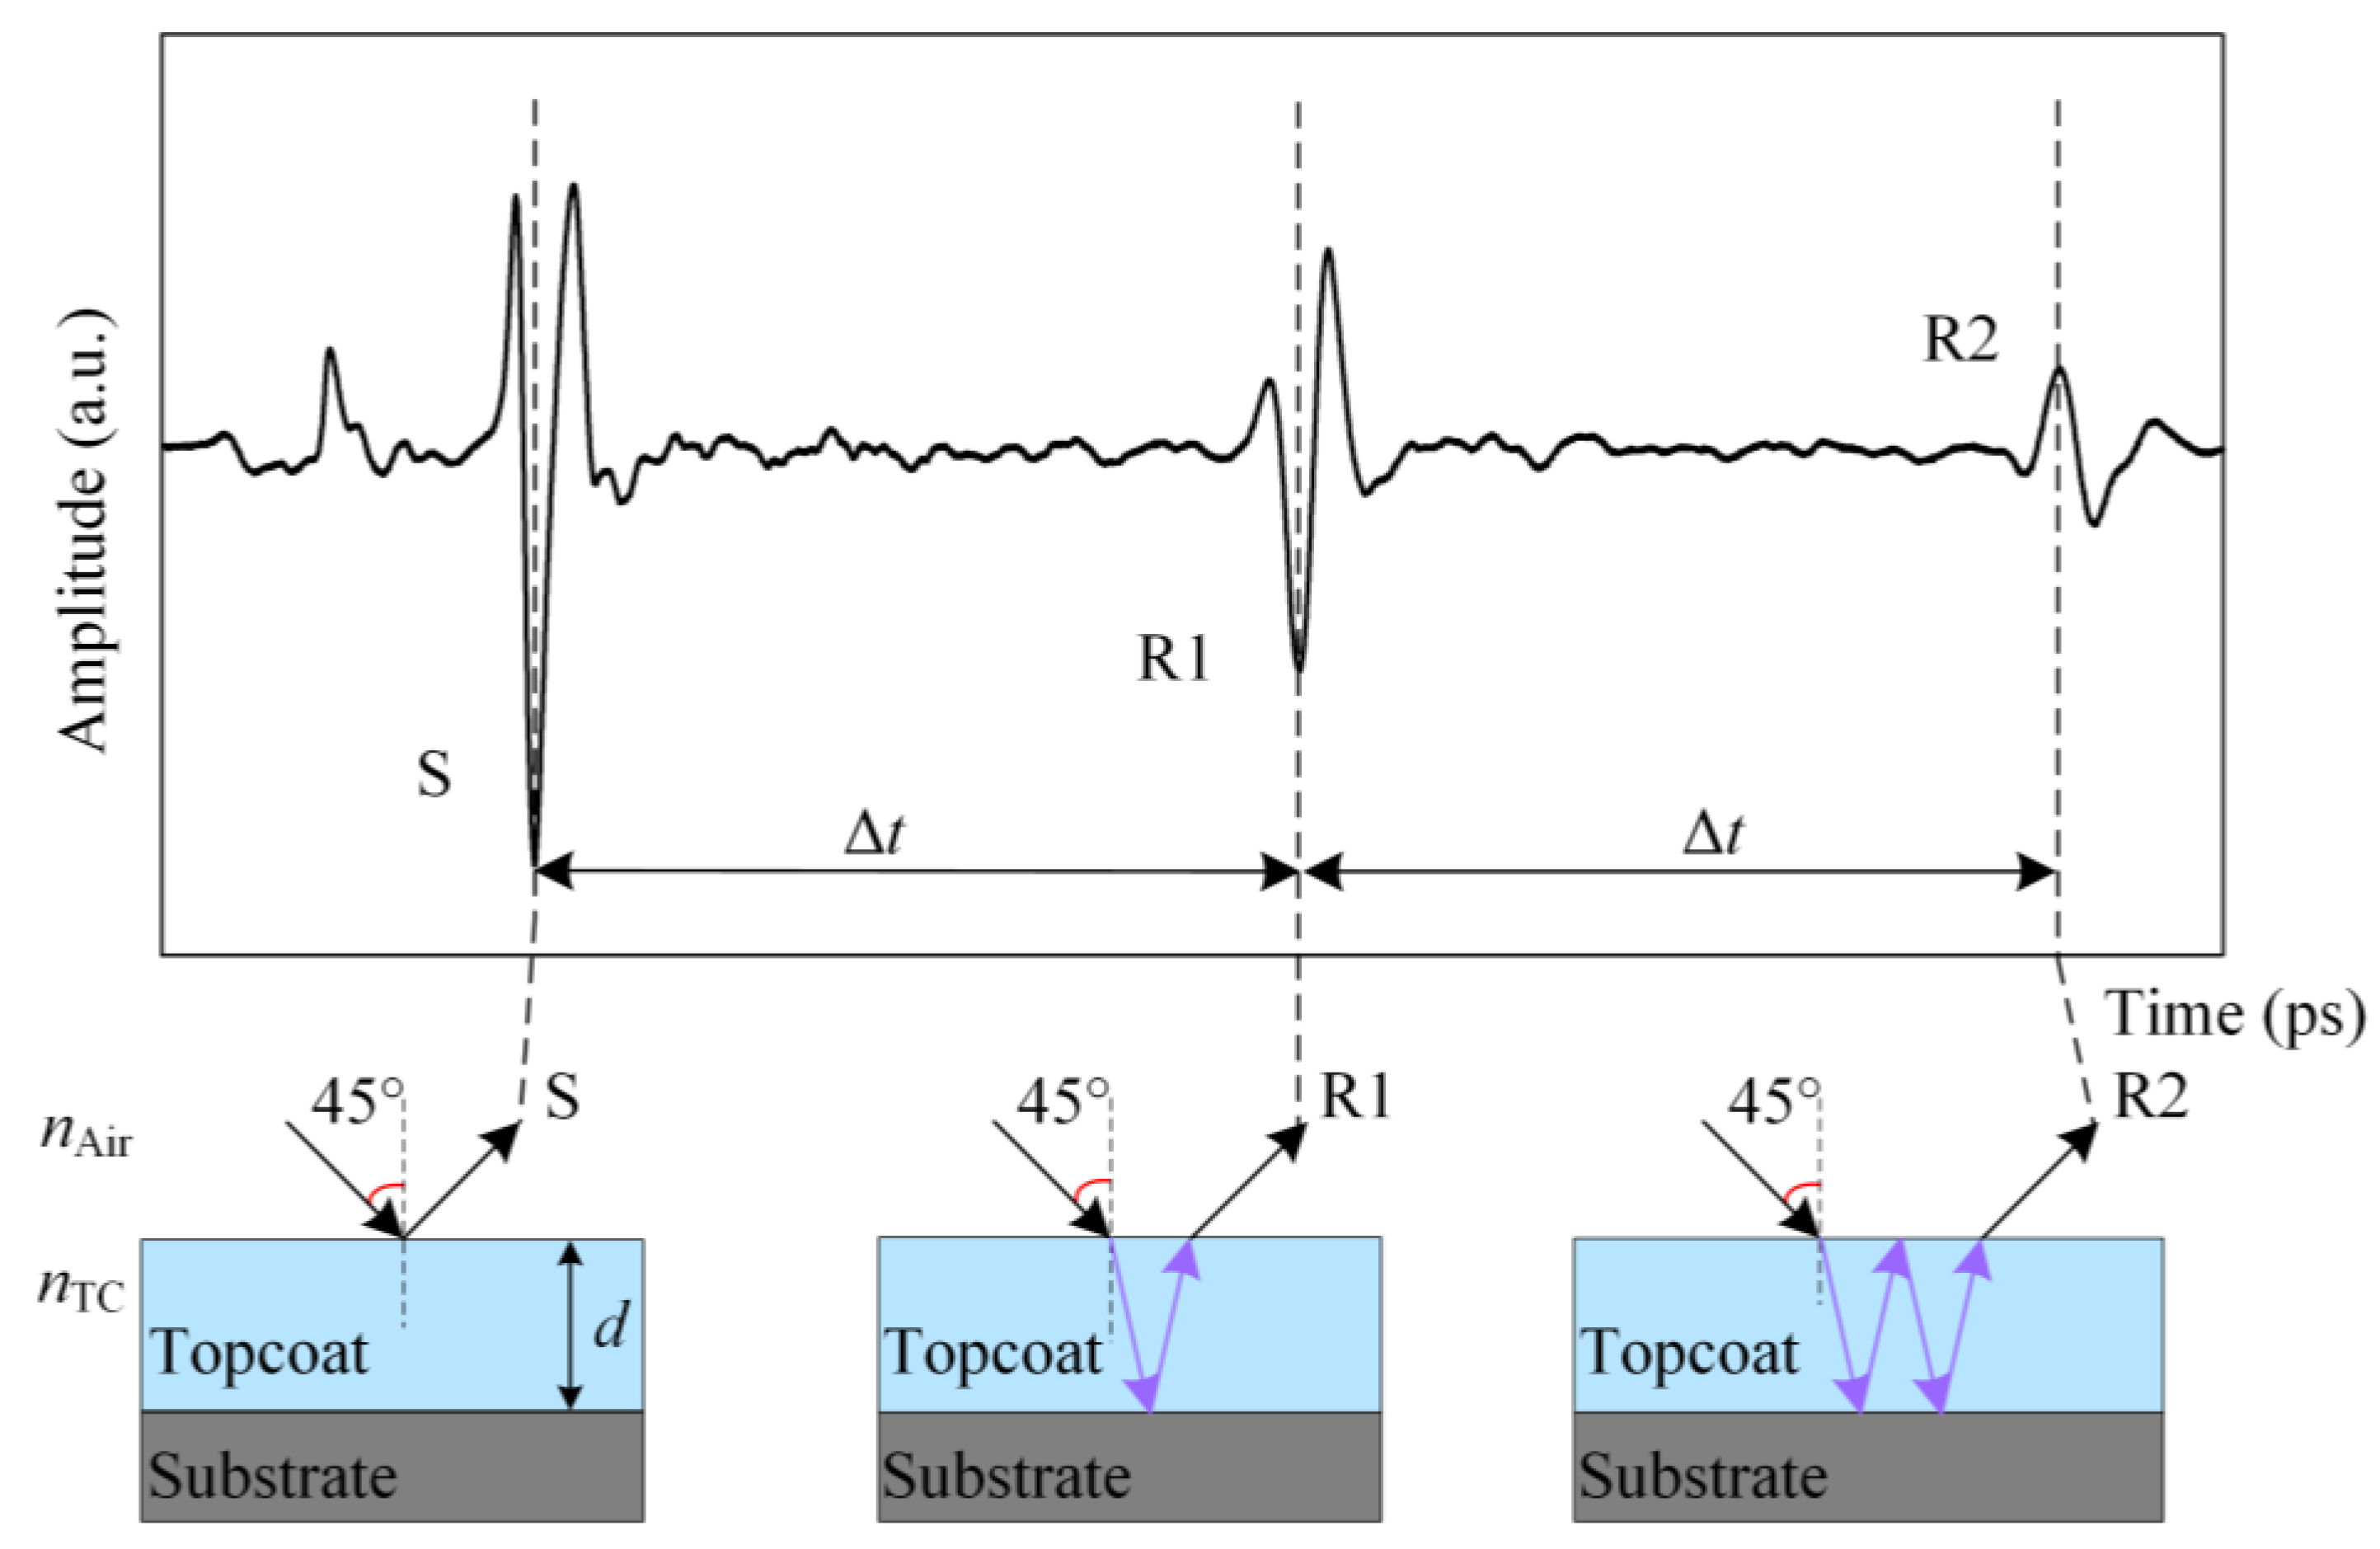
3.1. Model of Stress Measurement

The THz wave of the ceramic material in a TBC has a sensitive stress-induced birefringence effect [32]. Assuming that the stress in the TBC top coating conforms to the in-plane stress state, the birefringence phenomenon will occur when the beam penetrates vertically into the material. The beam transmitting into the TC layer is decomposed into two plane-polarized beams perpendicular to each other along the principal stress direction, and the two beams of polarized light propagate at different speeds in the ceramic material. The relationship between the principal stress of the TC layer, σ1, σ2, and the refractive index in the direction of the principal stress, n1, n2, can be expressed as follows:
{ n 1 n = c 1 σ 1 + c 2 σ 2 n 2 n = c 1 σ 2 + c 2 σ 1
where n denotes the refractive index of the unloaded material, n1 and n2 denote the absolute refractive index of the ceramic material in the directions of σ1 and σ2, and c1 and c2 denote the stress optical coefficients in the directions of σ1 and σ2. By subtracting the two expressions in Equation (1), it can be stated that:
n 1 n 2 = C ( σ 1 σ 2 )
where C denotes the stress optical coefficient of the material and C = c1c2. If a uniaxial load is applied such that the transverse stress σ2 is approximately zero, Equation (1) can be expressed as:
Δ n 1 = c 1 × Δ σ 1
The stress optical coefficient c1 of the material can be obtained by calculating the refractive index change of the specimen under different loadings, which can be used to measure the internal stress of the TBC top coating. Hence, the measurement of the stress optical coefficient of the TBC material is the basis of the stress analysis in the TBC top coating.

3.2. Model of Refractive Index Measurement

THz waves can penetrate the ceramic, but not the metal, and are reflected back at both the air/TC interface and the TC/BC interface (viz. the 8YSZ/Al interface). The propagation path of the THz wave inside the ceramic TC is schematically shown in Figure 3, where Δt denotes the time delay of THz wave, c denotes the speed of light in a vacuum and d denotes the thickness of the specimen. In a reflection-type THz-TDS system, the relationship between the specimen refractive index nTC and time delay Δt can be expressed as [34].
n TC = c × Δ t 2 d

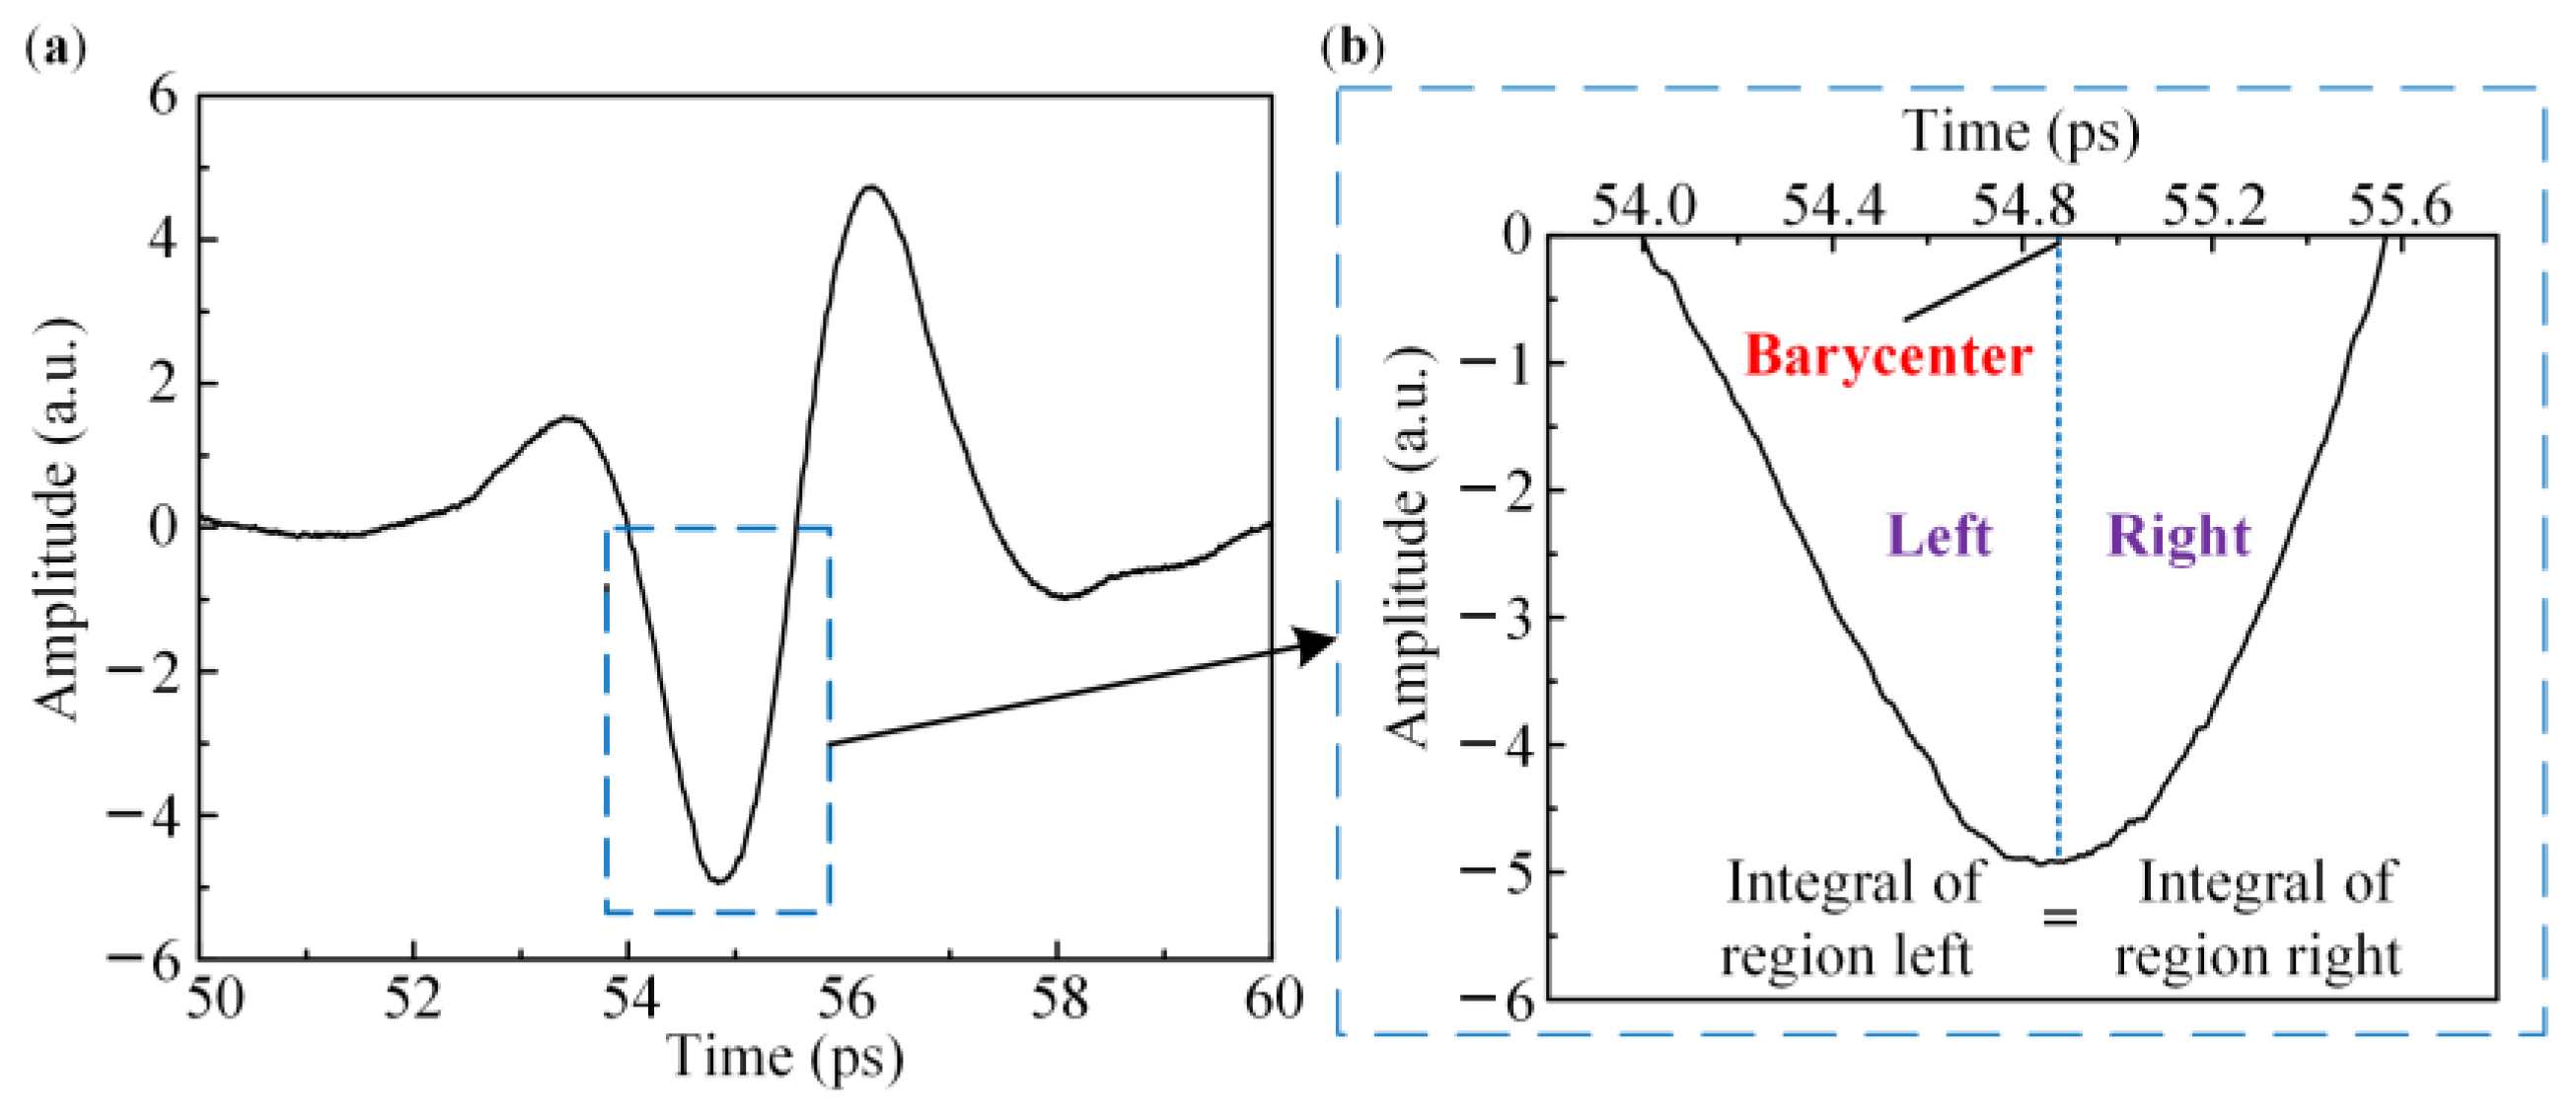
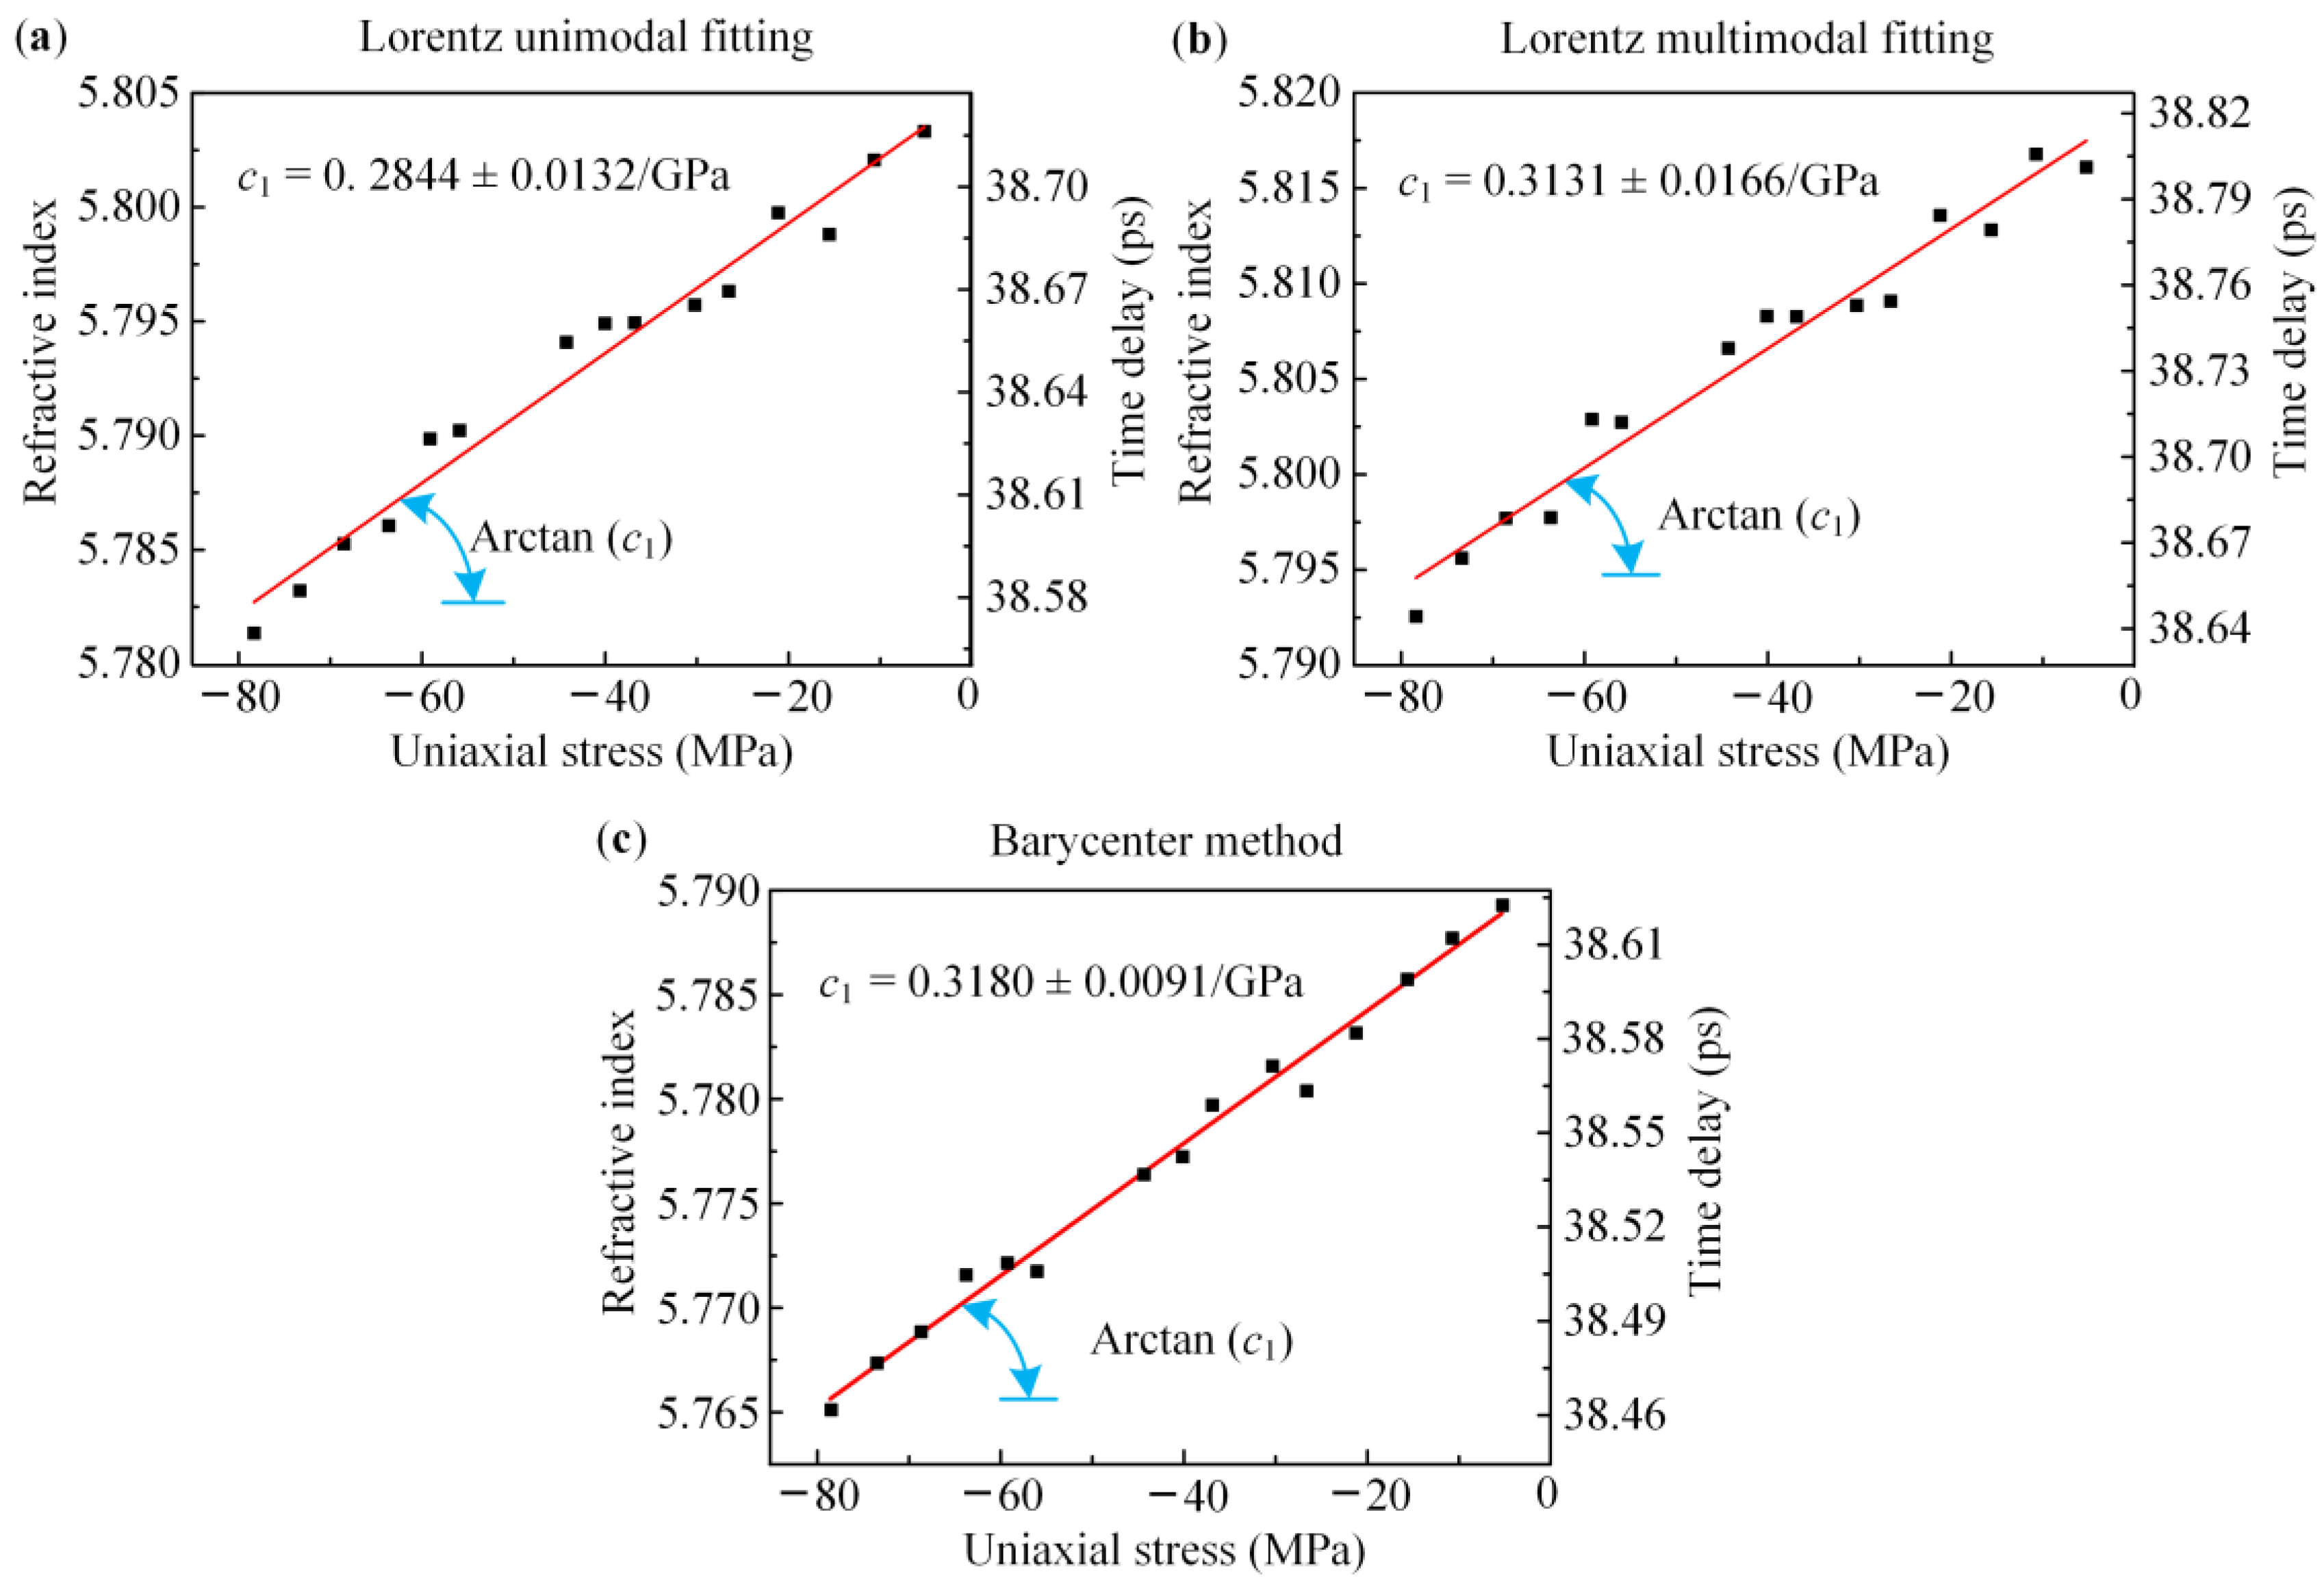
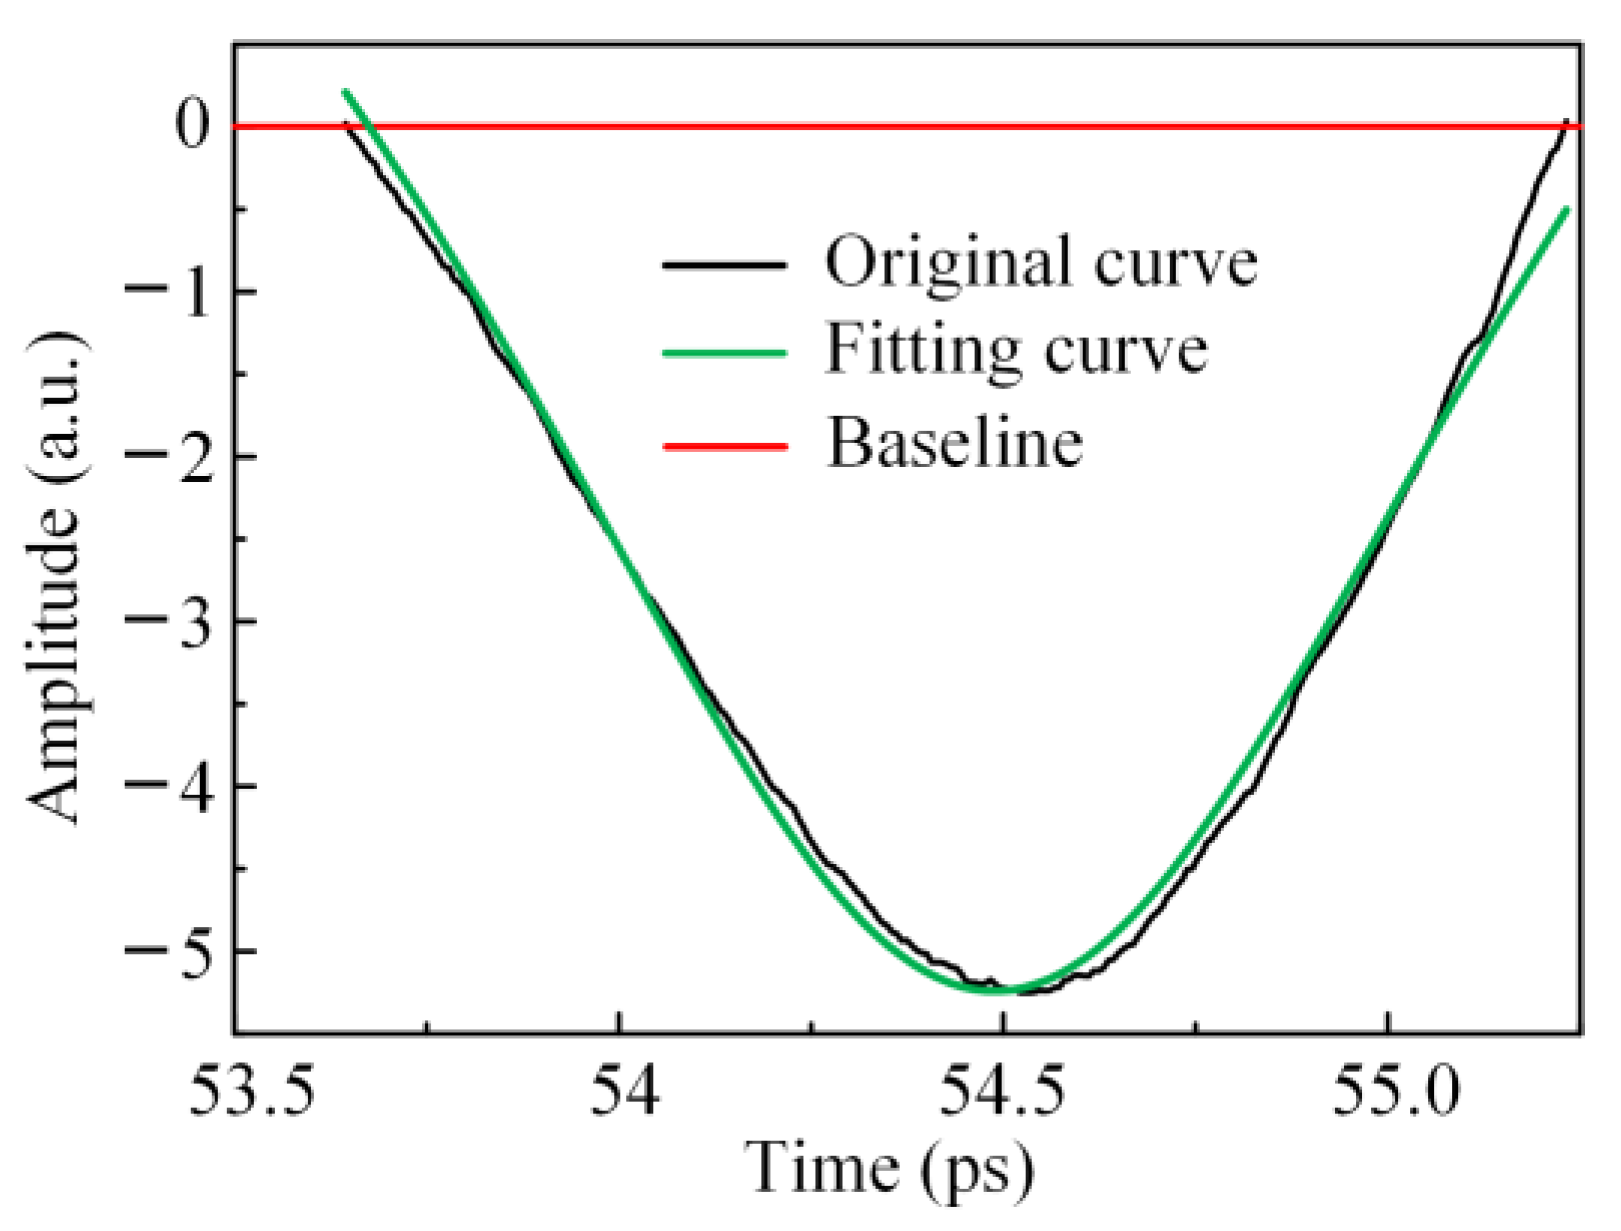
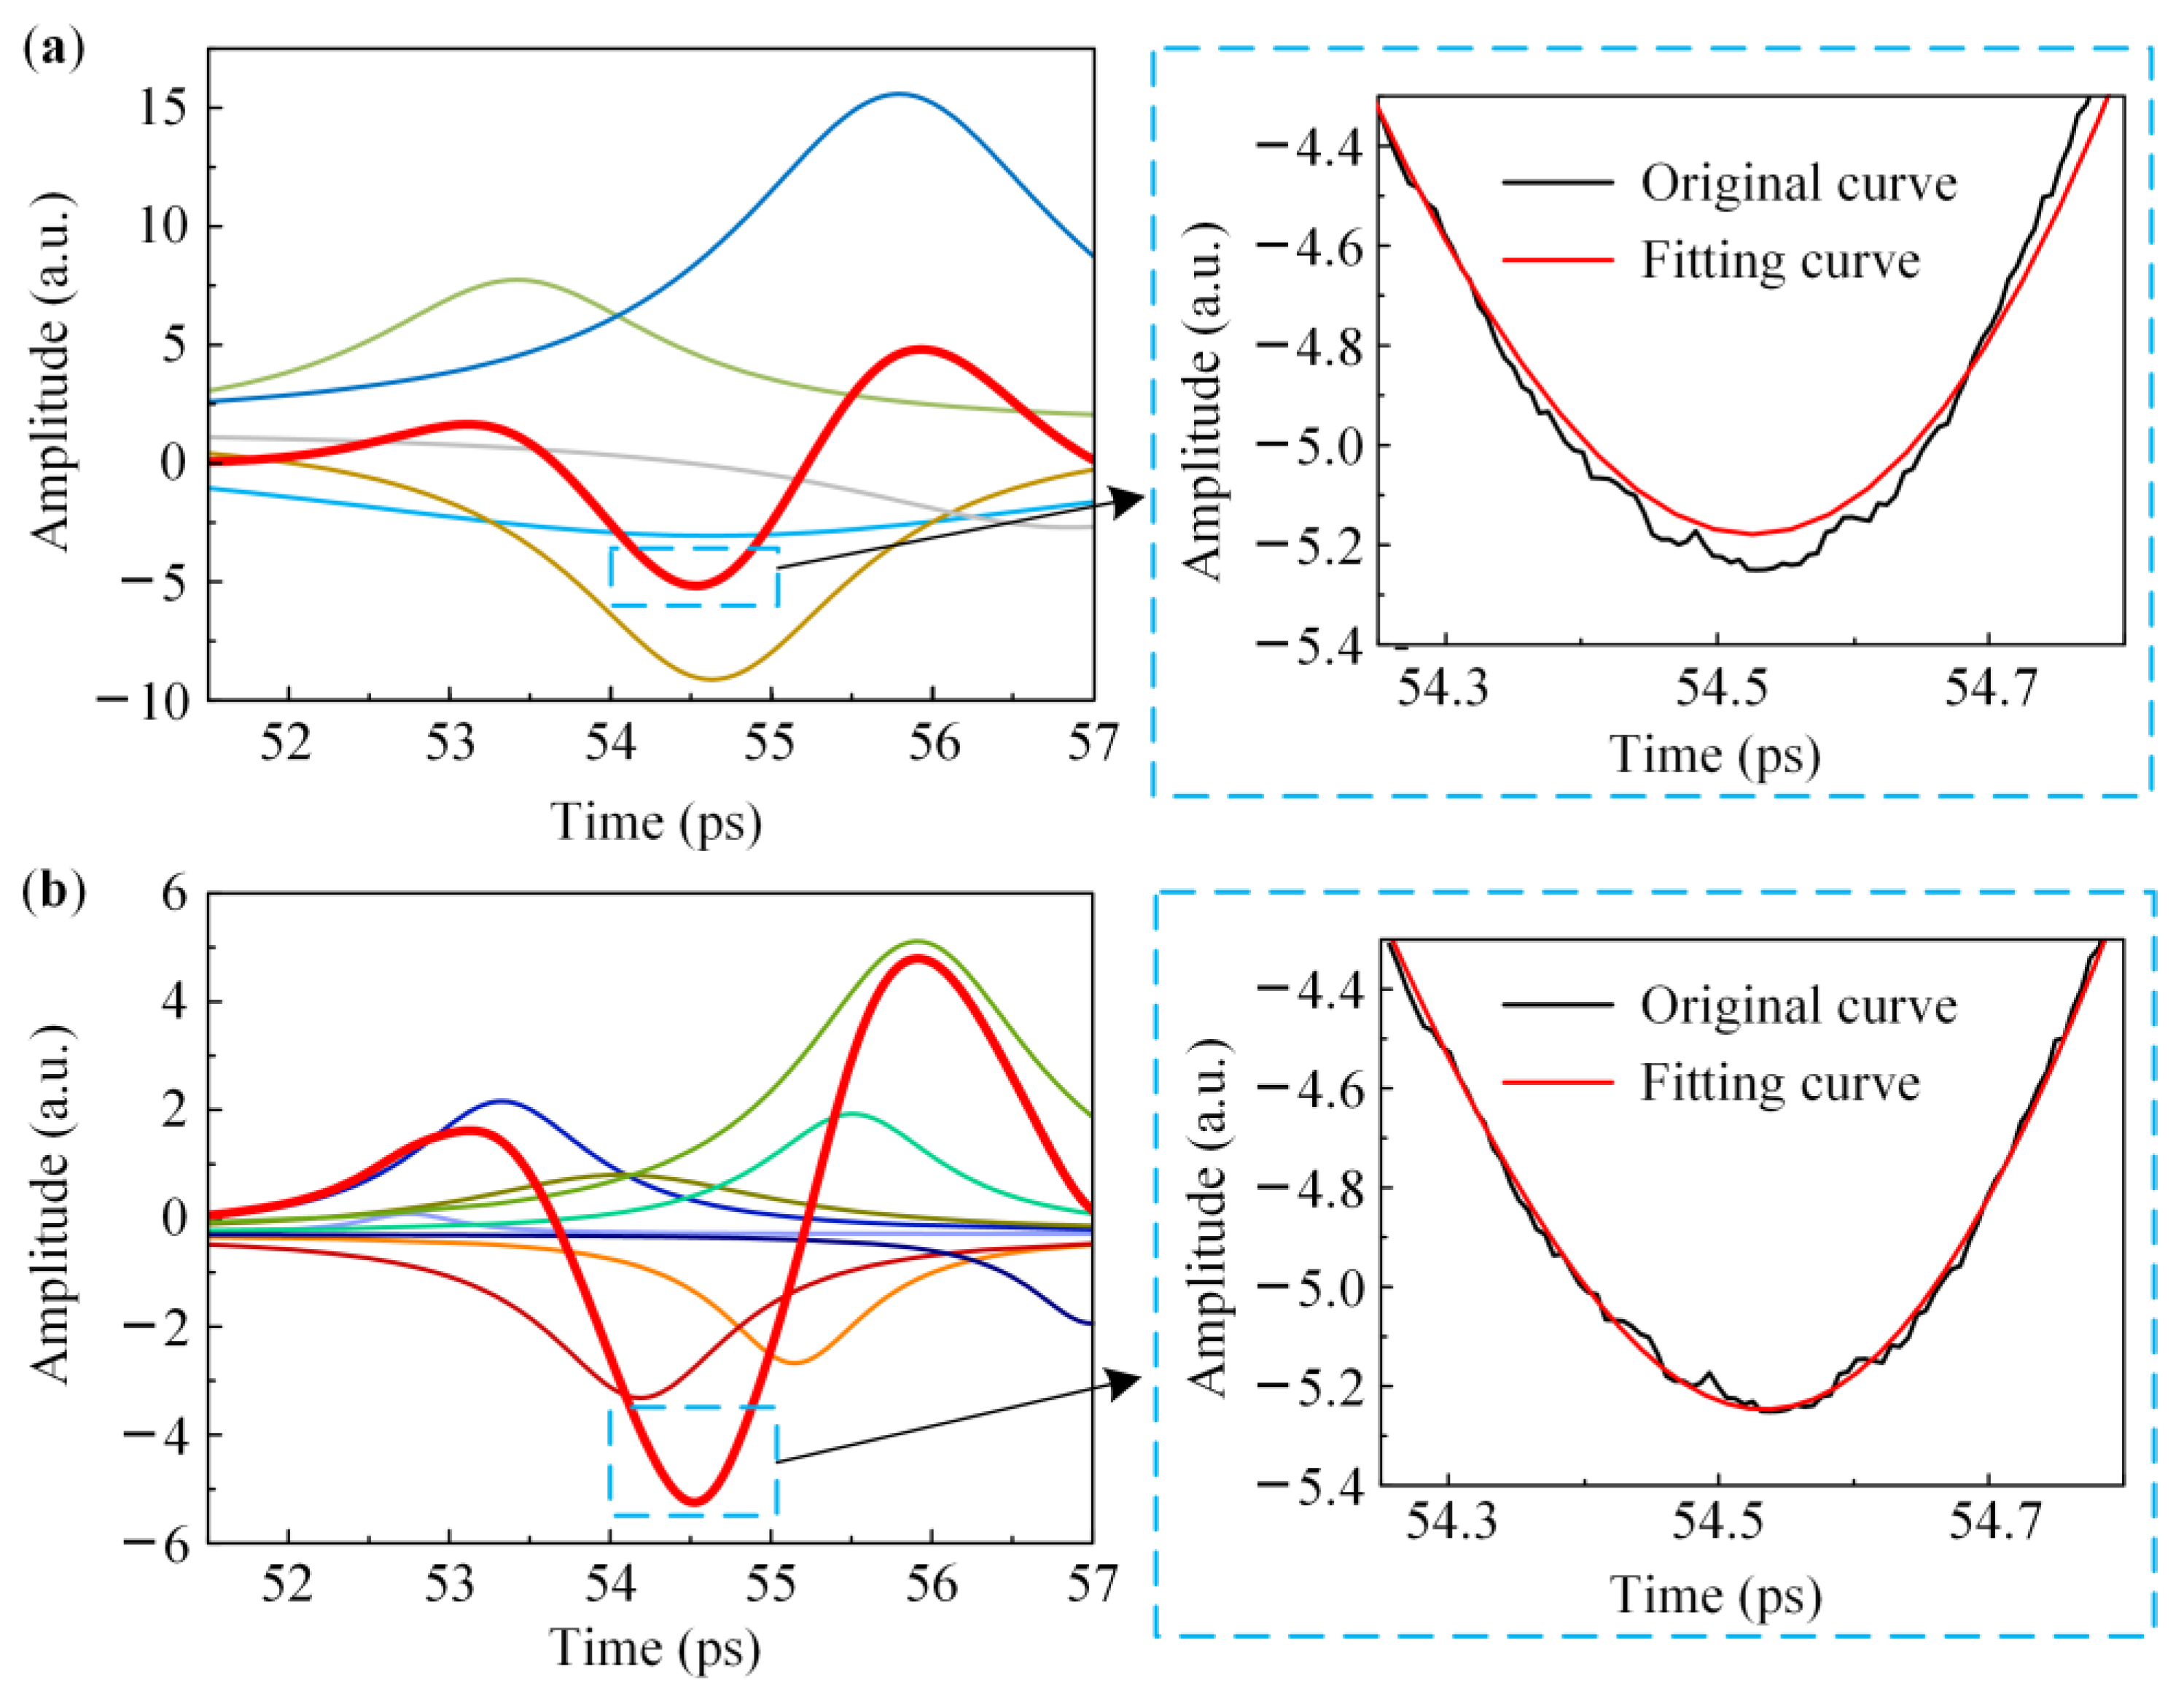
3.3. Data Processing Methods

In this work, the positions of characteristic peaks were extracted from the THz time-domain spectra using three data processing methods: a unimodal fitting method, a multimodal fitting method and a barycenter method. The Lorentz function was used for unimodal fitting because the characteristic peaks of the THz spectra were narrow and sharp enough. The Lorentz function is expressed as follows:
y = y 0 + 2 A π × w 4 ( x x c ) 2 + w 2
where y0 denotes the reference value of the characteristic peak, A denotes the peak area, w denotes the half-height width, and xc denotes the peak position.
The Lorentz multimodal fitting method extracted the positions of the characteristic peaks through the linear superposition of multiple Lorentz functions. Fitting curves with a high goodness of fit (GOF) to the original data were obtained by using multimodal fitting. The spectral GOF obtained using multimodal fitting was relatively high (up to 0.9999); that is, the fitting curves almost perfectly matched the experimental curves.
In addition, the barycenter method was also applied to process the measured spectra in the present work. The peak position corresponding to the half-peak-area of the characteristic peak (the barycentric peak) was used in the barycenter method to describe the spectral deviation. The THz time-domain spectrum is given in Figure 4a, which shows that the whole characteristic peak can be divided into two regions, the left region and the right region, by a vertical line. When the integral of the left region was equal to that of the right region, as shown in Figure 4b, the position of the vertical line dividing the two regions was regarded as the barycentric peak.

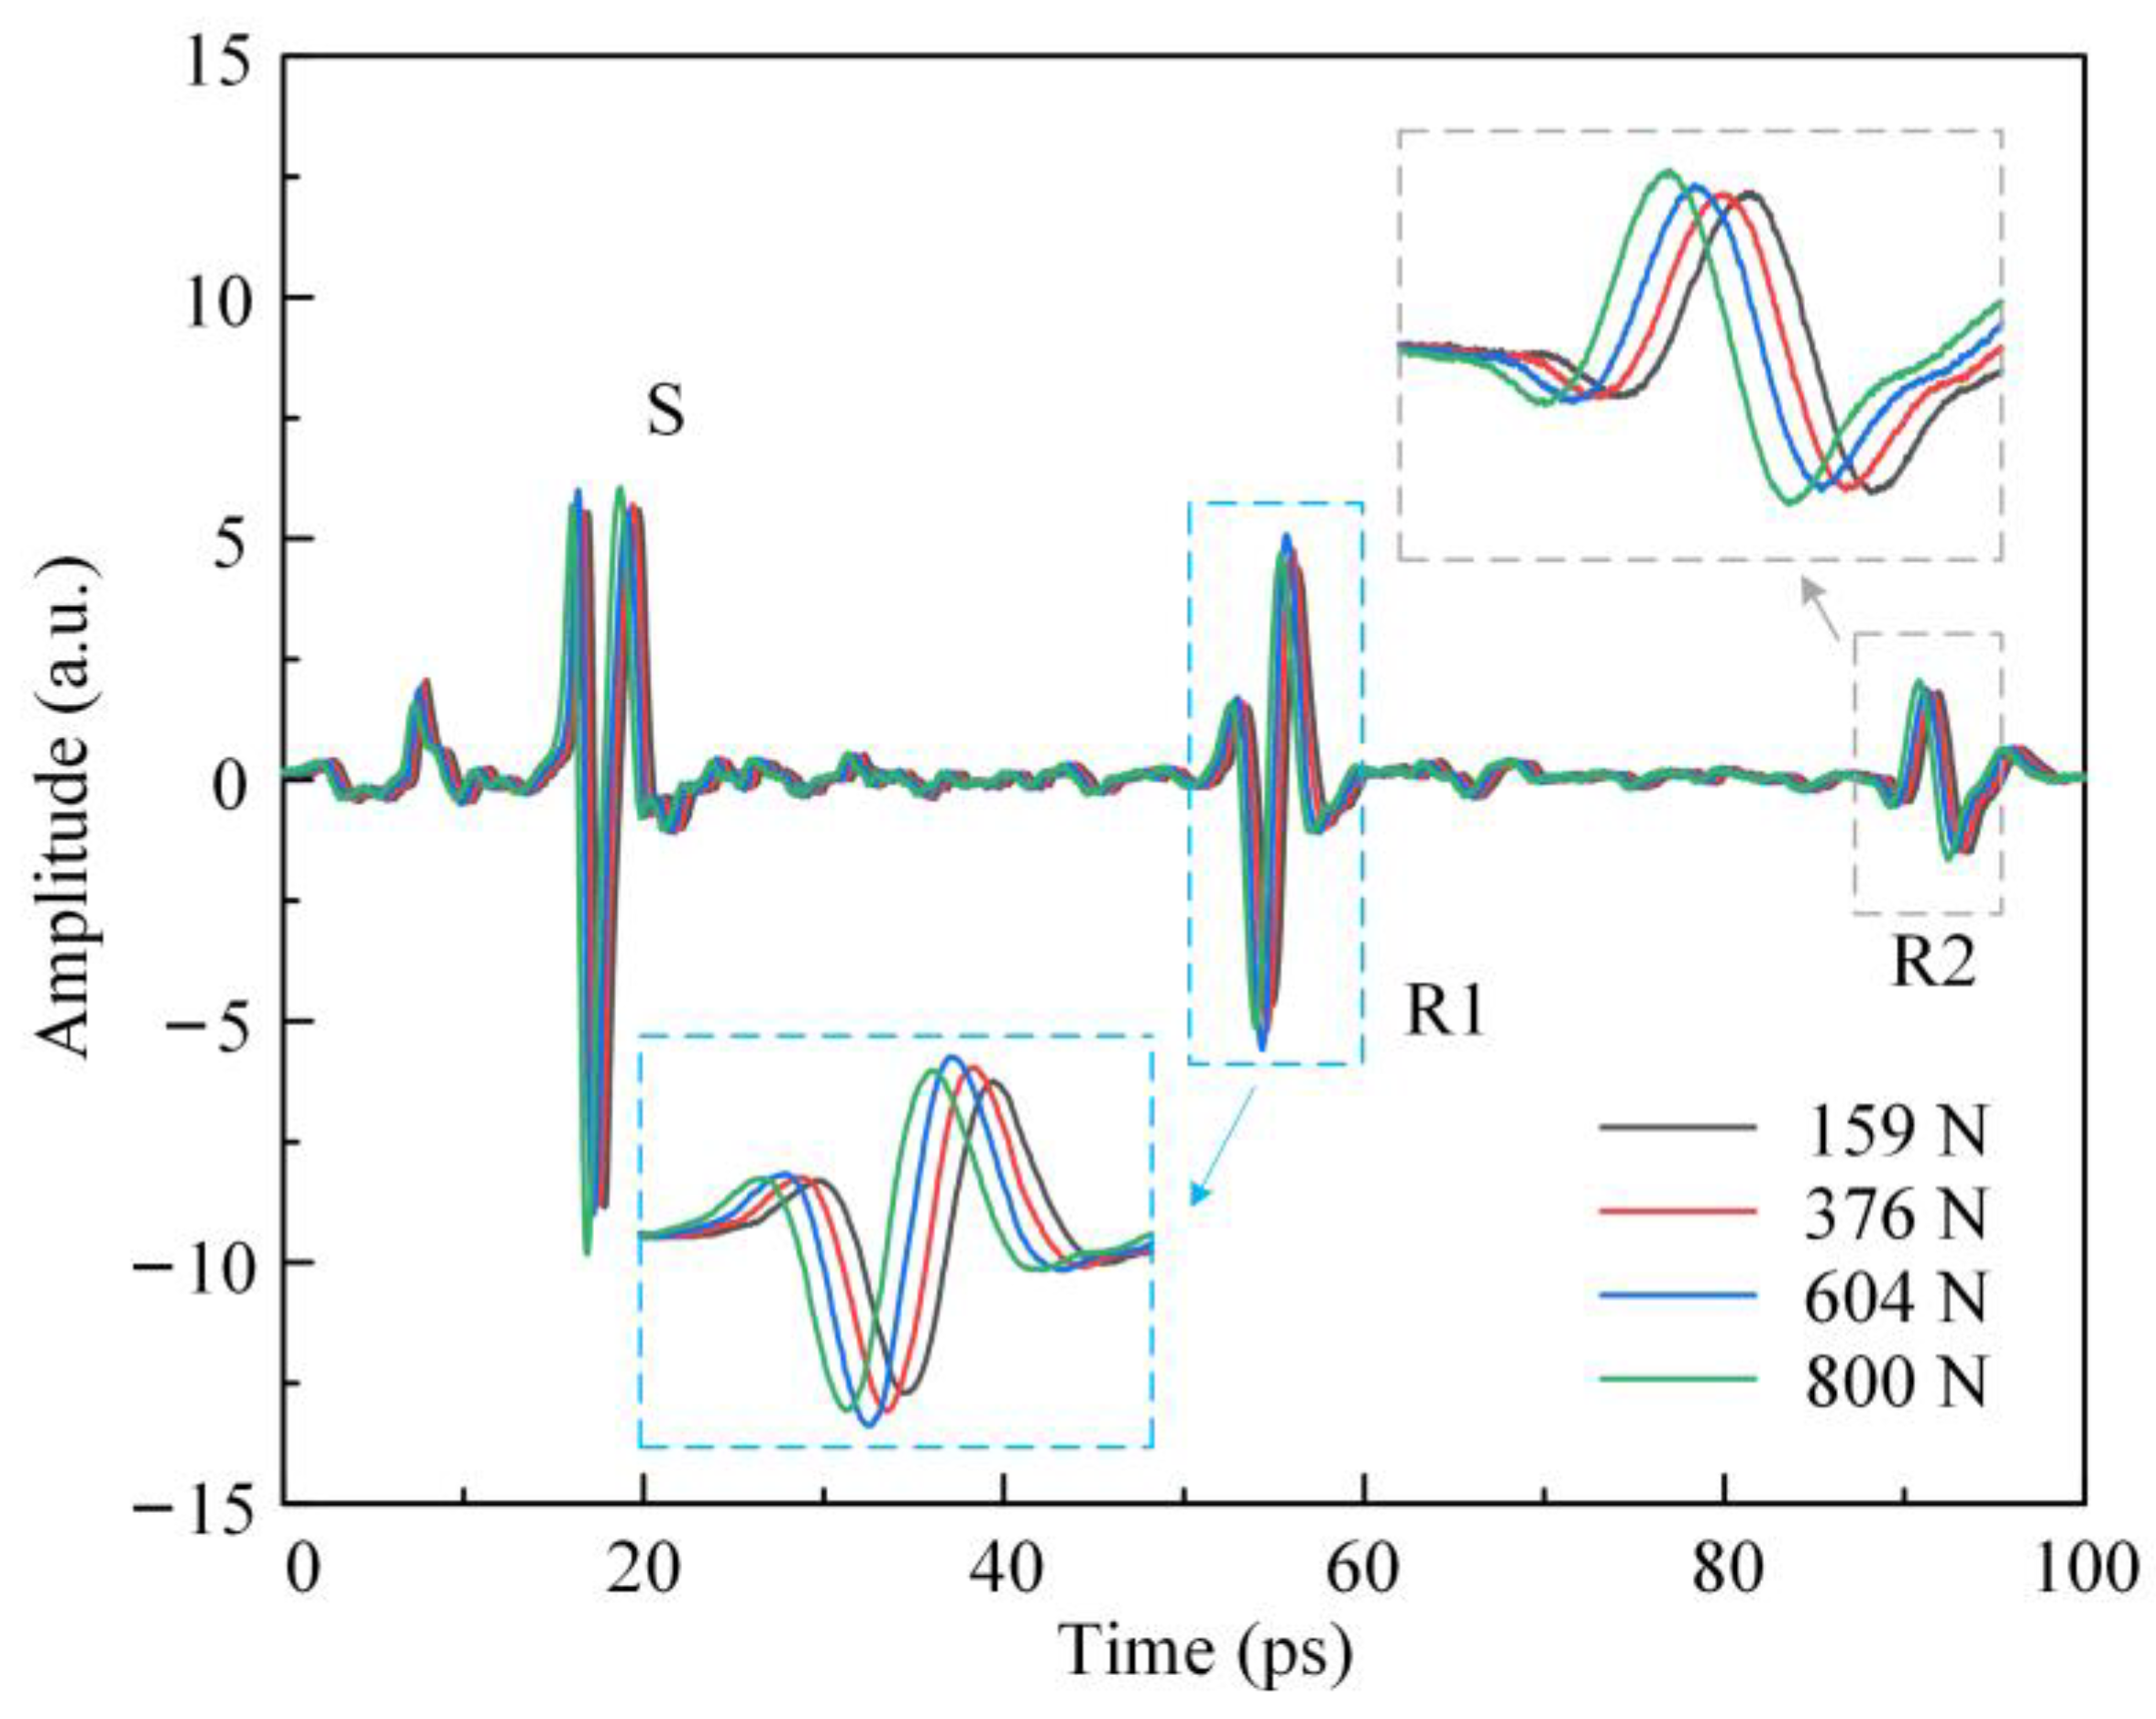
4. Results and Discussions

In this work, 15 groups of time-domain spectra under different stress steps were obtained using a reflection-type THz-TDS system and processed by using unimodal fitting, multimodal fitting and barycenter methods, respectively. The refractive indices under different uniaxial loadings were obtained, as shown in Figure 5. Based on the processed results, the stress optical coefficients c1 were obtained and are listed in Table 1.
In Figure 5, it can be seen that there is always a linear relationship between the refractive index of the TBC specimen and the internal stress within the online elastic range. This indicates the existence of stress-induced birefringence in the TBC specimen, which verifies the feasibility of measuring the internal stress of the TBC top coating using the THz-TDS technique. In addition, the stress optical coefficient can be obtained by using the above three fitting methods.
By comparing the results of these three methods, the stress optical coefficient obtained from the multimodal fitting was found to be similar to that of the barycenter method, but that of the unimodal fitting was significantly lower than the other two, since the Lorentz curve is left–right symmetric and the characteristic peak in the THz time-domain spectrum is scarcely symmetric. As shown in Figure 6, the unimodal fitting curve was different from the original curve in shape, leading to a low peak GOF (0.9922). The width of the left side of the characteristic peak was wider than that of the right side, which lead the peak position of the fitting curve to deviate to the left during unimodal fitting. In Figure 6, the peak position of the original curve was approximately 54.528 ps and that of the unimodal fitting curve was 54.4945 ps. The average time-shift of the peak position of the characteristic peak under each loading step was 0.0815 ps, and the deviation calculated from the unimodal fitting was 0.0335 ps. The calculation error of the peak position (the ratio of the deviation of the peak position to the average time-shift) was 41.1%. In addition, the unimodal fitting results of the THz spectrum of TBC specimens under different loadings were processed by the above method and the average calculation error of the unimodal fitting method was 28.2%. Hence, the Lorentz unimodal fitting method was not suitable due to the poor symmetry of the data detected by THz-TDS.
For the multimodal fitting method, the number of sub-peaks and their positions had a great influence on the fitting results. In this work, multimodal fitting was performed for the THz time-domain spectrum based on different numbers of sub-peaks. As shown in Figure 7a, when the number of sub-peaks was five, the fitting curve was basically consistent with the original curve, but not in detail. The peak GOF was 0.9997, the deviation of the peak position was 0.0020 ps, and the calculation error was 2.4%. The peak position accuracy of the multimodal fitting method was higher than that of the unimodal fitting method. In Figure 7b, when the number of sub-peaks was 10, the fitting curve coincided with the height of the original curve, and the peak GOF was 0.9999. The deviation of the peak position was 0.0003 ps, and the calculation error was 0.4%. Therefore, with the increase in the number of sub-peaks, the fitting peak increasingly overlapped with the characteristic peak, and the accuracy of fitting the peak position was continuously improved. However, as shown in Table 1, the linear GOF of the multimodal fitting method was 0.9661, which was the lowest among the three methods. This is because the multimodal fitting method unilaterally pursues high-peak GOF and ignores partial spectral information, resulting in a reduction in calibration accuracy. In addition, it is difficult to determine the number and position of the sub-peaks that constitute the characteristic peaks, leading to a low success rate of multimodal fitting. Therefore, the multimodal fitting method is greatly affected by human factors, and the fitting results are less stable.
Spectral analysis using a Psd-Voigt function or multimodal fitting always obtains a relatively optimal GOF. However, the unilateral pursuit of such a fitting process is to achieve a GOF that is as high as possible by adjusting the number or weight ratio of sub-peaks, which has no physical meaning. Due to the lack of a unified standard for mutual comparison, it is difficult to reflect the small wavenumber changes caused by stress in the fitting results, which makes the multimodal fitting method insensitive and inaccurate for use in stress analysis.
The kernel of the barycenter method is to use the barycentric peak instead of the characteristic peak for data processing. In the experiment, environmental factors had a great impact on the THz time-domain spectral signals due to the long collection time (100 ps), which led to a low signal-to-noise ratio. In the barycenter method, the integral operation of the peak area for calculating the barycentric peak can accumulate and eliminate random noise, further identifying the position of the spectral position. In addition, the barycenter method is more suitable for the data processing of spectra with poor symmetry, because the area integral operation can avoid the interference of spectral asymmetry in data processing. As shown in Figure 5c and Table 1, the stress optical coefficient c1 obtained by the barycenter method was close to that of the multimodal fitting method, and the time delay shows a linear decrease with compressive stress, which verifies the feasibility of the barycenter method. In addition, the linear GOF of the barycenter method is the highest among the three methods, indicating that it is more suitable for processing the THz spectra.
Based on a reflection-type THz-TDS system and the barycenter method, the stress optical coefficient c1 of the TBC specimen is 0.3180 ± 0.0091/GPa. As shown in Figure 5c, the refractive index of the TBC specimen under different compressive loadings has an excellent linear relationship with the stress, which proves the accuracy of the stress optical coefficient. In addition, the calibrated stress optical coefficient in this work is numerically different from that detected by Schemmel et al. under tension loading (0.1362 ± 0.0155/GPa) [32], which is caused by the differences in preparation methods and stress states of the TBC specimens. The TC layer in a TBC is generally a porous and brittle ceramic material. Different stress states (tension or compression), preparation methods and production batches have great influence on the mechanical properties of the TC layer, including its stress optical coefficient. Compared to the results of Schemmel et al., the measured stress optical coefficient in this work was the that of the TBC specimen under compression loadings, instead of tension loadings. In addition, the raw materials and processing methods of the TBC specimen used in this work were different from those adopted by Schemmel et al. Thus, the stress optical coefficient was numerically different from that measured by Schemmel et al. In most cases, the stress state of the TBC top coating is compressive stress. Hence, for the internal stress analysis of the TBC top coating, it is necessary to measure the stress optical coefficient of the TBC top coating under compression.

5. Conclusions

In this work, the stress optical coefficient of the TBC specimen was calibrated for the stress analyses in the ceramic layer of TBC based on THz-TDS. The THz time-domain spectra of TBC specimens under different uniaxial compression loadings were obtained by using a reflection-type THz-TDS system and were processed by the unimodal fitting, multimodal fitting and barycenter methods, respectively. By comparing the results of these three methods, the barycenter method showed higher accuracy and stability than the other two methods. The stress optical coefficient c1 of the ceramic specimen obtained in this work, 0.3180 ± 0.0091/GPa, is quite different from those detected under tensile stress. This result lays a foundation for using THz-TDS to analyze the internal stress of the top coating of actual TBC structures.

Author Contributions

Conceptualization, W.Q.; methodology, Y.Z., N.L. and Z.W. (Zong Wang); formal analysis, Y.Z., N.L. and Z.W. (Zong Wang); investigation, Y.Z., N.L. and Z.W. (Zong Wang); resources, W.Q.; data curation, Y.Z., N.L. and Z.W. (Zong Wang); writing—original draft preparation, Z.W. (Zong Wang) and Y.Z.; writing—review and editing, Z.W. (Zhiyong Wang), W.Q., Y.Z. and Z.W. (Zong Wang); visualization, Z.W. (Zhiyong Wang), W.Q., Y.Z. and Z.W. (Zong Wang); supervision, Z.W. (Zhiyong Wang) and W.Q.; project administration, W.Q.; funding acquisition, W.Q. All authors have read and agreed to the published version of the manuscript.

Funding

This work was supported by the National Natural Science Foundation of China (Grant Nos.12021002, 11827802, and 11890680).

Institutional Review Board Statement

Not applicable.

Informed Consent Statement

Not applicable.

Data Availability Statement

The data are not publicly available due to that the data also forms part of an ongoing study.

Conflicts of Interest

The authors declare no conflict of interest.

References

  1. Wang, D.R.; Fan, X.L.; Sun, Y.L. The stresses and cracks in thermal barrier coating system: A review. Chin. J. Solid Mech. 2016, 37, 477–517. [Google Scholar] [CrossRef]
  2. Clarke, D.R.; Oechsner, M.; Padture, N.P. Thermal-barrier coatings for more efficient gas-turbine engines. MRS Bull. 2012, 37, 891–899. [Google Scholar] [CrossRef] [Green Version]
  3. Schulz, U.; Leyens, C.; Fritscher, K. Some recent trends in research and technology of advanced thermal barrier coatings. Aerosp. Sci. Technol. 2003, 7, 73–80. [Google Scholar] [CrossRef]
  4. Padture, N.P. Advanced structural ceramics in aerospace propulsion. Nat. Mater. 2016, 15, 804–809. [Google Scholar] [CrossRef] [PubMed]
  5. Eldridge, J.I.; Bencic, T.J.; Spuckler, C.M. Delamination-indicating thermal barrier coatings using YSZ: Eu sublayers. J. Am. Ceram. Soc. 2006, 89, 3246–3251. [Google Scholar] [CrossRef]
  6. Guo, H.B.; Kuroda, S.; Murakami, H. Microstructures and properties of plasma-sprayed segmented thermal barrier coatings. J. Am. Ceram. Soc. 2006, 89, 1432–1439. [Google Scholar] [CrossRef]
  7. Nychka, A.; Clarke, D.R. Damage quantification in TBCs by photo-stimulated luminescence spectroscopy. Surf. Coat. Technol. 2001, 146, 110–116. [Google Scholar] [CrossRef]
  8. Jiang, P.; Fan, X.L.; Sun, Y.L. Competition mechanism of interfacial cracks in thermal barrier coating system. Mater. Des. 2017, 132, 559–566. [Google Scholar] [CrossRef] [Green Version]
  9. Jiang, P.; Fan, X.L.; Sun, Y.L. Bending-driven failure mechanism and modelling of double-ceramic-layer thermal barrier coating system. Int. J. Solids Struct. 2017, 130, 11–20. [Google Scholar] [CrossRef]
  10. Miller, R.A. Oxidation-based model for thermal barrier coating life. J. Am. Ceram. Soc. 2010, 67, 517–521. [Google Scholar] [CrossRef]
  11. Widjaja, S.; Limarga, A.M.; Yip, T.H. Modeling of residual stresses in a plasma-sprayed zirconia/alumina functionally graded-thermal barrier coating. Thin Solid Film. 2003, 434, 216–227. [Google Scholar] [CrossRef]
  12. Kuroda, S.; Fukushima, T.; Kitahara, S. Generation mechanisms of residual stresses in plasma-sprayed coatings. Vacuum 1990, 41, 1297–1299. [Google Scholar] [CrossRef]
  13. Matejícek, J.; Sampath, S.; Dubsky, J. X-ray residual stress measurement in metallic and ceramic plasma sprayed coatings. J. Therm. Spray Technol. 1998, 7, 489–496. [Google Scholar] [CrossRef]
  14. Totemeier, T.C.; Wright, J.K. Residual stress determination in thermally sprayed coatings—A comparison of curvature models and X-ray techniques. Surf. Coat. Technol. 2006, 200, 3955–3962. [Google Scholar] [CrossRef]
  15. Wang, L.; Wang, Y.; Sun, X.G.; He, J.Q.; Pan, Z.Y.; Wang, C.H. Microstructure and indentation mechanical properties of plasma sprayed nano-bimodal and conventional ZrO2-8 wt.% Y2O3 thermal barrier coatings. Vacuum 2012, 86, 1174–1185. [Google Scholar] [CrossRef]
  16. Jordan, D.W.; Faber, K.T. X-ray residual stress analysis of a ceramic thermal barrier coating undergoing thermal cycling. Thin Solid Film. 1993, 235, 137–141. [Google Scholar] [CrossRef]
  17. Mao, W.G.; Chen, Q.; Dai, C.Y.; Yang, L.; Zhou, Y.C.; Lu, C. Effects of piezo-spectroscopic coefficients of 8 wt.% Y2O3 stabilized ZrO2 on residual stress measurement of thermal barrier coatings by Raman spectroscopy. Surf. Coat. Technol. 2010, 204, 3573–3577. [Google Scholar] [CrossRef] [Green Version]
  18. Loechelt, G.H.; Cave, N.G.; Menendez, J. Measuring the tensor nature of stress in silicon using polarized off-axis Raman spectroscopy. Appl. Phys. Lett. 1995, 66, 3639–3641. [Google Scholar] [CrossRef]
  19. Fu, D.H.; He, X.Y.; Ma, L.L.; Xing, H.D.; Meng, T.; Chang, Y.; Qiu, W. The 2-axis stress component decoupling of {100} c-Si by using oblique backscattering micro-Raman spectroscopy. Sci. China Phys. Mech. 2020, 63, 10460. [Google Scholar] [CrossRef]
  20. Zhao, Y.; Ma, C.L.; Huang, F.X.; Wang, C.J.; Zhao, S.M.; Cui, X.Q.; Li, F.F. Residual stress inspection by Eu3+ photoluminescence piezo-spectroscopy: An application in thermal barrier coatings. J. Appl. Phys. 2013, 114, 073502. [Google Scholar] [CrossRef]
  21. Zhao, S.M.; Ren, Z.M.; Zhao, Y.; Xu, J.Y.; Zou, B.L.; Hui, Y.; Zhu, L.; Zhou, X.; Cao, X.Q. The application of Eu3+ photoluminescence piezo-spectroscopy in the LaMgAl11O19/8YSZ:Eu double-ceramic-layer coating system. J. Eur. Ceram. Soc. 2015, 35, 249–257. [Google Scholar] [CrossRef]
  22. Jiang, P.; Fan, X.L.; Sun, Y.L.; Wang, H.T.; Su, L.C.; Wang, T.J. Thermal-cycle dependent residual stress within the crack-susceptible zone in thermal barrier coating system. J. Am. Ceram. Soc. 2018, 101, 4256–4261. [Google Scholar] [CrossRef]
  23. Fan, W.H.; Burnett, A.; Upadhya, P.C. Far-Infrared spectroscopic characterization of explosives for security applications using broadband terahertz time-domain spectroscopy. Appl. Spectrosc. 2007, 61, 638–643. [Google Scholar] [CrossRef]
  24. Kojima, S.; Tsumura, N.; Kitahara, H. Terahertz time domain spectroscopy of phonon-polaritons in ferroelectric lithium niobate crystals. Jpn. J. Appl. Phys. 2002, 41, 7033–7037. [Google Scholar] [CrossRef]
  25. Cogdill, R.P.; Forcht, R.N.; Shen, Y. Comparison of terahertz pulse imaging and near-infrared spectroscopy for rapid, non-destructive analysis of tablet coating thickness and uniformity. Pharm. Innov. 2007, 2, 29–36. [Google Scholar] [CrossRef] [Green Version]
  26. Zhang, X.N.; Chen, J.; Zhou, Z.K. THz time-domain spectroscopy technology. Laser Optoelectron. Prog. 2005, 42, 35–38. (In Chinese) [Google Scholar]
  27. Zhong, S.C. Progress in terahertz nondestructive testing: A review. Front. Mech. Eng. 2019, 14, 273–281. [Google Scholar] [CrossRef]
  28. Song, W.; Li, L.A.; Wang, Z.Y. Experimental verification of the uniaxial stress-optic law in the terahertz frequency regime. Opt. Lasers Eng. 2007, 52, 174–177. [Google Scholar] [CrossRef]
  29. Shuai, S.; Zhang, G.; Shi, W. Optically pumped gas terahertz fiber laser based on gold-coated quartz hollow-core fiber. Appl. Opt. 2019, 58, 2828–2831. [Google Scholar] [CrossRef]
  30. Chen, C.C.; Lee, D.J.; Pollock, T. Pulsed-terahertz reflectometry for health monitoring of ceramic thermal barrier coatings. Opt. Express 2010, 18, 3477–3486. [Google Scholar] [CrossRef]
  31. Watanabe, M.; Kuroda, S.; Yamawaki, H. Terahertz dielectric properties of plasma-sprayed thermal-barrier coatings. Surf. Coat. Technol. 2011, 205, 4620–4626. [Google Scholar] [CrossRef]
  32. Schemmel, P.; Diederich, G.; Moore, A.J. Direct stress optic coefficients for YTZP ceramic and PTFE at GHz frequencies. Opt. Express 2016, 24, 8110–8119. [Google Scholar] [CrossRef] [PubMed]
  33. Schemmel, P.; Diederich, G.; Moore, A.J. Measurement of direct strain optic coefficient of YSZ thermal barrier coatings at GHz frequencies. Opt. Express 2017, 24, 19968–19980. [Google Scholar] [CrossRef] [PubMed]
  34. Fukuchi, T.; Fuse, N.; Okada, M. Measurement of refractive index and thickness of topcoat of thermal barrier coating by reflection measurement of terahertz waves. Electr. Commun. Jpn. 2013, 96, 37–45. [Google Scholar] [CrossRef]
Figure 1. Diagram of the experimental installation for the measurement of the stress optical coefficient.
Coatings 11 01265 g001
Figure 2. Diagram of the reflective terahertz time-domain spectroscopy.
Coatings 11 01265 g002
Figure 3. Schematic diagram of the reflective terahertz propagation path inside a specimen.
Coatings 11 01265 g003
Figure 4. Schematic diagram of the barycenter method. (a) the selected THz time-domain spectrum; (b) the position of the barycentric peak.
Coatings 11 01265 g004
Figure 5. The relation between the refractive index and stress under using different processing methods: (a) unimodal fitting method; (b) multimodal fitting method; (c) barycenter method.
Coatings 11 01265 g005
Figure 6. Result of unimodal fitting for terahertz time-domain spectroscopy.
Coatings 11 01265 g006
Figure 7. Result of multimodal fitting for terahertz time-domain spectroscopy with the comparison with original curve: (a) the number of sub-peaks is 5; (b) the number of sub-peaks is 10.
Coatings 11 01265 g007
Table 1. Processing results for measurement experiments.
MethodStress Optical Coefficient c1 (GPa)Linear Goodness of Fit
Unimodal fitting method0.2844 ± 0.01320.9728
Multimodal fitting method0.3131 ± 0.01660.9648
Barycenter method0.3180 ± 0.00910.9894
Publisher’s Note: MDPI stays neutral with regard to jurisdictional claims in published maps and institutional affiliations.

