Article

Pollution Flashover Characteristics of Coated Insulators under Different Profiles of Coating Damage

by
Ali Ahmed Salem
1,*,
Kwan Yiew Lau
1,*,
Wan Rahiman
2,*,
Samir A. Al-Gailani
2,*,
Zulkurnain Abdul-Malek
1,
Rahisham Abd Rahman
3,
Salem Mgammal Al-Ameri
3 and
Usman Ullah Sheikh
1
1
Institute of High Voltage and High Current, School of Electrical Engineering, Universiti Teknologi Malaysia, Johor Bahru 81310, Malaysia
2
School of Electrical and Electronic Engineering, Universiti Sains Malaysia, Nibong Tebal 14300, Malaysia
3
Faculty of Electrical and Electronic Engineering, University Tun Hussein Onn Malaysia, Batu Pahat 86400, Malaysia
*
Authors to whom correspondence should be addressed.
Coatings 2021, 11(10), 1194; https://doi.org/10.3390/coatings11101194
Submission received: 12 August 2021 / Revised: 13 September 2021 / Accepted: 14 September 2021 / Published: 30 September 2021
(This article belongs to the Special Issue Surface Modification and Surface Flashover Performance Enhancement)

Abstract

:
Based on experiments and numerical analysis techniques, this paper aims to investigate the influence of the four different coating damage profiles on the performance of coated 33 kV porcelain insulator strings under polluted and clean surface conditions. The performance of the insulators coated with room temperature vulcanizing (RTV) under partial coating damage and undamaged coating was evaluated. The influence of humidity on pollution flashover was taken into consideration. The ring-shaped, fan-shaped, and random-shaped coating was applied following coating damage. The results showed that the flashover characteristic of the RTV-coated insulators had a significant difference as compared to the normal insulators. Electrical characteristics such as the flashover voltage, critical current, and surface resistance were significantly affected by coating damage distribution and humidity level on the insulators’ surface. The electric field and potential difference were analyzed as well using the finite element method (FEM). The initiation of the arc was observed to appear at the area of insulators where the electric field was the highest. It was also observed that different coating distributions of pollution and humidity levels resulted in a change in the surface pollution layer resistance and an uneven distribution of the electric field. This indicates that the coated insulators’ parameters are directly related to the coating damage distribution on the insulator surface, particularly in the presence of humidity.

Graphical Abstract

1. Introduction

Porcelain insulators have been employed in transmission lines’ insulation for more than a century. To date, it has been widely recognized that porcelain insulators suffer from contamination flashover under severe contamination. As a result, room temperature vulcanizing (RTV) coatings have been applied on porcelain insulators as an enhanced approach to avoid flashover on polluted insulator surfaces [1,2,3,4,5]. Figure 1 illustrates the application of RTV-coated porcelain insulators on a transmission line to enhance insulation performance and resist pollution flashover. Although RTV coating can enhance insulation performance of the porcelain insulators, the surrounding factors of the porcelain insulators can result in the damage of RTV coatings [6,7,8,9,10] hence reducing the insulators’ resistance, thereby causing a flashover [11,12,13,14].
According to [9], porcelain insulators coated with RTV commonly retain high hydrophobicity and high anti-contamination flashover ability, indicating that they can work for a long period of time in a climate similar to a subtropical climate. Authors in [10] provided the experimental findings of using two distinct silicone coatings (RTV and high temperature vulcanizing (HTV)) on silicon rubber insulator. Both coatings exhibited considerable symptoms of hydrophobicity loss and oxidation of the surface. During the outside investigation, however, both coatings retained low leakage currents and outstanding performance. In addition, the anti-contamination flashover effect of field-aged RTV coatings was investigated in extremely polluted locations [12]. The outcomes of the research revealed that RTV coatings offered long-term resistance against contamination flashover, even in extremely polluted environments.
RTV coating characteristics have been examined in a variety of studies [1,2,3,4,5,6,7,8,9,10,11,12,13,14,15]. However, research data on RTV coating distribution effect on insulators have been scarcely reported. The insulator’s friction and environmental variables like rain, sun, and wind can cause RTV coating on certain portion of insulators to damage. The damage may consequently result in a change in the insulator distribution coating. With increased usage of RTV-coated insulators, it is critical to investigate the effect of RTV coating distribution across insulator surfaces with pollution flashover properties.
In this paper, the experimental investigation and numerical analysis have been carried out to evaluate the effect of RTV coating damage profiles on the flashover performance of a 33 kV contaminated insulator string. For this propose, the profile of the RTV coating damage was formed into four damage types, with the undamaged insulator serving as a reference. A series of laboratory tests was conducted on the cap-and-pin type of porcelain insulator string samples under AC voltage. Four criteria were employed to measure the coating distribution effect on the pollution flashover performance of the insulator: flashover voltage, leakage current, coating dimension, and pollution layer resistance. In defining these criteria, various degrees of pollution and humidity values were taken into consideration. In addition, the finite element method (FEM) was used to evaluate the electrical characteristics of the coated insulators compared to the uncoated insulator.

2. Room Temperature Vulcanizing (RTV) Coating Characteristics

RTV coating has high hydrophobicity and hydrophobicity transfer, which may significantly enhance the resistance of porcelain insulators against flashover. RTV is a vulcanization process through atmospheric humidity. In this process, small alcohol-based molecules are eliminated and a cross-linking reaction happened. The chemical formula for the vulcanization process is depicted in Figure 2 [16].
The free surface energy of an insulator surface determines its hydrophobicity. The static contact angle between the surface and the water droplet is frequently used to determine the free surface energy. A surface is hydrophilic if the contact angle is less than 90° and hydrophobic if the angle is more than 90° [17]. The Sweden Transmission Research Institute (STRI) categorized the hydrophobicity of insulators into seven categories from HC1 to HC7, with HC1 being the most hydrophobic and HC7 being the least hydrophobic. The fundamental equation for measuring the solid surface tension using contact angle can be described using the Young’s equation [17,18].
γ s v γ s l = γ l v cos θ c
where γsv, γsl, γlv are the interfacial tensions between the surface and air, surface and liquid and liquid and air respectively, while θc indicates the angle at which the liquid makes contact with the insulator surface (Figure 3).

3. Laboratory Work

3.1. Test Samples

The experimental investigation was conducted in a high-voltage laboratory to examine the pollutant flashover characteristics of porcelain insulators under AC voltage. The flashover performance of insulators with and without RTV coating was investigated using porcelain insulators type XP-70. With these insulators, four coating profiles were applied, defined as profile 1, profile 2, profile 3, and profile 4, respectively, as demonstrated in Figure 4. Table 1 and Figure 2 illustrates the technical characteristics of the insulators, as well as the coating profiles simulation on the samples, where H, D, and L represent the height, diameter, and leakage distance of the specimen, respectively.

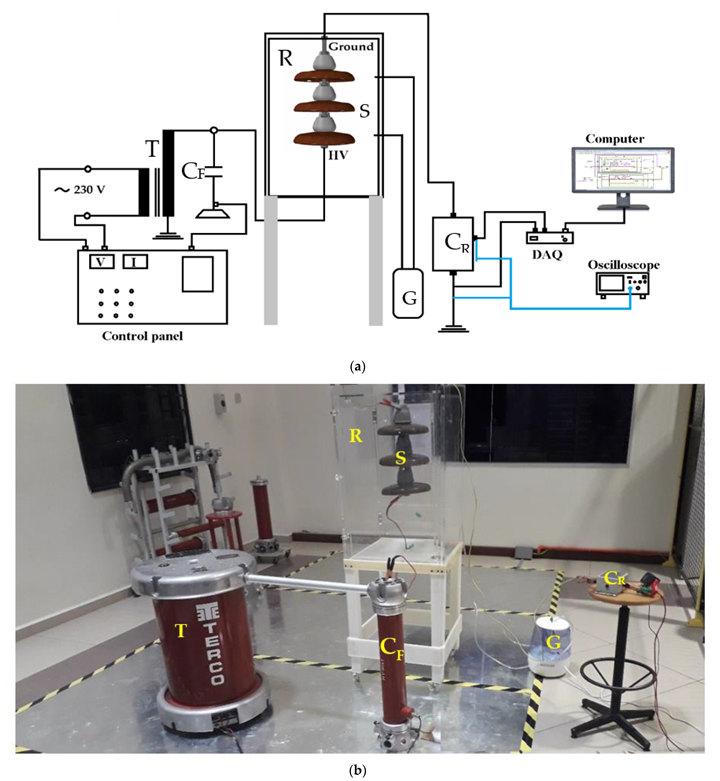
3.2. Experimental Setup

The pollution flashover tests were carried out in an artificial climate chamber with polycarbonate sheet walls, having dimensions of: height 125 cm, length 50 cm, and width 50 cm. The test samples were powered by the 0.230/100-kV, 5-kVA, 50-Hz single-phase transformer. This power supply satisfies the requirement for pollution tests. A 2-stage AC voltage test setup in a cascaded fashion was used to deliver the needed supply voltage in clean and dry tests or tests that requires voltage greater than 100 kV. The circuit of the flashover test and test pictorial view is illustrated in Figure 5. In the Figure 5, “S” represents the insulator specimen, “T” is a 0.230 kV/100 kV AC transformer, “CF” is a capacitive divider (10,000:1), “CR” is a resistive divider, “G” is a fog generator, and “R” represents the test chamber.

3.3. Sample Preparation

The test was carried out on the RTV coated porcelain insulators according to IEC 60507 [19]. NaCl was used to represent soluble salts in pollutants with equivalent salt deposit density (SDD), whereas kaolin was used to represent insoluble compounds with non-soluble deposit density (NSDD).
The steps of preparing the sample to test are:
Step 1.   The insulators were first cleaned with an alcohol solution and were left to dry naturally for 24 h.
Step 2.   RTV coating was applied to the insulator in accordance with the required configuration. The area of coating damage to the entire coated insulator surface (r) was set at 10%, 20%, and 30% for each configuration to simulate different damage levels. Table 2 lists the details of RTV coating characteristics.
Step 3.   Pollutants were applied on the insulator surface using the solid layer technique [20,21,22,23,24], with SDD levels set at 0.05, 0.1, 0.15, and 0.2 mg/cm2, and NSDD set to be six times SDD for all experiments.
Finally.   After polluting the samples, they were allowed to dry naturally for about a day before being hanged vertically in the test chamber as shown in Figure 5.
Experimental tests were conducted in the ambient humidity for the dry fog condition respectively. A fog-maker machine was used to generate the required humidity for the wet condition. It was realized that the ambient humidity at the test location was 66% at the time of the test. The climate chamber was equipped with a humidity sensor that measures the internal temperature and humidity of the chamber. The fog rate created by a fog generator was maintained at a constant of 2.5 L/h throughout the experiments, while relative humidity and temperature were changed. The humidity was adjusted at three different levels: 75%, 85%, and 95%. The temperature ranged from 30 to 35 °C, and the air pressure was 93.5 kPa.
The equivalent salt deposit density (SDD) is determined by [25]:
S D D = ( 5.7 × ( σ 20 ) 1.03 × V ) / S
where σ20 is conductivity of layer pollution at 20 °C, S is the area of polluted surface, and V is the solution volume in cm3. The r that is mentioned above is expressed as:
r = S d / S t
where Sd is the coating damage area and St is the whole area of coated surface of insulator.

3.4. Test Procedure

During the test, the flashover voltage gradient was controlled based on the up-and-down technique. The step voltage was adjusted to be approximately 6% of the predicted flashover voltage UF (representing 50% withstand voltage U50). The flashover test was performed on each specified condition and repeated three times at 5-min intervals to avoid the impact of the current flashover on the succeeding measurement. The following equations were used to determine the average flashover voltage (kV) and its relative standard deviation error σ (%) of three experiments for each condition [23]:
U F = ( U i n i ) N
σ % = ( i = 1 N ( U i U F ) 2 ) / ( N 1 ) U F × 100
E F = U F L
where Ui is the applied voltage, ni is the test number which were carried out at the applied voltage Ui, N is the total test number, EF is the flashover voltage gradient, and L is the total leakage distance of the insulator.

4. Experimental Results

4.1. Flashover Test Result of Clean Insulator under RTV Coating

A clean insulator string was evaluated in this study under various damage coating profiles and operating voltages of 33 kV. The flashover voltage gradient of the clean insulator under the proposed damage coating profiles is shown in Figure 6. It is clear from the figure that the flashover voltage gradient EF appeared to be at its highest value for insulators with a full coating at 1.54 kV/cm (undamaged insulator). On the other hand, the lowest EF value at 1.15 kV/cm was obtained for the uncoated insulator. This indicates that the RTV coating has an impact on insulator performance improvement, where the EF was enhanced by 34% in the coated insulator string compared to the uncoated one. Coating damage also has a detrimental impact on the performance of the coated insulator string. The drop in EF caused by coating damage variation mainly depends on the profile of the coating damage and its location on the insulator surface. The coating damage profile 3 (fan profile) is a serious profile, followed by profile 4, profile 2, and profile 1, respectively, as shown in Figure 6.

4.2. Flashover Test Result of Polluted Insulator under RTV Coating

To investigate the RTV coating performance on high voltage insulators, the pollution flashover voltage gradient of insulators with and without coating was examined. The experimental test of pollution flashover voltage gradient EF for both cases, with and without coating, is shown in Figure 7. When comparing Figure 7a,b, it is clear that the RTV coating has a significant effect on the EF of a contaminated insulator string. It can be seen from Figure 7 that the EF value of the coated insulator string rises by 72.4% as compared to the uncoated one under pollution of 0.05 mg/cm2. For SDD of 0.1 mg/cm2, 0.15 mg/cm2, and 0.2 mg/cm2, and by applying the RTV coating, the EF increases by 69.5%, 68.9%, and 65.2%, respectively. This means that when SDD increases, this will simultaneously increase the EF percentage under the RTV coating effect. This demonstrates that the effect of the RTV coating has enhanced insulator performance in the presence of severe accumulated pollution. Figure 7 also shows the relationship between EF and pollution severity SSD for coated and uncoated insulator strings. The results in Figure 7 indicates that that the EF value and SDD have a negative correlation, and the fitting model is expressed as,
E F = a × S D D b
where a is a constant determined by factors such as the insulator’s shape, air pressure, and materials while b is the insulator’s characteristic contamination index. The details of the fitting model were inserted within Figure 7.

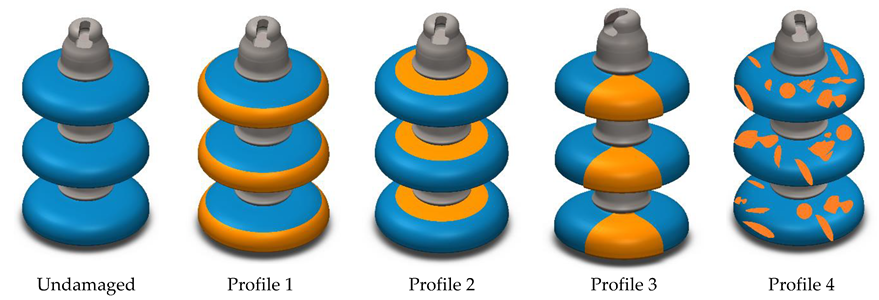
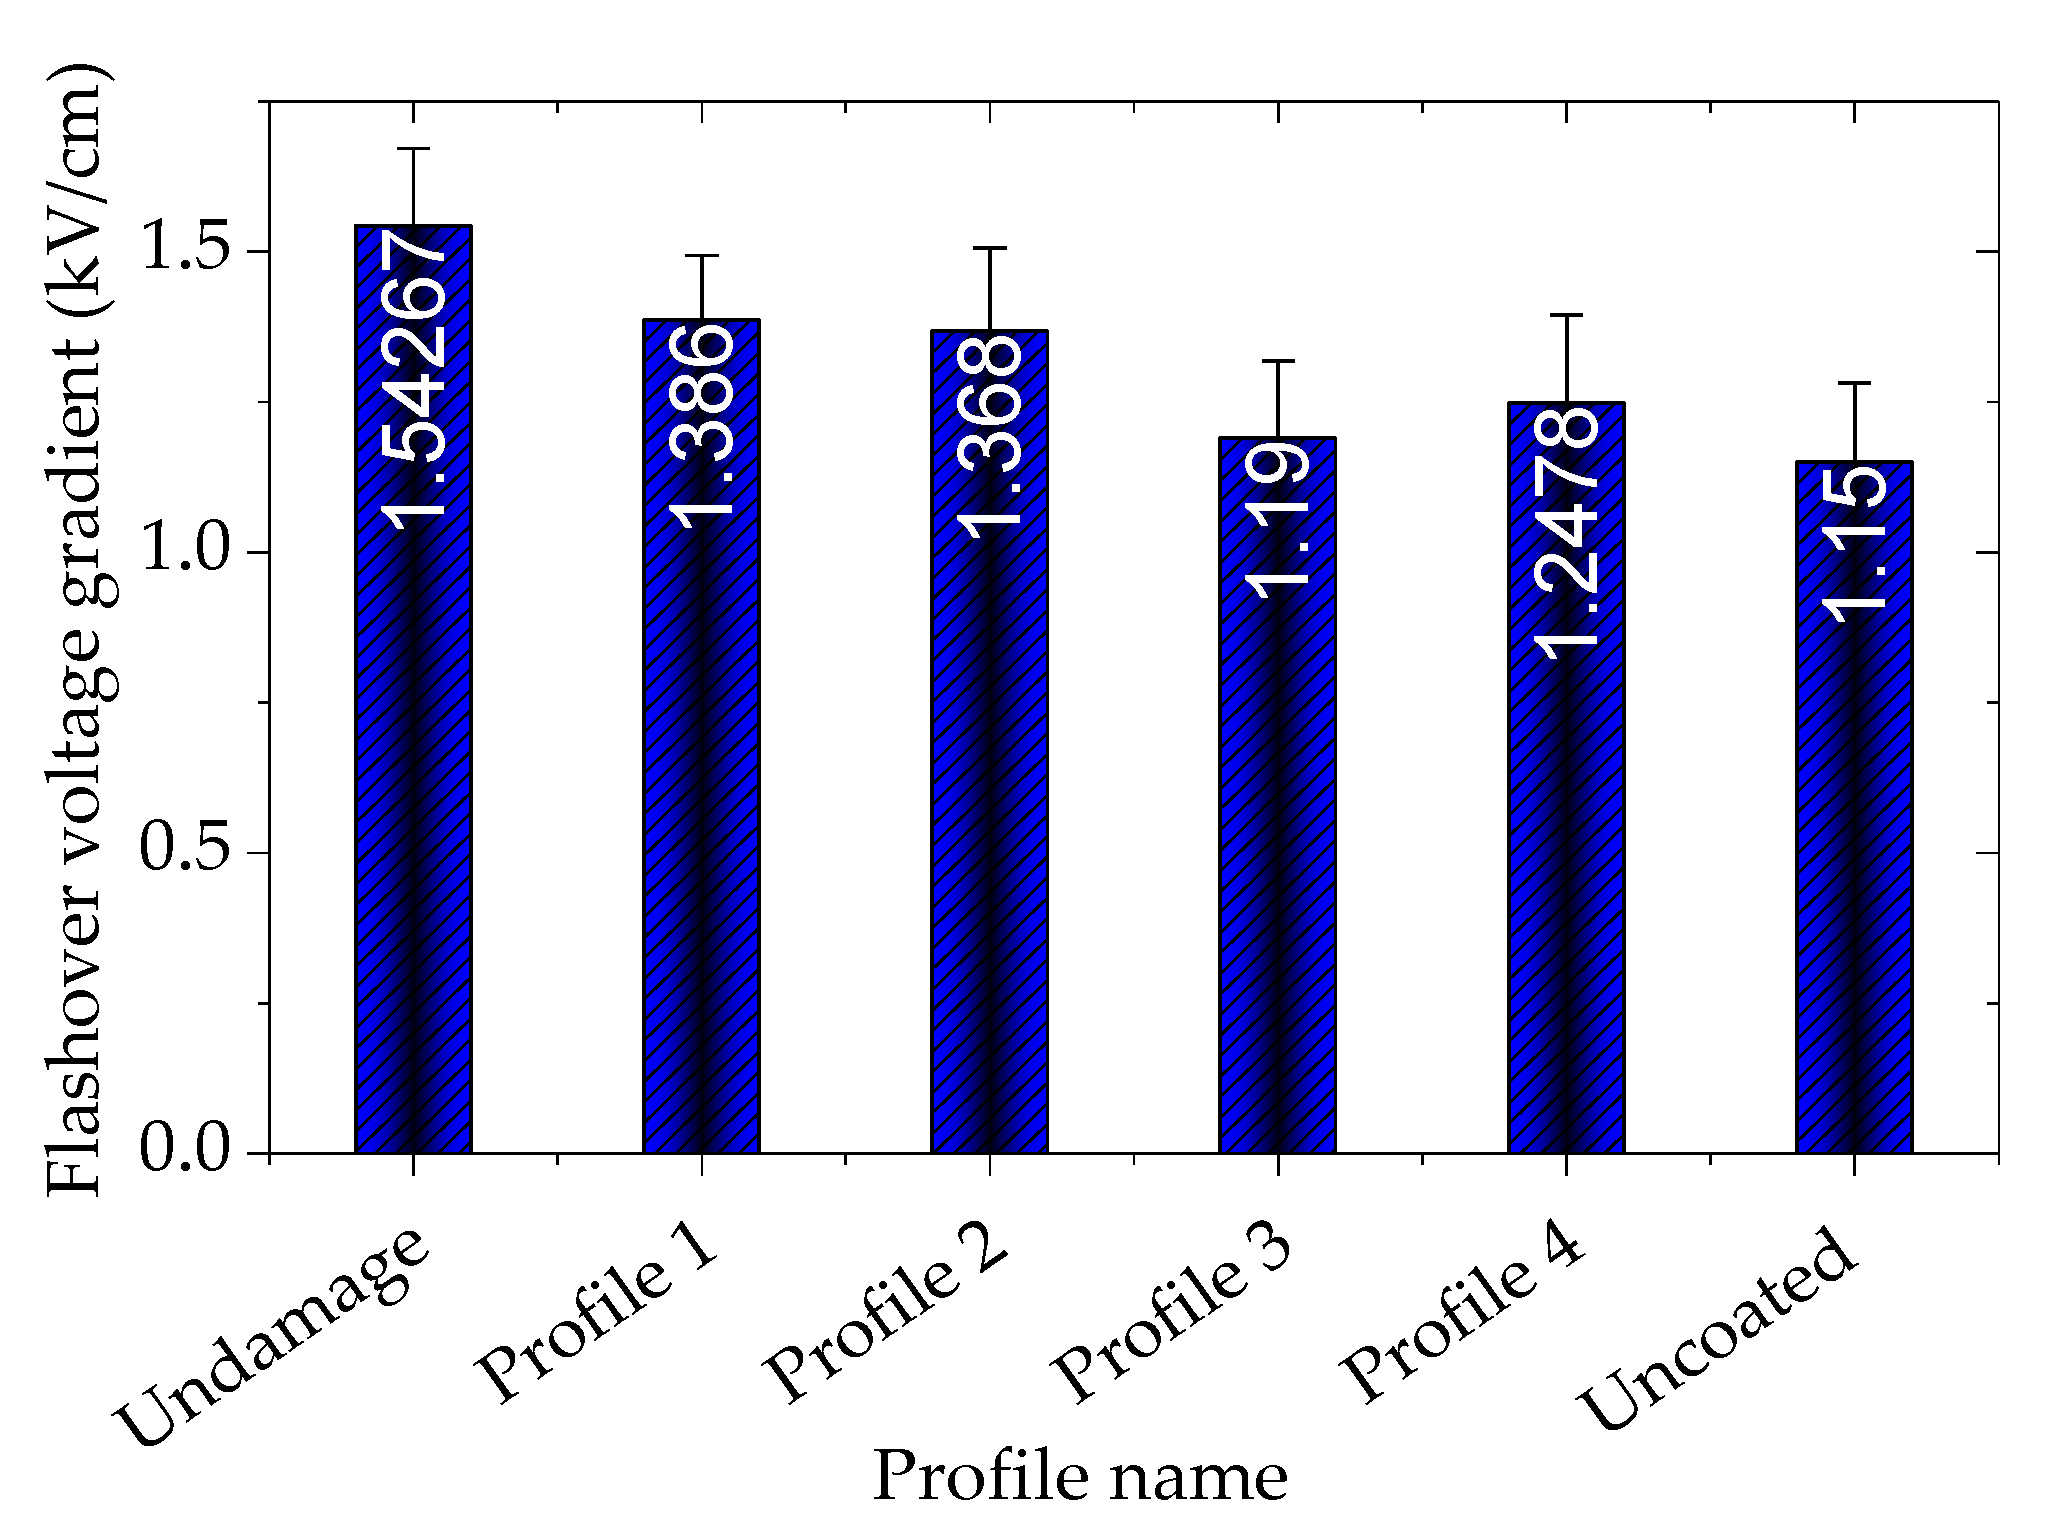
4.3. Flashover Test Result under Different RTV Damage Profiles

The procedure described above was used to test the contamination flashover characteristics of insulators with various RTV coating damage profiles, and the results are shown in Table 3. Based on the experimental results, the following observations are made:
  • The highest relative standard deviation (σ) among all test results is 4.7%. The flashover voltage gradient has a low dispersion rate, indicating that the approach used in the testing is satisfactory.
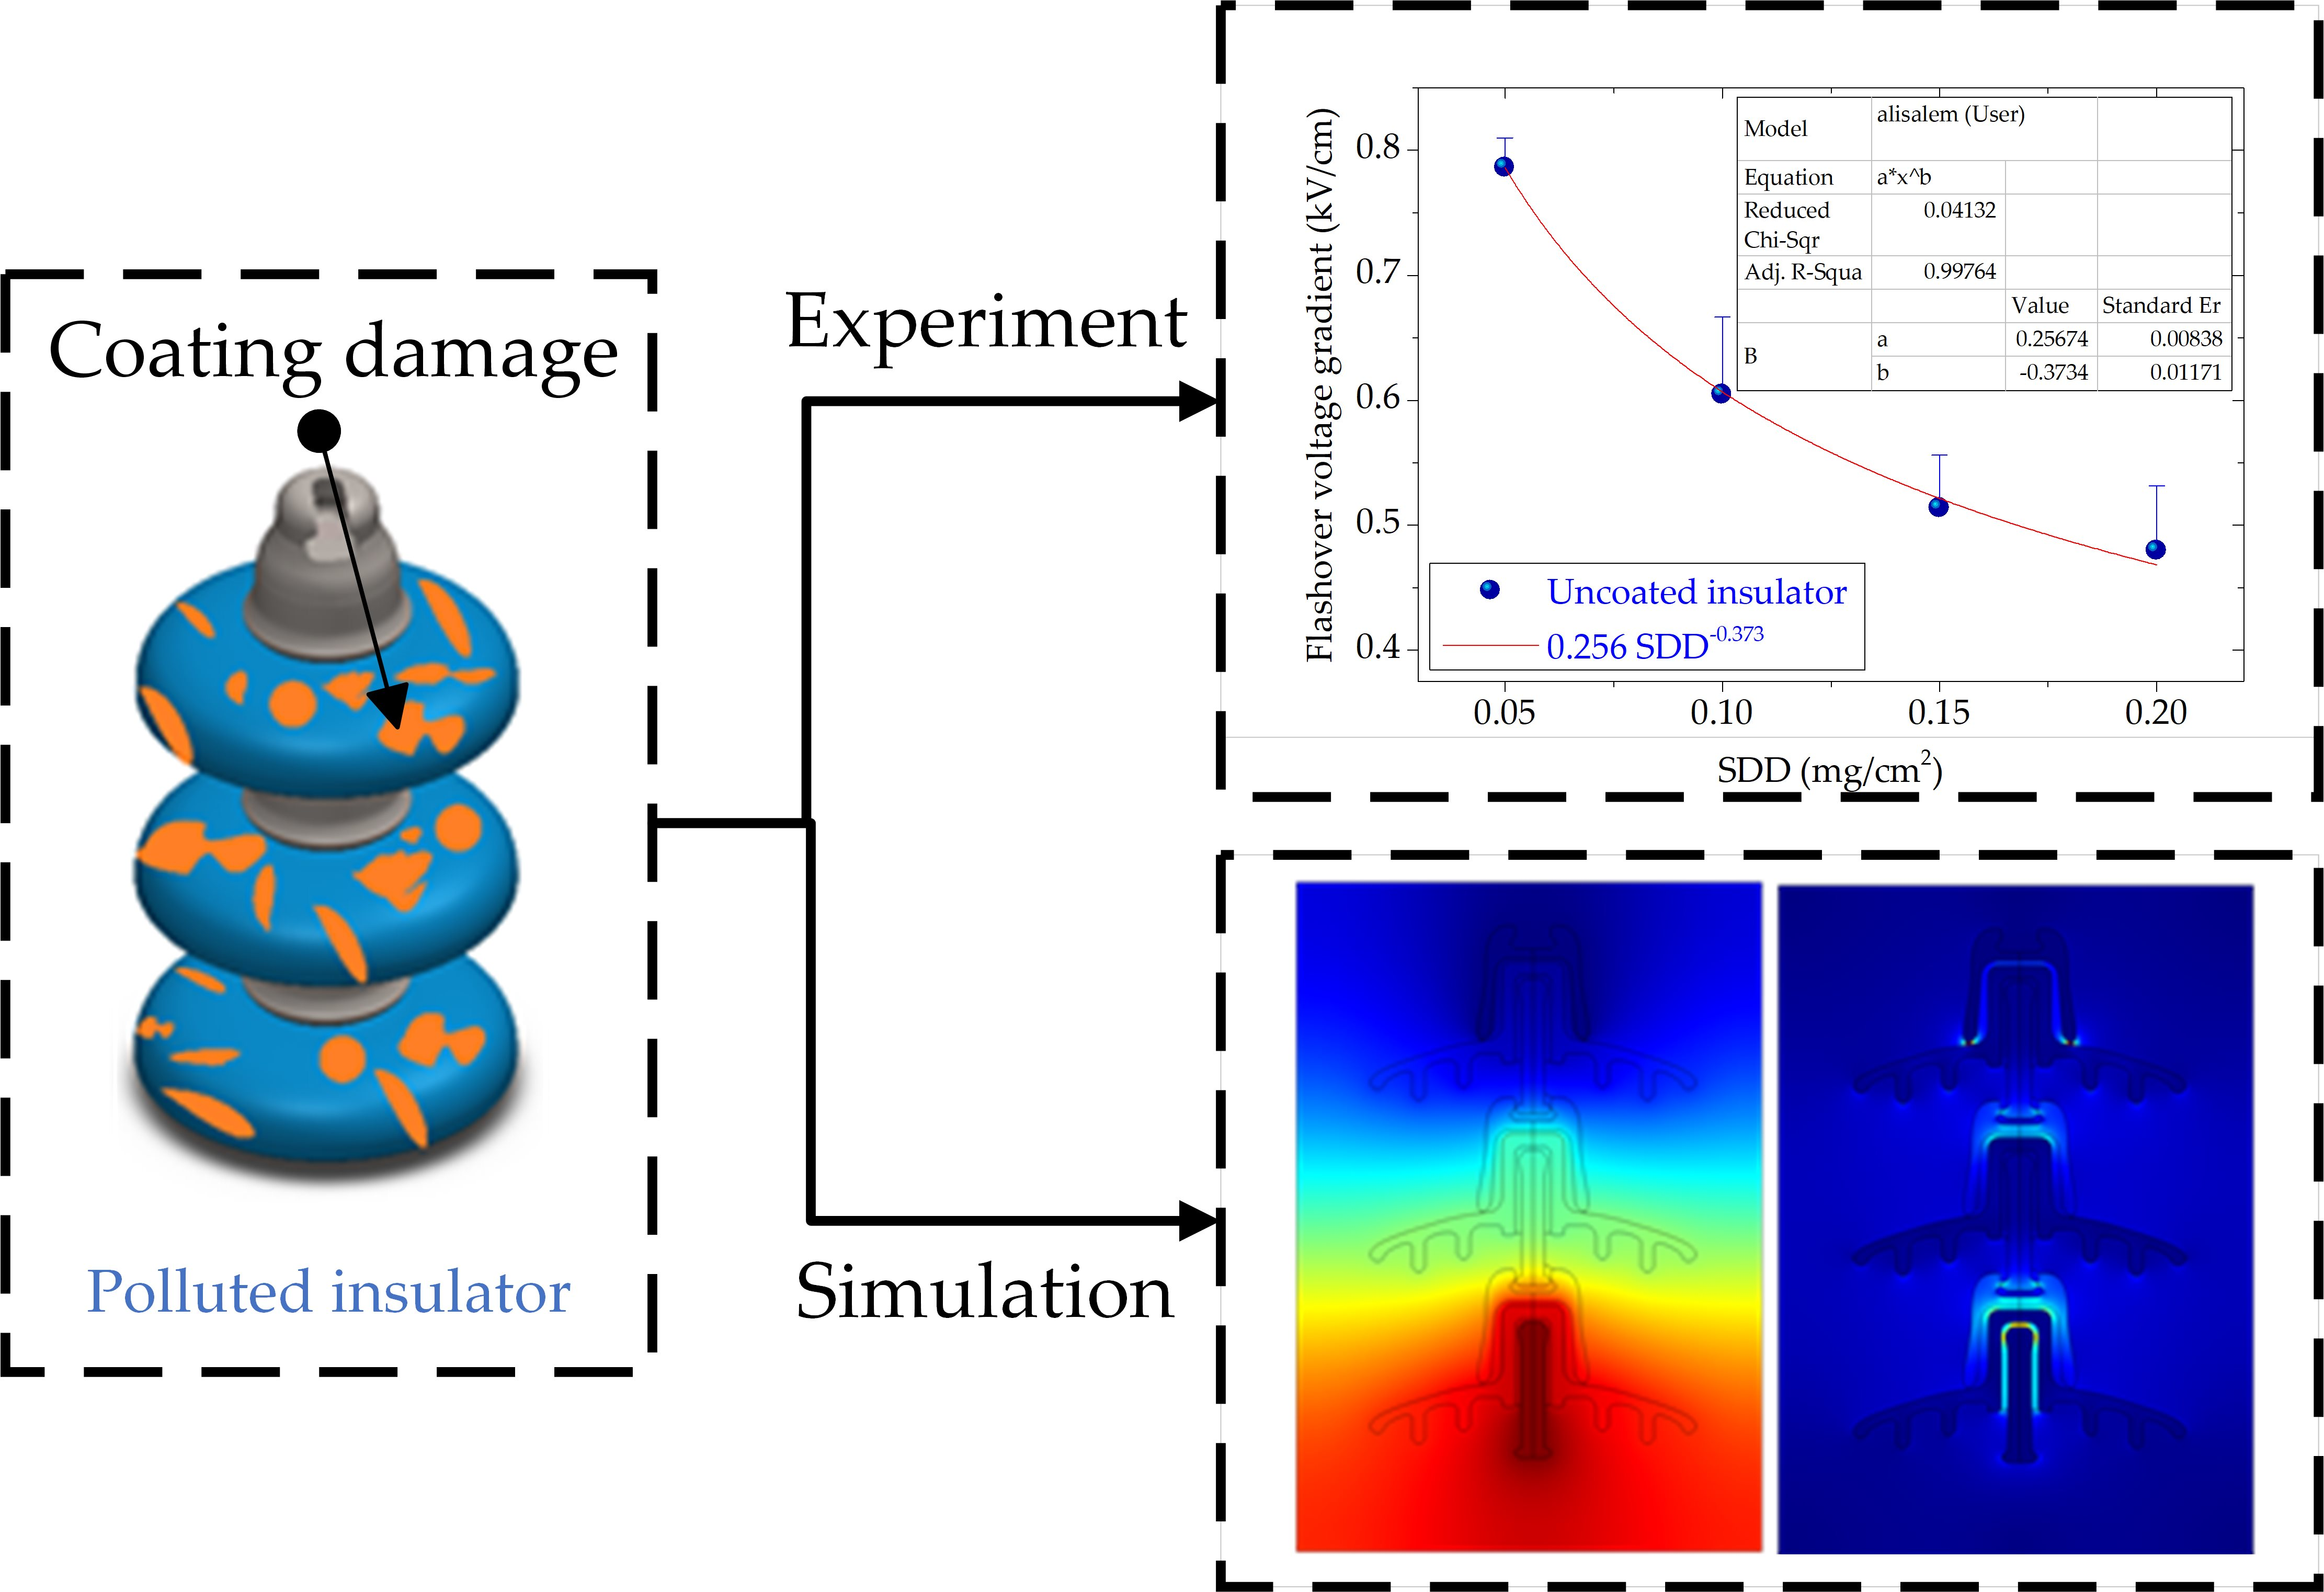
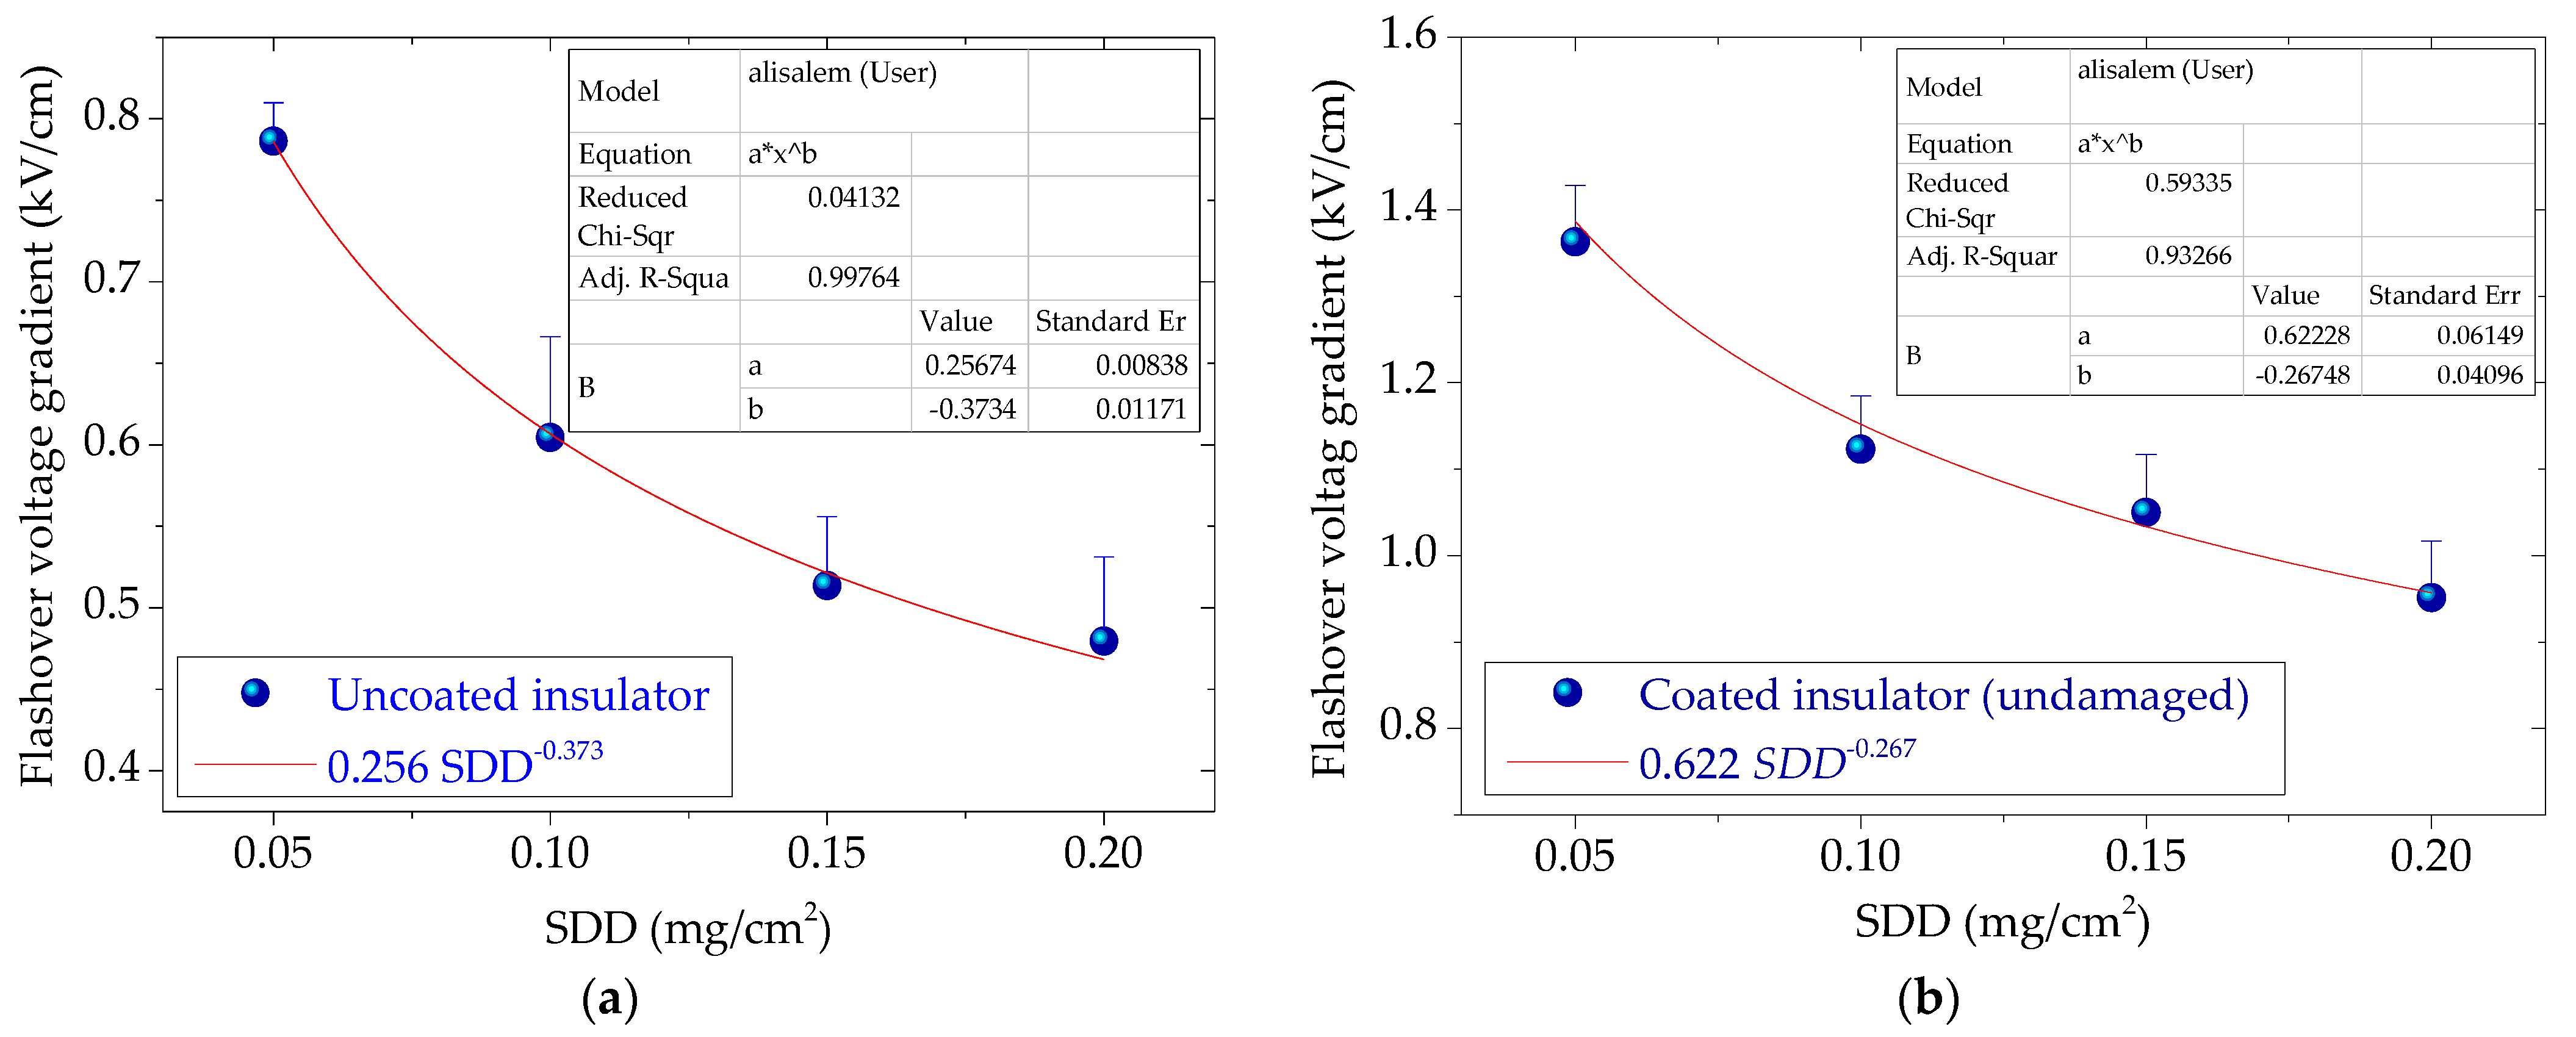
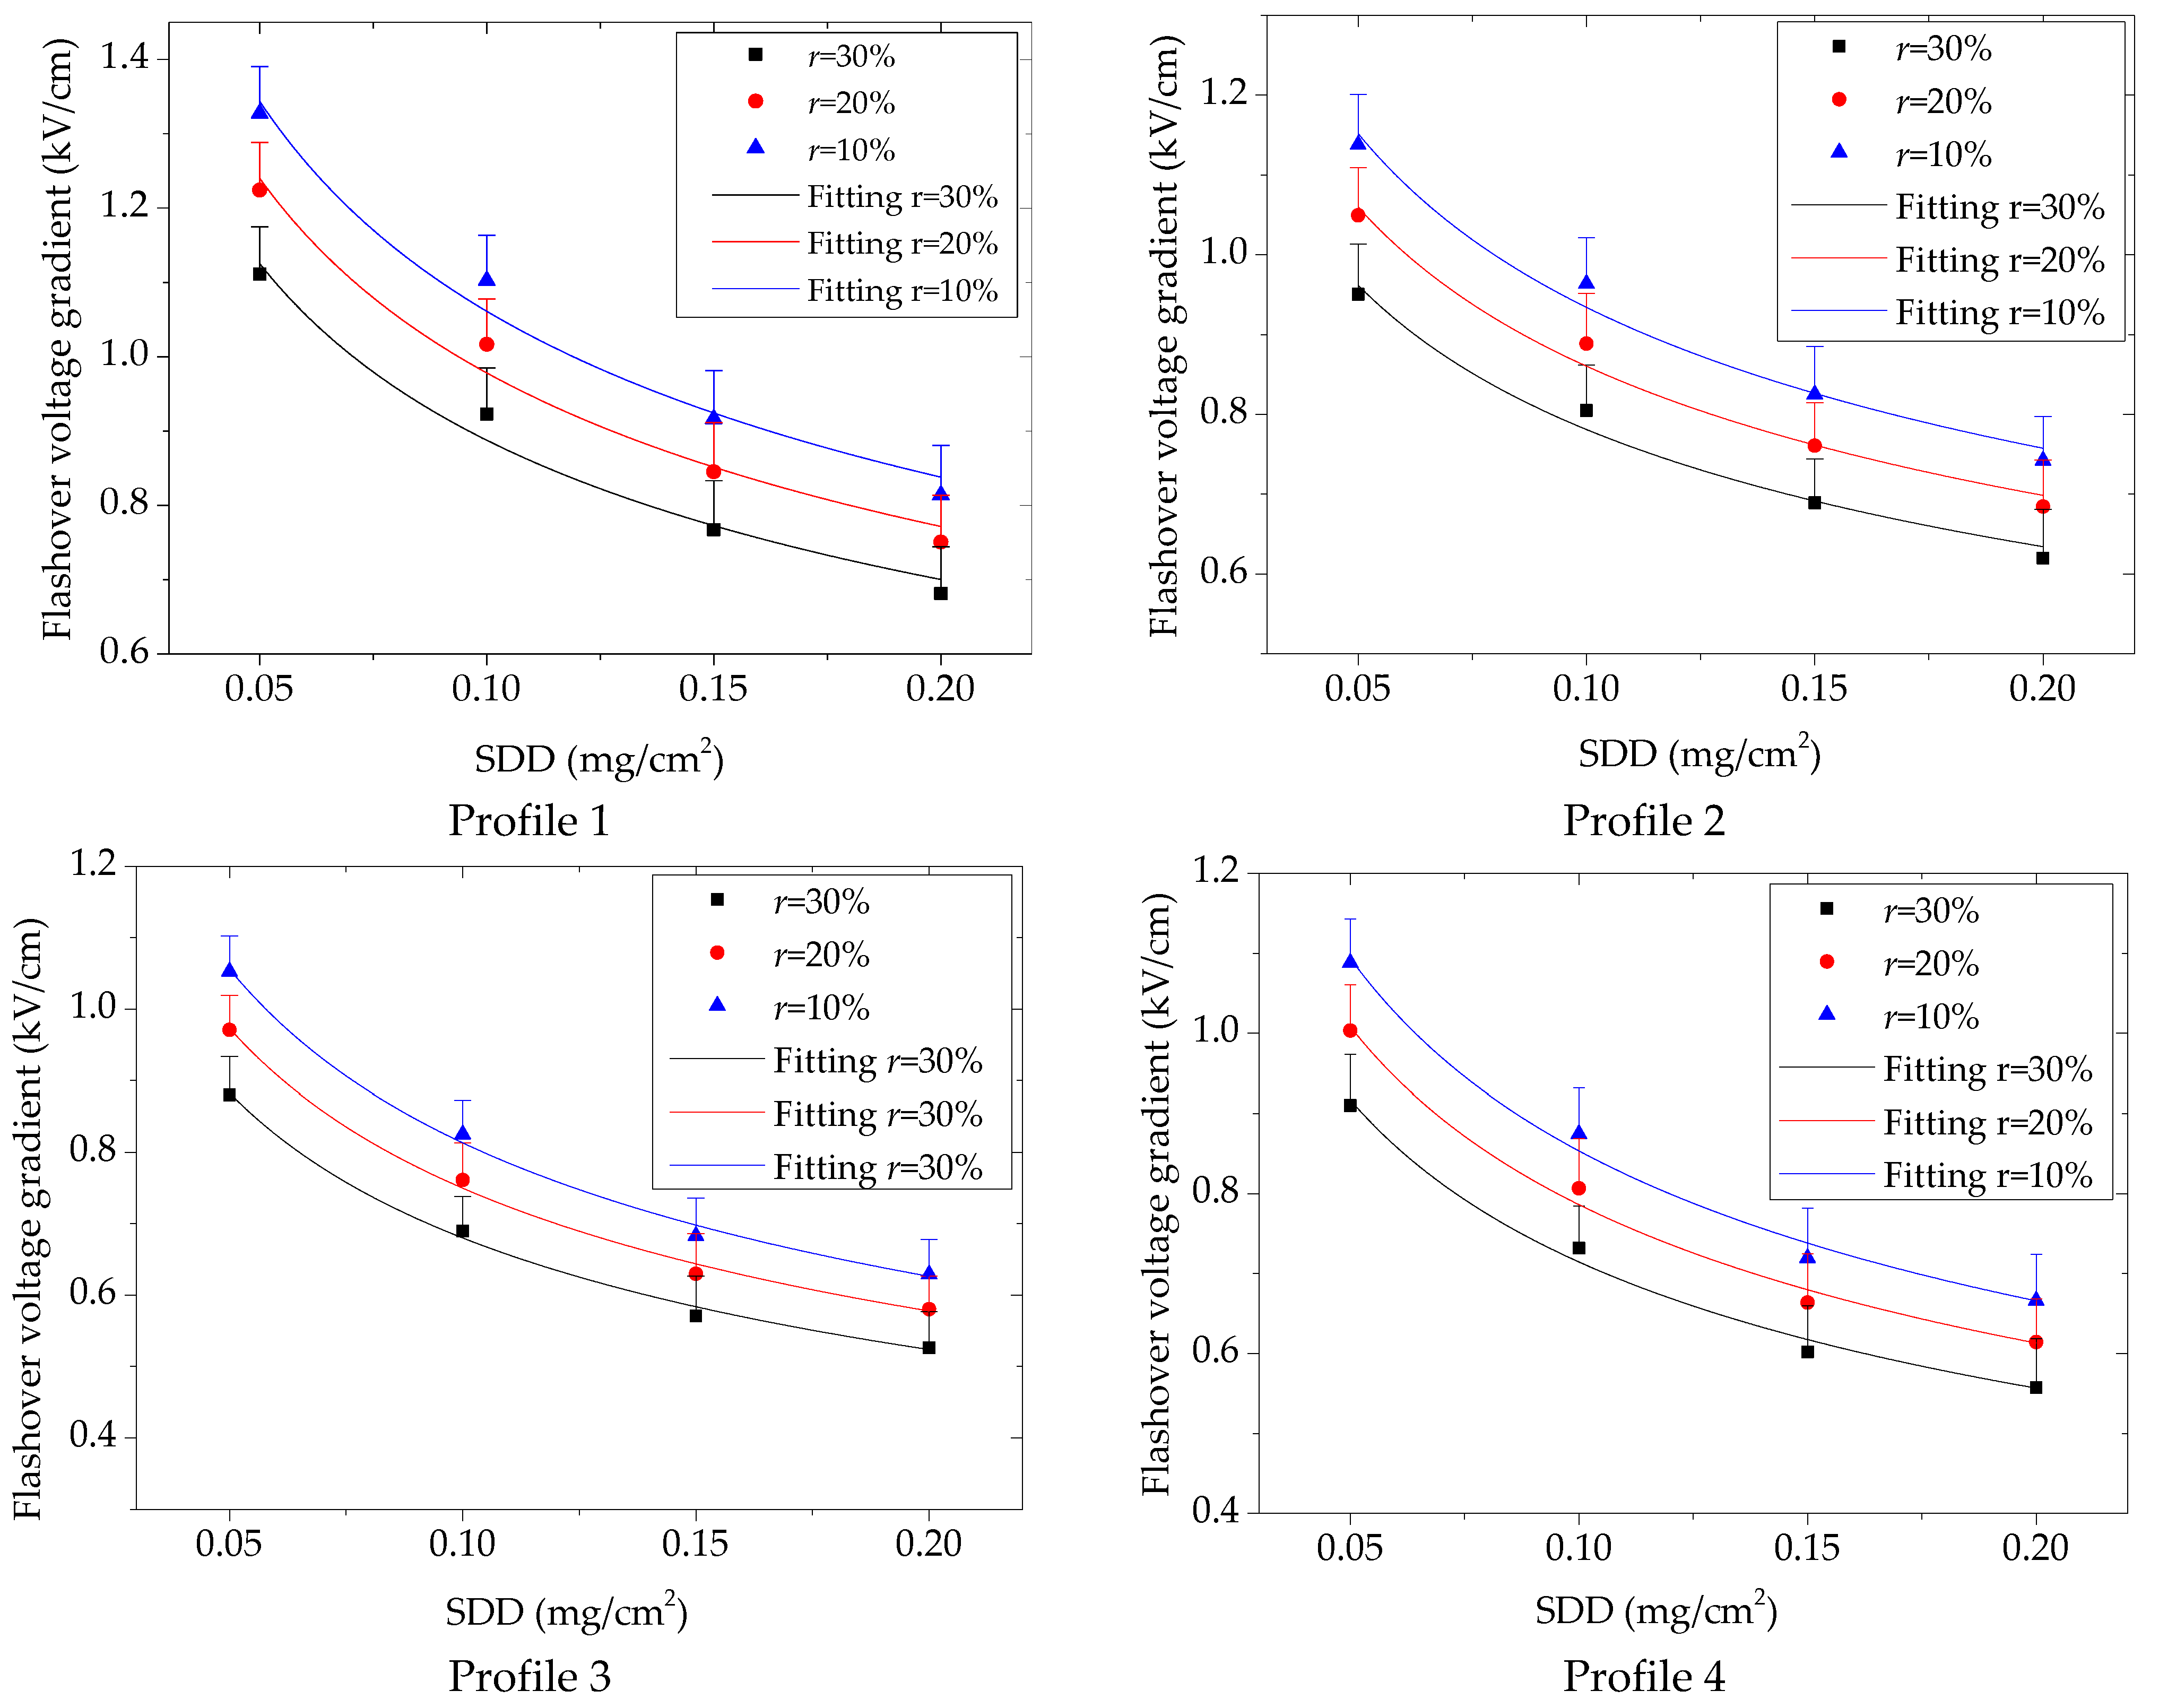
  • Under the same r and damage profile, the AC flashover voltage gradient EF of a porcelain insulator string subsides sharply as SDD rises.
For instance, when SDD increases from 0.05 to 0.1, 0.15, and 0.2 mg/cm2, the flashover voltage gradient of coated insulator under 10% damage coating profile 1 changes from 1.11 kV/cm to 0.923 kV/cm, 0.767 kV/cm, and 0.681 kV/cm, respectively. The flashover voltage of 0.10 mg/cm2, 0.15 mg/cm2, and 0.2 mg/cm2 reduces by 16.9%, 30.9%, and 38.7%, respectively, when compared to the flashover voltage of 0.05 mg/cm2.
3.
The flashover voltage gradient of coated insulators is related to the rate of area damage on the insulator surface r. The rate of damaged area r has a dramatic influence on the flash-over voltage gradient. With an increase in r, the EF gradually decreases. For example, when the coating damage profile is profile 1 and the SDD is 0.15 mg/cm2, the EF reduces from 0.916 kV/cm to 0.845 kV/cm, to 0.767 kV/cm as r increases from 10% to 20%, and subsequently to 30%. The outcomes demonstrate that there is a reduction of 7.7% and 16.3% on the EF when the r increases from 10% to 20% and from 10% to 30%, respectively. The type of coating damage profile of the porcelain insulator string also affects the flashover voltage gradient EF. There is a significant change in the flashover voltage gradient when the coating damage profile changes. For example, when r is 20%, SDD is 0.1 mg/cm2, and the coating damage profile is 1, 2, 3, and 4, the EF is 1.017 kV/cm, 0.889 kV/cm, 0.761 kV/cm, 0.807 kV/cm correspondingly, which indicates that the EF of profile 2, profile 3 and profile 4 changes by 12.5%, 25.2%, and 20.6%, respectively if compared to the flashover voltage gradient of profile 1.
The pollution flashover voltage gradient under certain SDD can be calculated using the aforementioned Equation (6) with the fitted values of a and b. Figure 8 depicts the fitting curves of various coating damage profiles.
The fitting results of SDD and EF obtained with the test results are shown in Table 3. According to value of constant “a” in Equation (6), the pollution properties indicator “b” and the correlation coefficient R2 of four various kinds of coating damage profiles on the porcelain insulator string with varying values of r were determined and are presented in Table 4.
The following results are summarized from Figure 8 and Table 3:
  • The correlation R2 values for all fitting lines are greater than 0.95, indicating that the EF and SDD for coated insulators under various levels of pollution match the power function efficiently. The value of “a” is affected not only by the air pressure and insulator material but also by the ratio of coating damage area r and coating damage profile. For illustration, when r is 20% and the profile of coating damage is profile 1, profile 2, profile 3, and profile 4, the corresponding values of a are 0.444, 0.431, 0.344, and 0.315, indicating that the value of a changes by 2.93%, 29.1% and 22.5% as the profile of coating damage changes from profile 1 to profile 2, profile 3, and profile 4, respectively.
  • The difference in the coating damage profile of coated insulator and r have no significant effects on the pollution characteristic index n.

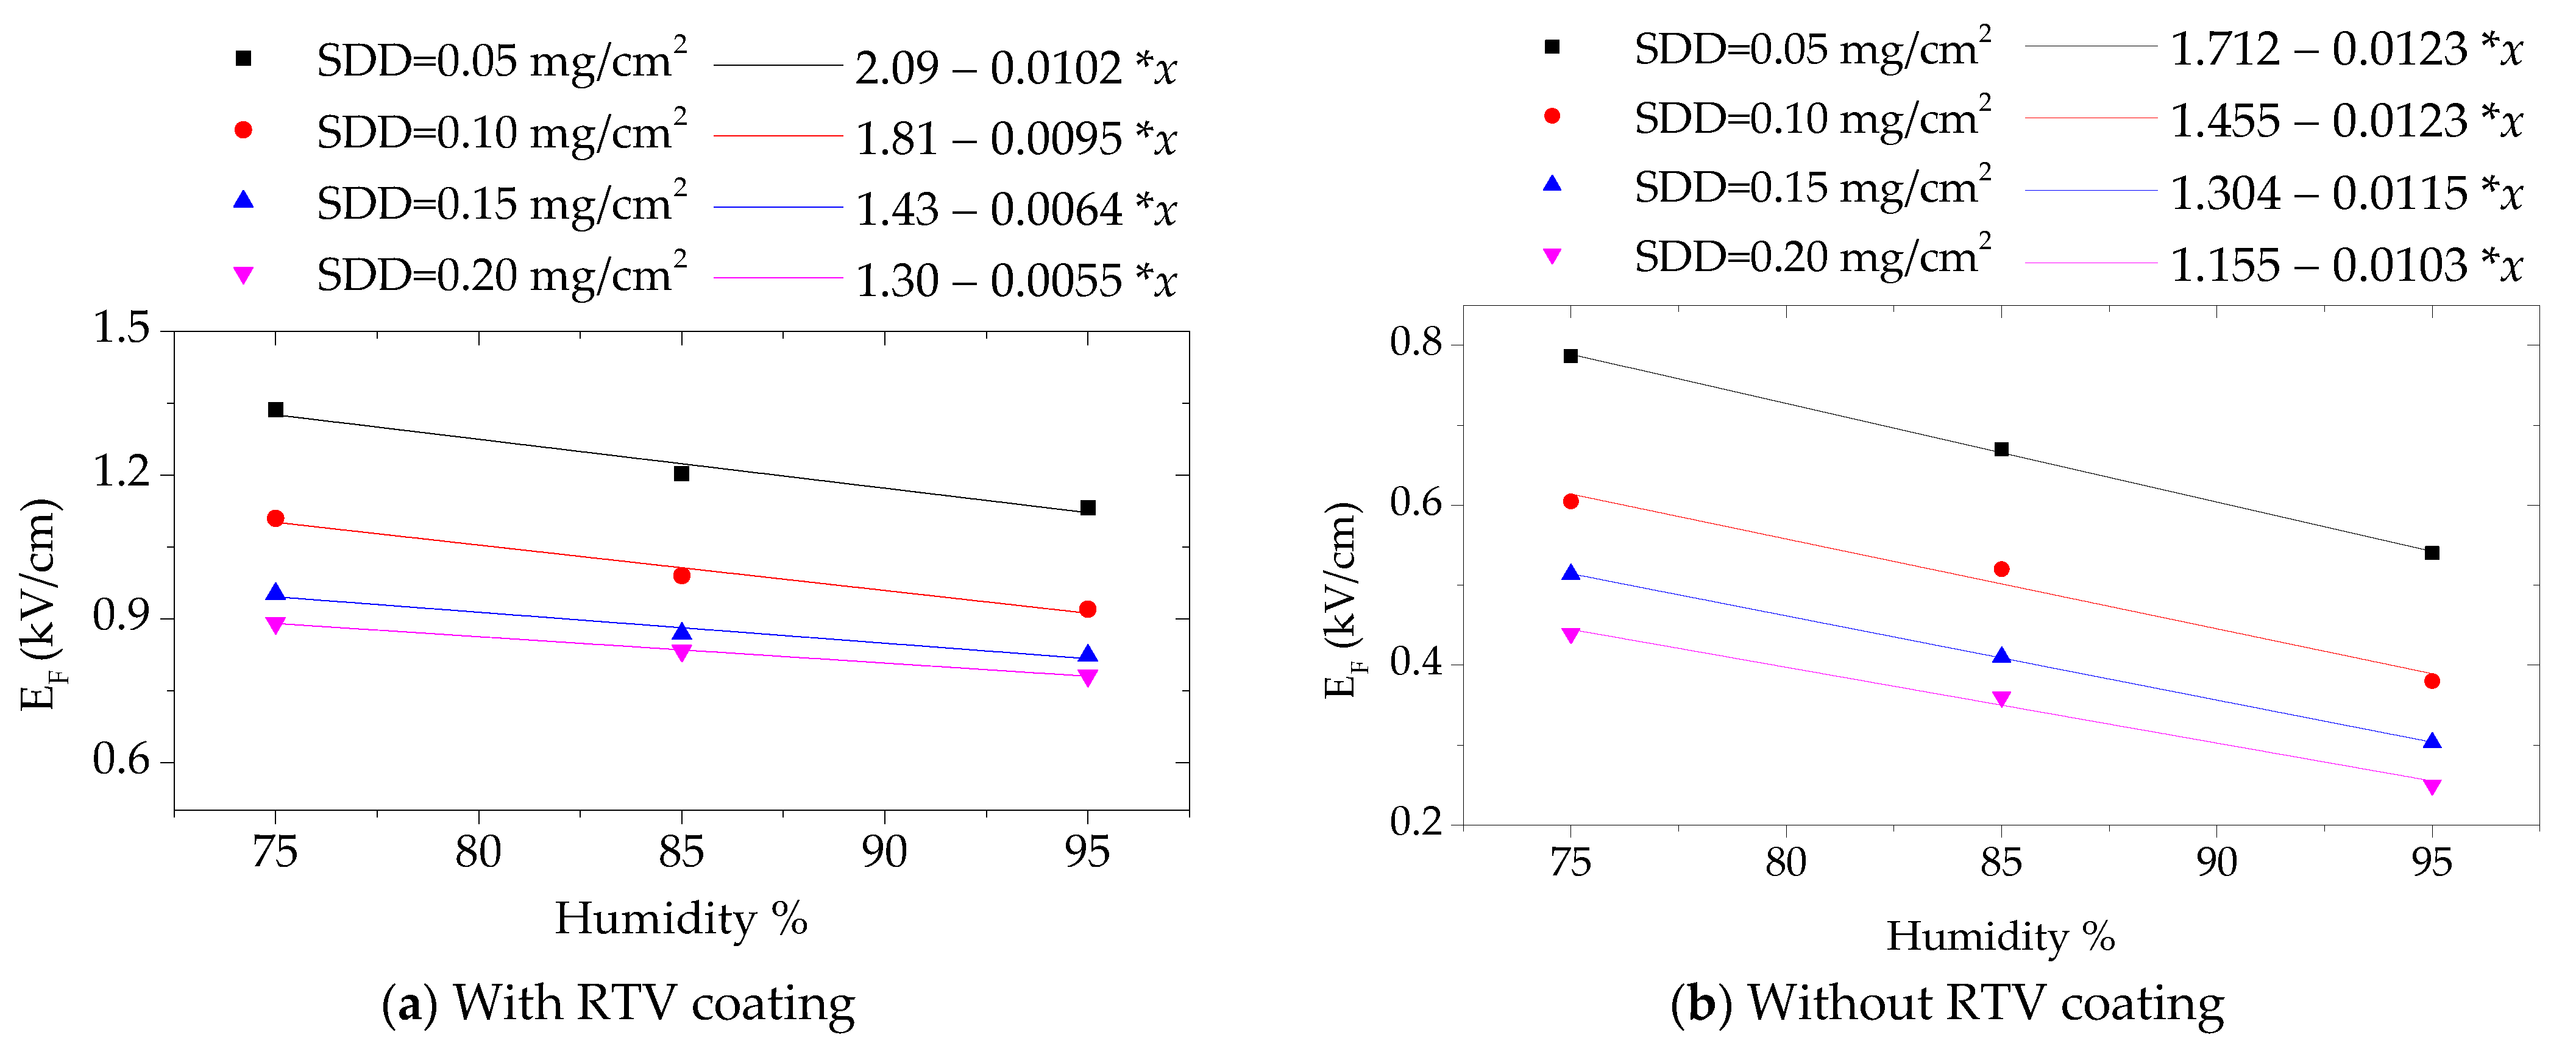
4.4. Flashover Test Result of Coated Insulators under Different Humidity Levels

Humidity varies according to geographic region, seasonality, and climate conditions. Outdoor insulators must be able to withstand these changes for power transmission systems to operate reliably. Coating is regarded as one of the solutions to overcome excess humidity. In this section, the coating enhancement of flashover voltage gradient EF performance of polluted insulators under various humidity conditions has been investigated. Accordingly, three humidity levels have been chosen to examine this effect: 75% (low), 85% (moderate), and 95% (high). Figure 9 depicts the relationship between the flashover voltage gradient EF and humidity of coated and uncoated insulators at various values of SDD. In general, the findings revealed that increased in humidity has a negative influence on the flashover voltage gradient, diminishing its value. In comparison to the coated insulator string, the humidity effect on EF of porcelain insulators without coating is substantial, as seen in Figure 9. According to Figure 9, under SDD equal to 0.1 mg/cm2, the EF of the coated insulators decreases by 9.9% and 15.2% when the humidity increases from 75% to 85% and from 75% to 95%, respectively, and the slope of the fitting line is 0.0095. In the case of insulators without the coating, EF decreased by 14.7% and 31.3%, respectively, and the fitting line slope was 0.0123 at the identical test circumstances. This indicates that the RTV coating leads to the insulator’s surface being more hydrophobic (HC3 or less), which results in an increase in surface resistance with an increase of the surface resistance, the EF will be increased [26].

5. Numerical Modeling

To further understand the variations in the aforementioned flashover gradient process, it is important to look at the electric potential and electric field distribution on the insulator surfaces under various RTV coating damage profiles. It is worth noting that a two-dimensional axisymmetric model was used to simulate the damage profiles. The development of the FEM model is shown as follows.

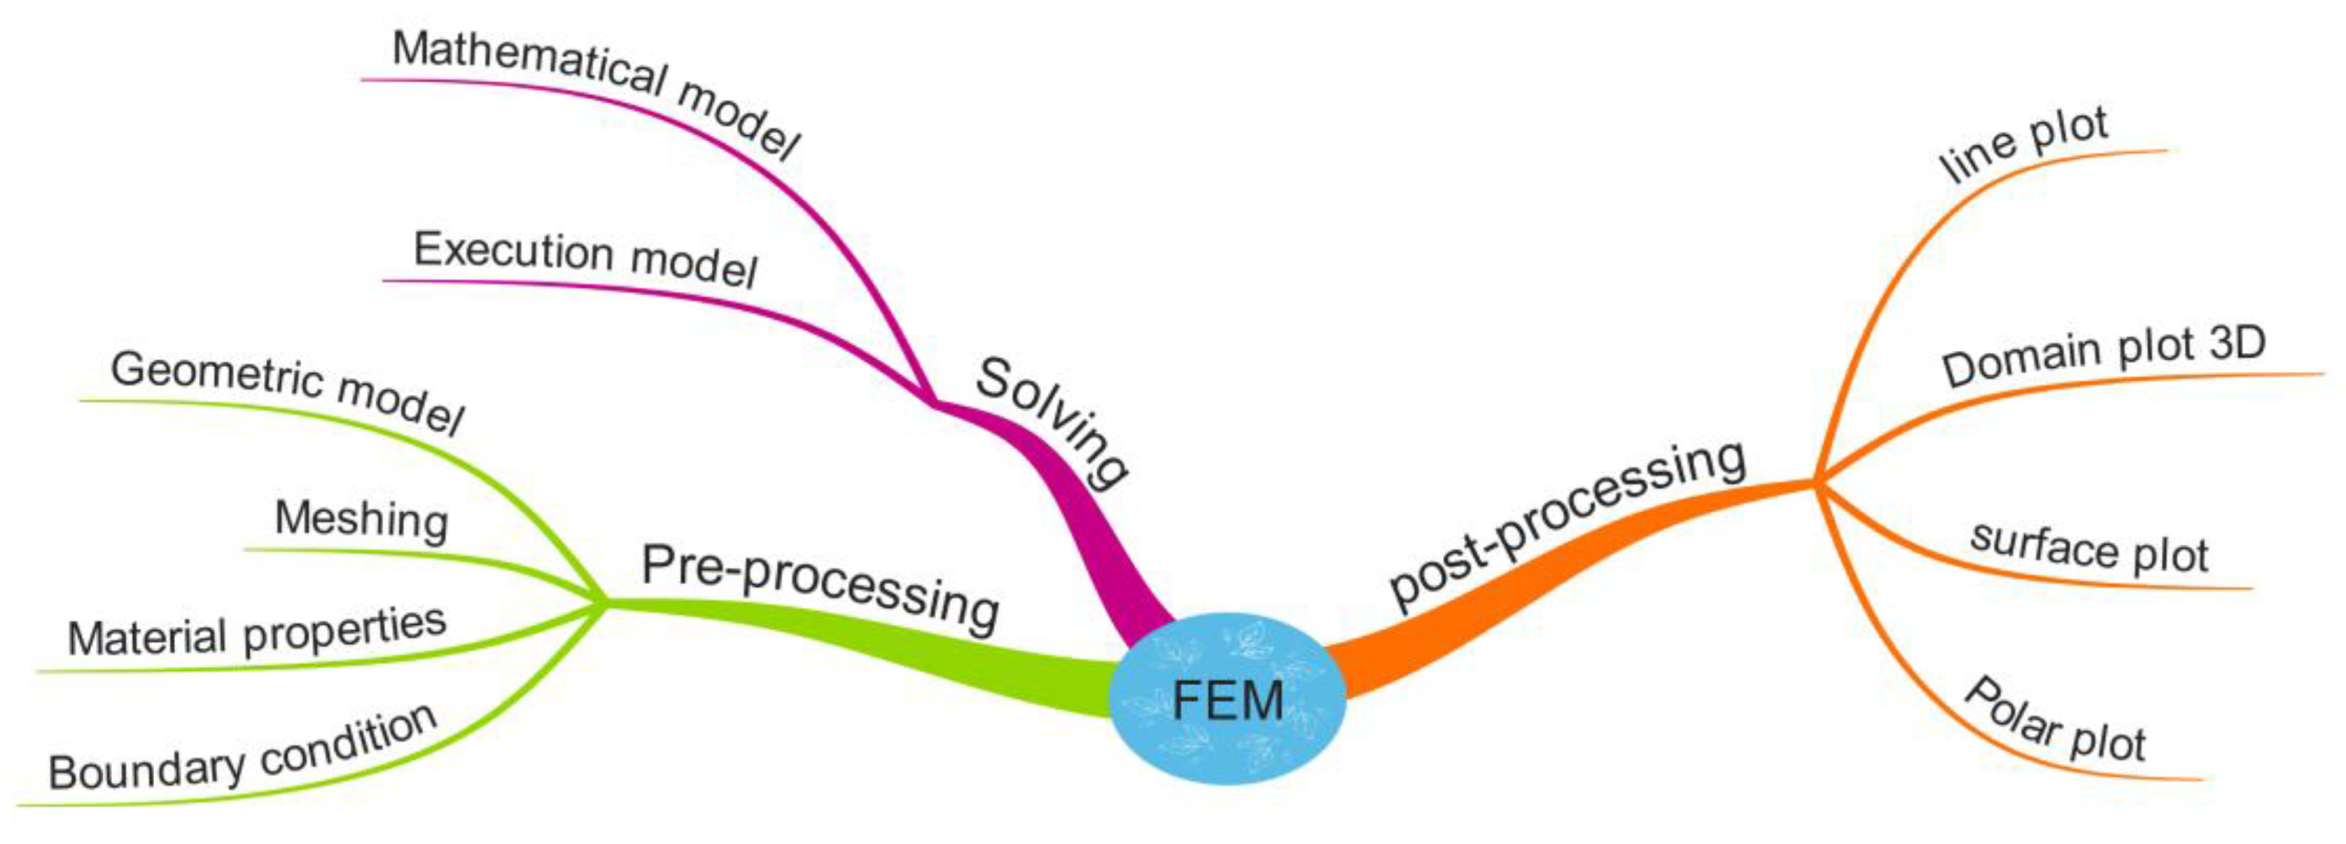
5.1. Finite Element Method (FEM) Technique

In this work, the FEM technique has been employed to model the electrical characteristics of the coated insulators under pollution. These electrical characteristics considered the potential, electric field, and current density as study elements. The COMSOL Multiphysics 5.5 software was specifically used for analytical purposes. The FEM modeling is depicted in Figure 10. The computation of potential and electric field is quasistatic and can be performed by the electrostatic module. The electrostatic solver from the AC/DC formulation of physics was utilized [27]. For simplicity, the insulator simulation was created with a 2D design for the recommended coating profile models. A 33 kV AC voltage was applied to the pin of the first unit of the insulator string, while the top cap of the last unit of the insulator string was set as the ground. Table 5 lists the conductivity and permittivity values of the materials utilized in the model. The RTV layer had a thickness of 1 mm, whereas the pollution layer had a thickness of 3 mm.

5.2. Electric Fields and Potential Calculation

The gradient of potential (V) is a direct parameter for defining the distribution of the electric field (E) [28],
E = V
From Maxwell’s expression,
E = ρ / ε
where ε and ρ are the electric permittivity and resistivity, respectively. By substituting the electric field in (1) into (2), Poisson expression has been obtained as,
( ε V ) = ρ     2 V = ρ / ε
when ρ = 0,
2 V = 0
The electric potential (V) will be found as:
( σ V ) + t ( ε V ) = 0
σ presents electric conductivity.
Figure 11 depicts the insulator meshing for the investigated RTV coating damage profiles. During the meshing process, the normal element size was decided. The characteristics of the mesh and the number of degrees of freedom (DOF) solved for all configurations under normal size of elements are tabulated in Table 6.

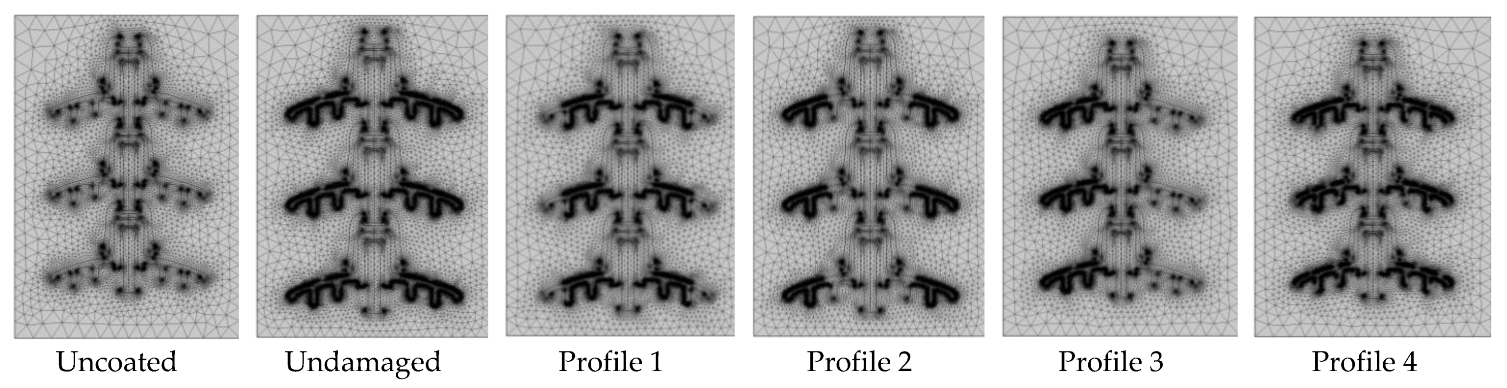
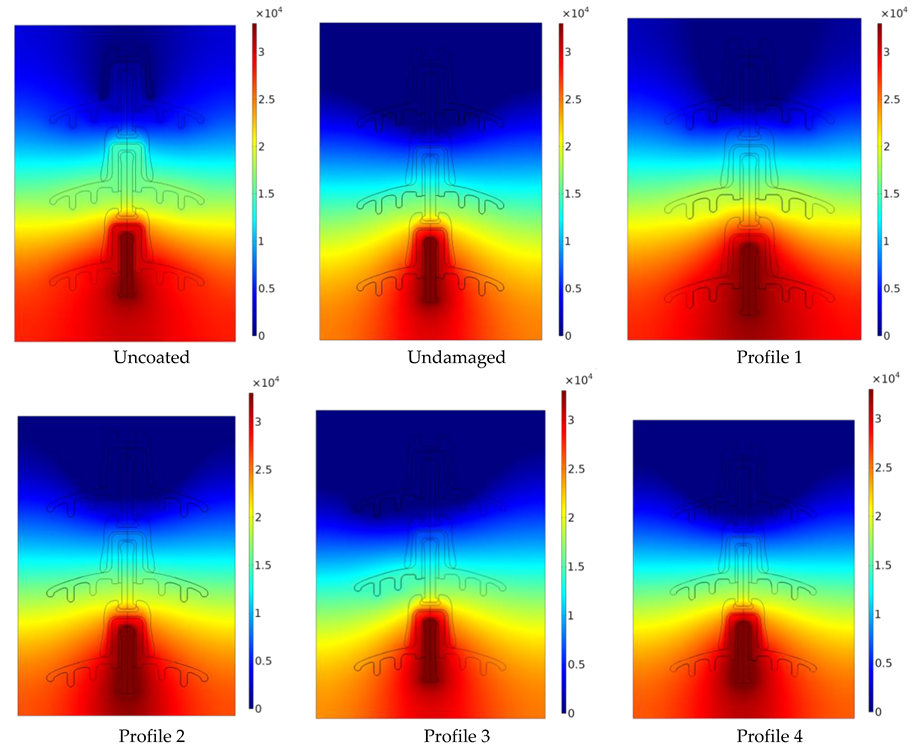
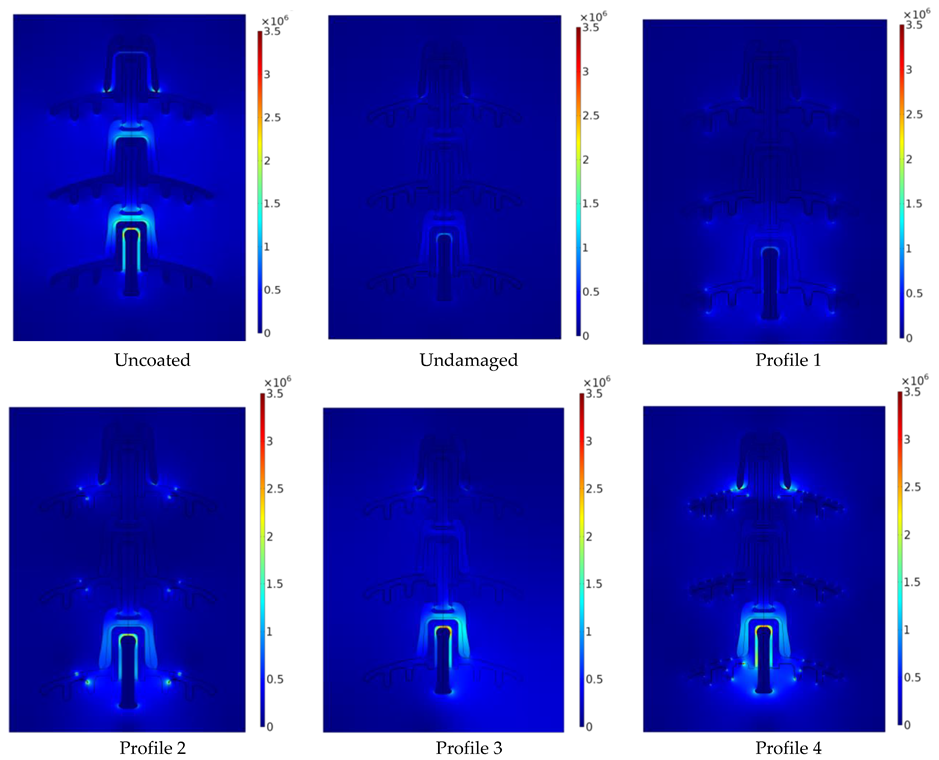
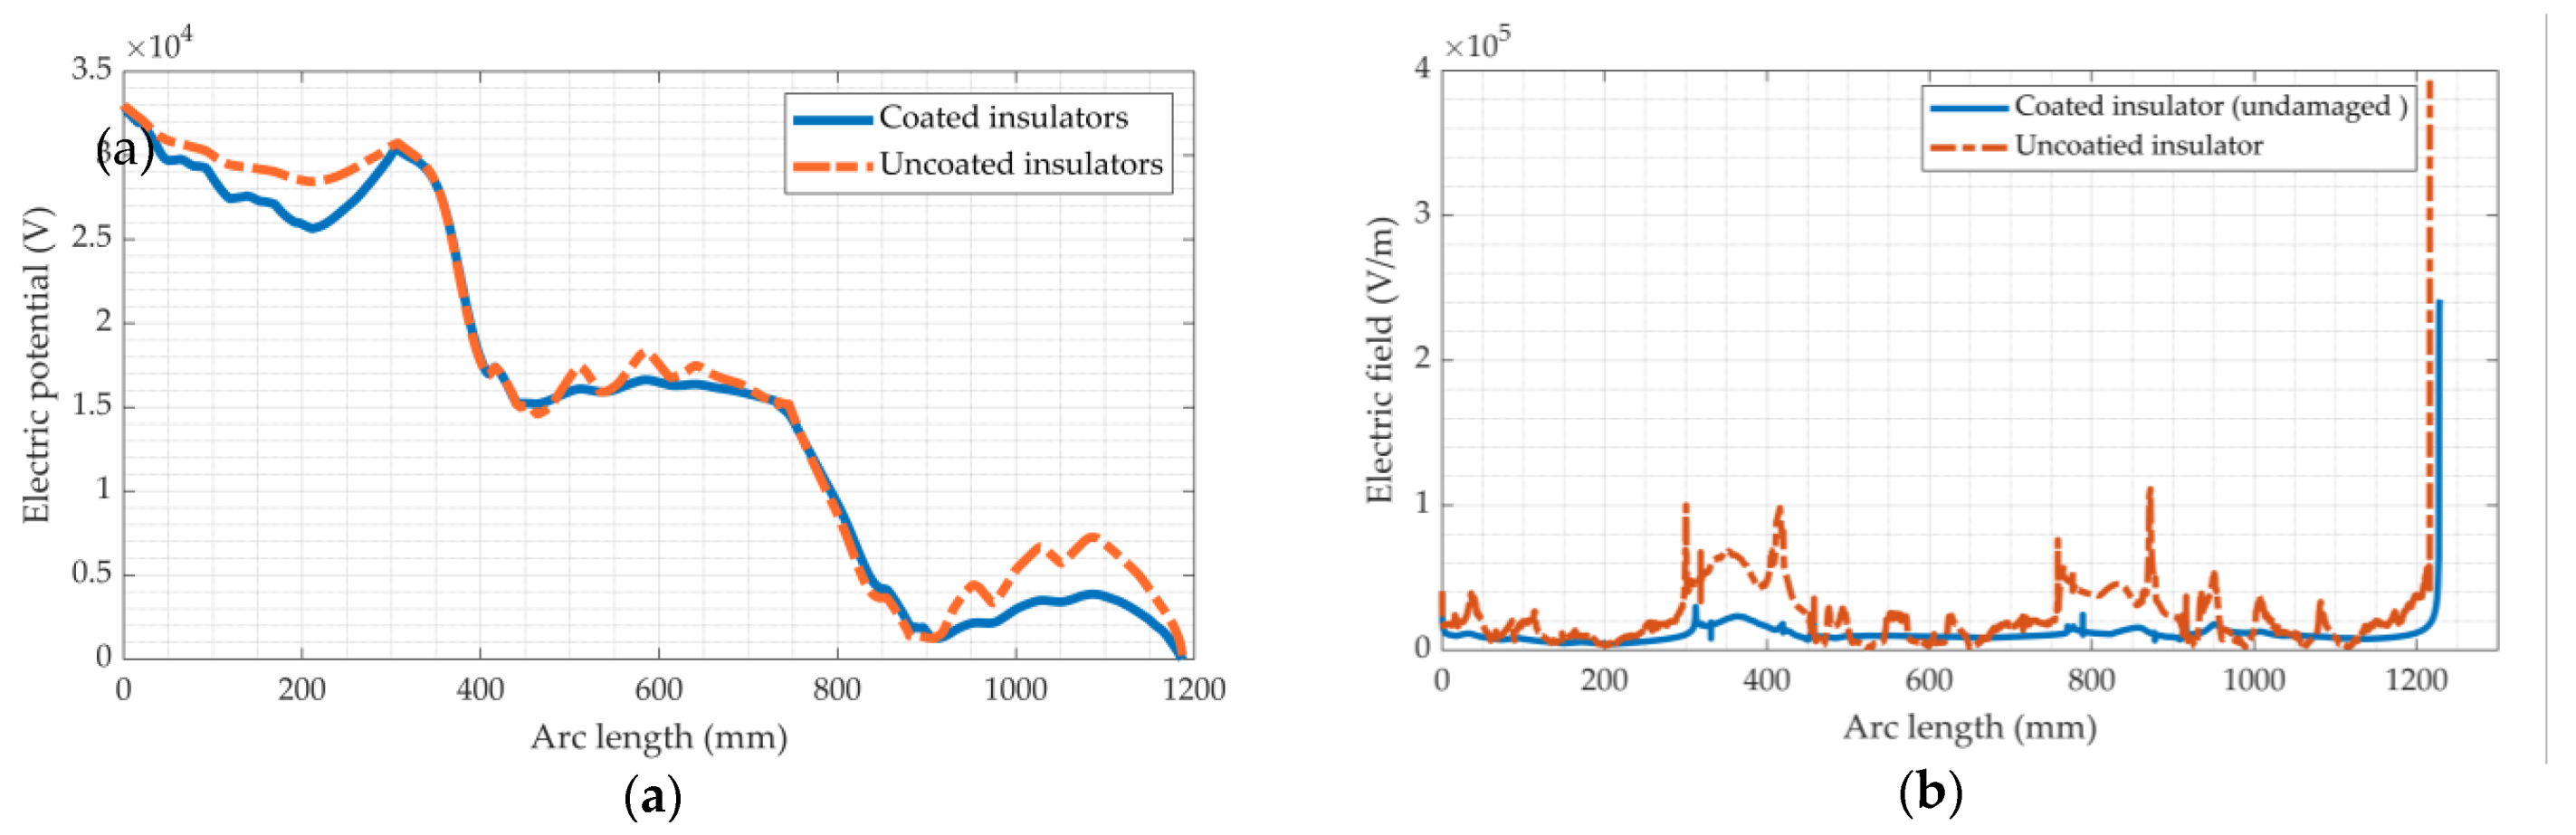
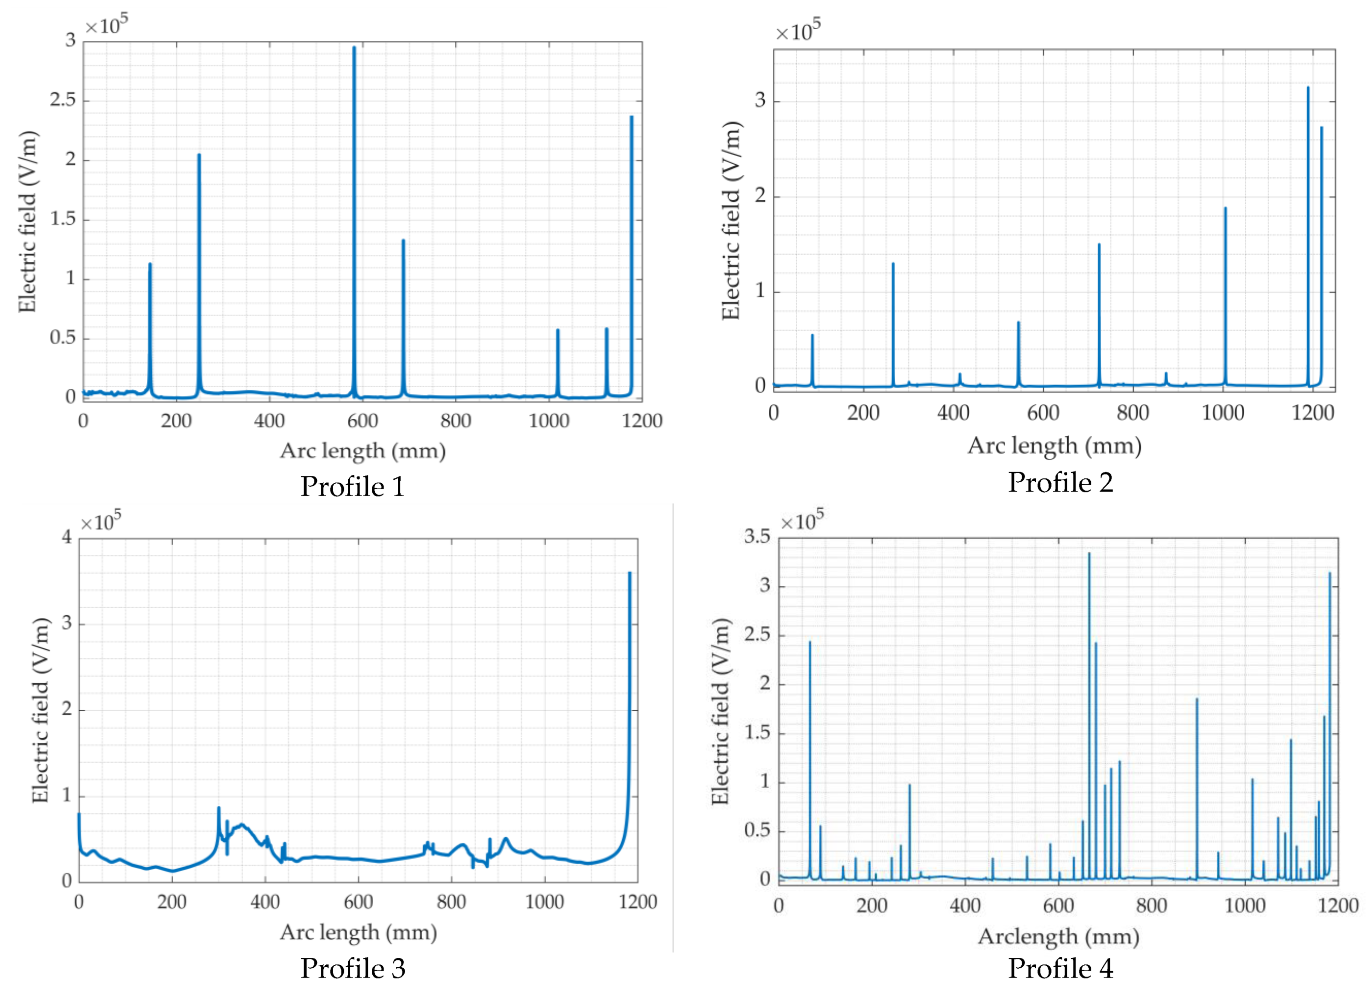
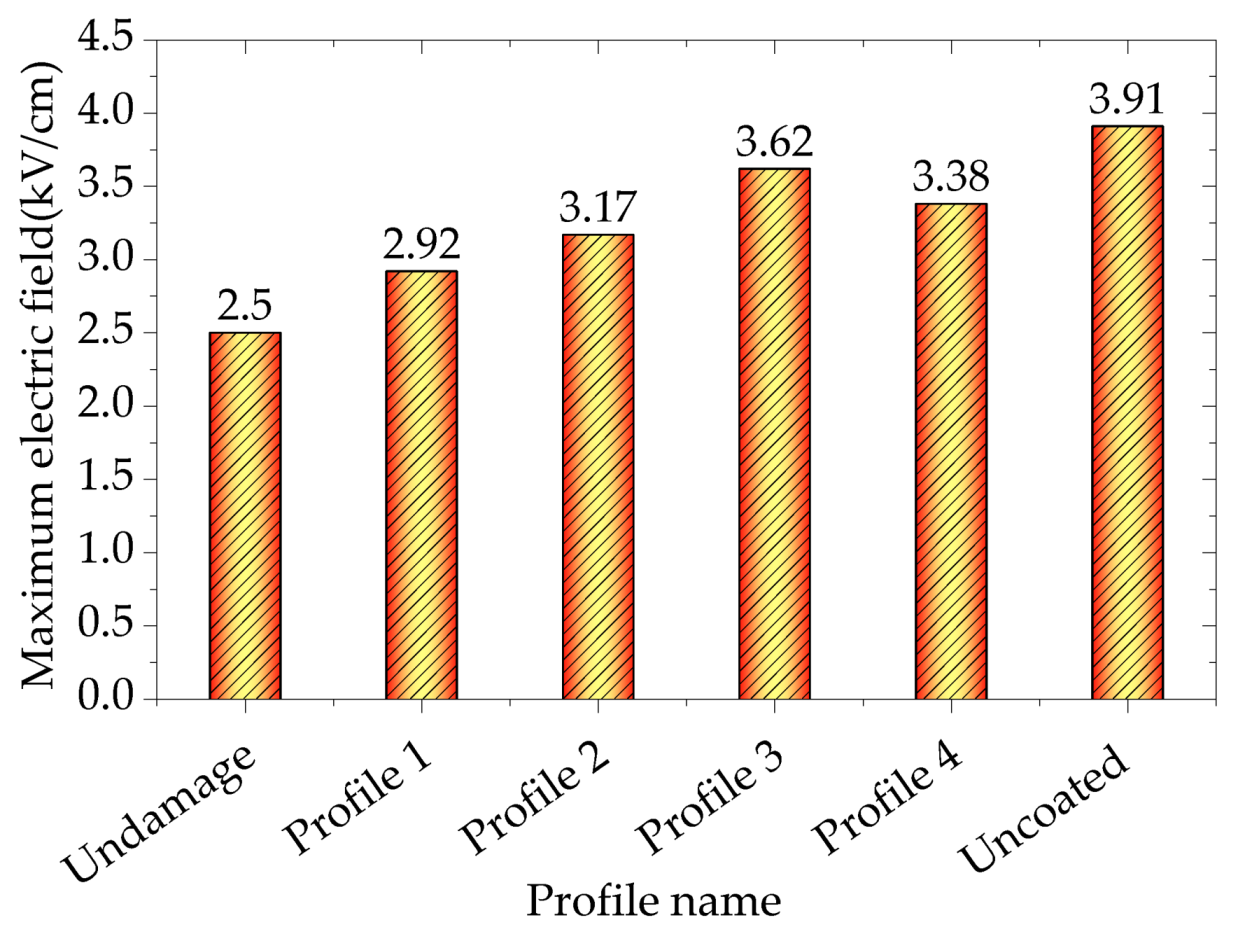
5.3. Numerical Simulation Results and Analysis

In this section, the results of electric potential and electric field using FEM are demonstrated and discussed. The main aim of this simulation was to show the voltage gradiant for each profile and the electric field stress location under the proposed coating damage profiles. The distribution of electric potential and electric field under the proposed coating damage profiles are illustrated in Figure 12 and Figure 13, respectively. According to Figure 12, the electric potential reduces gradually from the HV terminal to the ground terminal. Because the conductivity values for each profile varies, the electric potential for each profile has varying distributions. Because of the capacitive impact of the coated surface, the potential distribution on the insulator surface appeared to be non-linear.
The electric potential distribution gradient will change slightly according to different RTV coating damage profiles, as shown in Figure 12’s fan profile (profile 3). It is worth noting that the contour color pattern in Figure 12 reveals the insulator’s various electric potential values for each coating damage profile.
Because of the contaminated charge in the poles, the greatest values of electrical field strength were detected inside the insulator material (glass) that is in between the pin and cup and the adjacent region of the insulator HV electrodes, and then around the ground pole. Moreover, the surface color density indicates the intensity of the field inside and around the insulator’s high voltage pole. The smallest electric field was observed at the shed’s far end, where electrical charges are practically non-existent. As can be seen from Figure 13, the electric field turns weak at the coated regions as compared to the regions without coating. Variation in conductivity causes interfacial polarization and stimulates charge buildup at the coating boundary, resulting in the development of an electric field with a high value on both sides of the damaged area, as seen in Figure 13.
Figure 14 depicts the electric potential and electric field distribution throughout the creepage distance of the insulator string. For illustration of the coating effect on the insulator performance, only the electric potential and electric field for the fully coated and uncoated insulators were taken into consideration. Figure 14 shows how the electrical potential along the insulator discs with the coating appeared to be at its lowest value as compared to the insulator without coating. The density of the electric field increases as the conductivity of the contamination layer rises and the E-field is observed to be higher on the uncoated insulator than the coated insulator (Figure 14b).
Figure 15 shows the electrical field distribution along the porcelain insulator string for the four different RTV coating damage profile scenarios. The electric field density increases towards the electrodes, the coating cross-section with the insulator, and the damaged area sides, as previously stated. For example, due to the existence of multiple coating damage areas on the insulator string surface, profile 4 has significant distortion in the electric field signal. Notably, the initiation of the flashover arc often occurs in the area of the insulator where the electric field value is the highest.
Figure 16 depicts the maximum values of the electric field under the proposed coating damage profiles on the porcelain insulator string. According to Figure 16, the insulator without coating has the highest electric field value, followed by the insulator with coating damage profile 3, profile 4, profile 2, profile 1, and full coating profile without damage. When insulators without coating damage are compared to those with coating damage, it is visualized that coating damage in the coating layer causes electric field intensification, as in the case of insulators with coating damage profile 4. With the expansion of the coating degradation zone, the electric field increases as well.

6. Conclusions

Experimental observation and numerical analysis methods have been conducted in this paper to study the effects of RTV coating damage profiles on the pollution flashover properties of the porcelain insulator string. The SDD, the RTV coating damage profiles, and the coating damage appeared to have a significant influence on the flashover voltage gradient. The relationship between the SDD and the flashover voltage gradient resulted in a negative power function when the RTV coating damage was increased. The experimental work indicates that the flashover voltage gradient for the coated insulator was about 1.3 kV/cm, which was substantially better than the flashover voltage gradient for the uncoated insulator, which roughly resulted as 0.84 kV/cm. Profile 3 exhibited the lowest flashover voltage gradient of 1.19 kV/cm among the four coating damage profiles, followed by profile 4 at 1.24 kV/cm, profile 2 at 1.36 kV/cm, and profile 1 at 1.38 kV/cm. Meanwhile, increasing the coating damage area r to 15% reduced the flashover voltage gradient for all profiles in the range 22.5–26.8%. A two-dimensional FEM model of RTV coating damage insulators under various damage profiles was developed to calculate the electric potential and the electric field distribution on the damaged surfaces of the insulators. According to the experimental observation and numerical analysis, it is supposed that the initiation of the spark appears generally at the point where the greatest electric field strength is available. The varied coating damage profiles cause a change in the surface contamination layer conductance which leads to a dramatic decrease in the flashover voltage gradient as well as an uneven distribution of the electric potential and electric field. Therefore, the contamination flashover characteristics can be directly associated with the coating damage profiles.

Author Contributions

Conceptualization, A.A.S., K.Y.L. and S.A.A.-G.; methodology, A.A.S.; K.Y.L., W.R. and Z.A.-M.; software, A.A.S., R.A.R., S.M.A.-A. and U.U.S. validation, A.A.S., W.R. and Z.A.-M.; formal analysis, A.A.S., K.Y.L. and S.A.A.-G.; investigation, A.A.S., K.Y.L., S.M.A.-A. and W.R.; resources, A.A.S., K.Y.L. and R.A.R.; data curation, A.A.S. and U.U.S.; writing—original draft preparation, A.A.S. and K.Y.L.; writing—review and editing, A.A.S., S.A.A.-G., K.Y.L., W.R., S.M.A.-A. and Z.A.-M.; visualization, A.A.S. and K.Y.L.; supervision, A.A.S., K.Y.L., W.R. and Z.A.-M.; project administration, A.A.S. and K.Y.L.; funding acquisition, K.Y.L., W.R. and Z.A.-M. All authors have read and agreed to the published version of the manuscript.

Funding

This research received no external funding.

Institutional Review Board Statement

Not applicable.

Informed Consent Statement

Not applicable.

Data Availability Statement

Not applicable.

Acknowledgments

This work was supported by the Collaborative in Engineering, Science and Technology (CREST) under the Grant 304/PELECT/6050423/C121 from Universiti Sains Malaysia (USM) and the Post-Doctoral Fellowship Scheme under the Professional Development Research University Grant (05E68) from Universiti Teknologi Malaysia (UTM).

Conflicts of Interest

The authors declare no conflict of interest.

Nomenclature and Abbreviations

RTVRoom Temperature Vulcanizing
HTVHigh Temperature Vulcanizing
FEMFinite Element Method
STRISweden Transmission Research Institute
HCHydrophobic
ACAlternating Current
NaClSodium chloride salt
SDDSalt Deposit Density
NSDDNon-Soluble Deposit Density
DOFDegrees Of Freedom
HHigh insulator
DDiameter insulator
LLength insulator
γ s v 
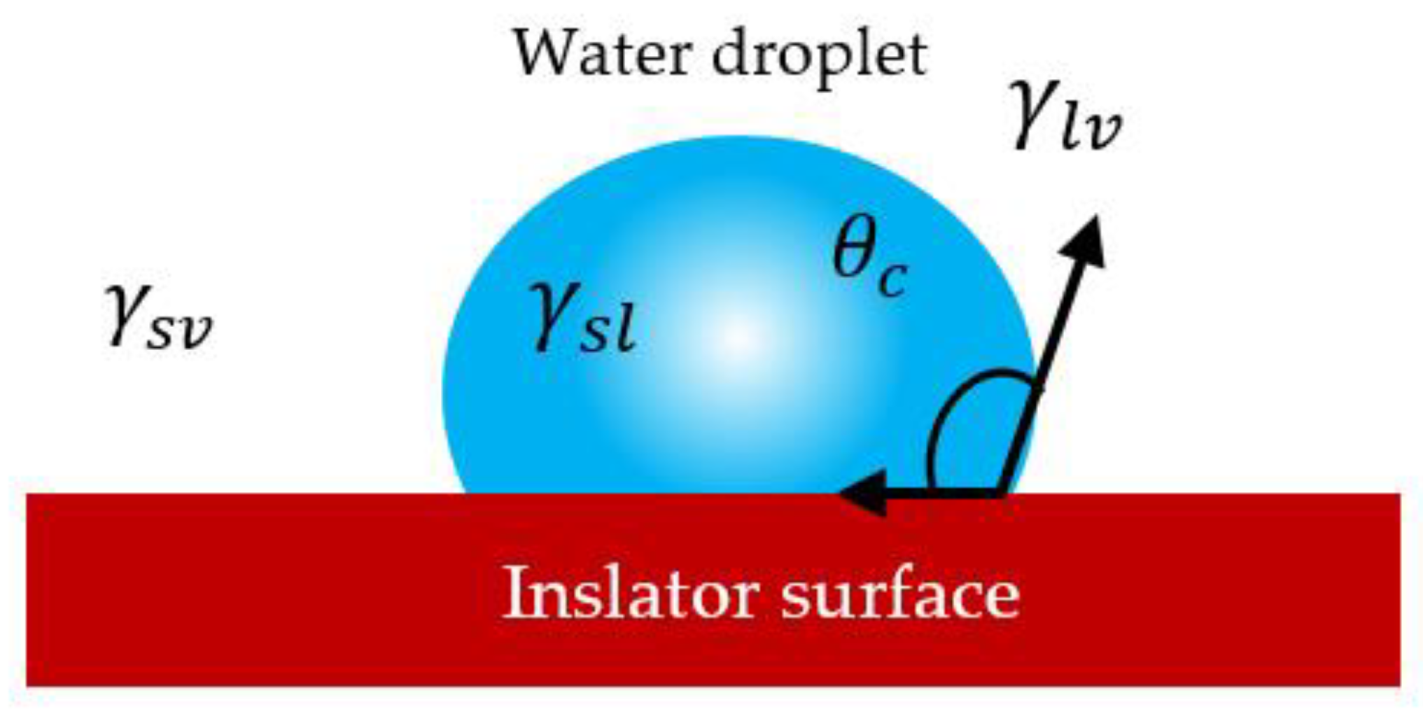
Interfacial tensions between the surface and air
γ s l Interfacial tensions between surface and liquid
γ l v Interfacial tensions between liquid and air
θ c Angle at which the liquid makes contact with the insulator surface
σ 20 Conductivity of layer pollution at 20 °C
V Solution volume
S Area of polluted surface
r Ratio of coating damage area to whole insulator surface area
S d Coating damage area
S t Whole area of coated surface of insulator
U F Flashover voltage
U i Applied voltage
n i Number which was carried out at the applied voltage Ui
N Total test number
σ % Standard deviation
EFFlashover voltage gradient
aConstant determined by factors such as the insulator’s shape, air pressure
bInsulator’s characteristic contamination index
ε Electrical permittivity
ρ Electrical resistivity
ε r Relative permittivity

References

  1. Marzinotto, M.; Mazzanti, G.; Cherney, E.A.; Pirovano, G. An innovative procedure for testing RTV and composite insulators sampled from service in search ofdiagnostic quantities. IEEE Elect. Insul. Mag. 2018, 34, 27–38. [Google Scholar] [CrossRef]
  2. Marzinotto, M.; Mazzanti, G.; Cherney, E.A.; Pirovano, G. A test-ing procedure for RTV pre-coated glass cap-and-pin and composite insulators sampled from field. In Proceedings of the IEEE Conf. Elect. Insul. Dielectr. Phenomenon (CEIDP), Fort Worth, TX, USA, 22–25 October 2017; pp. 421–424. [Google Scholar]
  3. Taghvaei, M.; Sedighizadeh, M.; NayebPashaee, N.; Fini, A.S. Reliability assessment of RTV and nano-RTV-coated insulators concerning contamination severity. Electr. Power Syst. Res. 2021, 191, 106892. [Google Scholar] [CrossRef]
  4. Majid Hussain, M.; Farokhi, S.; McMeekin, S.G.; Farzaneh, M. Contamination performance of high voltage outdoor insulators in harsh marine pollution environment. In Proceedings of the 2017 IEEE 21st International Conference on Pulsed Power (PPC), Brighton, UK, 18–22 June 2017; pp. 1–6. [Google Scholar]
  5. Taghvaei, M.; Sedighizadeh, M.; NayebPashaee, N.; Fini, A.S. Thermal stability of nano RTV vs. RTV coatings in porcelain insulators. Therm. Sci. Eng. Prog. 2020, 20, 100696. [Google Scholar] [CrossRef]
  6. Hussain, M.M.; Farokhi, S.; McMeekin, S.G.; Farzaneh, M. Risk assessment of failure of outdoor high voltage polluted insulators under combined stresses near shoreline. Energies 2017, 10, 1661. [Google Scholar] [CrossRef] [Green Version]
  7. Yang, S.; Jia, Z.; Ouyang, X. Effects of asymmetrical algal distribution on the AC flashover characteristics of bio-contaminated silicone rubber insulators. Electr. Power Syst. Res. 2019, 172, 296–302. [Google Scholar] [CrossRef]
  8. Jia, Z.; Chen, C.; Wang, X.; Lu, H.; Yang, C.; Li, T. Leakage current analysis on RTV coated porcelain insulators during long term fog experiments. IEEE Trans. Dielectr. Electr. Insulat. 2014, 21, 1547–1553. [Google Scholar]
  9. Jia, Z.; Fang, S.; Gao, H.F.; Guan, Z.C.; Wang, L.M.; Xu, Z.H. Development of RTV Silicone Coatings in China: Overview and Bibliography. IEEE Electr. Insul. Mag. 2008, 24, 28–41. [Google Scholar]
  10. George, J.M.; Prat, S.; Lumb, C.; Virlogeux, F.; Gutman, I.; Lundengard, J.; Marzinotto, M. Field experience and laboratory investigation of glass insulators having a factory-applied silicone rubber coating. IEEE Trans. Dielectr. Electr. Insul. 2014, 21, 2594–2601. [Google Scholar] [CrossRef]
  11. Su, H.; Jia, Z.; Guan, Z.; Li, L. Durability of RTV-coated insulators used in subtropical areas. IEEE Trans. Dielectr. Electr. Insul. 2011, 18, 767–774. [Google Scholar] [CrossRef]
  12. Sorqvist, T. Long-term field experience with RTV coated porcelain insulators. In Proceedings of the Conference Record of the 2000 IEEE International Symposium on Electrical Insulation (Cat. No.00CH37075), Boston, MA, USA, 5 April 2000; pp. 201–206. [Google Scholar]
  13. Gao, H.; Jia, Z.; Guan, Z.; Wang, L.; Zhu, K. Investigation on field-aged RTV-coated insulators used in heavily contaminated areas. IEEE Trans. Power Del. 2007, 22, 1117–1124. [Google Scholar] [CrossRef]
  14. Ilomuanya, C.S.; Farokhi, S.; Nekahi, A. Electrical Power Dissipation on the Surface of a Ceramic Insulator under Pollution Condition. In Proceedings of the 2018 IEEE Conference on Electrical Insulation and Dielectric Phenomena (CEIDP), Cancun, Mexico, 21–24 October 2018; pp. 199–202. [Google Scholar]
  15. Xing, Y.; Wang, Y.; Chi, J.; Liu, H.; Li, J. Study on Improving Interface Performance of HVDC Composite Insulators by Plasma Etching. Coatings 2020, 10, 1036. [Google Scholar] [CrossRef]
  16. Wu, X.; Li, X.; Hao, L.; Wen, X.; Lan, L.; Yuan, X. Effect of vulcanization temperature and humidity on the properties of RTV silicone rubber. IOP. Conf. Ser. Mater. Sci. Eng. 2017, 207, 012011. [Google Scholar] [CrossRef]
  17. Hussain, M.M.; Chaudhary, M.A.; Razaq, A. Mechanism of Saline Deposition and Surface Flashover on High-Voltage Insulators near Shoreline: Mathematical Models and Experimental Validations. Energies 2019, 12, 3685. [Google Scholar] [CrossRef] [Green Version]
  18. Isa, M.; Othman, M.; Abdullah, A.Z.; Piah, M.A.M.; Rahman, N.A.; Mazlee, M.N. Characteristics of RTV Coating on Ceramic Insulator. In Proceedings of the 2019 IEEE International Conference on Automatic Control and Intelligent Systems, Selangor, Malaysia, 29 June 2019; pp. 114–117. [Google Scholar]
  19. Artificial Pollution Tests on High-Voltage Ceramic and Glass Insu-lators to be Used on A.C. Systems, 3rd ed.; Standard IEC 60507; International Electrotechnical Commission: Geneva, Switzerland, 2013.
  20. Salem, A.A.; Abd-Rahman, R.; Al-Gailani, S.A.; Kamarudin, M.S.; Salam, Z. The leakage current components as a diagnostic tool to estimate contamination level on high voltage insulators. IEEE Access 2020, 8, 92514–92528. [Google Scholar]
  21. Salem, A.A.; Abd-Rahman, R.; Al-Gailani, S.A.; Salam, Z.; Kamarudin, M.S.; Zainuddin, H.; Yousof, M.F.M. Risk assessment of polluted glass insulator using leakage current index under different operating conditions. IEEE Access 2020, 8, 175827–175839. [Google Scholar] [CrossRef]
  22. Arshad, A.; Ahmad, J.; Tahir, A.; Stewart, B.G.; Nekahi, A. Forecasting flashover parameters of polymeric insulators under contaminated conditions using the machine learning technique. Energies 2020, 13, 3889. [Google Scholar] [CrossRef]
  23. Abd-Rahman, R.; Haddad, A.; Harid, N.; Griffiths, H. Stress control on polymeric outdoor insulators using Zinc oxide microvaristor composites. IEEE Trans. Dielectr. Electr. Insul. 2012, 19, 705–713. [Google Scholar] [CrossRef]
  24. Salem, A.; Abd-Rahman, R.; Ghanem, W.; Al-Gailani, S.; Al-Ameri, S. Prediction flashover voltage on polluted porcelain insulator using ANN. Comput. Mater. Contin. 2021, 68, 3755–3771. [Google Scholar] [CrossRef]
  25. Salem, A.A.; Abd-Rahman, R.; Ahmad, H.; Kamarudin, M.S.; Jamal, N.A.M.; Othman, N.A.; Ishak, M.T. A New Flashover Prediction on Outdoor Polluted Insulator Using Leakage Current Harmonic Components. In Proceedings of the 2018 IEEE 7th International Conference on Power and Energy (PECon), Kuala Lumpur, Malaysia, 3–4 December 2018; pp. 413–418. [Google Scholar]
  26. Salem, A.A.; Abd-Rahman, R.; Rahiman, W.; Al-Gailani, S.A.; Al-Ameri, S.; Ishak, M.T. Pollution flashover under different contamination profiles on high voltage insulator: Numerical and experiment investigation. IEEE Access 2021, 9, 37800–37812. [Google Scholar] [CrossRef]
  27. Zhang, Z.; Yang, S.; Jiang, X.; Qiao, X.; Xiang, Y.; Zhang, D. DC Flashover Dynamic Model of Post Insulator under Non-Uniform Pollution between Windward and Leeward Sides. Energies 2019, 12, 2345. [Google Scholar] [CrossRef] [Green Version]
  28. Hussain, M.; Farokhi, S.; McMeekin, S.; Farzaneh, M. The effects of salt contamination deposition on HV insulators under environmental stresses. In Proceedings of the 2015 IEEE 11th International Conference on the Properties and Applications of Dielectric Materials (ICPADM), Sydney, NSW, Australia, 19–22 July 2015; pp. 616–619. [Google Scholar]
Figure 1. Coated porcelain insulators used on transmission line.
Coatings 11 01194 g001
Figure 2. Chemical reaction in room temperature vulcanization (RTV) [16].
Coatings 11 01194 g002
Figure 3. Interfacial surface tensions and the contact angle [17].
Coatings 11 01194 g003
Figure 4. RTV coating damage profiles of coated insulators.
Coatings 11 01194 g004
Figure 5. (a) Experiment setup schematic diagram. (b) Pictorial view of the test setup.
Coatings 11 01194 g005
Figure 6. Flashover voltage gradient of clean insulator under different profile coating.
Coatings 11 01194 g006
Figure 7. Flashover voltage gradient of polluted insulator: (a) without RTV coating; (b) with RTV coating.
Coatings 11 01194 g007
Figure 8. The flashover voltage gradient EF versus SDD for various profiles of coating damage.
Coatings 11 01194 g008
Figure 9. Flashover voltage gradient EF of polluted porcelain insulator string under different humidity levels: (a) with RTV coating; (b) without RTV coating.
Coatings 11 01194 g009
Figure 10. Finite element method (FEM) modeling in COMSOL Multiphysics.
Coatings 11 01194 g010
Figure 11. FEM mesh for all profiles.
Coatings 11 01194 g011
Figure 12. Electric potential distribution of insulators with different RTV coating damage profiles.
Coatings 11 01194 g012
Figure 13. Electric field distribution of insulators with different profiles of damage.
Coatings 11 01194 g013
Figure 14. Simulation results of coated and uncoated insulators: (a) electric potential; (b) electric field.
Coatings 11 01194 g014
Figure 15. Electric field distribution on insulators under different RTV coating damage profiles.
Coatings 11 01194 g015
Figure 16. Maximum electric field value at each coating damage profile in the porcelain insulator string.
Coatings 11 01194 g016
Table 1. Insulators’ technical characteristics.
Insulator TypeH (mm)D (mm)L (mm)Schematic
Porcelain
XP-70
146255305 Coatings 11 01194 i001
Table 2. RTV coating material technical specifications.
Surface Dry Time (min)Cure Time (min)Solid Content (%)Dielectric Strength (kV/mm)Tensile Strength (MPa)Shear Strength (Pa)Tear Strength (N/m)Durable Years (Outdoors)
2730055.124.7–25.33.9510.00357415,20015
Table 3. Experiment results of coated insulator under different coating damage profile.
rSalt Deposit Density SDD
(mg/cm2)
Profile
1234
EF (kV/cm)Σ (%)EF (kV/cm)Σ (%)EF (kV/cm)Σ (%)EF (kV/cm)Σ (%)
10%0.051.3273.11.1384.11.0533.31.0884.7
0.11.1024.30.9642.20.8253.60.8753.6
0.150.9162.90.8252.80.6832.60.7204.2
0.20.8142.60.7423.10.6293.70.6663.6
20%0.051.2244.61.0492.30.9713.41.0032.8
0.11.0173.60.8894.70.7614.10.8073.6
0.150.8452.20.7612.60.6302.80.6644.3
0.20.7503.60.6853.40.5802.80.6142.6
30%0.051.1112.80.9513.30.882.50.913.6
0.10.9232.60.8054.20.692.20.7324.3
0.150.7674.30.6893.90.5713.60.6023.3
0.20.6813.20.622.60.5262.80.5574.3
Table 4. Fitting result of coated insulator under four different coating damage profile and r.
rFitting ValuesProfile 1Profile 2Profile 3Profile 4
10%a0.4840.4650.3410.375
b0.340.3020.3670.348
R20.9720.9760.9940.989
20%a0.4440.4310.3150.344
b0.3420.2980.3710.351
R20.9780.980.9950.99
30%a0.4030.3910.2850.311
b0.3420.3040.3690.35
R20.9730.9760.9920.985
Table 5. Material properties.
Types of MaterialRelative Permittivity, εrConductivity, σ (S/m)
Air10
Cement15 10 4
Pollution layer7.1 6 × 10 7
Water805.5 × 10 6
Insulator4.20
Insulator cap1000 5.9 × 10 7
Insulator pin1000 5.9 × 10 7
RTV2.91 × 10 12
Table 6. Element’s properties.
Profile NameType of ElementDegrees of Freedom DOF
DomainBoundaryVertex
Uncoated59,7783645320119,641
Undamaged150,13010,941702300,343
Profile 1121,9258453598244,127
Profile 2124,8868615550249,877
Profile 3149,96010,856690206,943
Profile 4142,4359157602284,954
Publisher’s Note: MDPI stays neutral with regard to jurisdictional claims in published maps and institutional affiliations.

