1. Introduction
Surface-enhanced Raman spectroscopy (SERS) is now widely used for trace analyte detection, biomolecule analysis and material characterization [
1,
2,
3,
4]. Considerable research has been devoted to the development of SERS-active substrates based on nanostructured silver and gold films, demonstrating a significant enhancement of the Raman signal [
5]. Today, the SERS method is one of the most highly sensitive and selective optical methods. It was discovered in 1970s on rough silver electrodes, after which the active development of SERS-active substrates began [
6]. In the 1970s and 1980s, SERS-active substrates mainly consisted of rough gold and silver electrodes, island films, colloidal aggregates, and surface structures created using microlithographic methods [
7]. Thanks to the development in the field of nanotechnology in the 1990s, new methods for the synthesis of SERS-active nanoparticles, nanotechnological methods for creating structured surfaces, and powerful methods of analysis for characterizing the formed nanostructures were actively improved. For SERS, usually use such structures as Au and Ag nanoparticles with nanometric-sized gaps, nanometric-sized shells, nanometric-sized tips, edges and structured surfaces with holes, voids, irregularities, or grooves [
7].
The development of promising substrates realizing the SERS effect is an urgent technological task today. There are many methods for creating substrates that implement the SERS effect, based on nanostructured silver and gold films, demonstrating significant signal enhancement, e.g., vacuum sputtering [
8], lithography [
9], and vapor deposition [
10].
Especially urgent are the problems of using the SERS method to detect biological objects at low concentrations [
11]. This method can be used to measure the SERS spectra of viruses, bacteria, and other biological objects. However, there is a line of research on bacteria and viruses when it is necessary to measure the spectra of their metabolic products. In such cases, the use of selective substrates that only enhance the SERS spectra of low molecular weight substances is required, whereas the spectra of lipid components will not appear on the SERS spectra.
One of the options for promising SERS-active substrates is immobilized silver nanoparticles, which are usually used in the form of colloidal solutions [
12,
13].
The development of technologies for the immobilization of nanoparticles in polymer matrices is urgent since it will allow the creation of stable nanostructures. There are a number of examples of the implementation of such structures in matrices of varying nature with using different methods: simple mixing [
14], spin-coating method [
15], electrospinning [
16], mixing with a precursor followed by metal reduction wit forming nanoparticles [
17], preliminary mixing of metal nanoparticles with a monomer and subsequent polymerization [
18]. Using the previously developed technology for the formation of metal-polymer nanocomposites in vacuum [
19,
20], vapor-phase deposition polymerization (VDP) on substrates cooled with liquid nitrogen, it is possible to obtain coatings with specific optical properties and to stabilize nanoparticles. In particular, we have created substrates based on a polymer matrix made of PCPX, an inert polymer, with silver nanoparticles introduced into it.
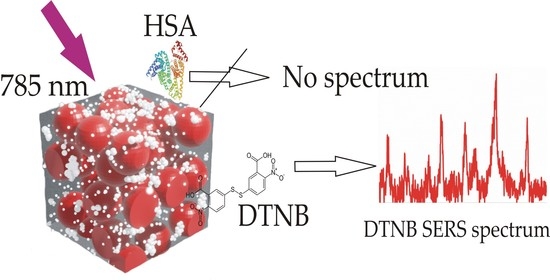
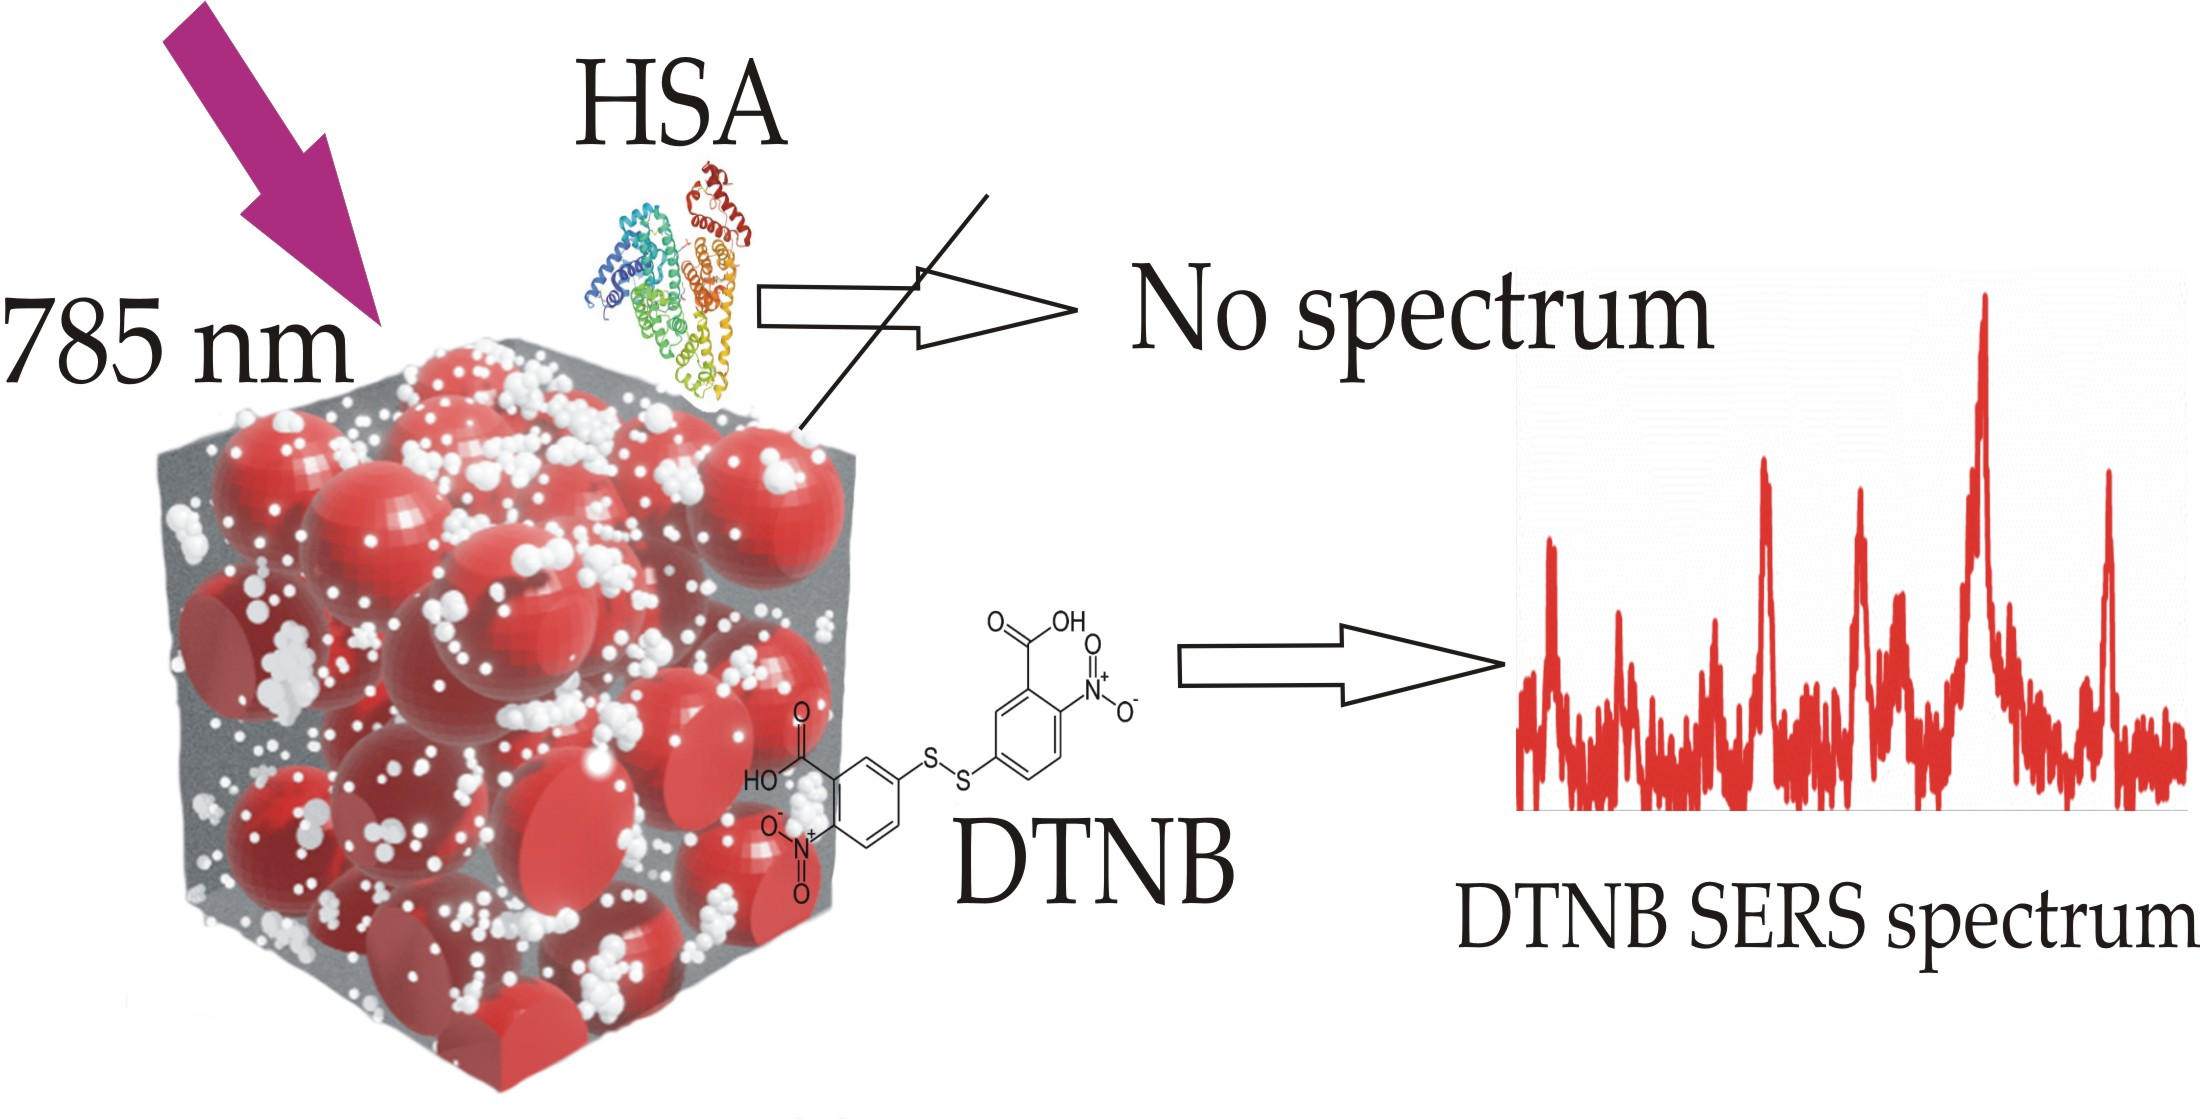
Immobilization of nanoparticles on the surface and in the bulk of a porous inert polymer matrix, which does not have its own noticeable Raman spectrum, makes it possible to use it as a basis for obtaining SERS substrates. The nanoporous structure of the matrix with plasmonic silver particles made it possible to demonstrate the possibility of selective registration of high-amplitude SERS spectra of 5,5′-Dithiobis(2-nitrobenzoic acid) (DTNB), with a concentration of 0.2 g/L, in an aqueous solution also containing human serum albumin (HSA) at a concentration of 1 μg/mL. We also investigated the effect of the morphology and concentration of silver on obtaining the maximum enhancement of the spectra of the analyte under study.
So far, no commercial substrates based on polymer matrices with embedded SERS metal nanoparticles have been proposed. The use of our vapor-phase polymerization method can be expanded on an industrial level. There are prerequisites for precise control of technological modes, which will make it possible to create reproducible substrates. Today, such commercial SERS substrates are known as Nikalyte Gold Nanoparticle SERS Substrate (Nikalyte Ltd., Stansted, UK), SERStrata (SILMECO, Copenhagen, Denmark), RAM-SERS-Ag and RAM-SERS-Au-5 SERS substrates (Ocean Insigt, Orlando, FL, USA), J12853 (HAMAMATSU, Hamamatsu City, Japan). To obtain them, various methods are used based on the methods of lithography, vacuum deposition, chemical synthesis, and a combination of these methods. In our study, we gave an assessment of the sensitivity of the substrates we developed in comparison with some commercial samples based on the manufacturers’ data.
The proposed vapor-phase polymerization method for obtaining SERS substrates will make it possible to obtain selective highly sensitive substrates in one technological cycle, which is a great advantage.
2. Materials and Methods
2.1. SERS Substrates Synthesis
The PСPX-Ag nanocomposite films were prepared by low temperature vapor-phase deposition polymerization technology, which is a powerful vacuum deposition technique enabling preparation of thin hybrid nanocomposite films with a wide range of inorganic content (from tenths to tens of volume percent). The process is carried out without any solvent or catalyst and allows the formation of nanocomposite films with controllable thickness in the range from several nanometers to several hundred micrometers, with sizes of inorganic nanoparticles down to 2 nm, and an adjustable concentration of the filler including the concentration gradient. The process consists of two phases. The first stage is a co-condensation of Ag vapor and chloro-p-xylylene (CPX) monomer on the substrate cooled down to −196 °C. At such a low temperature the monomer is metastable [
21]. The CPX monomer was prepared by pyrolysis of a cyclic dimer of CPX (Sigma Aldrich, St. Louis, MO, USA) at 670 °C using the classical Gorham’s method [
22]. Ag vapor was produced by thermal evaporation by the Knudsen effusion cell from Ag grains (MPSA, Russia). Deposition rate of the co-condensate was about 10 nm/min. During the deposition, residual vapor pressure below 10
−5 Torr was maintained in the PVDP chamber.
In the second phase of the process, a slow heating of the co-condensate up to room temperature, the polymerization of CPX into PCPX, and aggregation of the Ag clusters and atoms into nanoparticles occurs. The PCPX-Ag samples with volume Ag concentration in the range from 0 to 16%, with a thickness about 300 nm, were formed on the polycore substrates (NT-MDT, Zelenograd, Russia) with a preliminary deposited thin layer of optically non -transparent silver with thickness of 100 nm from the effusion Knudsen cell.
2.2. Substrate Processing with the Analyte
For SERS studies, the substrates were soaking in a DTNB solution (≥98%, Sigma Aldrich, St. Louis, MO, USA) with a concentration of 0.2 g/L in ethanol (≥99.8%, Sigma Aldrich, St. Louis, MO, USA). The substrates were immersed in the solution and incubated for 1 h, then immediately washed 3 times with ethanol (150 μL for each wash) and dried with an air stream. Freshly prepared substrates were used in the SERS studies. To control the specificity, the substrates with the maximum enhancement were modified in an aqueous solution of a mixture of human serum albumin (Sigma Aldrich, USA) at a concentration of 10 μg/mL together with 2 μg/mL DTNB under similar conditions.
2.3. SERS Spectra Measurement
The SERS spectra of the analyte were measured using an Alpha 300 R Raman spectrometer (WITec, Ulm, Germany) based on a confocal microscope with a Zeiss Epiplan Neofluar 10×/0.25 lens (Zeiss, Oberkochen, Germany). To excite the spectra, a Toptica laser with a wavelength λ = 785 nm was used. The spectra were measured at 20 random points of the sample at a laser power P = 0.14 mW. The accumulation time for one spectrum was 10 s. The spectra were processed using the OPUS 7.0 software (Bruker, Billerica, MA, USA). The baseline correction was performed using the rubber band correction algorithm built into the OPUS 7.0 software
Additionally, the SERS signal from the samples was mapped on an area of 150 × 150 μm2 with a resolution of 75 × 75 points. The scanning time at one point was 22.3 s. An area in the center of the sample was selected for scanning, and 5 maps were scanned for each concentration. After scanning, maps of the distribution of the amplitude of the vibration band of the DTNB spectrum at 1338 cm−1 were constructed.
2.4. Study of Morphology
The morphology was studied using a Solver atomic force microscope (AFM) (NT-MDT, Zelenograd, Russia) in the semi-contact mode using an HC-NC cantilever (NT-MDT, Zelenograd, Russia). Images of the surface with a size of 5 × 5 μm2 were obtained and the roughness parameters were calculated using the Gwyddion software package (CMI, Jihlava, Czech Republic) using a built-in algorithms.
2.5. Study of Optical Properties
Studies of the optical properties of the substrates were carried out using a SAG-1891 ellipsometer (IFP SD SA, Novosibirsk, Russia). The spectra of ellipsometric parameters Ψ and ∆ were measured at angles of incidence of 60 and 70° in the spectral range of 380–980 nm. On the basis of the obtained spectra with the help of the program created by the participants of this work in the software environment Wolfram Mathematica (Wolfram Research, Champaign, IL, USA), the optical spectra of the permittivity of the substrates were calculated.
In the first step, we used the data of preliminary measurements of the ellipsometric spectra of silver films 100 nm thick. Based on these spectra, the dielectric constant of silver was calculated. In the second step, the effective dielectric constant of the PCPX-Ag nanocomposite films was determined from the ellipsometric spectra of the system (Ag film, 100 nm)/(PCPX-Ag)/vacuum. For this, the dielectric constant of the Ag film, calculated at the first step, was taken. Point-to-point reconstruction of dielectric constant values
ε at each wavelength was used. For this, the residual function was minimized:
where the summation is over all angles (60° and 70°) and over all wavelengths. Minimization is carried out over the values of the complex dielectric permittivity
ε at each wavelength and over the thickness
d of the film. The index “
exp” denotes the parameters obtained from the experimental data, and similar values are calculated without the index. The notation
ρ- the ratio of the complex reflection coefficients in
p- and
s-polarization is also introduced; a similar value is calculated from the experimental spectra as
ρexp. The simultaneous combination of all the calculated spectra with the experimental ones by selecting two values (
ε′,
ε″) ensured the reliability of the results obtained.
3. Results and Discussion
3.1. Study of Morphology
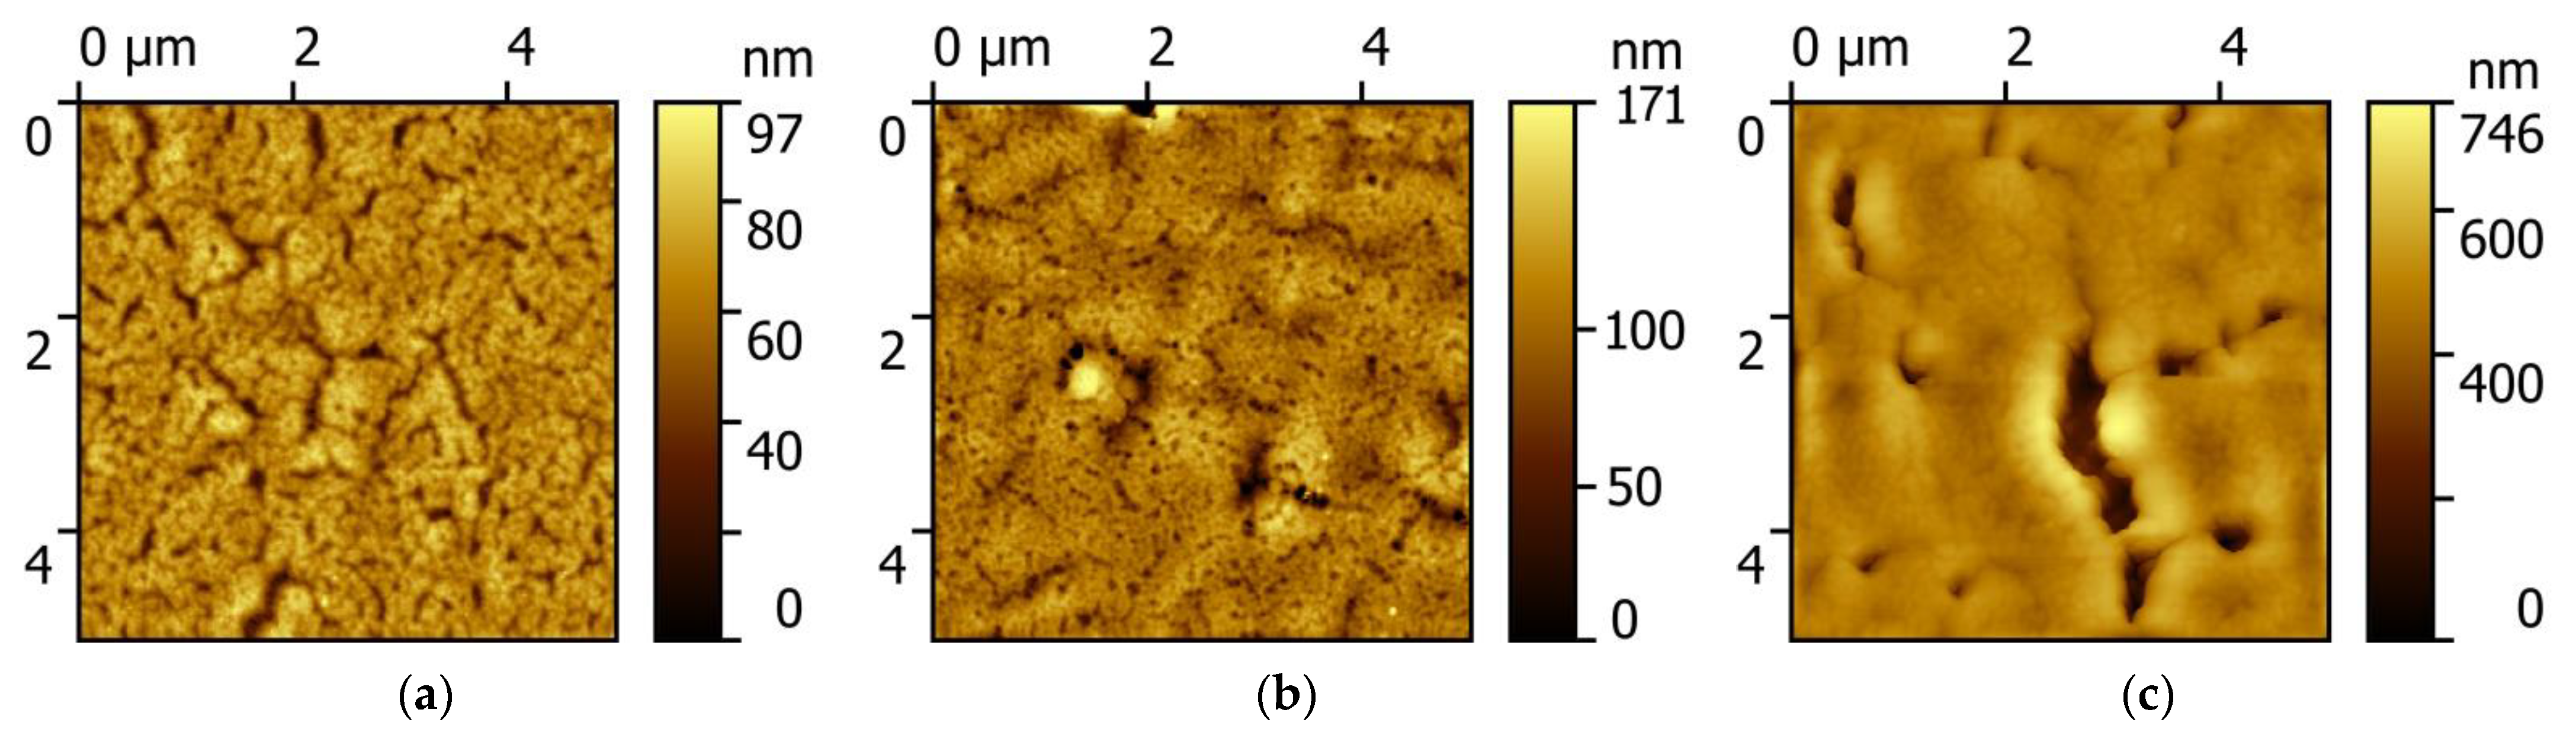
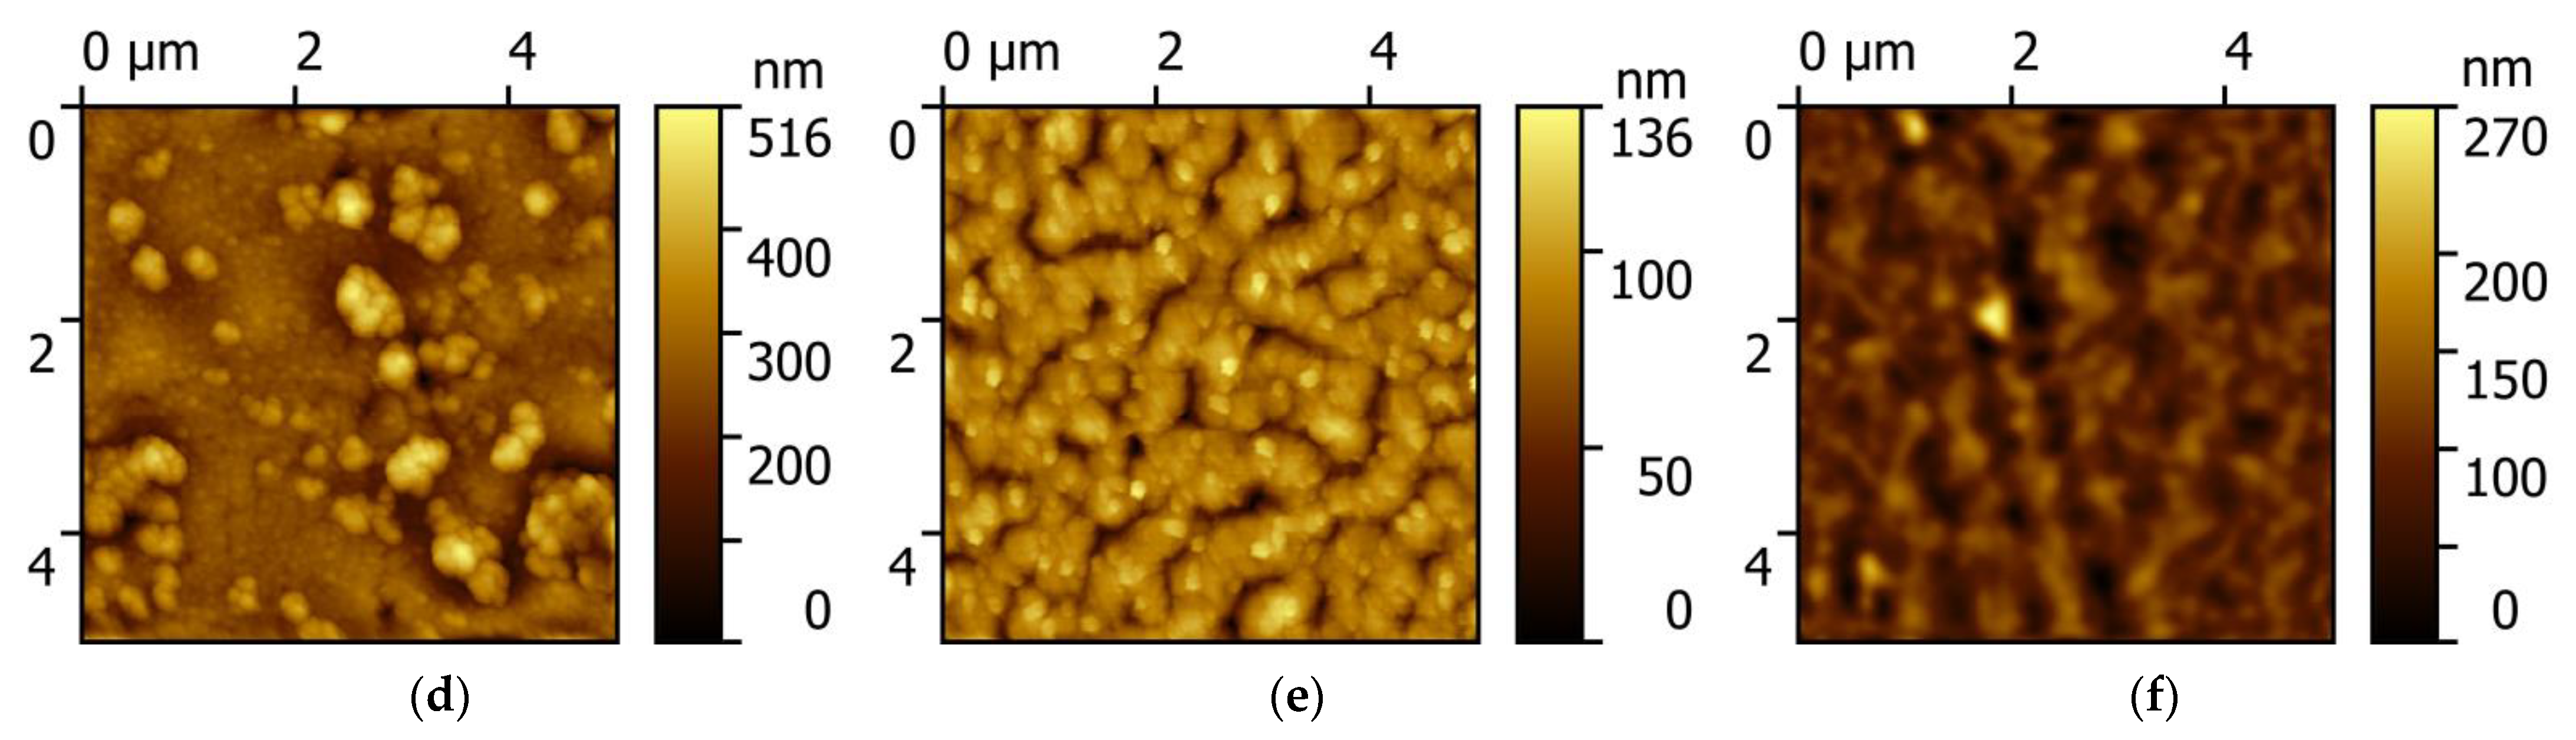
Atomic force microscopy images of the surface of PCPX-Ag nanocomposites with different silver content are shown in
Figure 1.
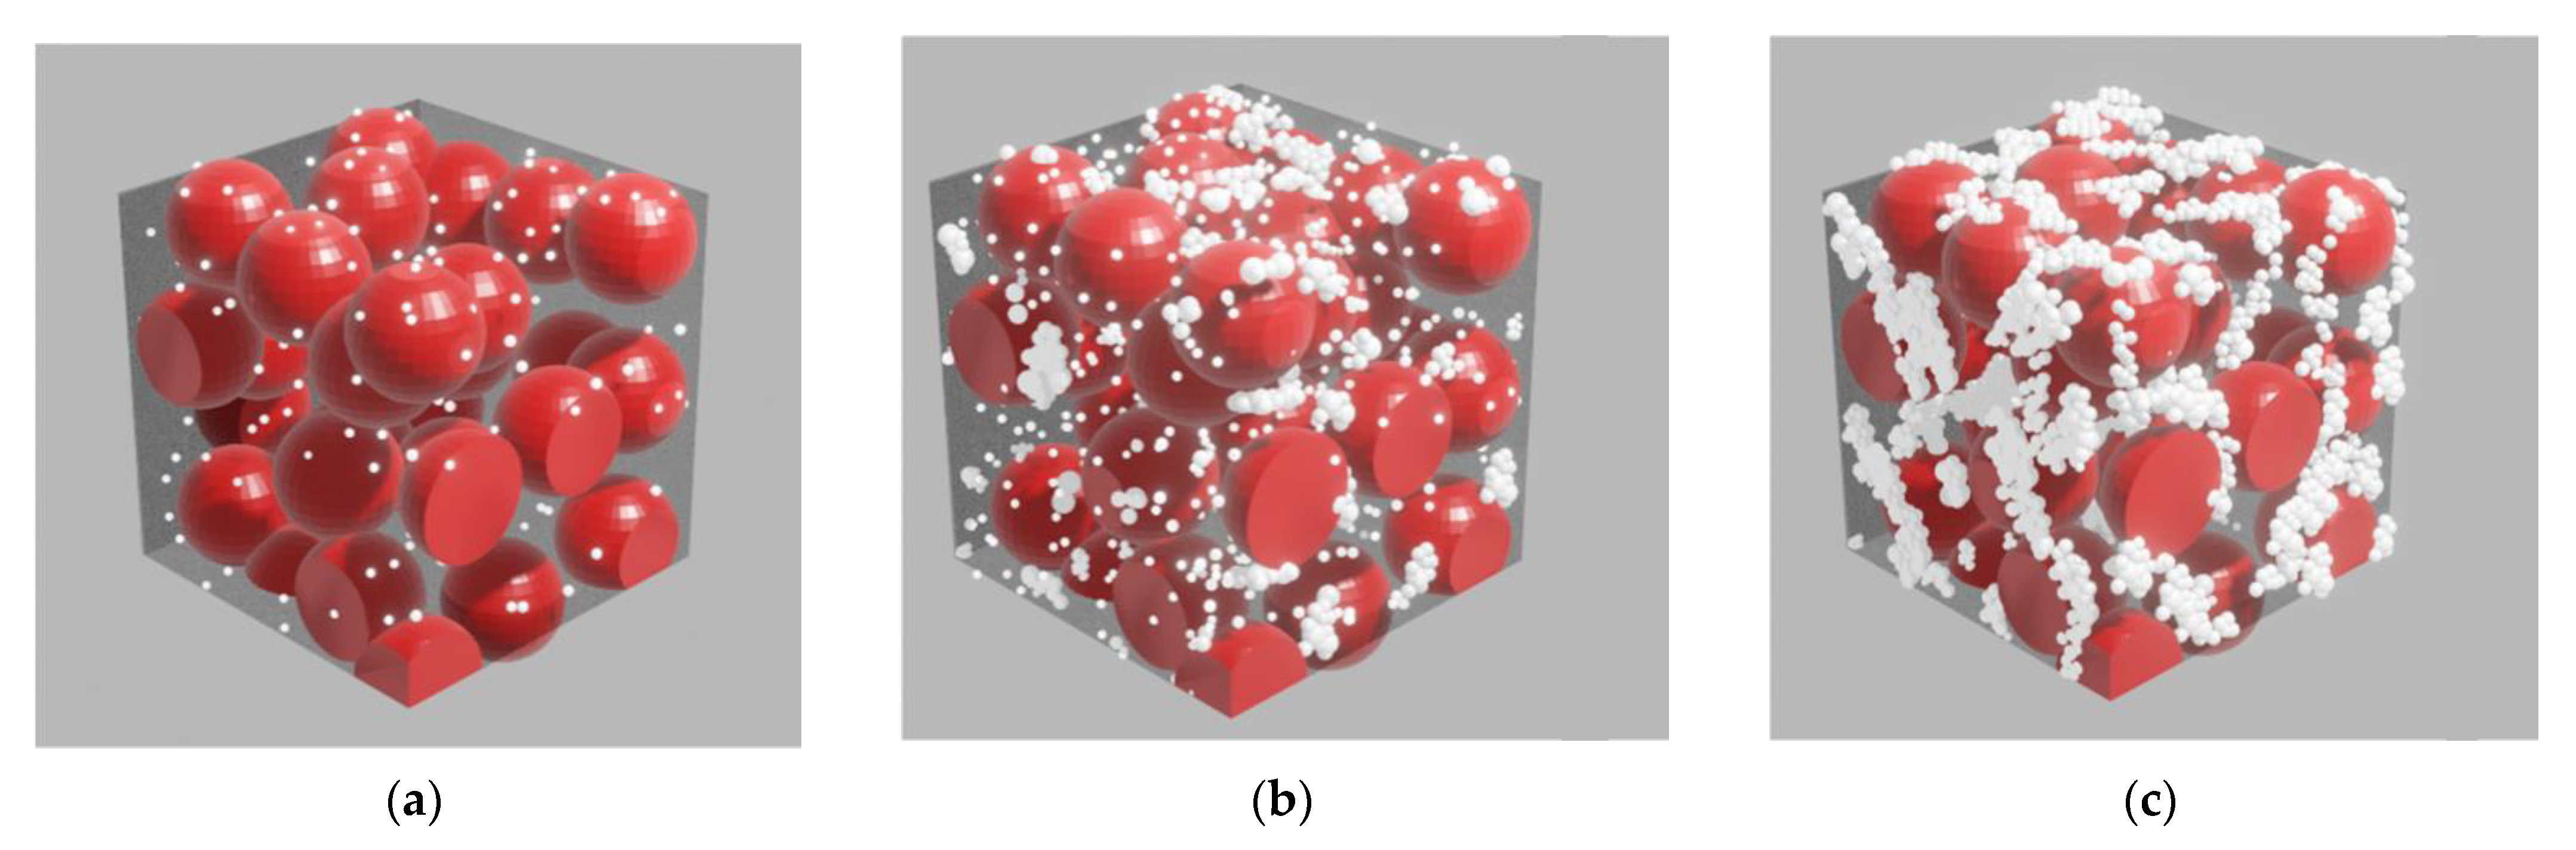
With an increase in the silver volume concentration from 2.5% to 10%, the surface of the nanocomposite is an inhomogeneous rough surface without pronounced features. However, with a further increase in concentration, characteristic objects of complex shape appear, most likely corresponding to silver aggregates. This apparently occurs because with an increase in the concentration of silver, the polymer matrix cannot dissolve such an amount of metal, and it is pushed out by the matrix and crystallizes on the surface of the nanocomposite.
Using the methods of numerical processing of the AFM measurement results, we calculated the values of the root-mean-square roughness (
rms), the height at three points (
R3z), the kurtosis (
Rku), the mean-square waviness (
Wq), and the mean wavelength profile (λ
a), which are given in
Table 1.
The root-mean-square roughness increases with an increase in the silver concentration to 12% vol., which corresponds to a maximum of 55 ± 12 and decreases with a further increase in the silver concentration to 8 ± 3 nm. The
R3z parameter is maximum for concentrations of 10% and 12% vol. and decreases with increasing concentration. The excess parameter
Rku, which reflects the degree of sharpness of the surface shape and at a value of 3 corresponds to the shape of the normal distribution [
23], remains constant within the error with an increase in the concentration of silver to 10%. With a further increase in concentration, it grows continuously. The concentration change in the excess parameter, expressed by a sharp increase at a silver content of 10% vol., indicates that a sharp change in the type of the surface morphology occurs in the nanocomposite at such concentrations. The
Wq parameter increases nonlinearly and reaches a maximum for the sample with a silver concentration of 12% vol., and then decreases. The parameter
λa increases to a maximum at 10% vol. and decreases with a further increase in the silver concentration. It can be seen from the
Table 1 that for concentrations of 10 and 12% vol., maxima are observed for some parameters responsible for the numerical representation of the surface, namely,
rms, R3 z, Wq, λ
a.
3.2. SERS Spectra Investigation
The general view of the results of scanning the SERS signal on the surface is shown in
Figure 2. These images can be used to estimate the uniformity of the distribution of the analyte signal on the nanocomposite surface.
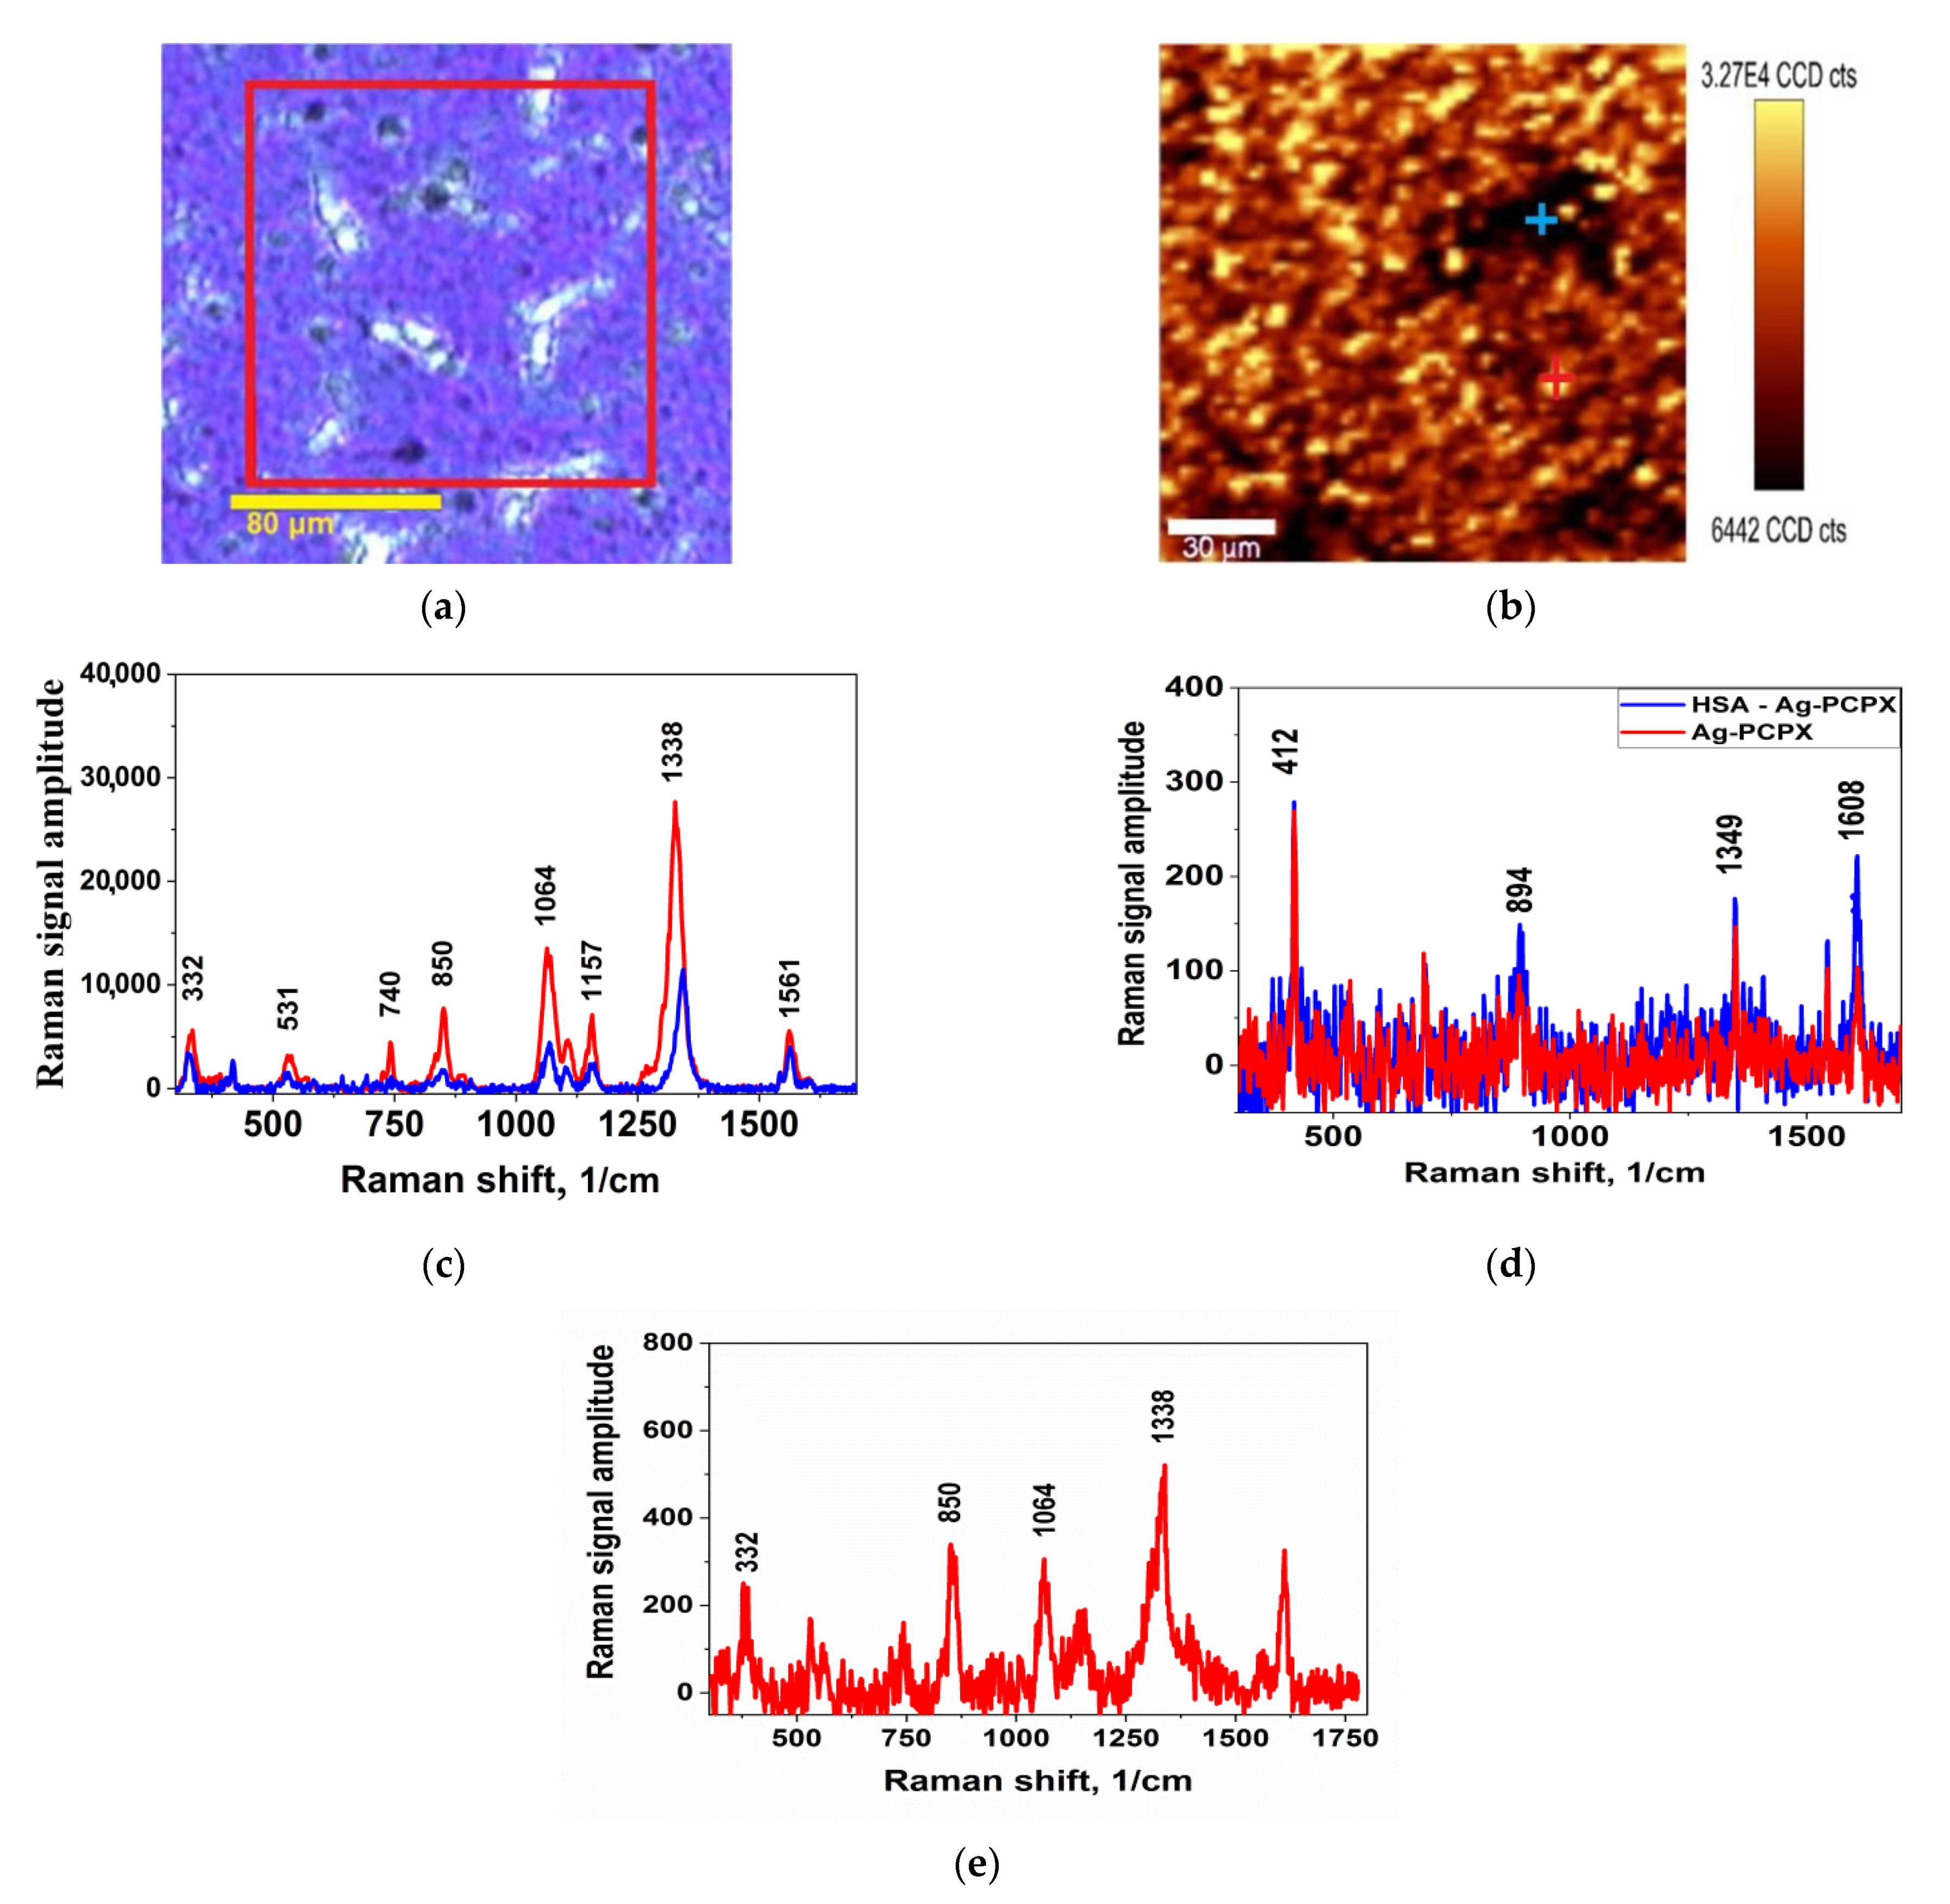
Figure 2 shows a typical sample scan result.
Figure 2a shows an optical view of the surface of the samples, and the scanned area is highlighted in a red square.
Figure 2b shows the scan result in the form of the intensity distribution of the DTNB vibration band at 1338 cm
−1. Bright dots correspond to areas with maximum signal. It can be seen that the signal is present everywhere, even in visually dark areas, but the distribution is non-uniform, which may be associated with the presence of optimal silver aggregates with the maximum enhancement effect.
Figure 2c shows the characteristic spectrum of the DTNB, where the vibration bands correspond to: 1338 and 1561 cm
−1 arising from asymmetric stretching mode of nitro-groups ν
s (NO
2) and an aromatic ring stretching mode [
24]. The peaks at 1157 and 1064 cm
−1 were attributed to CH
3 rocking, C–N stretching, and C–N bending [
25].
Figure 2e shows the spectrum of a substrate without soaking. It is characterized by the presence of several natural vibrations, but their amplitude is extremely small in comparison with the SERS spectra.
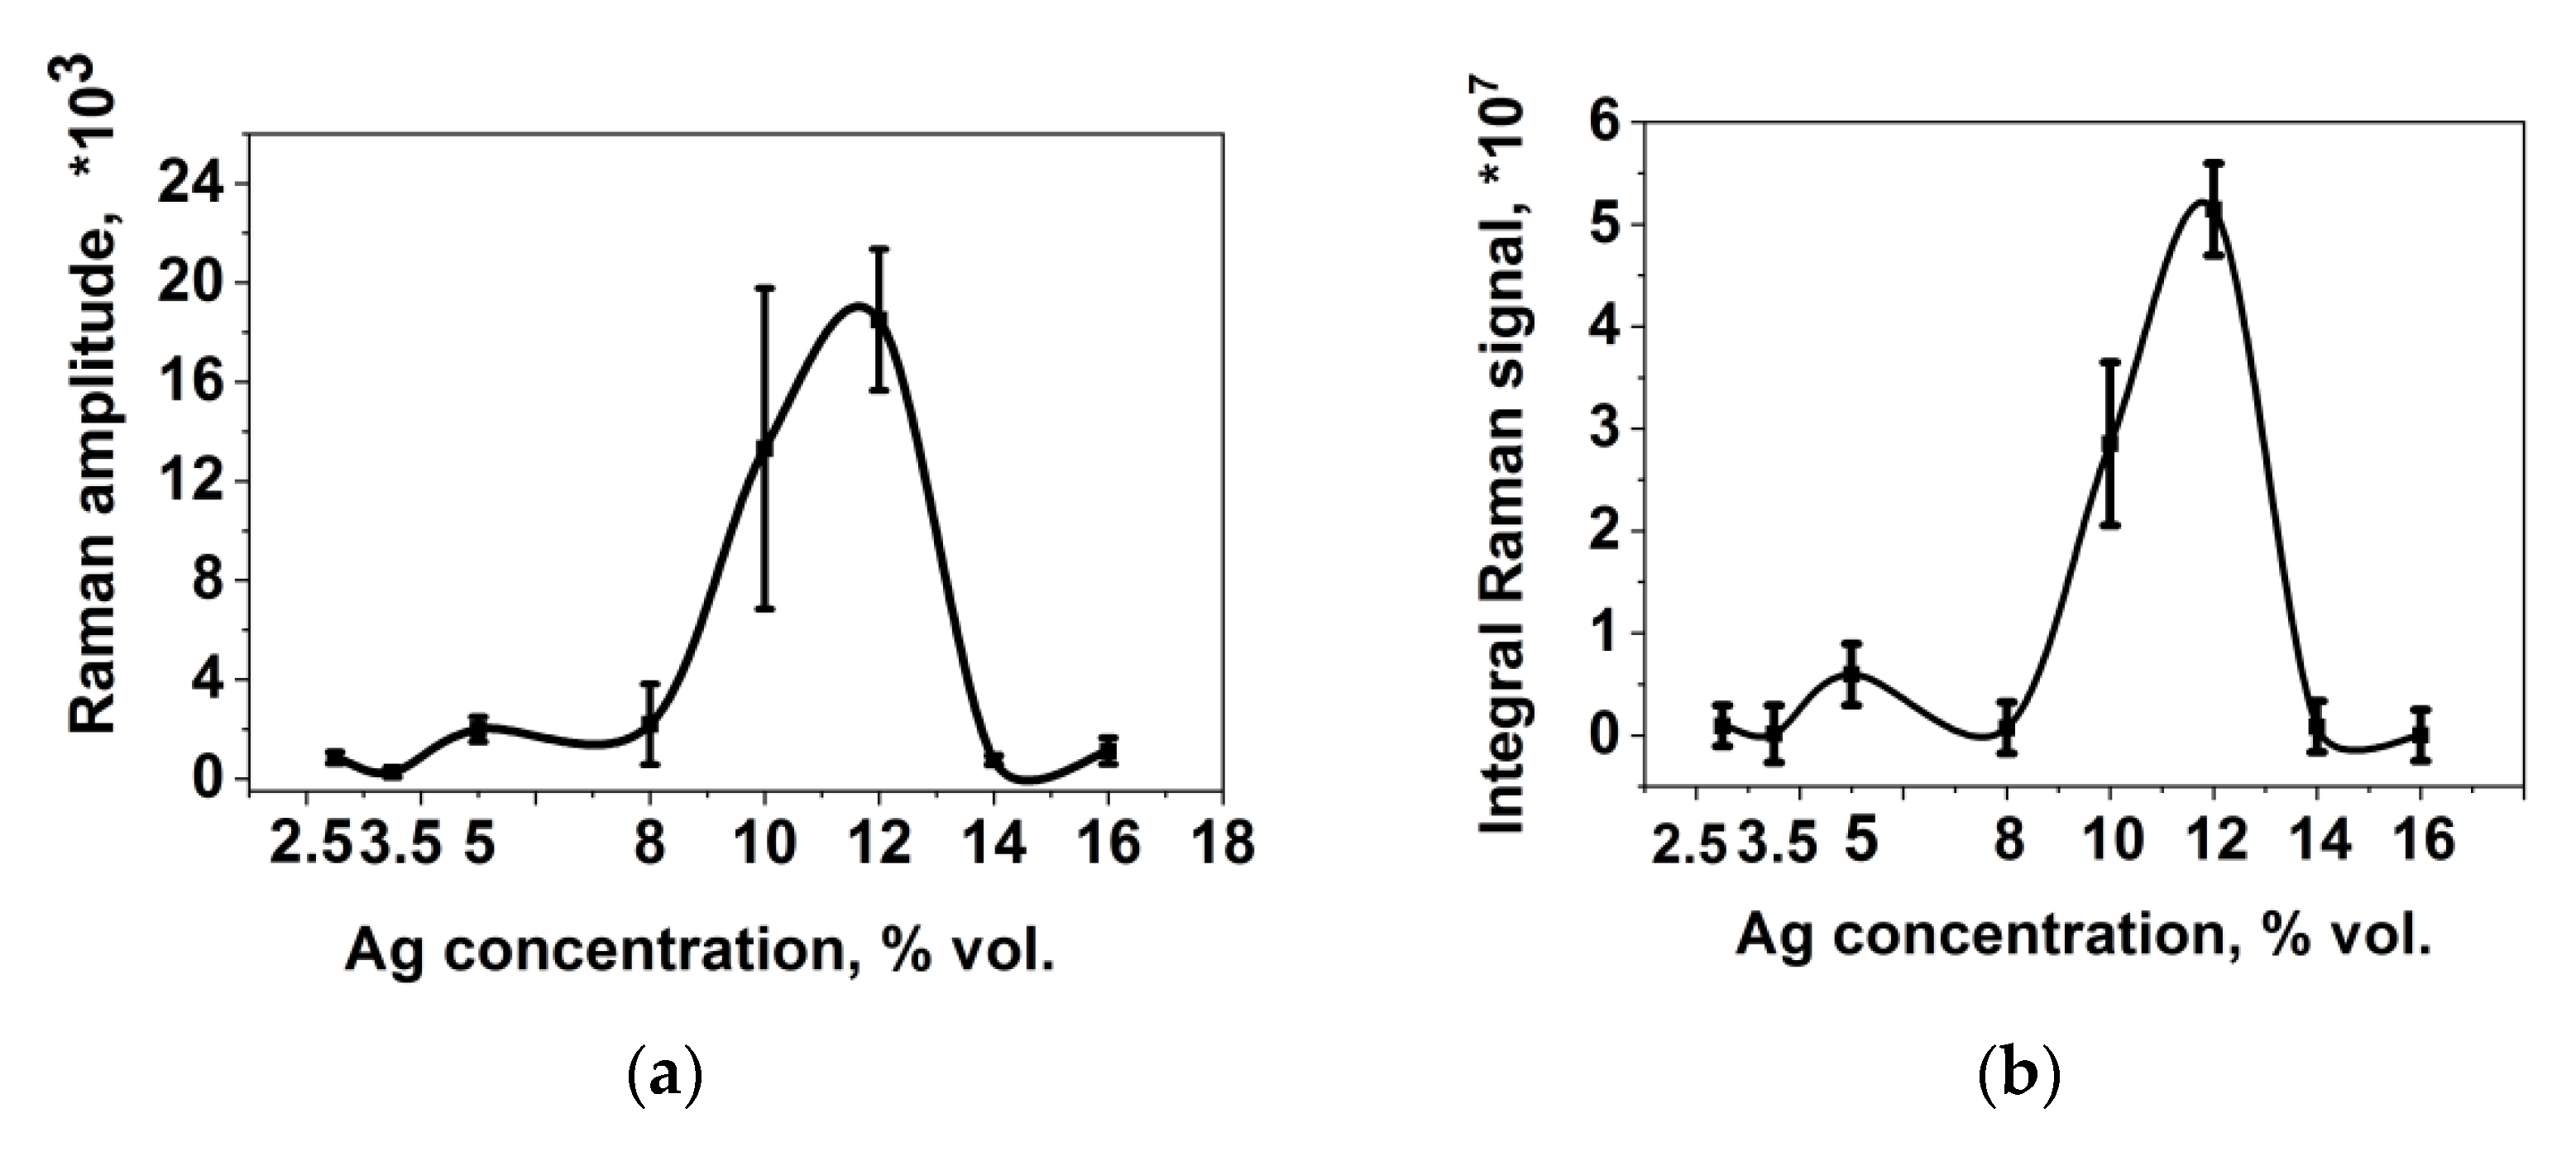
The results of studies of the SERS activity of substrates are presented in
Figure 3 in the form of the concentration dependence of the signal amplitude for the vibration band at 1338 cm
−1, taking into account the confidence interval (
Figure 3a), and the concentration dependence of the integral scanning signal for the vibration band at 1338 cm
−1, which was calculated as the sum of intensities over all points of scanning of the surface, taking into account the confidence interval for the vibration band at 1338 cm
−1 (
Figure 3b).
It follows from the graphs that the dependence of the signal amplitude on the silver concentration is characterized by a maximum at 12% vol. of Ag. However, for this dependence, large values of the confidence interval were obtained; therefore, in the future, it is more expedient to use data on mapping the surface, which excludes the error of distribution inhomogeneity. You can see that both dependences are the same in appearance, but the confidence interval for mapping is smaller, which makes the results unambiguous.
The concentration dependences for rms and R3 z are similar to the amplitude dependences and are characterized by the presence of a maximum for samples with a silver content of 12% vol. Ag. This suggests that it is at this concentration that the best conditions are created for the formation of optimal silver clusters on the surface or in the bulk of the polymer matrix, which leads to the maximum value of the SERS signal.
The enhancement factor of the SERS substrates was determined as the ratio of 1338 cm−1 DTNB amplitude measured under the same conditions on a PCPX-Ag substrate with a silver content of 12% vol., to the same signal of the analyte deposited on the glass, and was about 104.
It was discovered that selectivity is such an important property of the SERS-active substrates developed by us. The measurements were carried out under the same conditions as in the case of DTNB with a solution of a mixture of DTNB-HSA and pure HSA on a substrate with maximum enhancement. The absence of SERS spectra for high-molecular compounds HSA was found. This effect will be used when working with complex solutions, including high and low molecular weight compounds.
Figure 2d shows the spectrum after soaking in pure HSA protein solution (blue) together with the spectrum of the pure substrate (red). The absence of a protein spectrum is evident, since the spectrum coincides with the spectrum of the pure substrate.
Figure 2e shows the spectrum obtained as a result of soaking in the DTNB-HSA solution. A typical DTNB spectrum is visible, but its amplitude is lower than the DTNB amplitude in
Figure 2c since its concentration was lower. In this experiment (
Figure 2e), we efficiently identified 5 μM DTNB. This value is comparable to the values offered by commercial substrates, in particular J12853 (Hamamatsu, Hamamatsu city, Japan) and RAM-SERS-AU (Ocean Optics, St. Louis, MO, USA) which propose the determination of of 4,4′-bipyridyl (10 μM) and 1,2-di (4-pyridyl) ethylene (1 μM) substances.
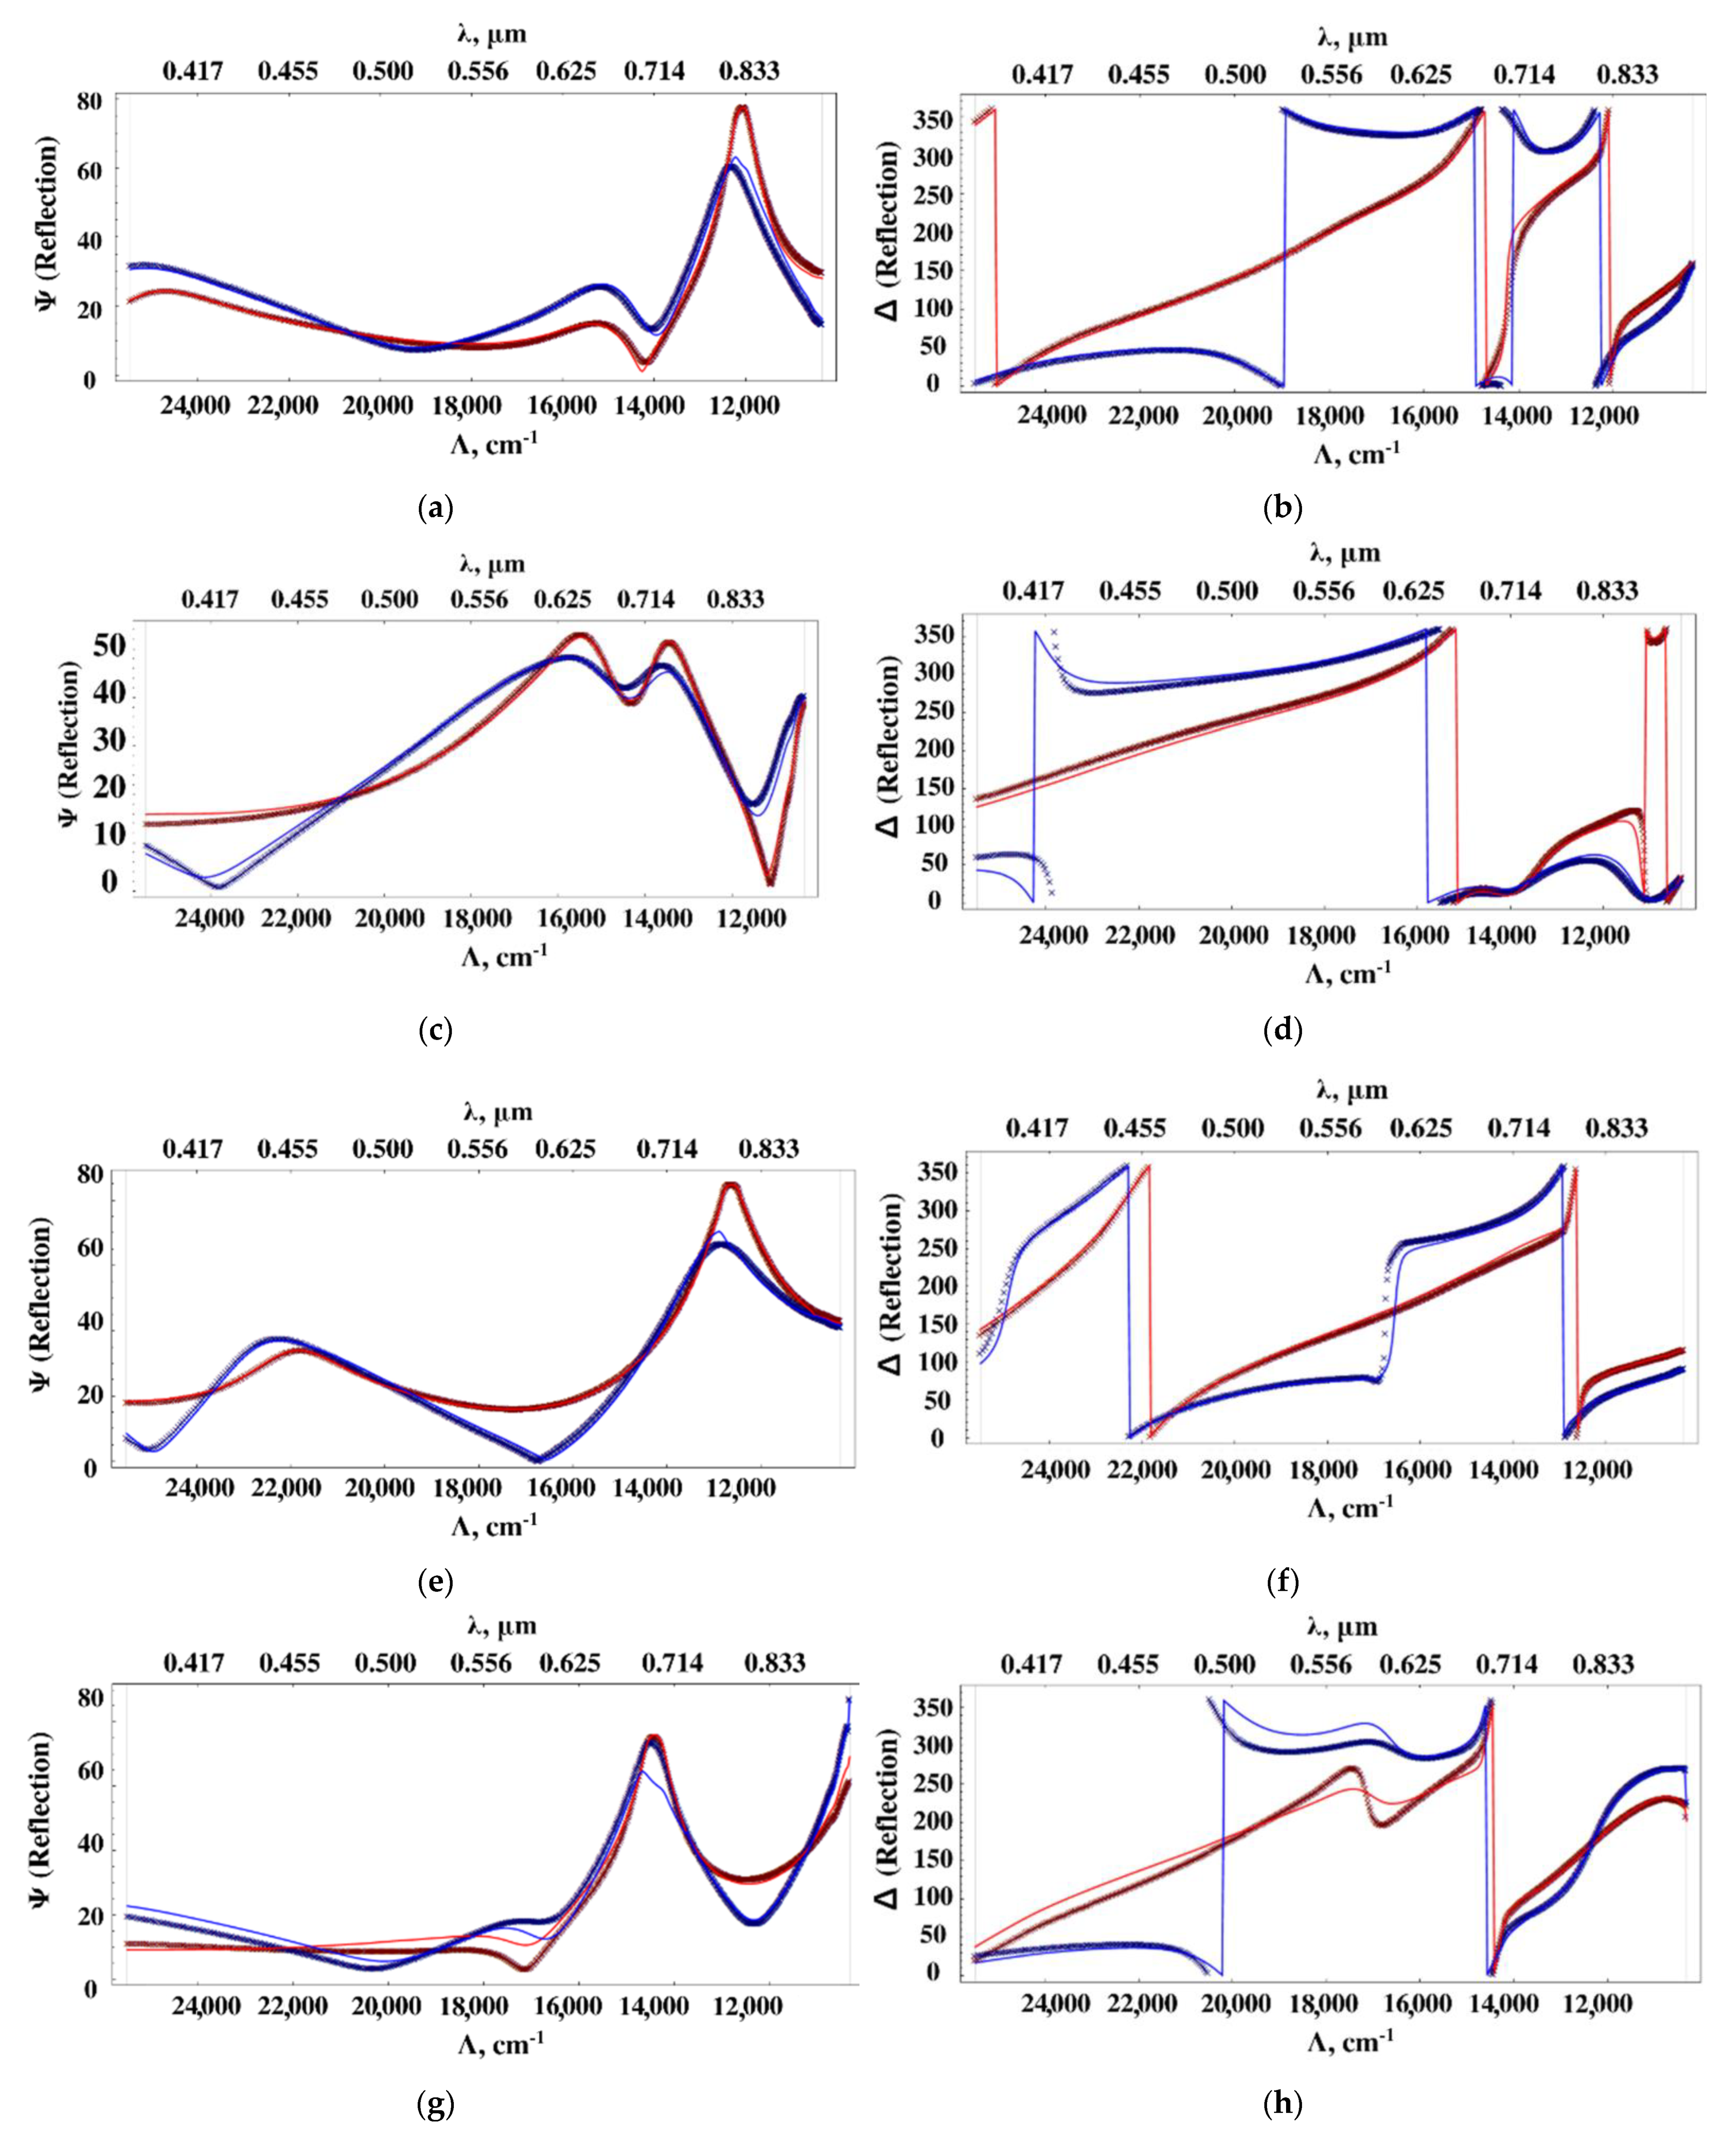
3.3. PCPX-Ag Nanocomposite Ellipsometry
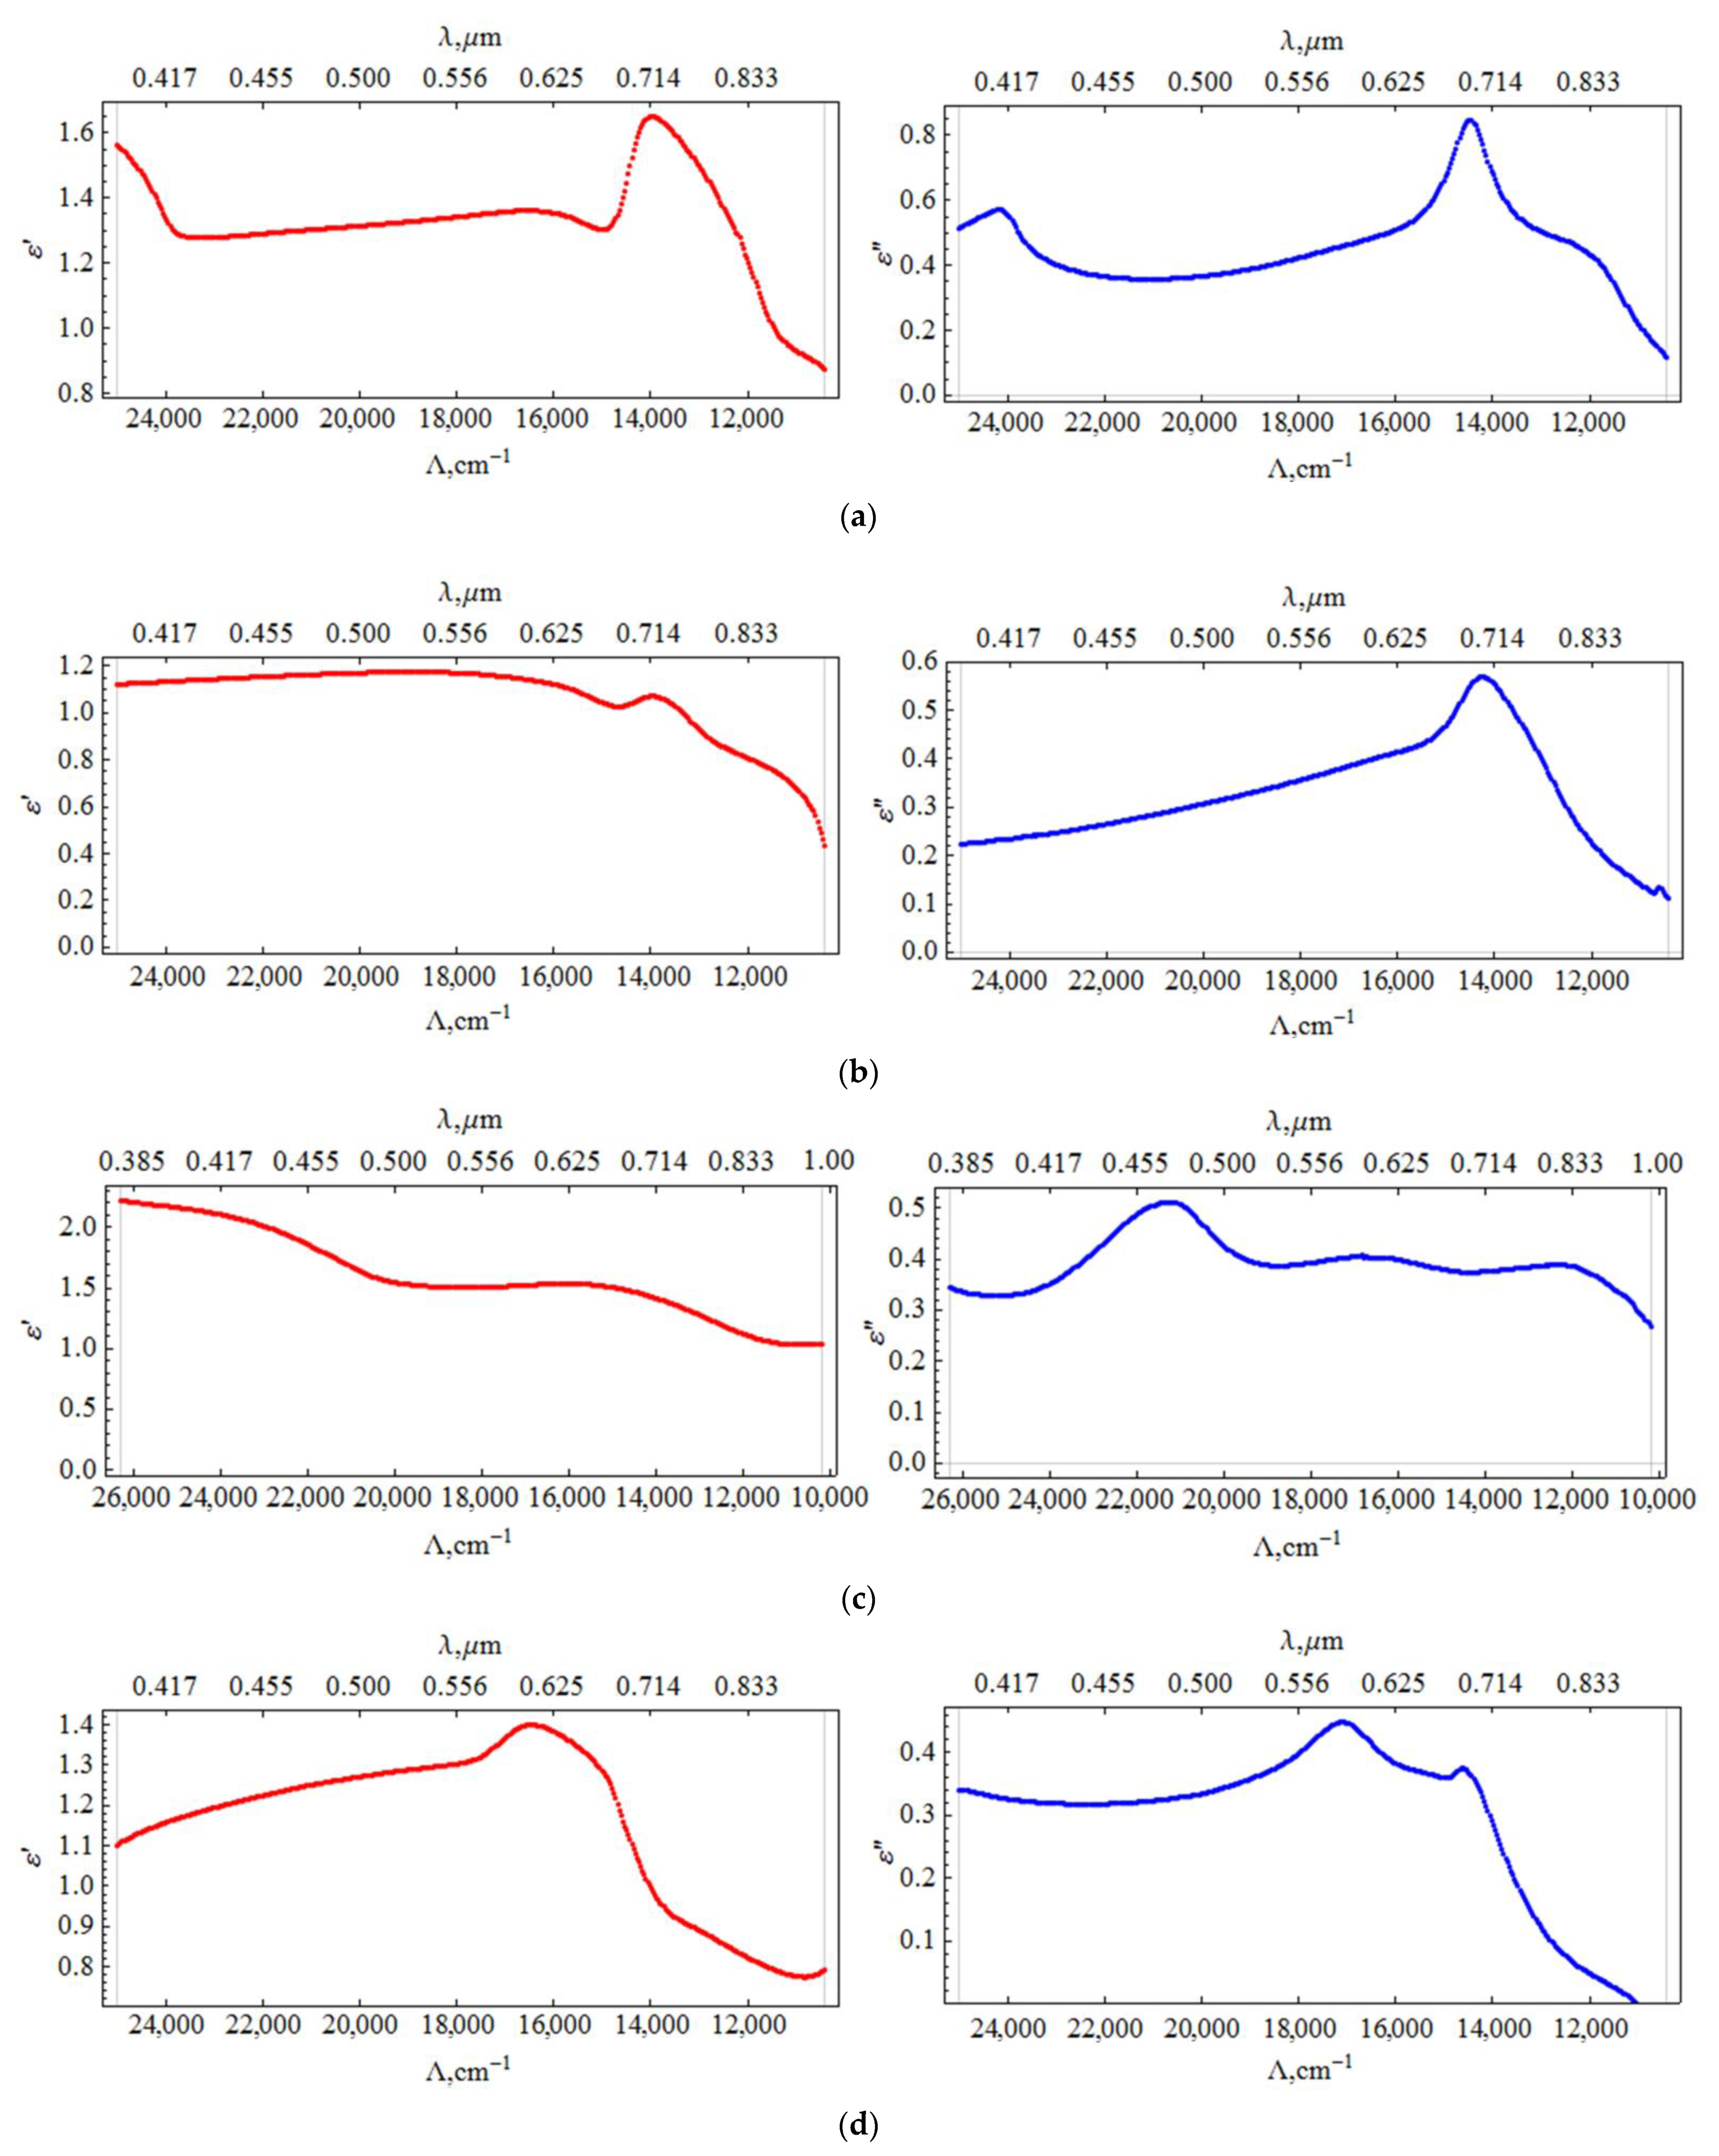
The ellipsometric spectra of the samples at 60° and 70° (crosses in
Figure 4) were measured. Based on these data, the optical characteristics (
ε’ and
ε”) of the nanocomposite films were reconstructed according to the description in the methods in order to determine the relationship of these characteristics with the SERS properties. The obtained spectra of the sample’s permittivity with silver concentrations of 5, 10, 12, 16% vol. are shown in
Figure 5, and the agreement of the ellipsometric parameters calculated on the basis of these spectra with the initial experimental data is demonstrated in
Figure 4. Note that a regular and smooth change in the dielectric permittivity spectra of the nanocomposite with concentration cannot be expected due to the sharp changes in morphology (see
Figure 1).
The results of calculating the permittivity from the experimental data are shown in the
Figure 5.
Calculations of the permittivity dispersion showed a non-monotonic change and a strong dependence on the concentration of silver. The dielectric constant of the sample with a silver content of 5% vol. contains a resonance (
Figure 5a), which is characteristic of metal-dielectric composites [
19] and is caused by plasmon resonance on metal particles. The resonance is slightly away from the 785 nm radiation wavelength used to excite SERS. In this sample, a relatively small SERS value is observed (
Figure 3). As the silver concentration increases to 10% vol., the resonance in the effective permittivity weakens. At a concentration of 12% vol., it completely disappears, while the SERS value is maximal. At a concentration of 16% vol., the SERS value decreases again. Hence, the value of the SERS is determined not by the resonance of the effective permittivity, but, probably, by the number of certain silver clusters optimal in size and distribution over the surface of globules, that is, we are dealing with plasmon resonance on rather large separate particles, (4–10 nm) and clusters consisting of several particles. At high concentrations, the size and concentration of particles reaches a level where they coalesce into large three-dimensional clusters, which leads to a decrease in the number of “hot spots” and an increase in losses. In [
19], from AFM and SEM data, studies of the surface and structure of composites, and the results of small-angle X-ray studies, the dependences of the shape and size of silver particles in nanocomposites on its volume concentration are presented. For concentrations of 10 and 12% vol., the size distribution has been shown to be bimodal, with peaks shifted towards higher values. We have proposed a model that is consistent with these data and the optical properties of the composite. We assume that concentrations of 10–12 % vol. correspond to the maximum filling of interglobular pores with separate, non-coalescing silver clusters. That is, samples with such a concentration not only contain more silver, but also contain larger particles.
Figure 6 shows a diagram of the size distribution of silver clusters for various silver concentrations, which is likely to be realized in the nanocomposites under study.
Morphological parameters (
Table 1), such as
rms,
R3z, Wq, λ
a, also reach a maximum at Ag concentrations of 10–12% vol. In this case, the parameters
Wq and λ
a characterize the waviness of the surface. λ
a is close to the wavelength of the exciting radiation, while λ
a determines the figure of merit of the formed quasiperiodic structure. Together, these parameters reflect the correlation between the morphology and the ability of the nanocomposite to enhance the electromagnetic field. The rms and
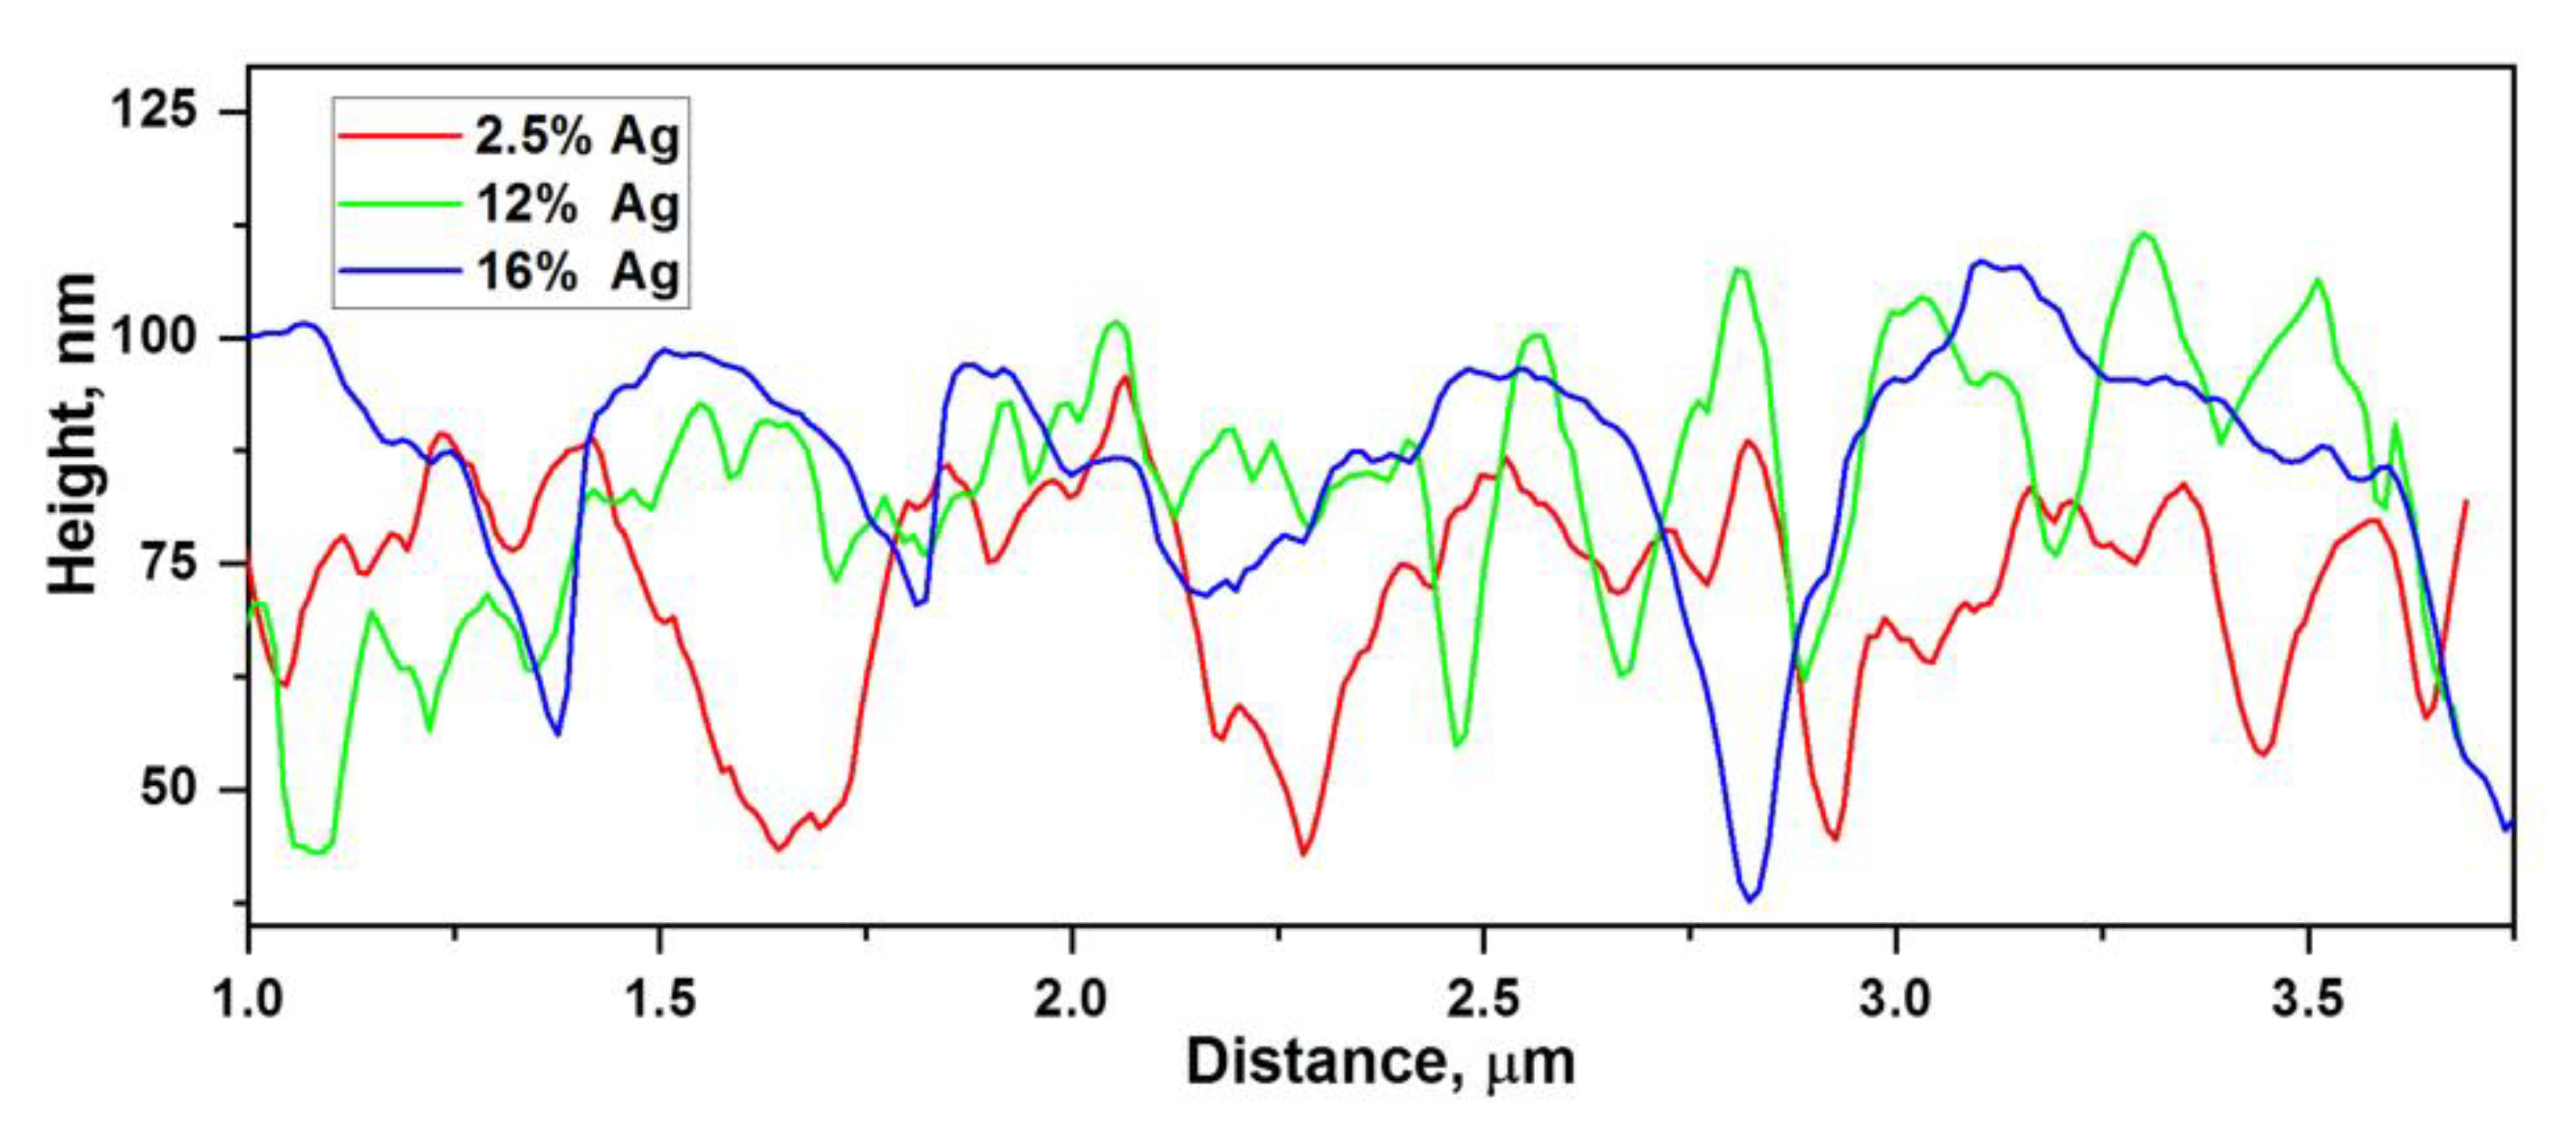
R3z parameters reflect the number of hot spots formed on the surface. The waviness on the scale of magnitude is associated with the globular structure, and the root-mean-square roughness is associated with the size of the silver clusters. Surface profiles also reflect the existence of three types of composites (
Figure 7): with a silver concentration of up to 10%, from 10% to 12% vol., and above 12% vol.
Figure 7 shows three main types of surface profiles. In terms of the period and
rms, the groups with high and low silver content are similar, which indicates a small number of hot spots, since at low Ag concentrations the relief is determined by the globular structure of the pure polymer [
19], and at ultrahigh concentrations, the relief is determined by large agglomerates of silver, which do not contain hot spots. The profile of the group with average concentrations looks the most developed, which is confirmed by the maximum values of the
rms roughness for it. This suggests that there are no large and small agglomerates, but there are some medium ones, which makes its morphology different from other groups and the most branched, containing the maximum number of hot spots, which is confirmed by measurements of the SERS spectra.
4. Conclusions
Substrates based on metal-polymer nanocomposites PCPX-Ag formed using the vapor-phase polymerization method have shown practical importance for use as active SERS substrates. The enhancement factor for them can reach values up to 104.
The enhancement dependence of the spectrum amplitude on the silver content in the polymer matrix was determined. It is shown that the enhancement depends nonlinearly on the silver content. There is an optimal concentration about 12% vol., at which the SERS effect reaches the highest values, which is determined by the optimal microstructure of the substrates at a given concentration. This is confirmed, in particular, by the results of processing AFM images by methods of mathematical statistics.
The presented substrates are selective and can be used to separate mixtures of complex composition, including high and low molecular weight compounds, since substrates only realize the SERS effect for low molecular weight substances.


 ,
, 


