Article

Effects of Graphene-Based Fillers on Cathodic Delamination and Abrasion Resistance of Cataphoretic Organic Coatings

1
Department of Industrial Engineering, University of Trento, Via Sommarive 9, 38123 Trento, Italy
2
Fontana Corrosion Center, The Ohio State University, Columbus, OH 43210, USA
*
Author to whom correspondence should be addressed.
Coatings 2020, 10(6), 602; https://doi.org/10.3390/coatings10060602
Submission received: 12 June 2020 / Revised: 21 June 2020 / Accepted: 23 June 2020 / Published: 26 June 2020
(This article belongs to the Special Issue Advanced Hybrid Coatings and Thin Films for Surface Functionalization)

Abstract

:
This study aims to demonstrate the excellent protective performance of functionalized graphene oxide (fGO) flakes in acrylic cataphoretic coatings. The filler content provides an important contribution in improving the chemical and mechanical resistance of the acrylic matrix. The morphology of the fillers was first investigated by optical and electron microscopy, analysing the distribution of the fGO flakes within the polymer matrix. After that, the flakes were added to the cataphoretic bath in different concentrations, resulting in four series of samples. The cathodic delamination of the coatings was assessed with cathodic polarization cycles and with measurements carried out with a scanning Kelvin probe. Finally, the abrasion resistance at the macroscopic and microscopic level was studied by scrub testing and scratching atomic force microscopy analysis, respectively. The incorporation of fGO at the optimized concentration of 0.2 wt.% greatly increases the cathodic delamination resistance of the acrylic matrix, resulting in an effective barrier against the effects of absorbed aggressive substances. Graphene-based fillers also enhance abrasion resistance, thanks to their high mechanical strength. Thus, this work demonstrates the great protective benefits that can be obtained when using fGO flakes as reinforcing fillers in cataphoretic coatings.

1. Introduction

Graphene is a recently discovered material of enormous academic and industrial interest, as it shows a combination of physical and mechanical properties that make it uniquely suitable for specific applications that require considerable technological performance. This novel material is defined as a 2D carbon allotrope, whose atoms represent the sp2 hybridization vertex of a hexagonal lattice, forming a honeycomb structure of monoatomic thickness with a carbon–carbon bond distance equal to 0.142 nm [1,2,3].
The graphene-based flakes show a very stable structure; the carbon atoms connections, in fact, are so strong that they can endure external forces and avoid atomic reconfiguration, providing graphene with remarkable mechanical strength [4,5,6]. The excellent mechanical properties, combined with low density, make this material appropriate for use in various industrial applications. The intrinsic strength of a defect-free graphene sheet was measured using nanoindentation atomic force microscopy (AFM), indicating stiffness values of the order of 300–400 N/m and breaking strength of 42 N/m [6]. The tensile strength and elastic modulus values of graphene have been reported to be 125 GPa and 1.1 TPa [6], respectively. This material, therefore, shows, for the same thickness, a strength 100 times greater than steel. These characteristics make graphene an ideal candidate for reinforcement in composite materials [7,8,9,10], as filler for metallic [11]; ceramic [12,13]; and, above all, polymeric matrices [14].
Nowadays, in fact, graphene is often employed to improve polymer electrical and mechanical properties, with the aim of making multifunctional layers [15,16,17,18]. In this sense, graphene enables the creation of protective composite coatings, with applications in the field of flame-retardant barriers [19,20,21,22], wear resistant layers [23,24], and antifouling coatings [25,26].
However, among the various protective applications, graphene has found greater success in the field of coatings for corrosion protection [27,28,29,30]. Over the years, in fact, various studies have been carried out on the characteristics of graphene, finding, for example, the high impermeability against molecules such as helium [31,32]. If added in a polymeric matrix, graphene derivatives could theoretically lead to the “tortuous path effect” and “nano-barrier wall effect” [31,32] for the diffusing aggressive molecules. The tortuosity of the diffusion path is influenced by the graphene high aspect ratio; sheet orientation; details of the graphene–polymer matrix interface; the crystallinity of polymer itself; and, mostly, the filler exfoliation and dispersion in the polymer matrix [33,34].
Thus, the dispersion of the graphene-based filler is a fundamental and delicate issue; in order to effectively improve the properties and performance of the composite coating, the sheets must be homogeneously distributed inside the polymer matrix. However, the dispersion of graphene and graphene oxide (GO) flakes is very complex. Graphene sheets, in fact, tend to agglomerate, owing to van der Waals forces [35,36], while functional groups introduced on the surface of the flakes, together with the hydrogen bonds, increase the difficulty for exfoliation of graphene oxide in polymeric matrixes [18,37]. The functional groups present on the surface of the graphene oxide flakes, however, can be exploited for chemical covalent modification processes, in order to improve the dispersion efficiency of the fillers into the polymeric matrix. The literature offers several studies related to functionalization processes of graphene-based powders using organosilanes, which not only intercalate between the flakes, distancing them from each other, but also anchor the graphene sheets to the polymeric matrix, preventing their agglomeration [38,39,40,41,42,43].
In previous studies, different types of silanes have been analysed [44], with particular attention to their grafting mechanism and interaction with GO flakes. Higher affinity and reactivity of (3-aminopropyl) trimethoxysilane (APTMS) were found compared with other organosilanes. Subsequently, these functionalized fillers were used in the production of cataphoretic coatings, with high corrosion resistance performances. In addition to the type of silane employed during the GO functionalization process [45], the quantity of fillers added to the cataphoretic bath also represents a fundamental parameter in improving the properties of the polymer-based coating [46]. Even though electrodeposition by cataphoresis is a process that is widely used in the industry for the production of organic coatings with excellent adhesion and high corrosion protection properties [47,48,49,50,51], this technique has never been employed to deposit composite layers. However, our previous studies [37,45,46] confirmed that functionalized graphene oxide (fGO) flakes, if properly distributed within the polymeric matrix, promote the corrosion protection performance of cataphoretic coatings.
In this work, fGO flakes were added into an acrylic cataphoretic bath, and the effects of filler concentration on the cathodic delamination and abrasion resistance of the coatings deposited on carbon steel substrates were studied. Stereomicroscopy was used to determine the distribution of graphene sheets inside the polymeric matrix and their possible aggregation. The abrasion resistance was evaluated by means of a scrub test, accompanied by electrochemical impedance spectroscopy (EIS) measurements and scanning electron microscopy (SEM) observation, while the different behavior of matrix and flakes in micro abrasion conditions was determined by scratching atomic force microscopy (AFM) analysis. The resistance to abrasion and wear is, in fact, a fundamental feature for a coating and its protective performances. Finally, the behavior of the samples in an aggressive environment was monitored by an EIS/cathodic polarization cycles (AC–DC–AC, alternating-direct-alternating current method [52]), and the cathodic delamination of the composite coatings from the steel substrate was evaluated using scanning kelvin probe (SKP) measurements.

2. Materials and Methods

2.1. Materials

Graphene powder was employed as a raw material, provided by COMETOX s.r.l. (Milan, Italy). The sheets possess an average thickness of 6 nm, an average particle diameter of about 25 µm, and a surface area ranging from 120 to 150 m2/g. (3-aminopropyl)trimethoxysilane (APTMS), nitric acid, toluene, ethanol, and acetone were supplied from Sigma-Aldrich and used as received. The 40 × 70 × 2 mm3 carbon steel substrate (Q-panel type R (0.15% C—Fe bal.) was supplied by Q-lab (Westlake, OH, USA). The cataphoretic bath Arsonkote 202 Acy Cata W202X30 was provided by Arsonsisi (Milan, Italy). This industrial product is based on modified acrylic resin, with glycols employed as the solvent.

2.2. fGO Synthesis

The powders used as reinforcing fillers for the cataphoretic coatings were prepared according to the procedures described previously [45,47].
Graphene powders were oxidized by means of a simple nitric acid treatment: a mixture of 2 g graphene flakes and 60 mL of 2.6 M nitric acid solution was refluxed for 10 h, and subsequently allowed to cool down to room temperature under magnetic stirring (RH-basic, IKA®-Werke GmbH & Co. KG, Staufen, Germany). The graphene oxide GO powders were then subjected to centrifugation (5 cycles of 10 min at 5000 rpm), washed with distilled water, and dried in air at ambient temperature.
Functionalization was achieved by mixing 0.7 g of graphene oxide powder into 1.05 g of (3-aminopropyl)-trimethoxysilane (APTMS) and 50 mL of toluene, heating it to 110 °C with constant reflux for 4 h and stirring for 24 h at room temperature. Finally, the fGO powder was filtered, washed with ethanol, and dried in an oven at 50 °C for 24 h.

2.3. Deposition of Acrylic-fGO Coatings

Carbon steel plates were pre-treated by degreasing in acetone with ultrasonic agitation followed by sandblasting process with corundum powder (0.2 mm diameter, 70 mesh), and then another final acetone degreasing to remove possible contamination from the substrate.
The 200 mL acrylic cataphoretic bath was formulated following the supplier’s specifics, using a water–resin ratio equal to 2. A 300 × 50 mm2 flat stainless steel plate was used as anode, placing it in front of a sample acting as cathode, at a distance of 80 mm. The coatings were deposited following the procedure described previously [46]; the cataphoretic bath was stirred for 30 min with an ultrasound probe during the addition of the fGO flakes, to facilitate the distribution of the fillers. Three different amounts of fillers were added into the bath, 0.1, 0.2 and 0.5 wt.% of fGO to obtain three families of coatings, respectively. The coatings will be referred to by the concentration of fGO added to the bath. For a complete comparison between the performances of the samples, all the process parameters were kept constant: electrodeposition was carried out at a voltage of 75 V for 120 s and samples were then cured in an oven at 140 °C for 45 min. Control samples were also prepared with a pure acrylic matrix layer, free of fillers. The four samples series are summarized in Table 1 with the sample nomenclature.

2.4. Characterization

The thicknesses of the composite layers were measured by means of a digital thickness gauge (Phynix Surfix—Neuss, Germany), and the filler dimensional distribution within the coatings was investigated with an optical stereomicroscope (Nikon SMZ25—Minato, Tokyo, Japan). The surface morphology of the flakes was investigated with a scanning transmission electron microscope (S/TEM, ThermoFisher TALOS F200S—Waltham, MA, USA).
The corrosion protection performance was evaluated using an accelerated AC–DC–AC method [52], whose cycles consisted of three steps, as shown in Figure 1:
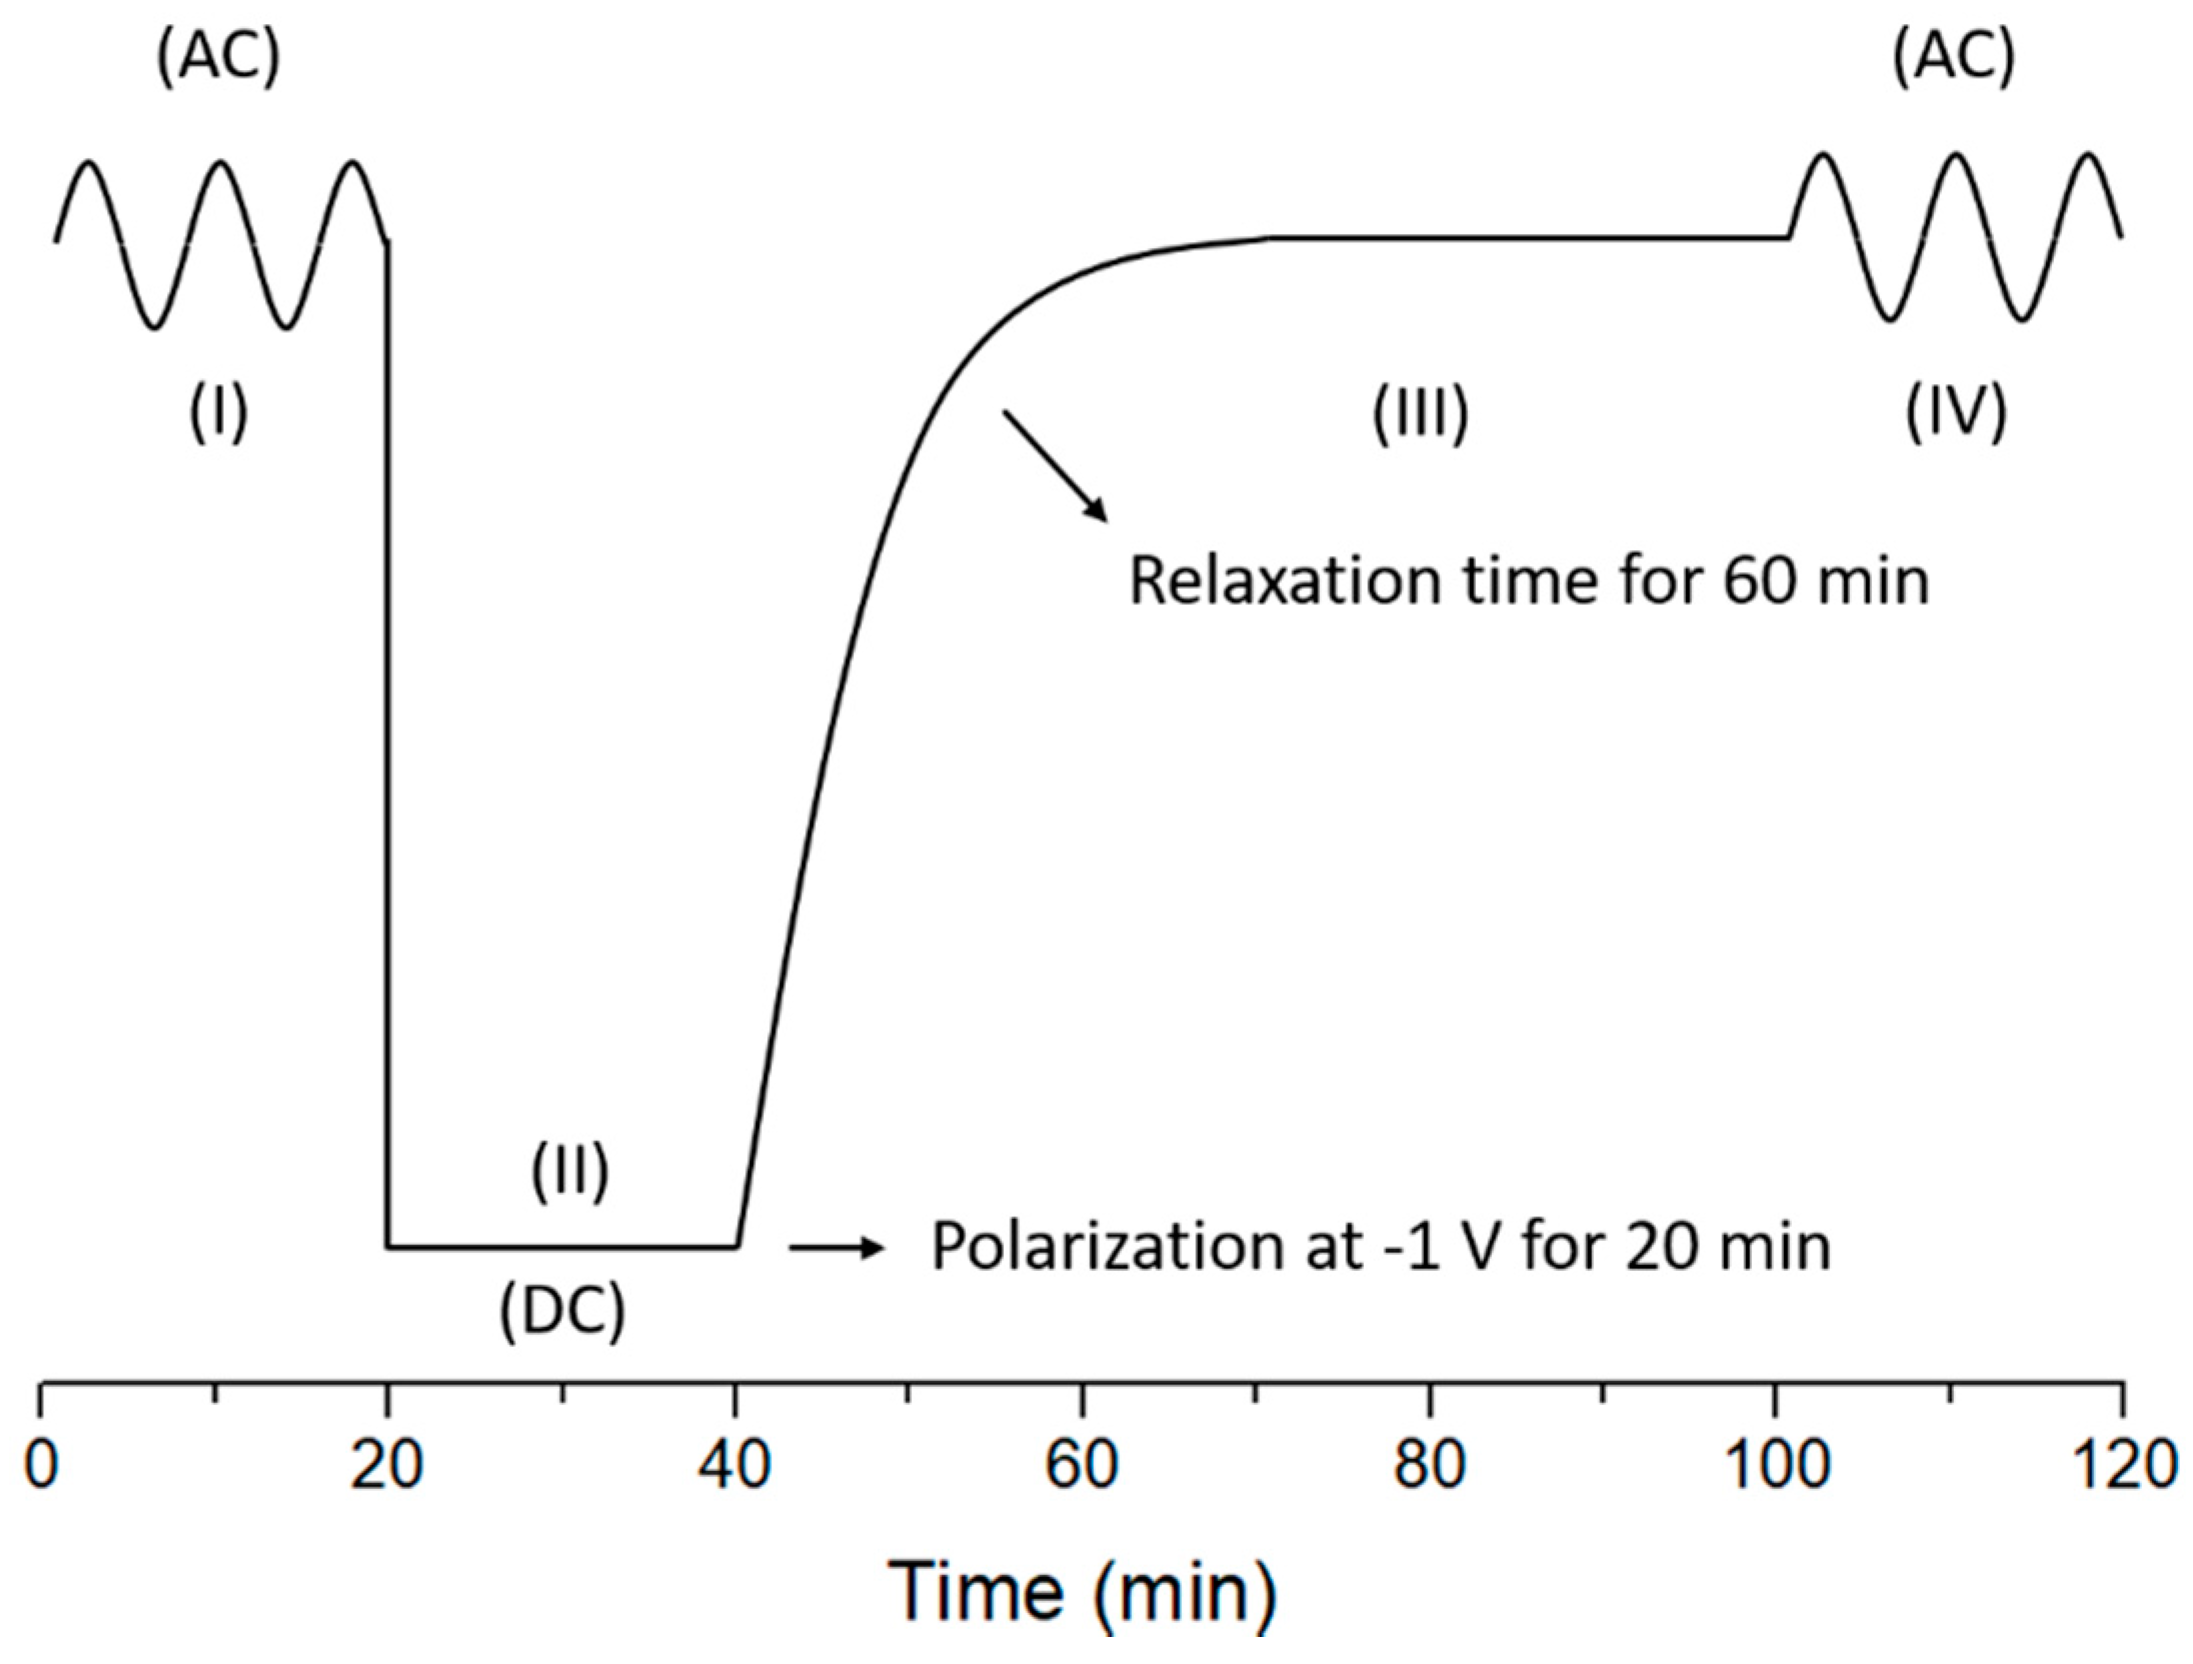
  • an electrochemical impedance spectroscopy (EIS) measurement at the open circuit potential (OCP);
  • constant cathodic polarization at −1 V Ag/AgCl for 20 min;
  • OCP measurement for 1 h to stabilize the polarized samples.
These electrochemical measurements were carried out with the Parstat 2273 potentiostat (Princeton Applied Research, Oak Ridge, TN, USA) and PowerSuit ZSimpWin software (version 3.5). The EIS measurements involved an AC (alternating current) excitation signal of 15 mV (peak-to-peak) over the frequency range of 105–10−2 Hz. A platinum counter electrode and an Ag/AgCl reference electrode (+207 mV versus standard hydrogen electrode (SHE)) immersed in a 3.5 wt.% sodium chloride solution were used. The testing area of each sample was approximately 4.9 cm2. The DC (direct current) cathodic polarization step at −1 V Ag/AgCl was effective at promoting cathodic delamination of the coating; lower potentials were avoided to minimize hydrogen evolution reactions. The test cycle shown in Figure 1 was repeated several times for each specimen.
The cathodic delamination of the coatings was evaluated with SKP (Wicinski-Wicinski GbR- Dusseldorf, Wuppertal, Germany) measurements, using a height-regulated SKP, following a well-established procedure [53,54,55,56]. The SKP tip was calibrated against a Cu/CuSO4 electrode and the potentials were collected and reported with respect to the standard hydrogen electrode (SHE). The coated samples were exposed in humid air for 3 h to reduce electrostatic charging on the composite layers, while the relative humidity during the test was kept above 95%. A sample uncoated region was isolated on three sides by a silicone dam and filled with 3.5 wt.% NaCl solution, to promote the cathodic delamination process. A line scan from the defect region over the coating was performed and repeated every 4 h, for a total of 36 h sample exposure in the SKP chamber. The experiments were duplicated for each condition.
The abrasion resistance of the composite coatings was assessed by AFM (Veeco Dimension 3000—Plainview, NY, USA) scratching in contact mode with a diamond-coated Si tip (force constant, k = 40 N/m, tip radius = 18 nm). The experiments were performed over scan areas of different dimensions, at 1 line/s and a scan angle of 0°.
The scrub test was carried out to study how the filler affects the wet abrasion resistance of the acrylic matrix. An Elcometer 1720 Abrasion and Washability Tester (Manchester, UK) was used, following the BS EN ISO 11998 standard [57]. The coatings were subjected to abrasion steps of 200 cycles (37 cycles per minute) each, with the support of 2.5 g/L sodium n-dodecylbenzenesulfonate solution, to simulate wet abrasion processes. After each step of abrasion, the samples were washed with distilled water and dried in an oven at 60 °C for 30 min, in order to analyse the weight loss of the coatings and evaluate their resistance to wet abrasion. Moreover, the protective performances of the coatings were evaluated with EIS measurements (Parstat 2273 potentiostat-Princeton Applied Research, Oak Ridge, TN, USA) before and after the abrasion cycles. Finally, the effects of the scrub test on the surface morphology of the coatings were investigated with a low-vacuum SEM (JEOL IT 300, Akishima, Japan).

3. Results and Discussion

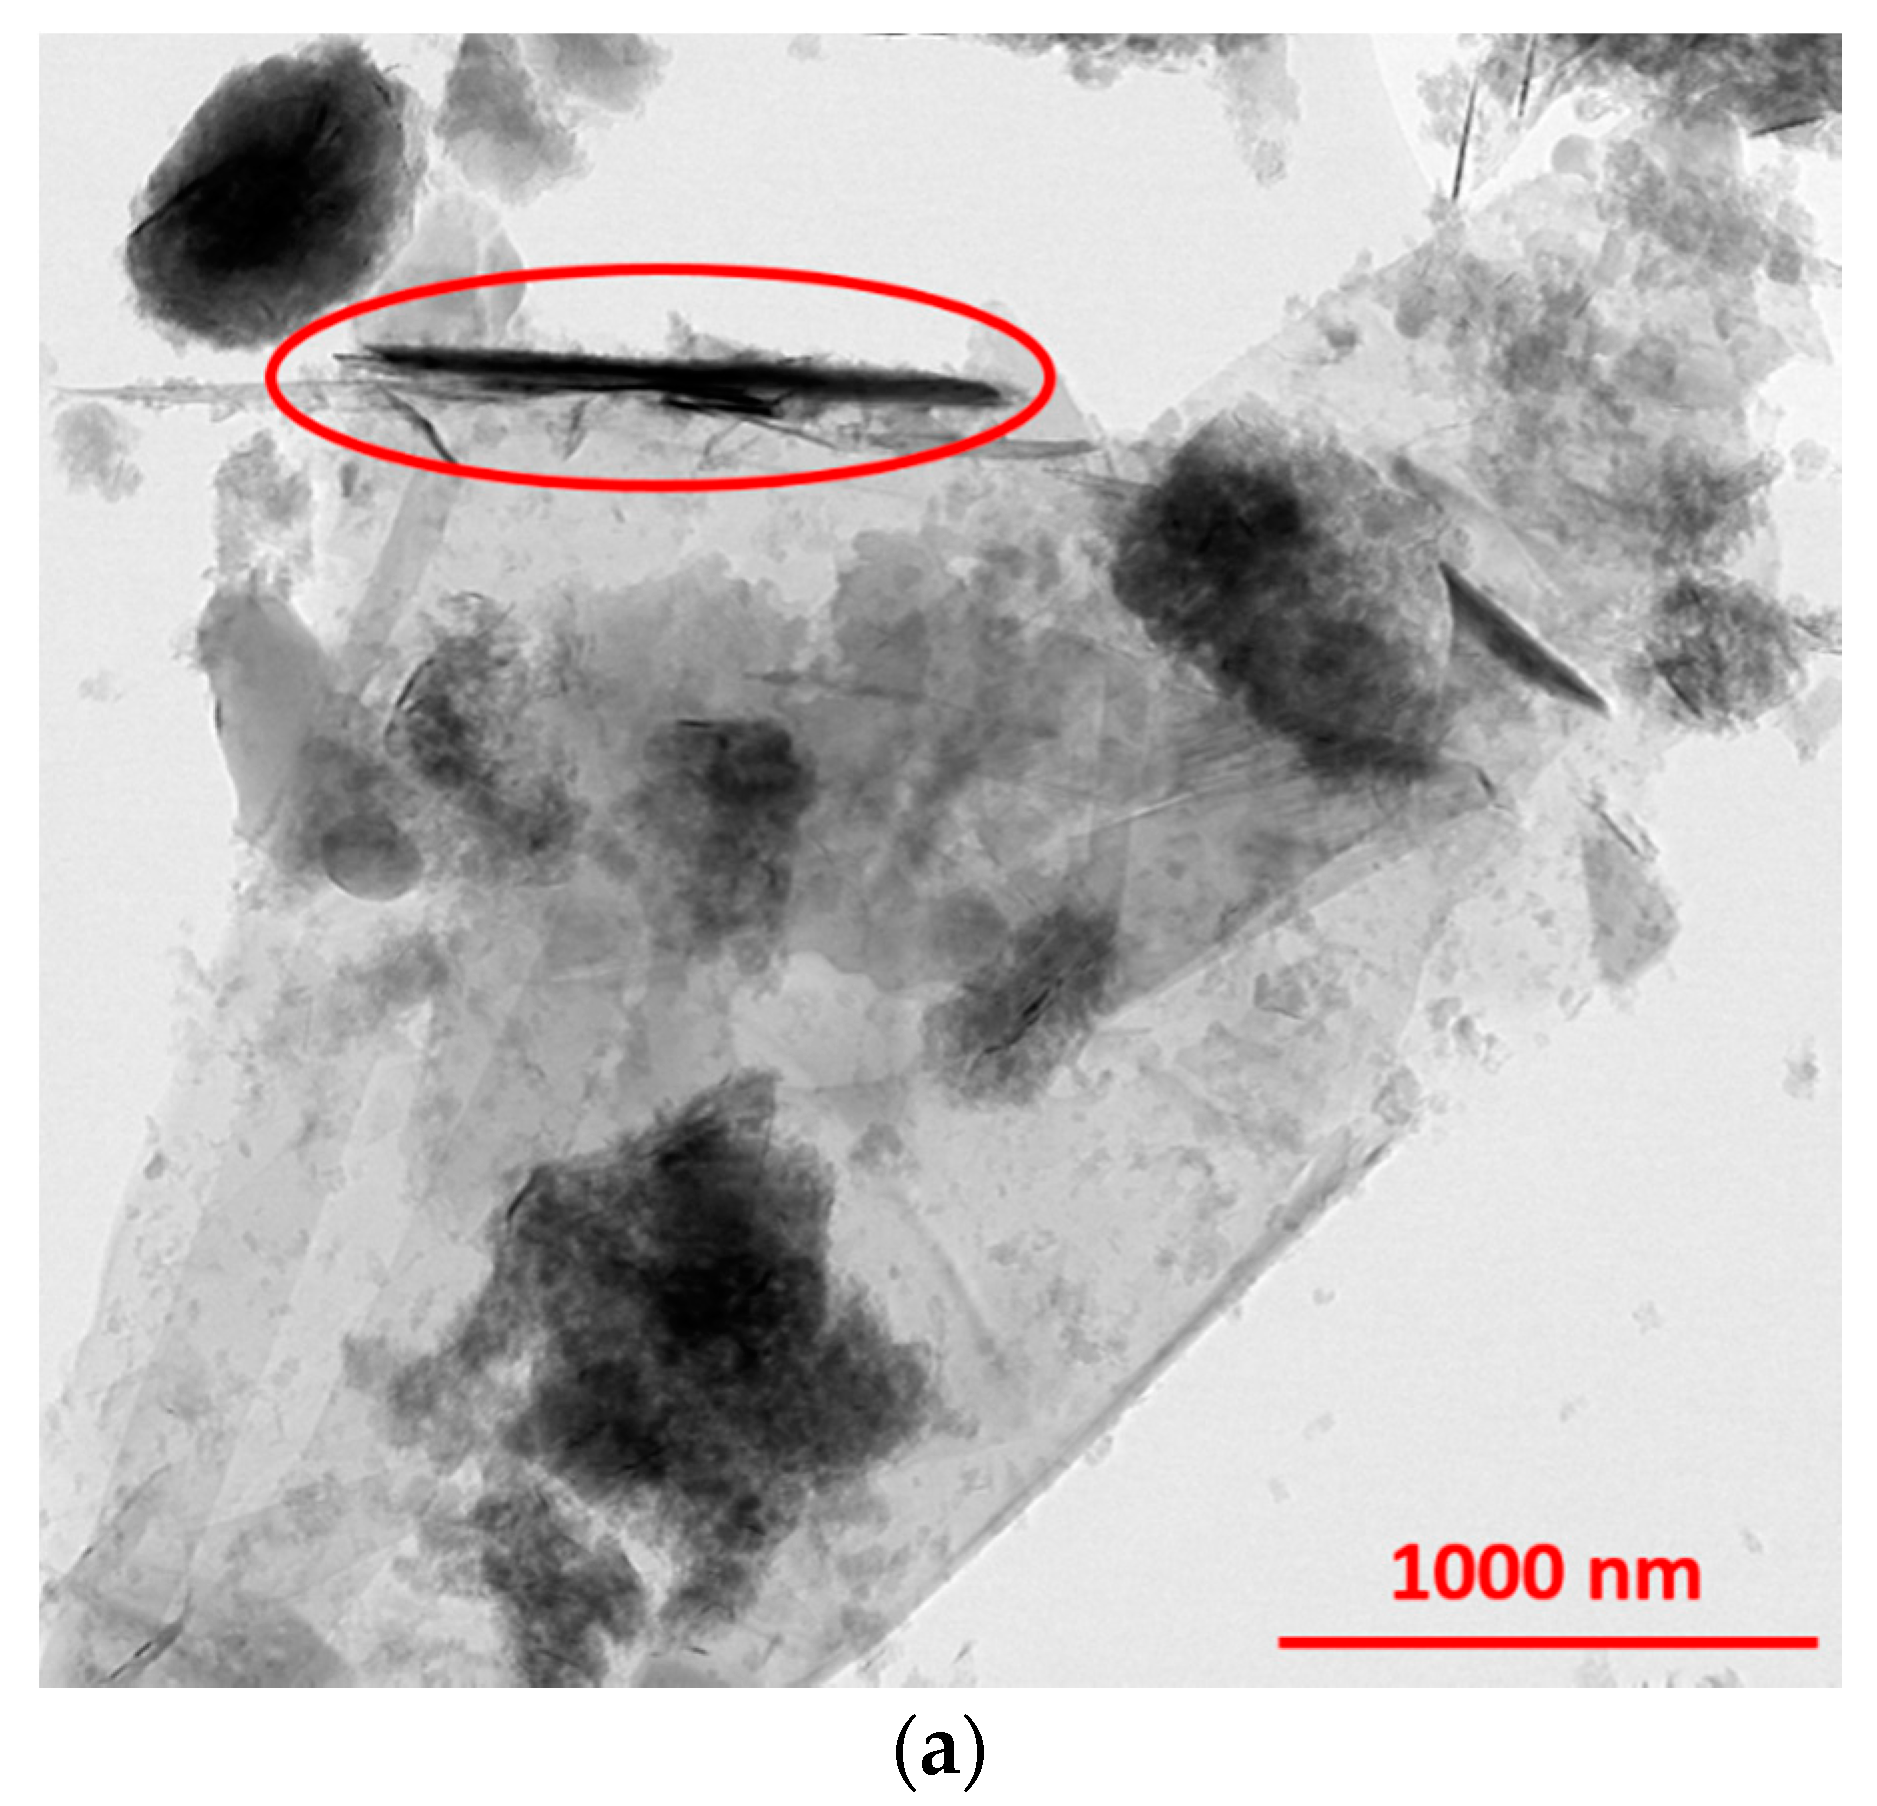
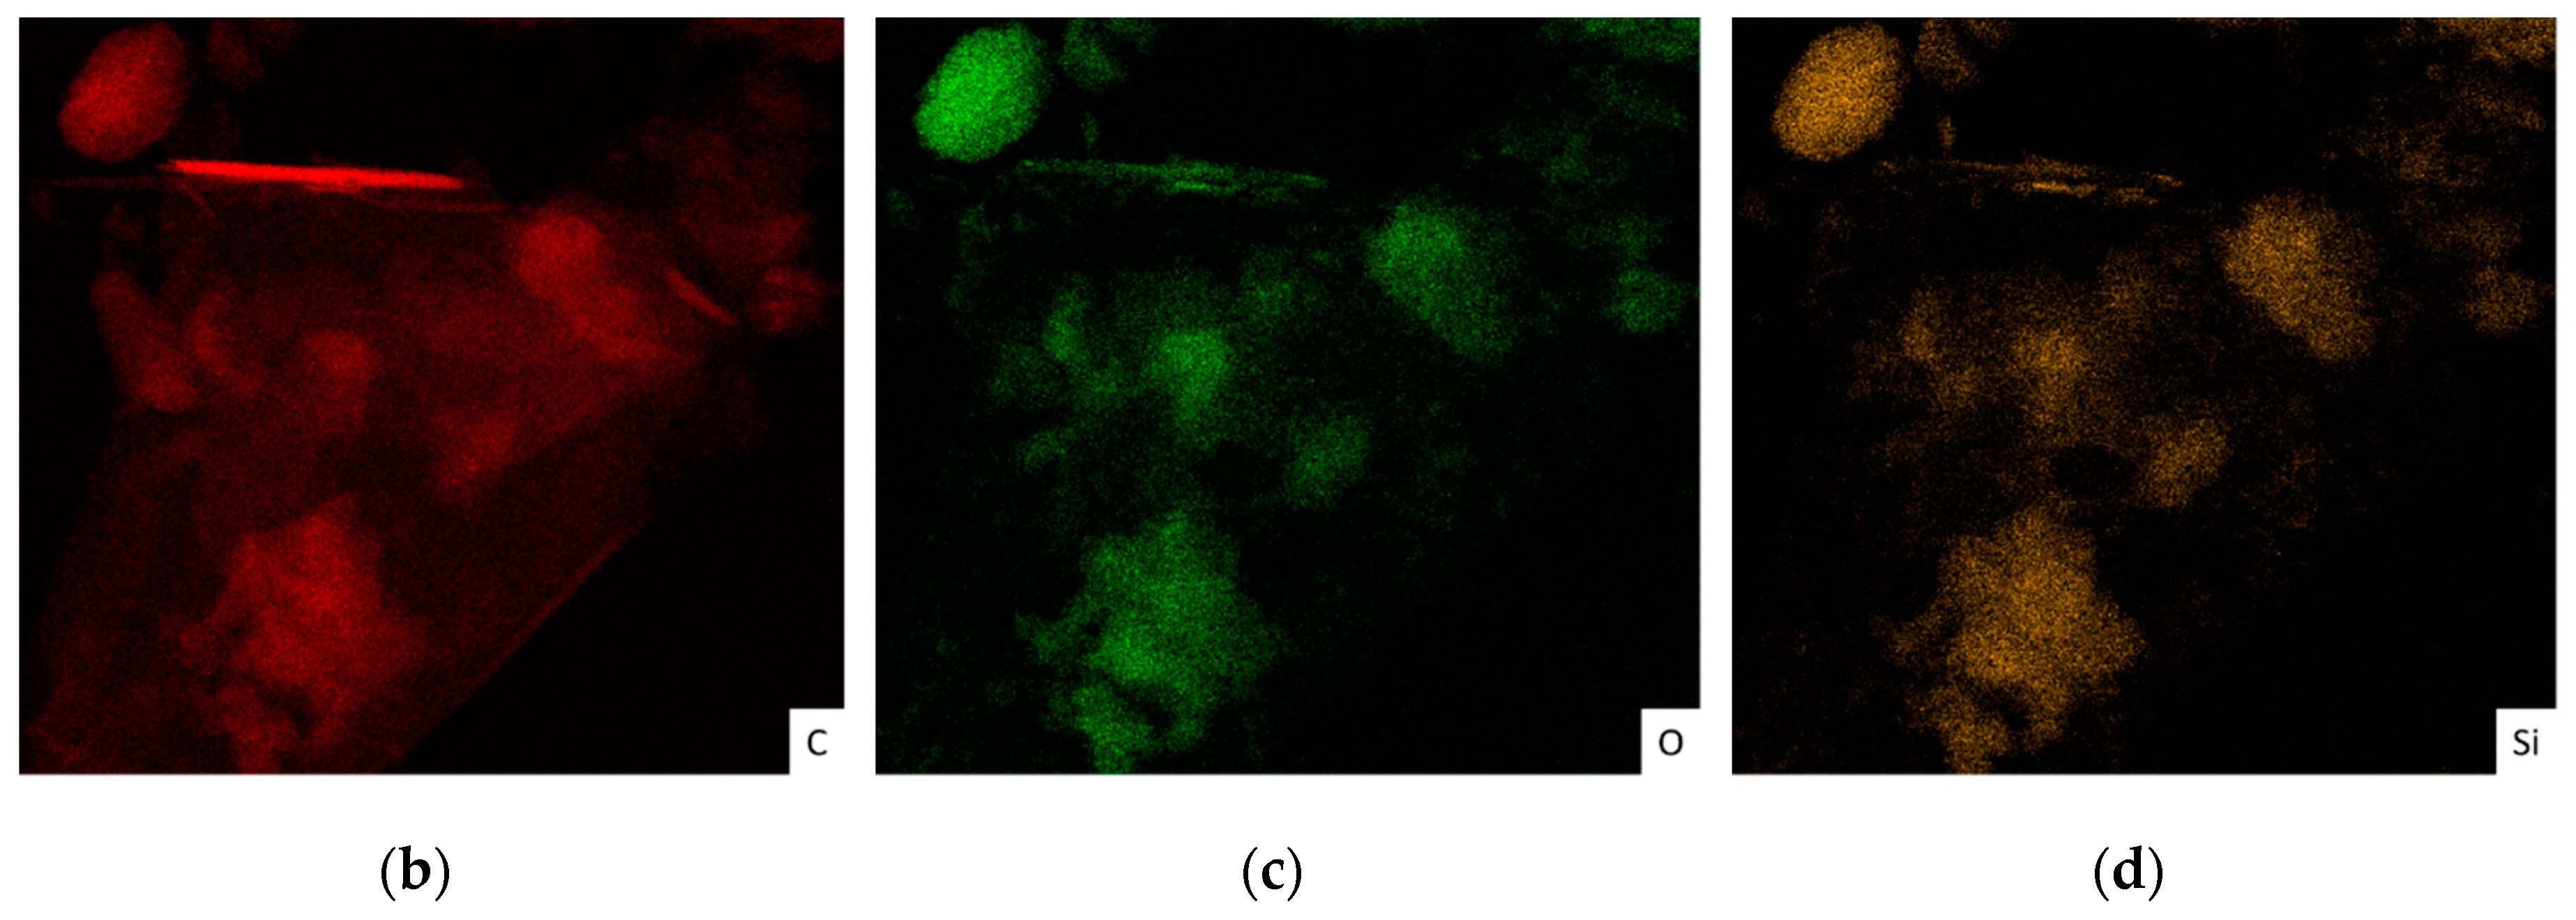
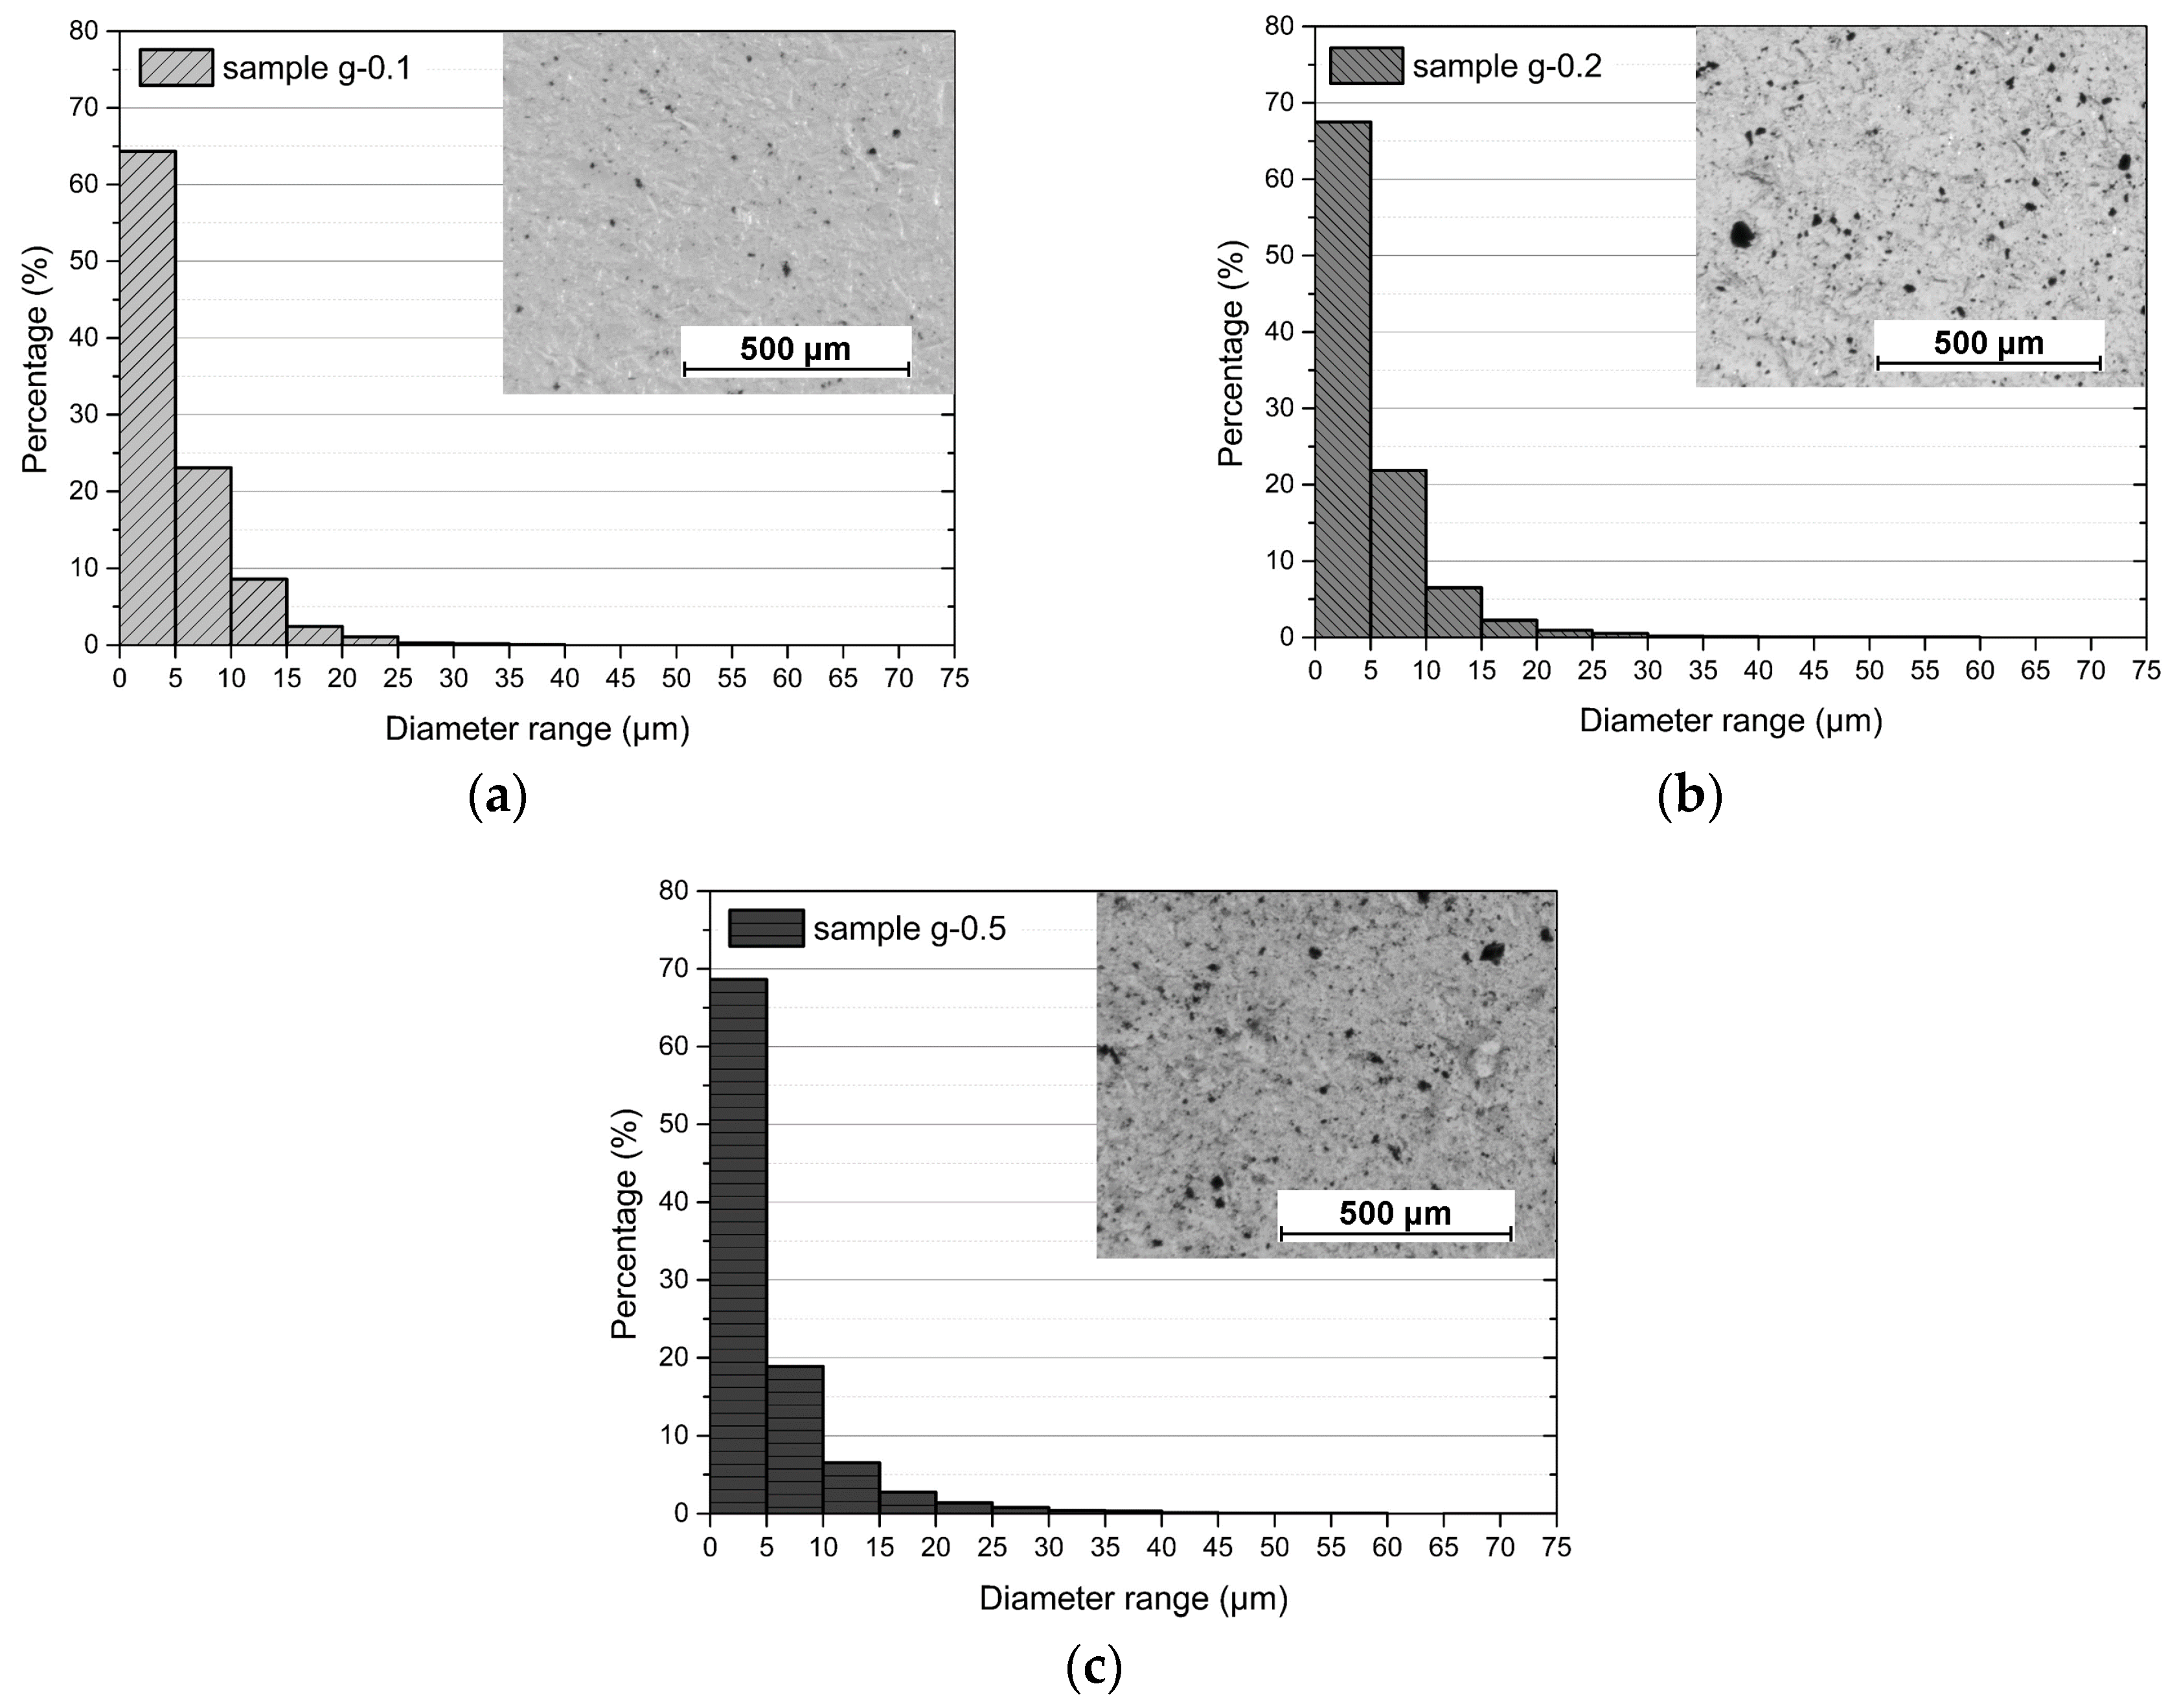
3.1. Filler Distribution
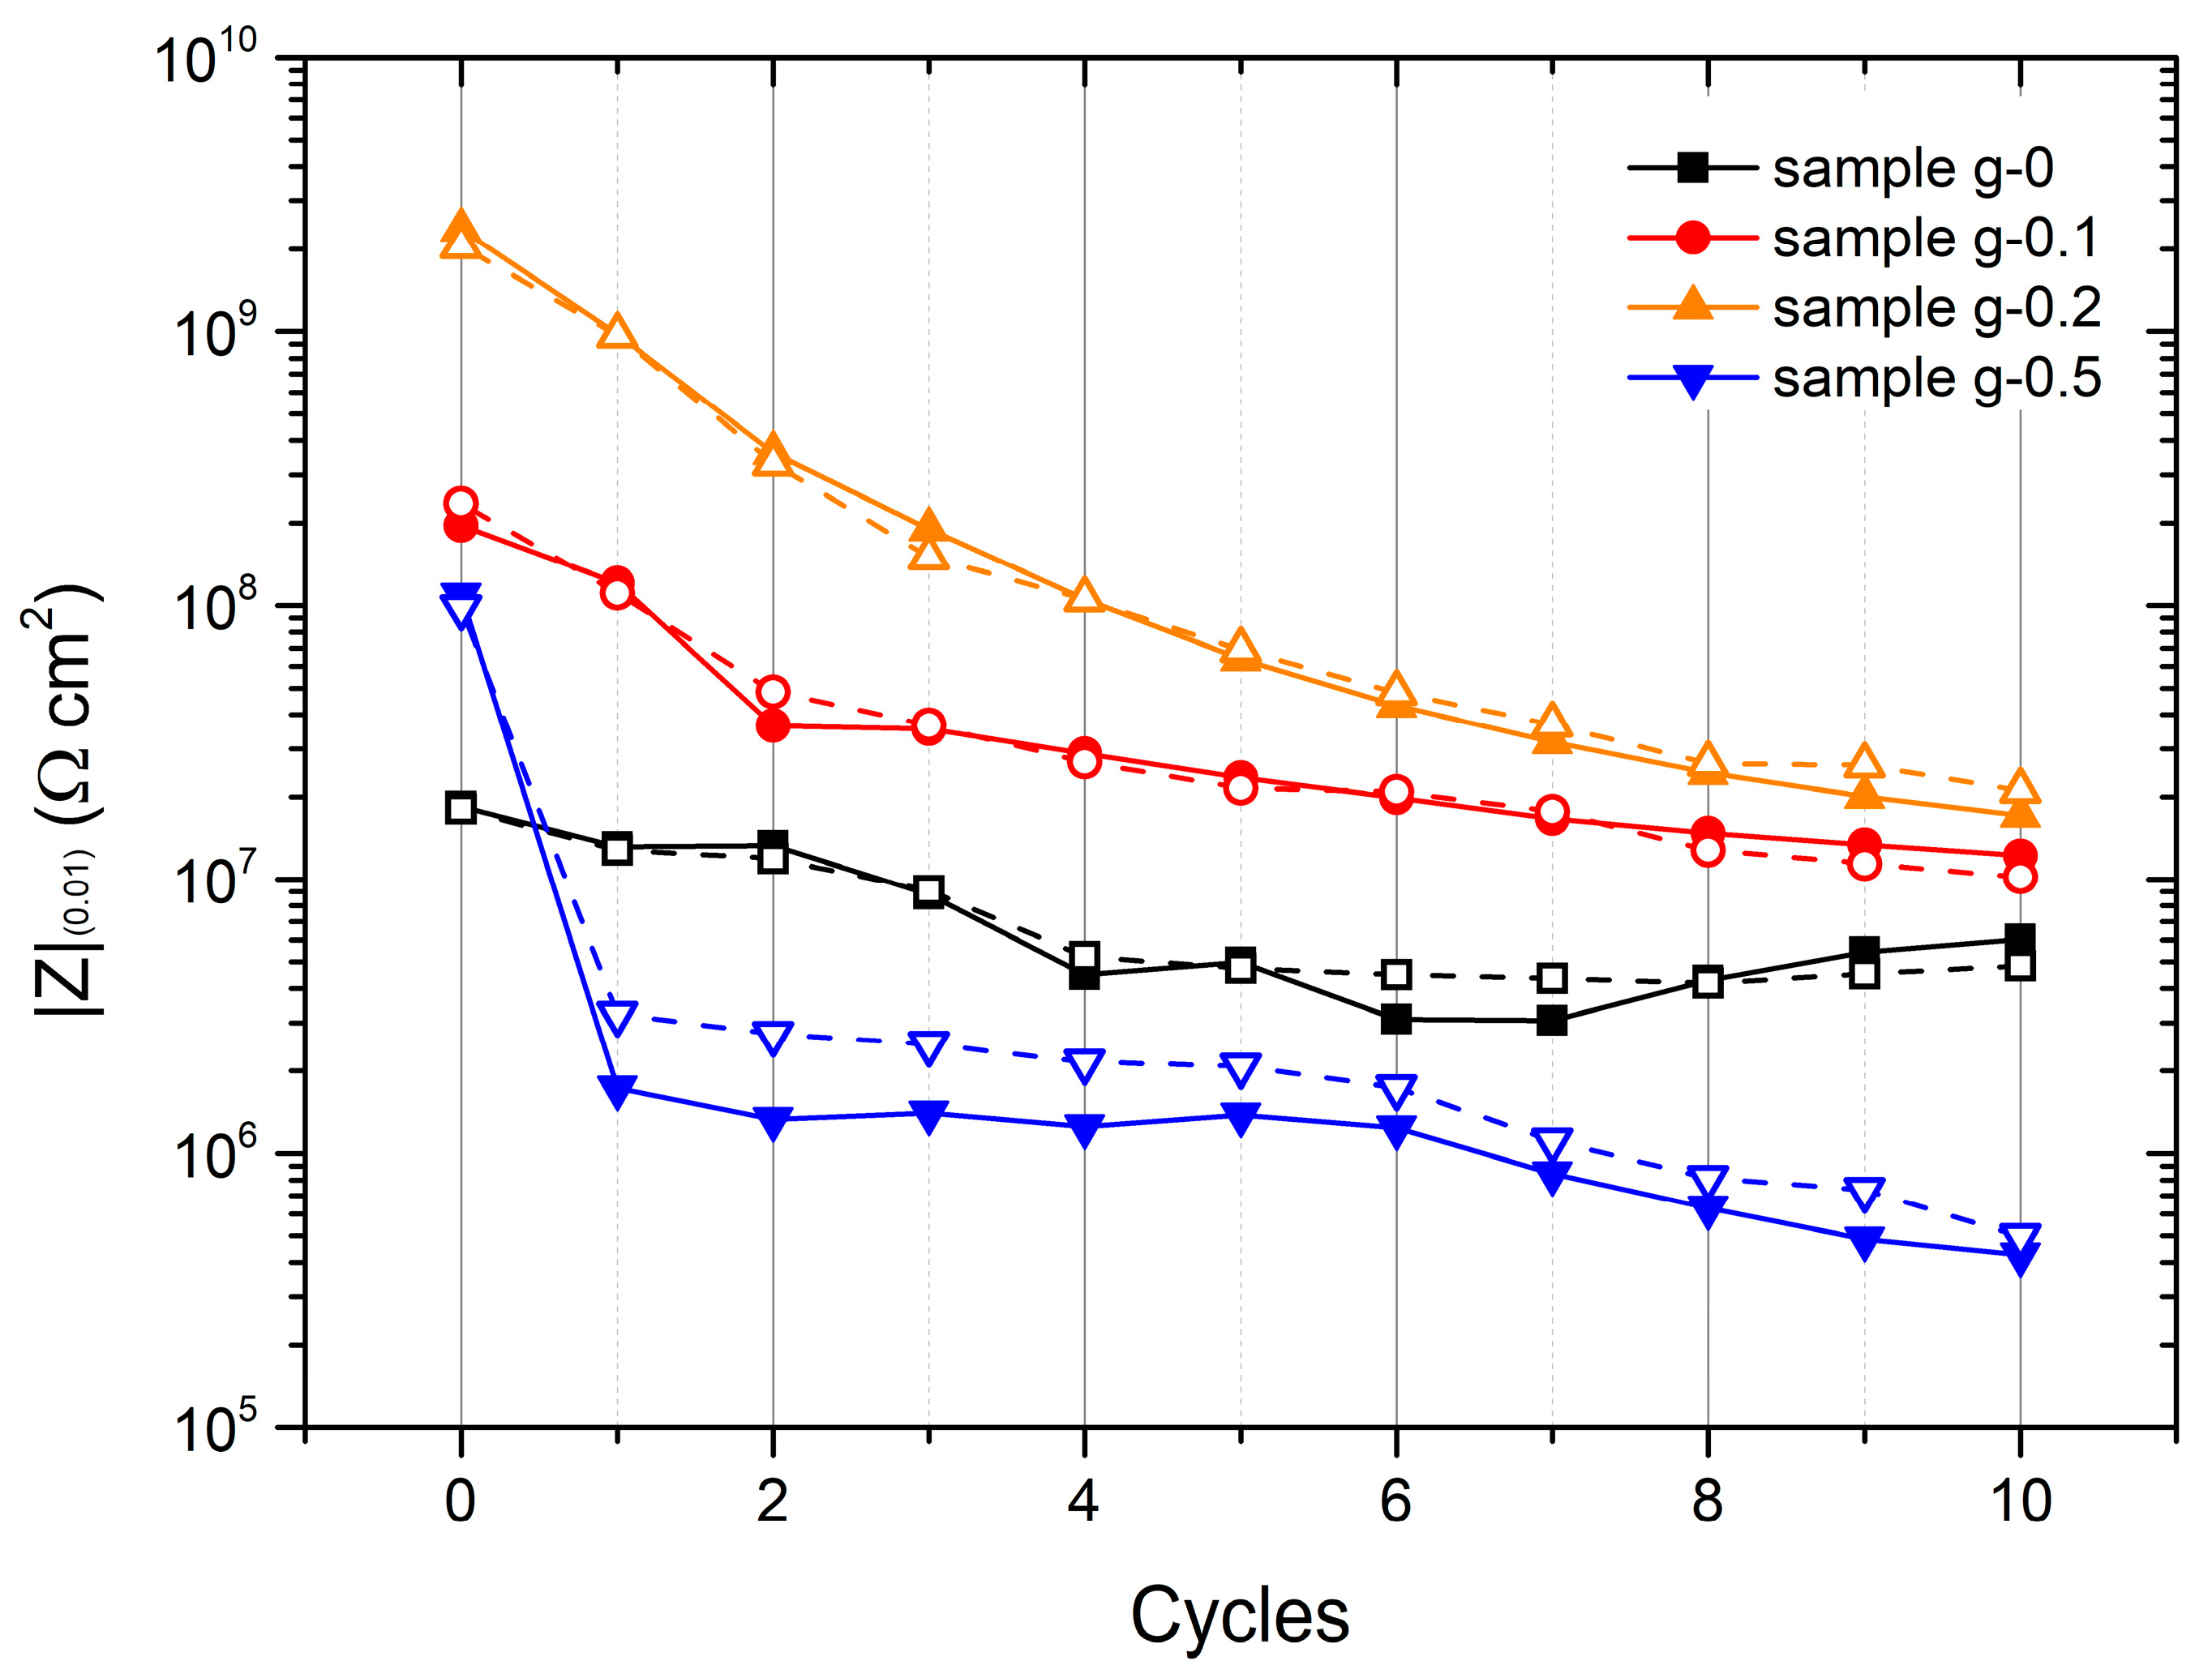
The filler distribution inside the matrix is a fundamental parameter because it greatly influences the performance of composite coatings. In order to improve the distribution of the filler within the acrylic matrix, the graphene flakes were oxidized and functionalized, as described above. The results of these surface modification processes are highlighted in Figure 2, which shows the bright field image and the corresponding EDS (Energy Dispersive X-ray Spectrometry) maps of the fGO sheets, analysed by S/TEM.
The reference image, obtained in Bright Field, clearly highlights the presence of a large flake, which appears grey in colour. The image also possesses some very dark areas, which denote accumulations of APTMS, as indicated by the Si element EDS map. The flake does not seem to present preferential grafting points, like the edges, but the silane probably reacted in areas with a greater presence of functional groups on the plane of the sheet. Moreover, the area circled in red in the reference image shows a flake positioned perpendicularly to the plane of the image. This assumption is confirmed by the carbon EDS map, which shows an intense signal. Moreover, the resolution of the equipment used in the analysis is equal to 0.16 nm, making it possible to observe even individual planes of graphene flakes. However, the signals of O and Si on that flake are interesting; these elements are co-located, detected on some spots of the surface of the sheet plane. The presence of oxygen is owing to the carboxylic, epoxy, and hydroxyl functional groups generated on the filler plane owing to the oxidation process, in addition to the silane alkoxy groups. In those precise points, however, the silicon signal is also observed, to represent the organisilane that has interacted with those functional groups.
These images are very interesting as it is very rare to be able to observe a graphene-based flake in profile, and even more difficult to analyse the presence of particular elements on its plane. These qualitative results confirm the effective presence of silane on the surface of the GO flakes, as previously studied in depth with infrared spectroscopy, X-ray diffraction analysis, and nuclear magnetic resonance techniques [44,45].
Coatings deposited from the acrylic cataphoretic bath free of pigments were transparent. However, the metallic substrate interferes with the observation of flakes using an optical microscope, as indicated previously [45,46]. Therefore, to obtain sharper images and to exploit the transparency of the acrylic matrix, the coatings were removed from the metal substrate by immersion for 100 h in 18 wt.% HCl solution. In this fashion, free-standing coatings containing fGO flakes were observed using stereomicroscope, as shown in Figure 3.
The pictures clearly show a progressive increase of fillers (the black structures) in the acrylic matrix with increasing amount of fGO sheets added in the cataphoretic bath. As a consequence of the substrate removal, it is also possible to observe flakes whose diameter is smaller than 10 µm. Furthermore, the good colour contrast between flakes and matrix obtained with microscope observations facilitates quantitative analysis of the fillers. The size distributions of the flakes in the different coatings were determined using the NIS-Elements Microscope Imaging software, and the histograms are presented in Figure 3. The distributions of flake dimensions are very similar for the three coatings containing the graphene-based filler. Between 65% and 70% of the analysed sheets show dimensions less than 5 µm, regardless of the sample studied. About 90% of the flakes are less than 10 µm in size.
The primary differences between the three coatings are apparent when considering the distribution of larger particles, as highlighted by Table 2, which summarizes the percentage values extrapolated from 10 image analyses per sample. Starting from the 25–30 µm range, it is clear that the fraction of large particles increases with increased loading of the flakes amount in the cataphoretic bath. The higher concentration of fGO in the bath leads to agglomeration of fillers, some of which reach the dimensional range of 70–75 µm for sample g-0.5.
These agglomerated particles, although present in low numbers, represent sites for potentially dangerous defects in the coating because they are much larger than the thickness of the composite layers, as shown in Table 3, and it is probable that the accumulations of fillers provide direct connections of the substrate and the aggressive environment. They might also result in an unfavorable galvanic couple with carbon steel owing to the high electrochemical nobility of graphene. Furthermore, the increase in fillers added in the cataphoretic bath is correlated with a decrease in the thickness of the deposited layer, as graphene causes a decrease in process yield, as discussed previously [45].

3.2. AC–DC–AC Test

The AC–DC–AC method represents an accelerated cyclic test, consisting of a combination of EIS measurements (AC) and cathodic polarisation (DC), employed to study the adhesion between substrate and organic coatings [52,58,59]. In the past, this characterization technique has also been used for the optimization of the cataphoretic deposition process, determining the deposition voltages for the highest corrosion protection properties of an epoxy primer [60]. The AC–DC–AC method has been proven to be able to provide comparable results obtained with other accelerated corrosion techniques, such as salt spray test, but in even shorter times [52,58]. The four sample series were thus subjected to several AC–DC–AC cycles, as described in Figure 1, and the evolution of the low frequency Bode modulus measured at 0.01 Hz, |Z|(0.01) was tracked.
Figure 4 shows the results obtained during the first 10 test cycles on two sets of samples. A different behavior between the four series of samples appears immediately evident; while the presence of 0.1 wt.% and 0.2 wt.% of flakes in the bath seems to improve the performance of the cataphoretic coating, the highest level (0.5 wt.%) instead cause a decrease in the low frequency impedance of the acrylic layer. This behaviour is likely the result of the agglomeration of graphene-based fillers described above for this coating.
The coating free of fGO sheets shows an almost constant impedance modulus trend, with values near 107 Ω cm2. Because the initial impedance was relatively low, this sample was not particularly affected by delamination and development of corrosion products. In contrast, the samples g-0.1 and g-0.2 show evidence of the positive effect caused by the introduction of the fGO sheets in the acrylic matrix, with initial values of |Z|(0.01) higher than 108 and 109 Ω cm2, respectively. These two samples exhibited a slow decrease in the impedance modulus with increasing cycles. EIS measurements are very sensitive, and even a minimal defect or coating delamination can cause a significant decrease in |Z|(0.01). However, the low frequency impedances of these two samples were always higher than that of the g-0 layer, even in very aggressive conditions such as those simulated by the cathodic polarization cycles at −1 V. On the other hand, the agglomerations in sample g-0.5 caused a drastic drop in the impedance modulus after the first test cycle. Figure S1 (in Supplementary Data) highlights a marked drop in the impedance modulus and a corresponding phase shift towards higher frequencies during the first five test cycles.
Once the cathodic delamination has taken place, with the formation of small blisters during the first test cycles, the fGO flakes seem to limit the subsequent development of delamination. As shown by water uptake and conductivity measurements [46], graphene-based fillers can slow down the transport of water and aggressive ions in the coating, which is beneficial to reduce the progress of corrosion reactions. Furthermore, this barrier effect provides coatings with better protective performance, as shown in Figure 4.
The extent of blister and corrosion product formation can be assessed in Figure 5, which shows representative stereomicroscope images of blisters and corrosion attack on the surface of the four samples observed at the end of the AC–DC–AC test. The presence of filler in the coating causes a decrease in the size of the blisters, observed with the stereomicroscope, from 800 ± 45 µm in the case of the fGO-free coating to only 100 ± 10 µm dimension for sample g-0.2. A further increase in the flake concentration, on the other hand, causes a sudden increase in the size and number of corrosion products, as observed on the surface of sample g-0.5.
The large blisters are connected with the low values of the |Z|(0.01) for this sample, as shown in Figure 4. The defects introduced by the agglomerations of fGO flakes cause the value of the impedance modulus to be lower than 107 Ω cm2 even before any cathodic polarization step. This defect in the composite layer also facilitates the absorption of test solution, with consequent strong development of corrosion products. The test on sample g-0.5 was stopped after 10 cycles, as the |Z|(0.01) of the samples reached a plateau value of below 106 Ω cm2, which is considered in the literature as the lowest threshold to define an organic coating as protective [48,49,61].
The AC–DC–AC method identified the best of the four coatings in terms of corrosion protection, but was unable to provide quantitative data for studying the effect of fillers on the cathodic delamination of the cataphoretic coatings. To better analyse the contribution of the fGO flakes, the samples were subjected to SKP measurements.

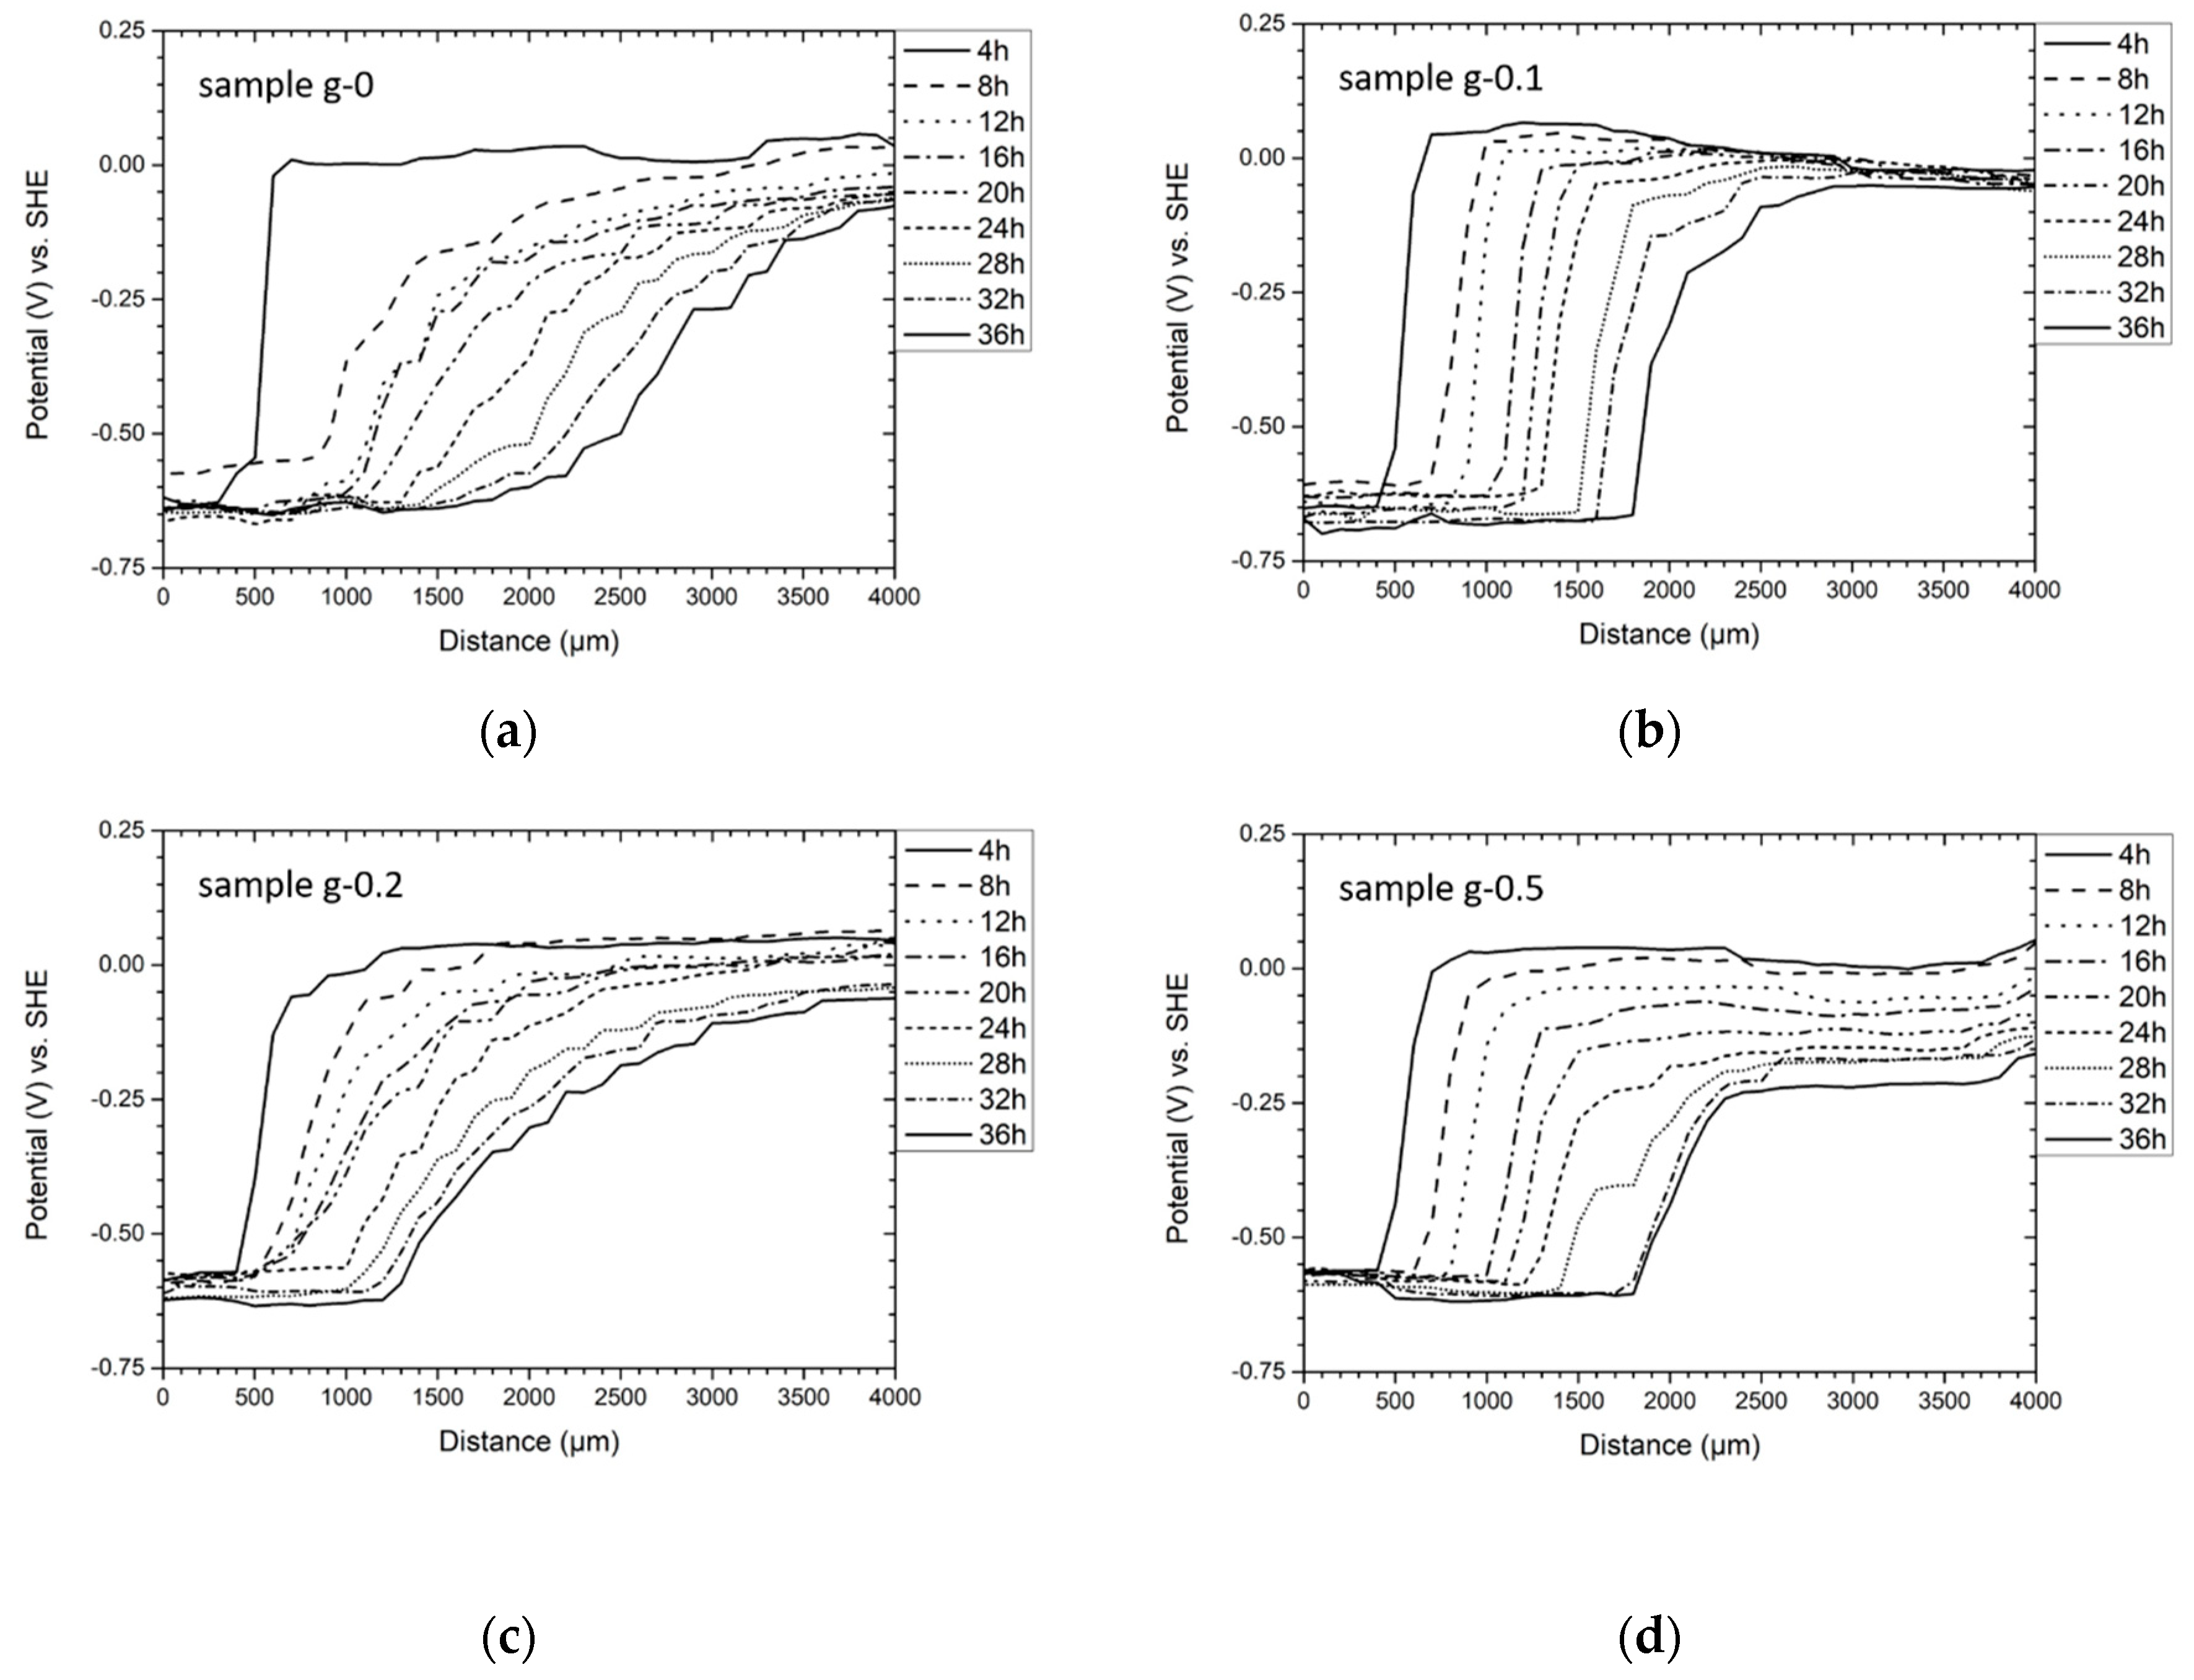
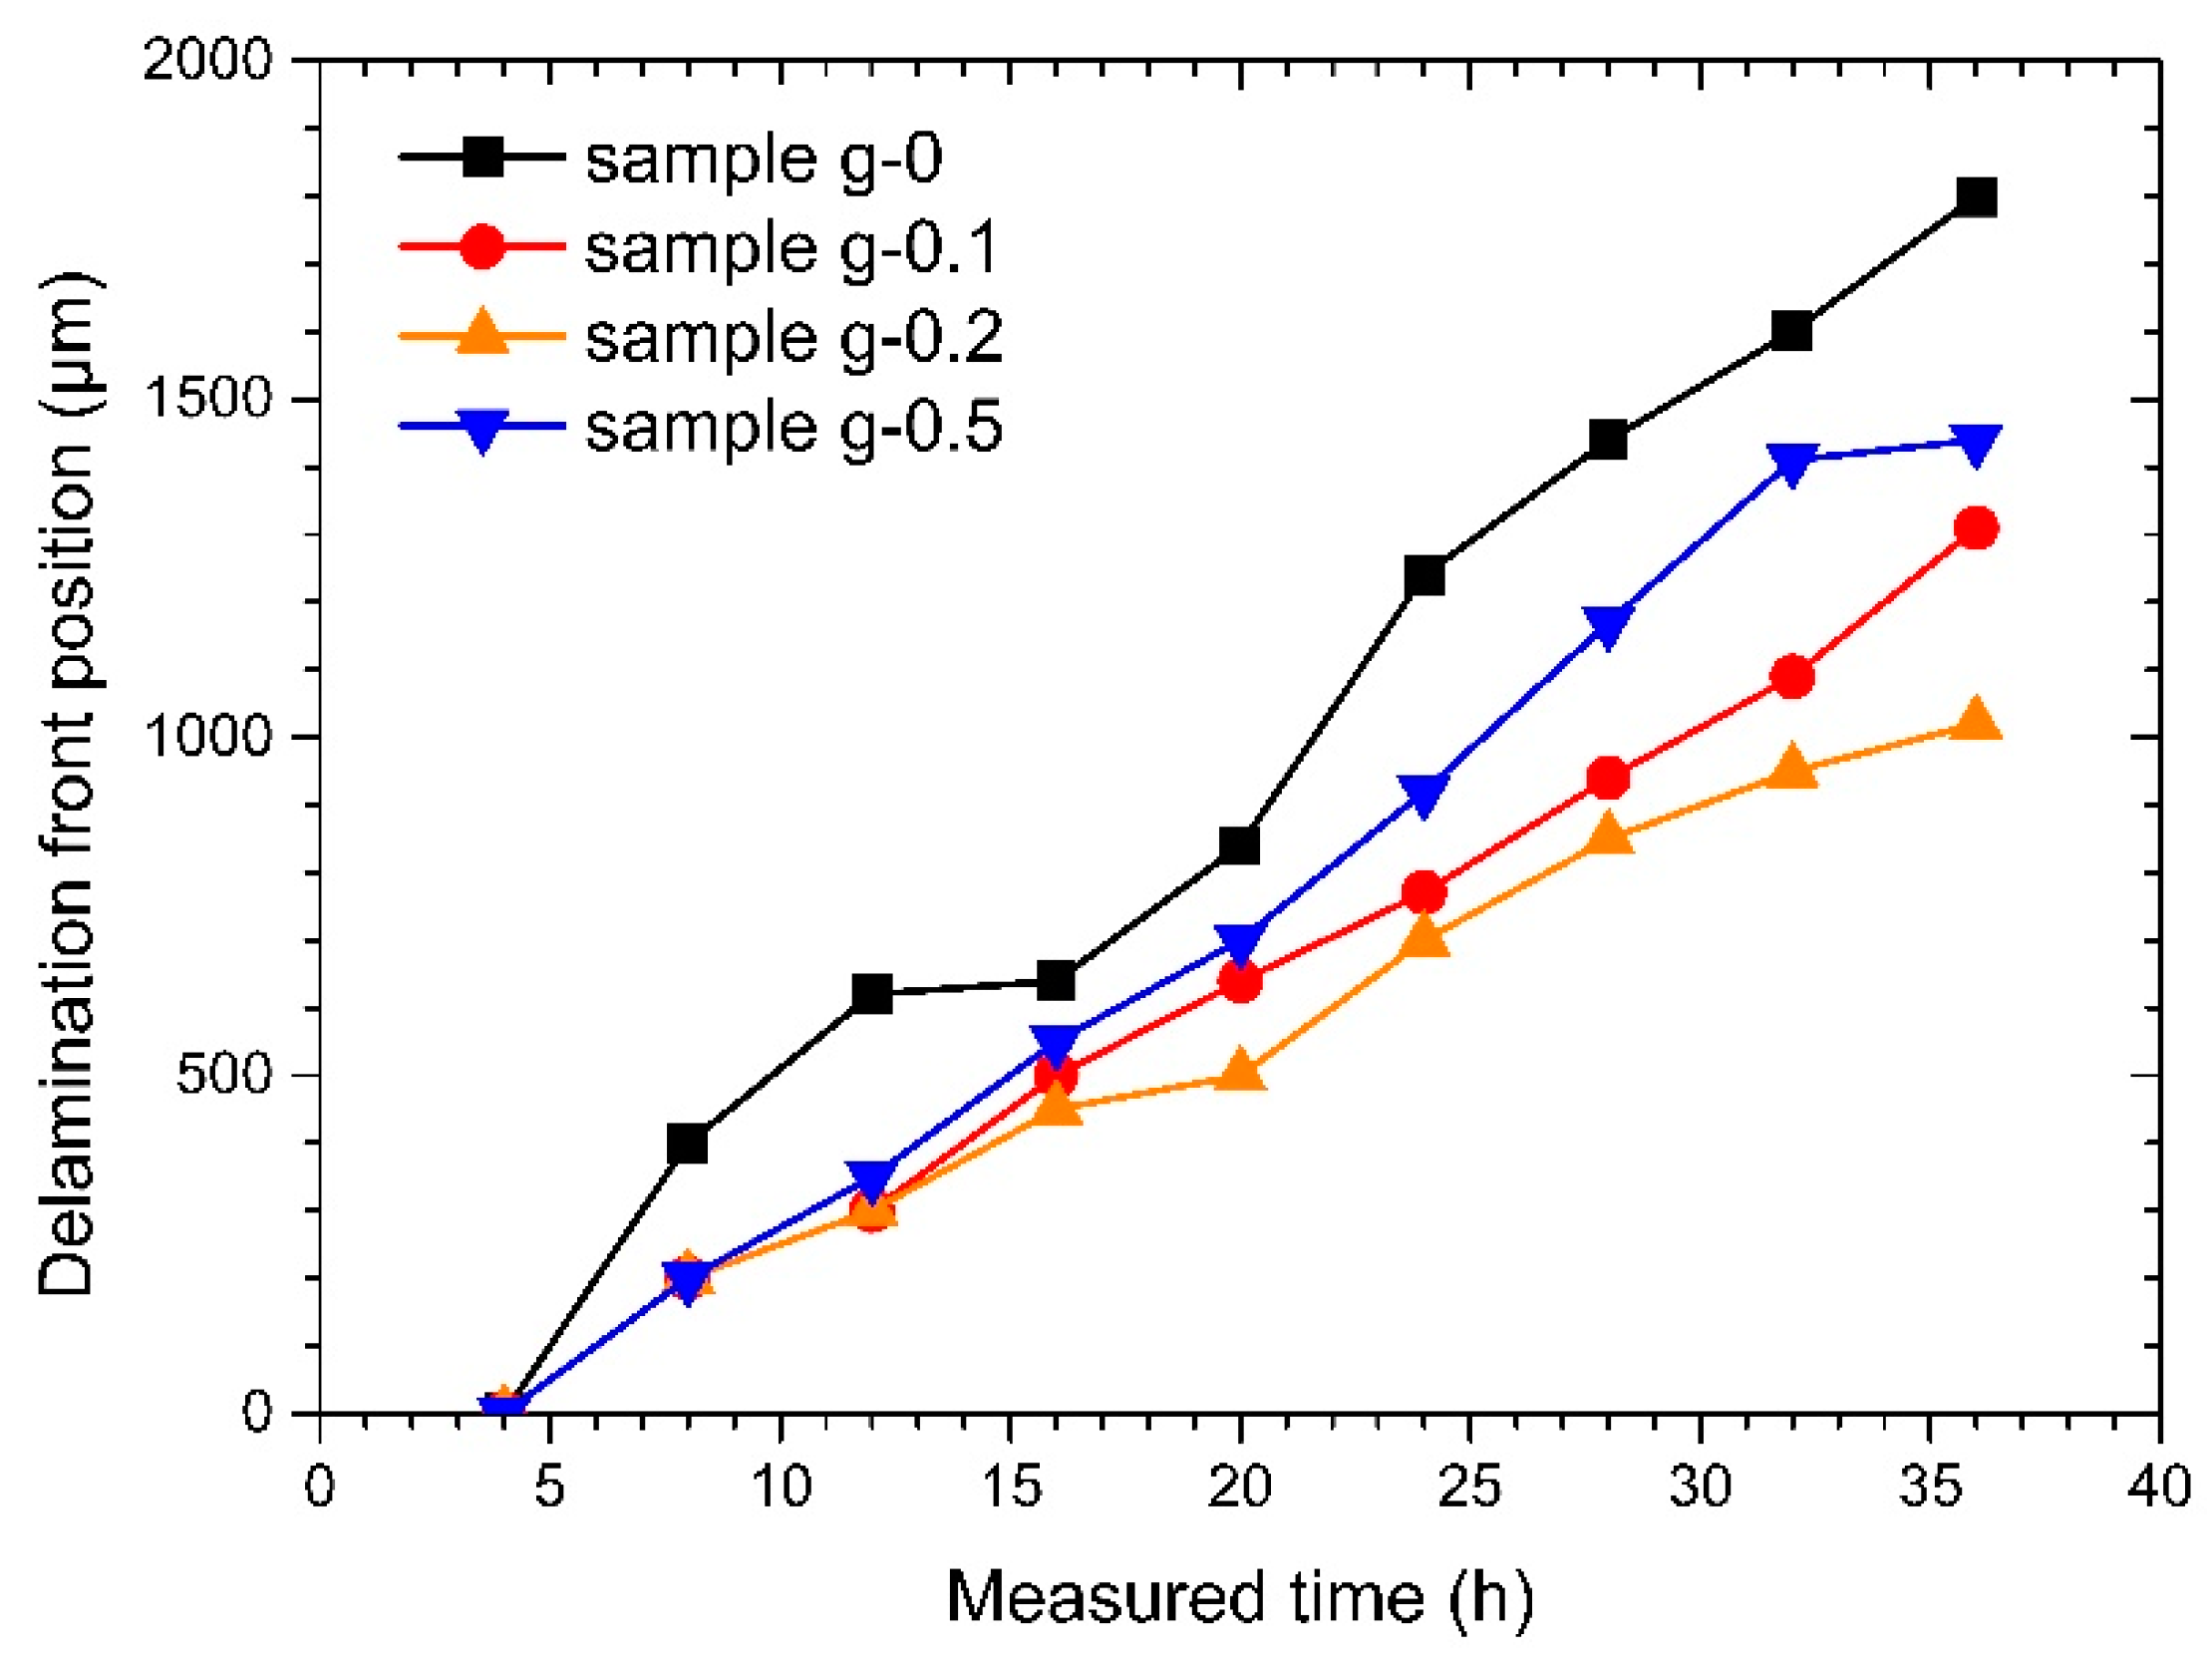
3.3. Scanning Kelvin Probe Measurements

SKP is one of the most effective techniques for the quantitative characterization of the delamination of organic coatings [62]. For example, this method is able to evaluate the effect of the protective layer roughness or the texture of the metal substrate on the adhesion of the coating [53]. Some studies have been carried out on the effects of multiwalled carbon nanotubes [56] and graphene nano-platelets [63] added to polyurethane and polyvinylbutyral matrices, respectively. The incorporation of these carbon-based additives improved the adhesion of the composite layer, limiting its permeability and blocking the transport of water and oxygen molecules through the coating.
In this work, SKP was used to investigate the effect of fGO content on the cathodic delamination of the cataphoretic acrylic composite coatings from the carbon steel substrates. The working principle of the SKP equipment is illustrated in Figure S2 (in Supplementary Data). Figure 6 shows the SKP potential profiles of the four coated samples with different graphene-based filler contents as a function of time. The SKP profiles are characterized by two potential levels: the lower potential on the left is related to the defect zone, and the higher potential on the right is associated with the intact coating [54,64]. The position of the potential jump defines the exact location of the delamination front. The progress of the cathodic delamination front is thus monitored by tracking the location of the potential step as a function of time, as summarized in Figure 7 for the four types of coatings.
The fGO flakes clearly have a large effect on the cathodic delamination process. After 36 h of exposure in the SKP chamber, the delamination front of the pure acrylic matrix coating reached 1800 µm of distance from the first measurement. In contrast, the addition of 0.2 wt.% of fGO fillers caused a substantial decrease in the progress of the delamination front, which reached only 1000 µm at that time. This optimum flake content thus resulted in a 45% reduction relative to the coating with no fillers added. Smaller benefit was observed in the coating containing 0.1 wt.% fGO because of insufficient content and 0.5 wt.% fGO because of the defects associated with agglomerates described above.
The trend in Figure 7 suggests that the cathodic delamination process is limited by the oxygen reduction rate at the local cathode within the delaminated zone under the coating [56]. Graphene-based fillers, in fact, block transport of oxygen within the composite layer, making the pathway of the molecules much more complex. The oxygen reduction reaction plays a fundamental role in the development of cathodic delamination processes [65,66], which are slowed down by the barrier effect of the flakes dispersed in the acrylic matrix. As water molecules could lead to an increase of the interfacial free volume owing to polymer swelling, causing the deterioration of the interfacial adhesion [67,68], it is possible that the fillers achieve an improvement in the adhesion between the acrylic matrix and the substrate by creating a barrier to water transport.
The AC–DC–AC and SKP methods, which are both electrochemical characterization techniques, have demonstrated in different ways the beneficial effects of fGO fillers, which improve the corrosion protection of the cataphoretic coating by reducing its permeability and increasing its resistance to cathodic delamination.

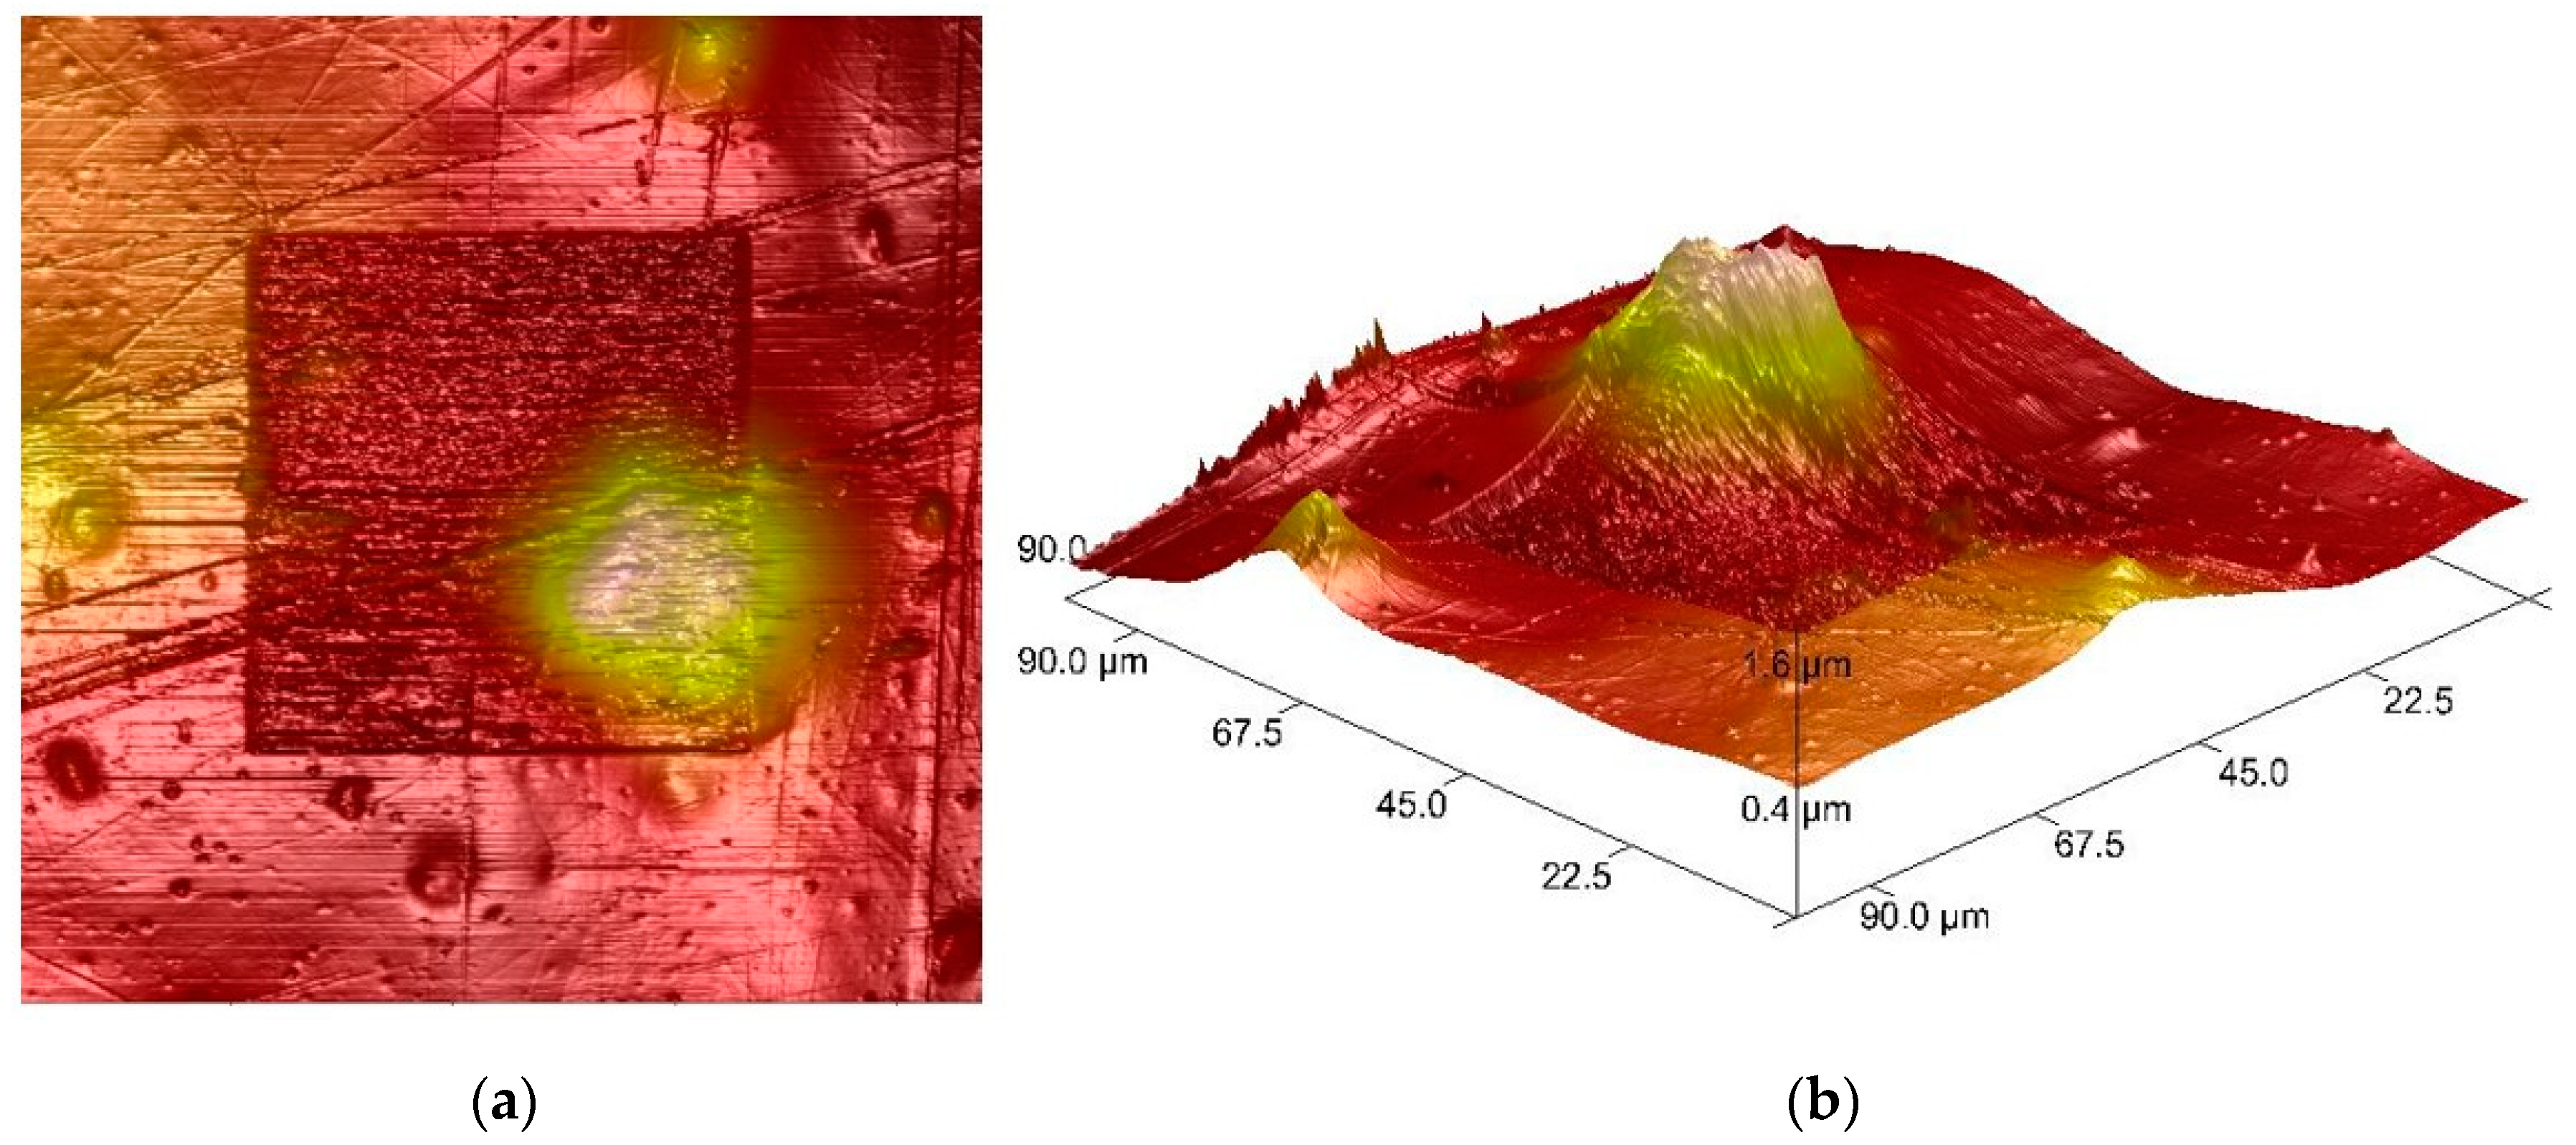
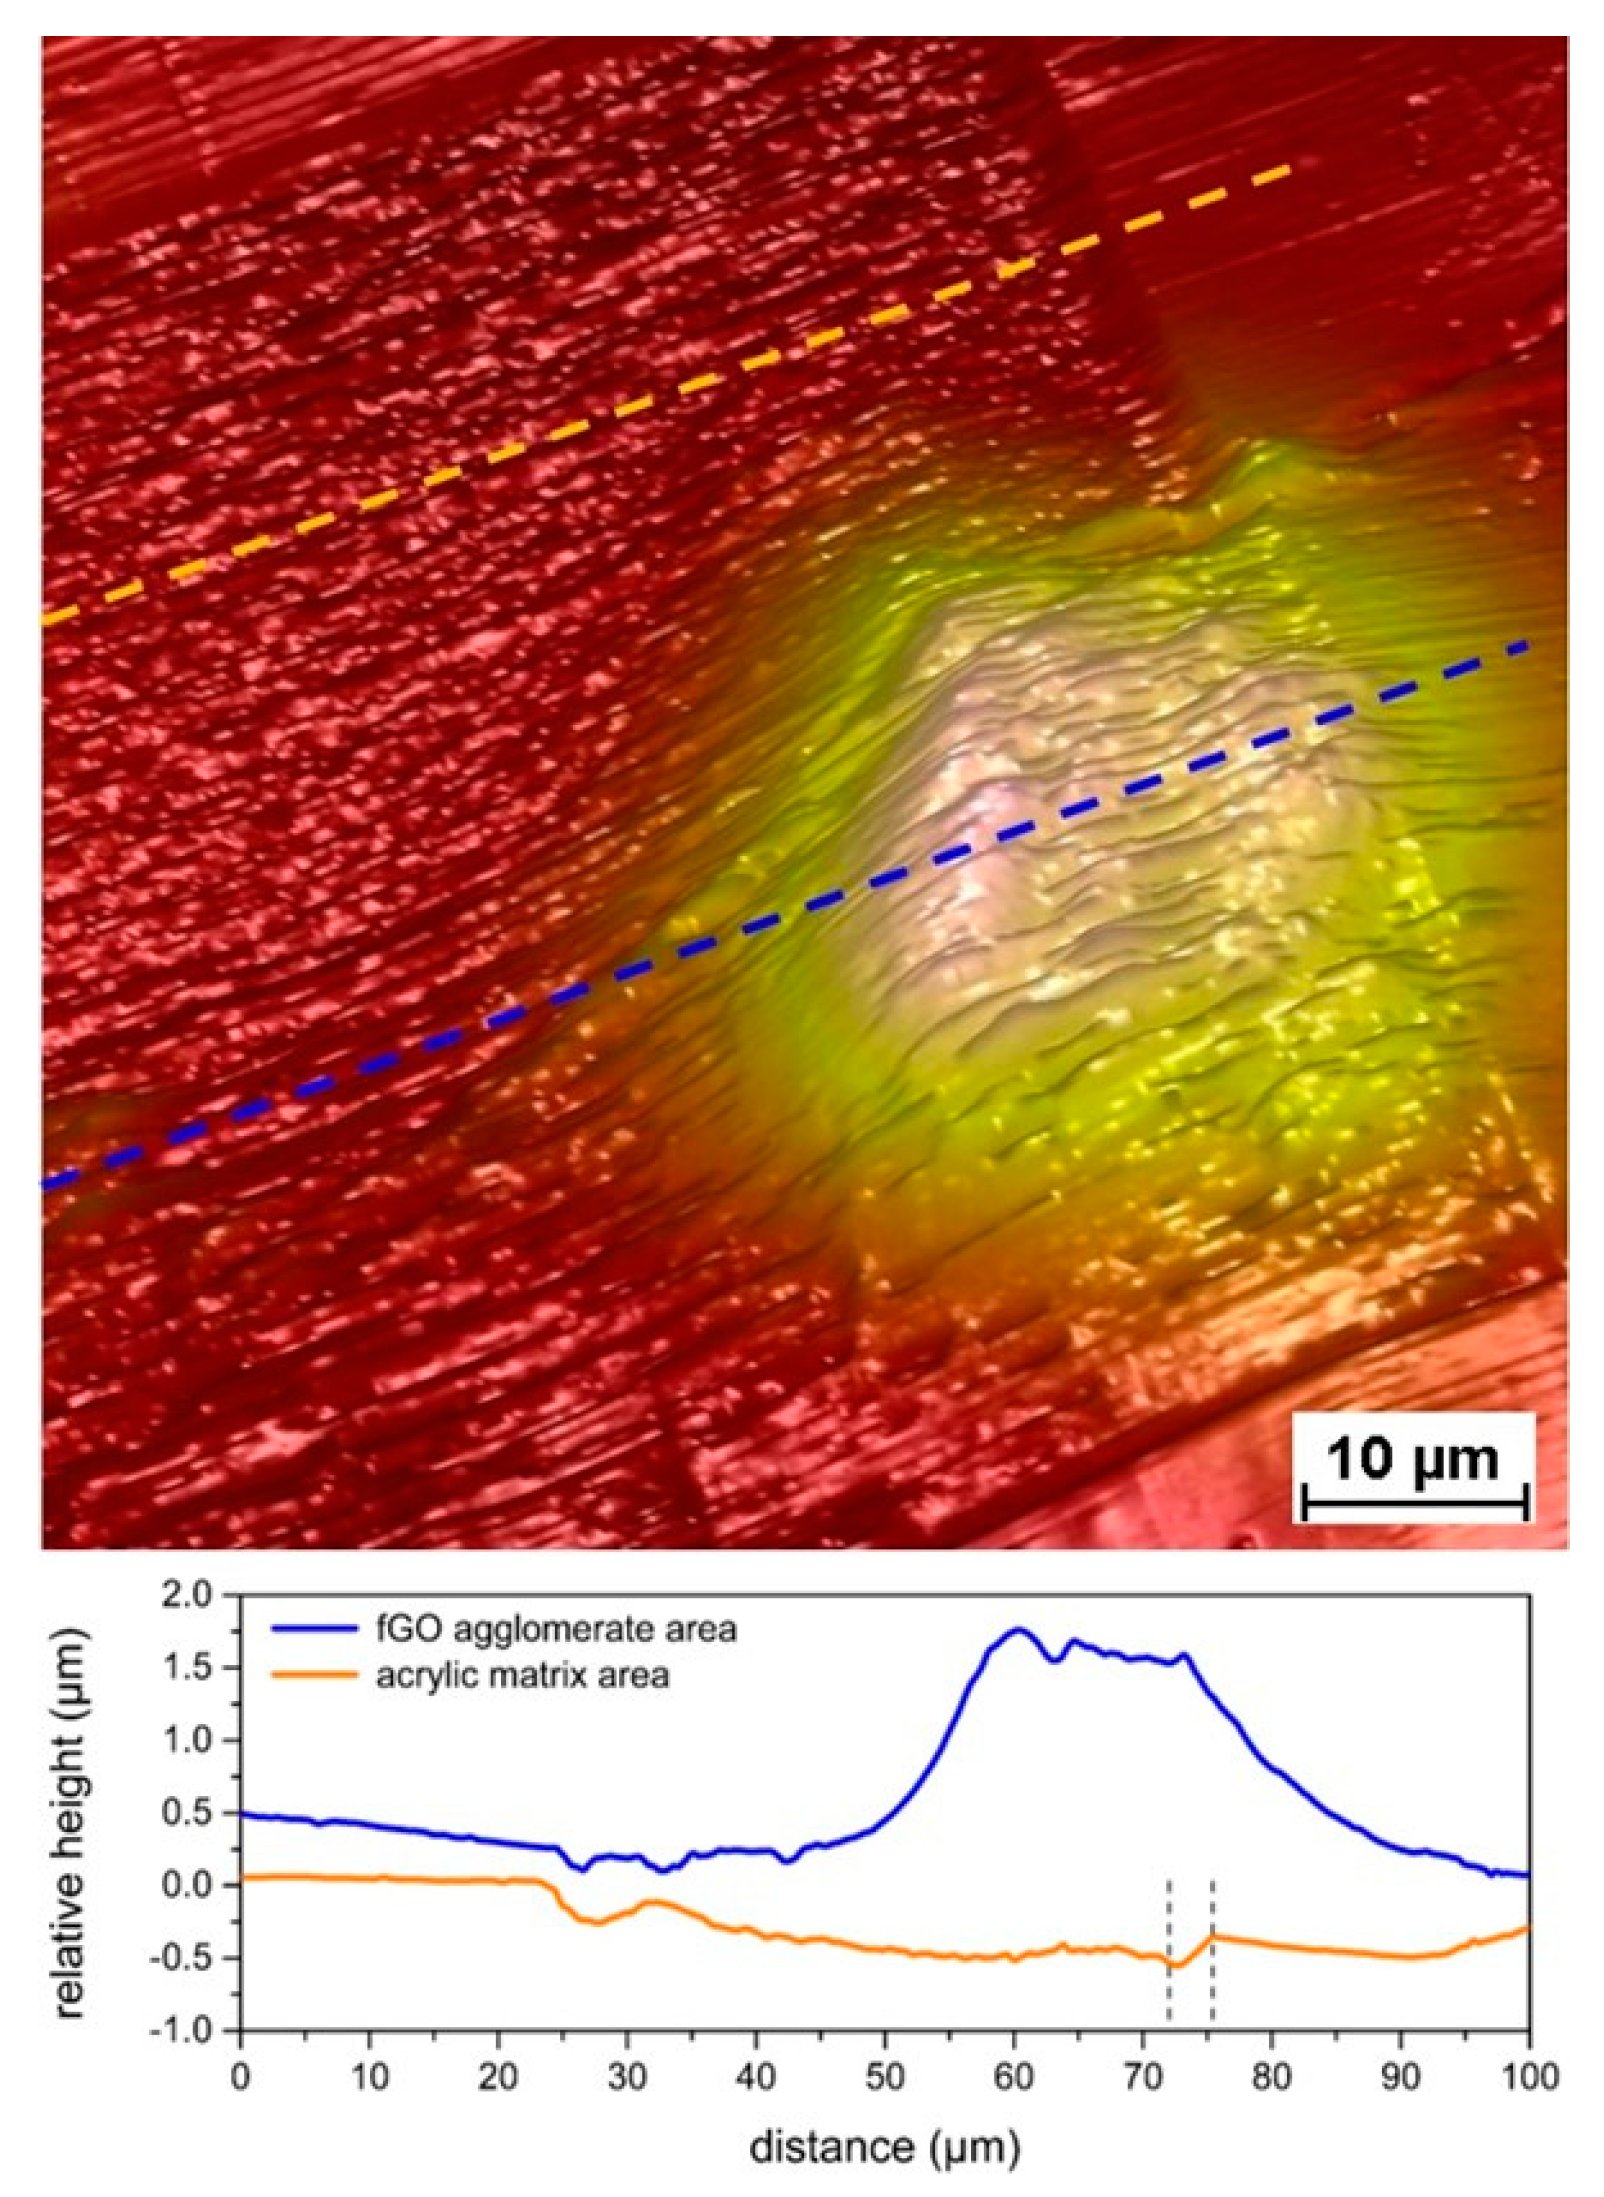
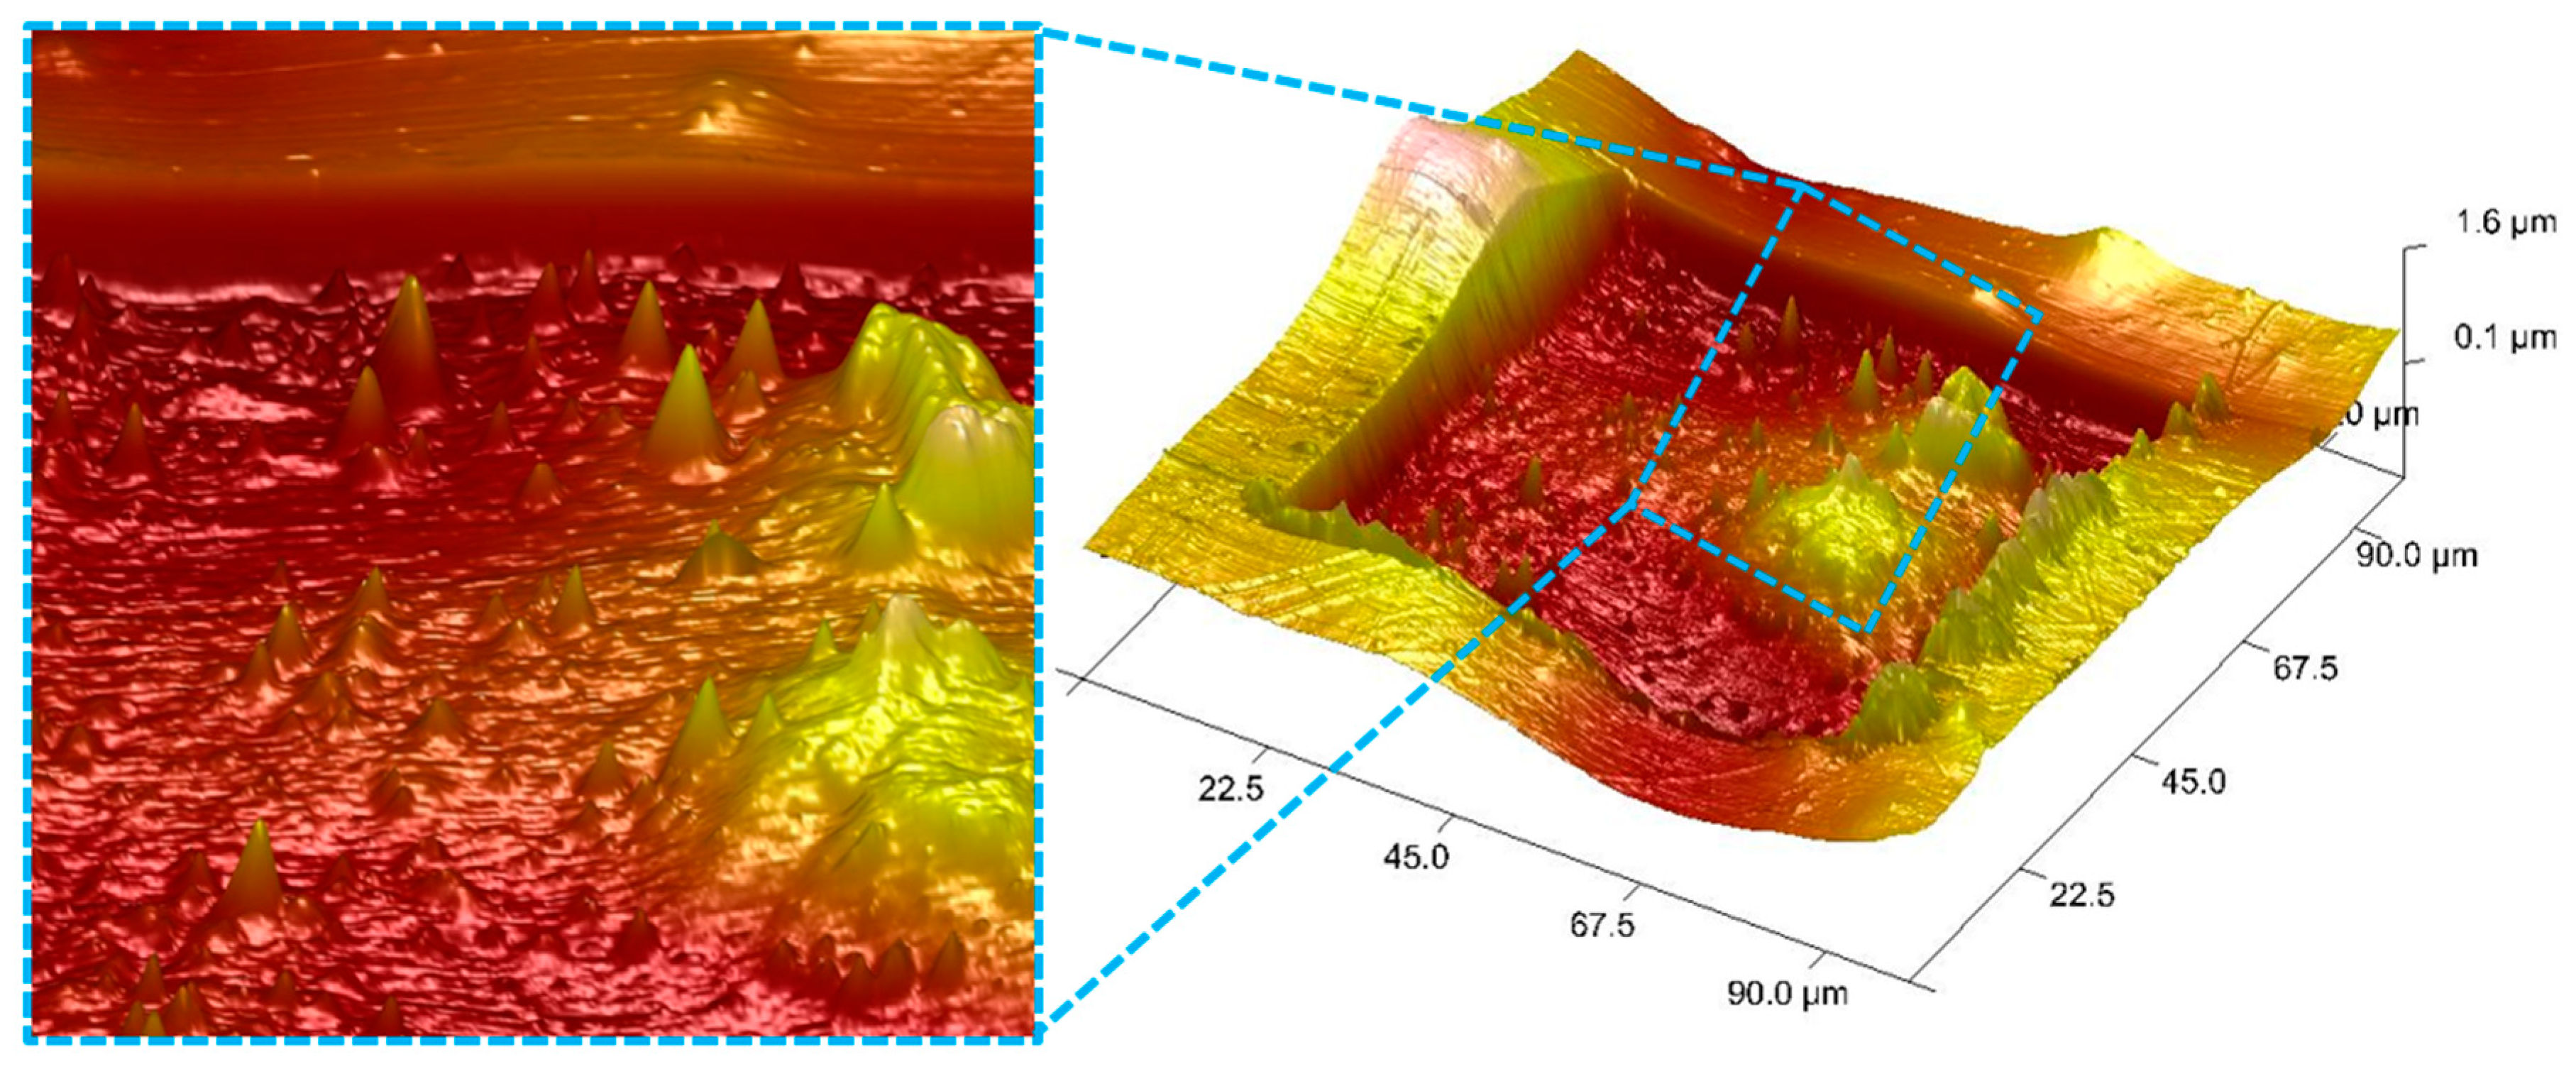
3.4. Scratching AFM Analysis
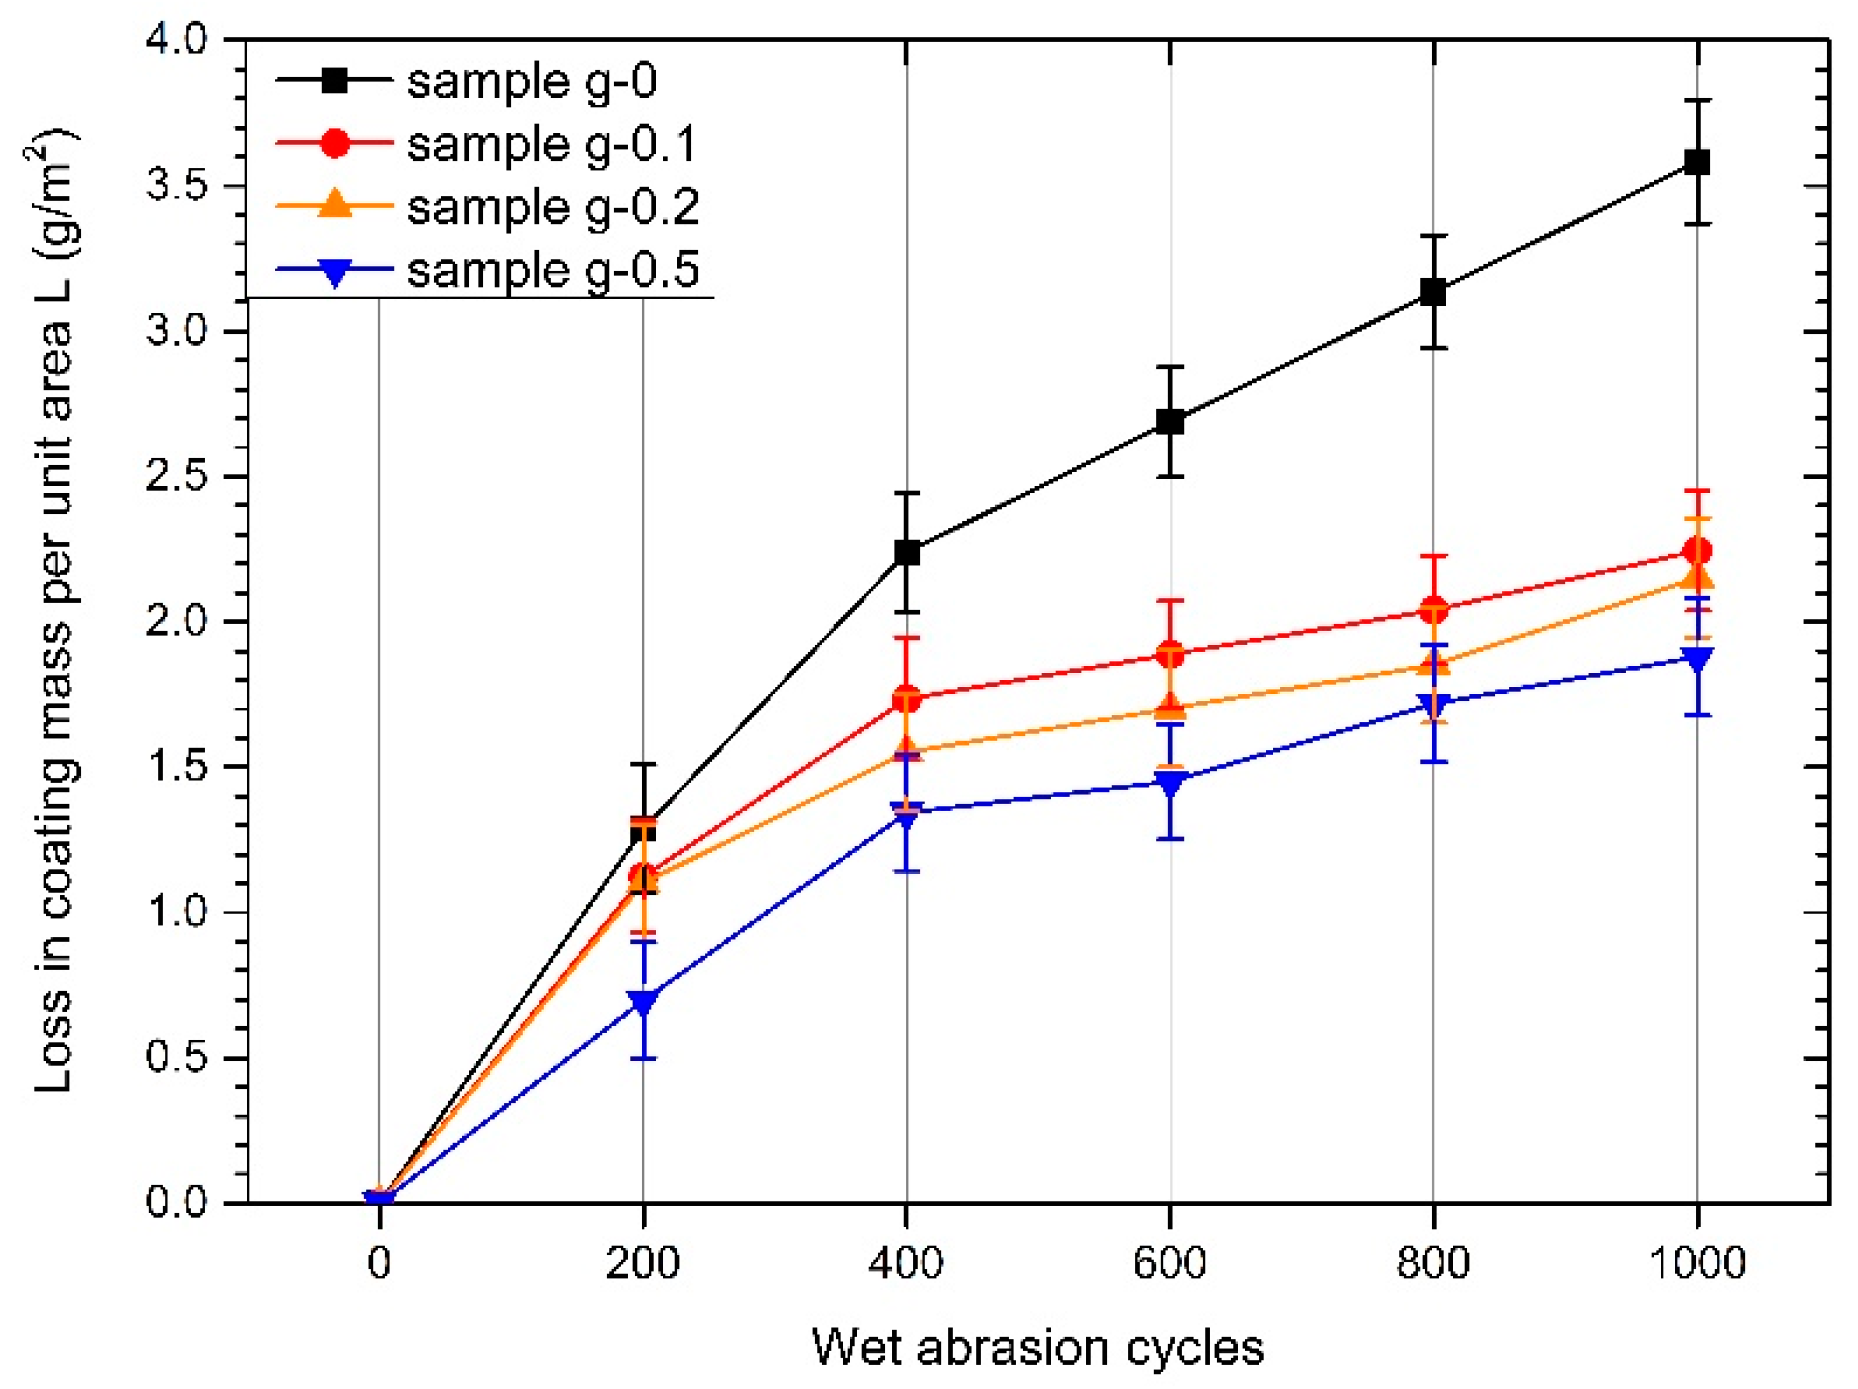
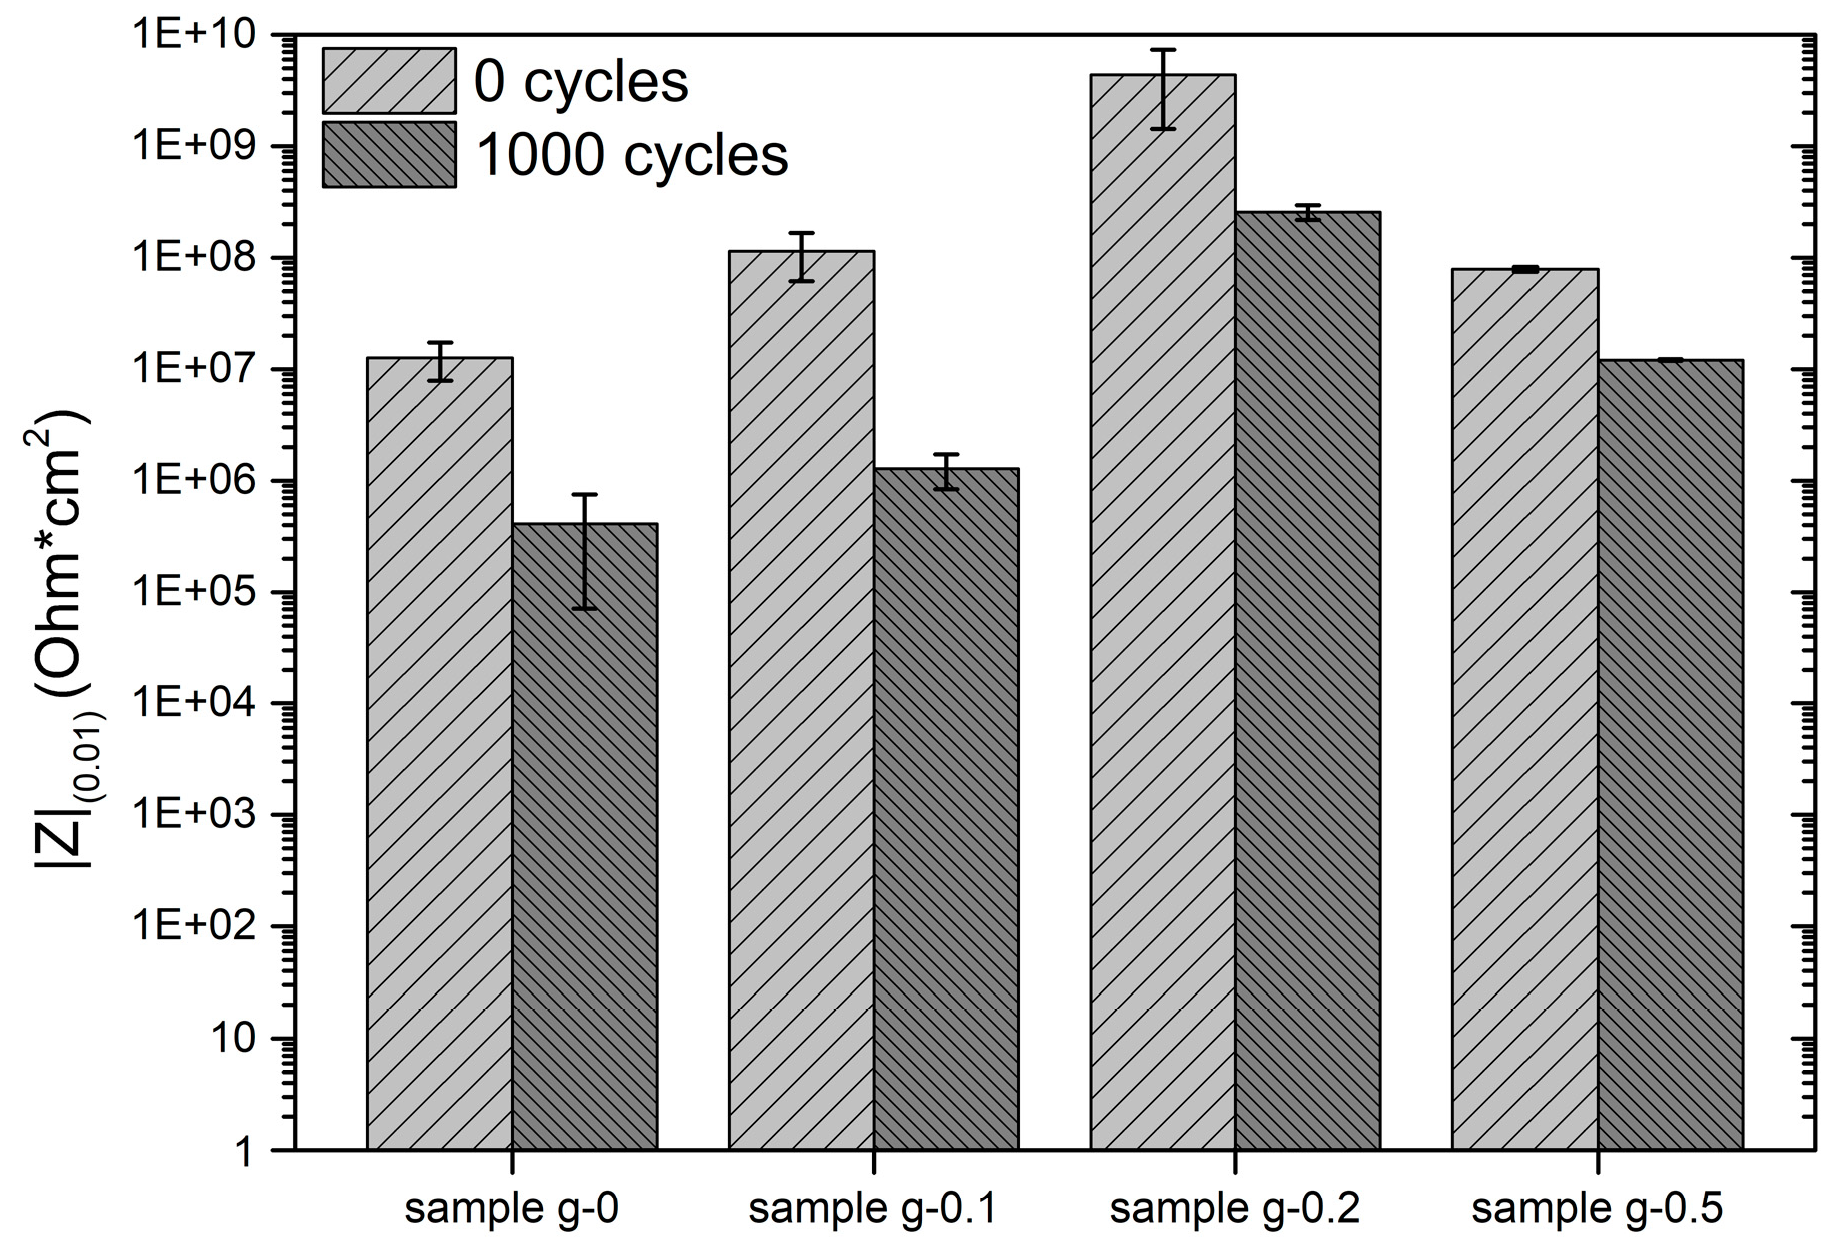
Graphene is often employed in the manufacture of protective coatings with high abrasion resistance, both as a single monolayer [69] and as a filler for composite coatings [70,71,72]. In fact, strong mechanical resistance and excellent lubricating properties are remarkable features possessed by graphene, and are often required in coatings that have to resist certain stresses or maintain their integrity in particularly aggressive environments. AFM scratching, which involves contact mode rastering of the surface at a high force, is an effective tool for the characterization of coating wear and adhesion. This technique has been used to evaluate both the pre-treatment carried out before coating deposition [73,74] and the degradation of the layer itself during environmental exposure [75].
The four types of coatings were too thick to study their delamination by AFM analysis, but AFM scratching proved to be useful. The analysis was carried out only on sample g-0.5, as it allowed observation of the behaviour of flake agglomerates on the coating surface as well as the contribution of individual fillers.
First of all, the behaviour of an fGO agglomerate was studied and compared to the performance of the acrylic matrix. As shown in Figure 8a, a scan of 50 μm by 50 μm was carried out near an accumulation of flakes using a set point voltage of 4 V, which represents a large interaction force. Subsequently, a larger area of 100 μm by 100 μm was scanned at set point equal to 0 V, to determine the depth of abrasion caused by the previous high force scan. The raised region that is lighter in color represents the region of a filler agglomerate, which does not seem to have been particularly affected by the 4 V set point scan based on the smooth profile of the topograhic mound in the scratched an unscratched region. In contrast, the polymer matrix, which is red in this image, exhibits a clear step at the end of the rastered area. This is also evident in the 3D image of Figure 8b.
Quantitative assessment of the matrix and filler regions resulting from AFM scratching is provided in Figure 9. Again, a clear demarcation of the end of the area rastered with a high force is evident in the AFM topographic image. Linescans along the two dashed lines in the image are also provided in Figure 9. Because of the roughness of the rastered filler region, a clear step at the end of the region is not evident. However, careful analysis indicates a step in the matrix (without flakes) of about 0.3 µm at a location of about 75 µm in the profile. In contrast, the profile on the agglomeration does not show any step associated with the end of the rastered region. This first analysis confirms a notable response difference between acrylic matrix and graphene-based filler agglomerates during micro abrasion by AFM scratching. The removal of polymeric material is clear and evident, while the flakes’ accumulation does not seem to be affected by the passage of the AFM tip.
The AFM scratching test is the result of a single scan, which does not provide information relating to the evolution of surface tomography over time (subjected to various scratching scans). Furthermore, the behavior of an agglomeration of fillers can be very different from the response provided by individual graphene-based sheets. The abrasion resistance of large fGOs agglomerates can be different than that of well dispersed fillers in the polymer matrix.
The topographic evolution of the surface of sample g-0.5 was monitored during 60 scans over a region of 70 μm by 70 μm a set point of 3 V, which also represents a high force. Figure 10 shows scans of an area with two flake agglomerations, but also single dispersed fillers. These single dispersed flakes become more evident as the number of AFM scans increases.
The acrylic matrix is easily degraded by the continuous passage of the abrasive tip. The morphology of the two accumulations also evolves over time, owing to the removal of the surrounding polymeric material. However, after 60 scans, high and defined peaks are still clearly visible, demonstrating the strong abrasion resistance of fGO agglomerations. This analysis is in accordance with what was previously shown in Figure 8 and Figure 9, confirming a clear difference in wear behavior of the agglomerated filler compared with the acrylic matrix. Unlike the polymeric material, the fGO agglomerations offer high resistance to removal by AFM scratching.
After rastering the surface 60 times, an expanded region 100 μm by 100 μm in size was mapped at the low set point of 0 V. The 2D and 3D images in Figure 11 show the 1.3 μm step at the edges of the rastered region that was created as a result of the abrasion of the polymer surface during the repeated passage of the tip. The magnified image in Figure 11 shows the presence of individual fGO sheets protruding from the surface, indicating the strong resistance of individual flakes to abrasion by the tip. This analysis confirms that the graphene-based flake offers high mechanical resistance not only as consequence of agglomeration processes, but also as single reinforcing fillers, which are not removed by the AFM tip, while the acrylic matrix is easily removed.
These measurements highlight and confirm the high abrasion resistance of graphene-based fillers on a microscopic scale. However, the AFM technique in scratching mode offers no information of how flakes affect the abrasion behaviour of the composite coating on macroscopic level. The samples under examination were thus subjected to scrub test analysis to study the macro abrasion resistance properties of cataphoretic acrylic coatings with fGO particles.

3.5. Scrub Test

Because of its mechanical properties, graphene has been studied as a reinforcing agent in composites with polymeric matrices, such as epoxy [76] or polyurethane [77] resins, as well as in metal matrix composites with magnesium-based metal alloys [78], in order to enhance wear and wet abrasion resistance. The scrub test is one of the most reliable testing procedures for the characterization of the mechanical properties of organic-based composite coatings. This approach is based on different types of techniques [79], which allow evaluation of the hydrophobic performance [80], as well as their antibacterial properties [81,82,83]. Finally, this particular methodology enables the determination of the reinforcing effect of pigments [84] and inorganic [85] and organic [86] fillers on the mechanical strength of composite coatings.
Despite the extensive use of graphene derivatives as a reinforcing filler in polymer-based coatings, studies that characterize the contribution of graphene, GO, or fGO additives to the abrasion resistance performance of composite layers by means of the scrub test have not been reported. This work thus also aims to assess the mechanical properties of the fGO flakes by exploiting for the first time a well-established methodology for the characterization of the abrasion resistance performance of polymer-based coatings.
The wet abrasion resistance of the coatings was assessed by subjecting the samples to wear cycles caused by an abrasive pad (3 × 8 × 1 cm3), with the support of 2.5 g/L sodium n-dodecylbenzenesulfonate solution [59]. The weight loss of the samples was monitored every 200 abrasion cycles, calculating L, the loss in coating mass per unit area, from the following:
L = ( m 0 m n ) A
where m0 and mn are the sample’s initial weight and the weight after the nth cycle, respectively, while A represents the area traversed by the scrub pad over the coating’s surface. The trend of L can be used as a quantitative evaluation of the fGO concentration contribution to the abrasion of the composite coating. Figure 12 highlights the mass loss evolution as a function of the abrasion cycles number.
A well-defined trend is evident; that is, the increase in fGO content causes a monotonic decrease in the coating mass loss during the complete sequence of the wet abrasion cycles. All four series of samples exhibit a higher abrasion rate during the first 400 test cycles, but then subsequently a lower rate of mass loss. The lower rate of mass loss in the samples containing the fillers can be explained by enrichment of the fGO flakes at the surface, which also provide a self-lubricating effect. A small amount of filler is enough to introduce an improvement in the abrasion resistance of the acrylic matrix. The beneficial effect of the functionalized graphene oxide flakes is more marked by increasing the filler concentration. This result is in accordance with what was shown above with the micro-abrasion analysis by AFM scratching test; that is, the fGO flakes, both individually and as agglomerates, offer good resistance to abrasion, at both the micro and macroscopic levels.
After 1000 abrasion cycles, the protective behavior of the coatings was assessed with EIS, and the results were compared with the measurements carried out before the scrub test. Figure 13 shows the variation of the Bode impedance modulus |Z|(0.01 Hz) before and after 1000 scrub abrasion cycles.
The defects introduced in the coatings due to the friction with the abrasive pad caused a decrease in the impedance module, as expected. As observed in Figure 13, however, the addition of fGO flakes into the cataphoretic bath enhances the protective properties of the acrylic matrix; the decrease in |Z|(0.01 Hz) after the scrub test is in fact less evident with increasing graphene-based filler amount. Furthermore, the barrier effect provided by the fGO sheets significantly improves the performance of the coatings, regardless of the abrasion phenomena; for example, sample g-0.2, after the 1000 scrub cycles, possesses higher |Z|(0.01 Hz) values even than the intact acrylic coating (sample g-0 at scrub cycle 0). The AC–DC–AC test results in Figure 4 already highlighted the beneficial contribution of the fGO flakes. The increase in coating corrosion resistance is closely related to their performance in wet abrasion processes; the graphene-based fillers, exerting high mechanical resistance in contact with abrasive material, promote the durability of the coatings and their long-term protective behaviour.
Although the abrasion cycles caused a different weight loss among the samples, the surface morphology of the four series of coatings after the scrub test appears the same. In fact, the abrasive pad, in continuous motion on the coatings’ surface, produced homogeneous abrasion and material removal. Figure 14a shows, for example, the surface of sample g-0.1 observed with the stereomicroscope.
The upper part of the image represents an area of the coating not subjected to the scrub test, and the lower darker part shows the clear lines of abrasion owing to rubbing with the abrasive pad. SEM observations of the scrubbed area (Figure 14b) highlight the homogeneity of the abrasive process; the sample possesses an irregular surface morphology, consisting of clear linear grooves. These grooves carved by the abrasion cycles are constant over the entire surface that came into contact with the brush, in the direction parallel to the movement of the pad. A higher magnification image (Figure 14c) enables the measurement of the groove widths. The largest grooves are 10 µm wide, indicating that the coatings suffered from aggressive abrasion processes, with high material removal. However, the scrub test did not result in the exposure of the metal substrate, as all the coatings have thicknesses greater than 17 µm, as summarized in Table 3. In fact, the |Z|(0.01 Hz) values of the composite coatings after 1000 abrasion cycles, shown in Figure 13, are still higher than the threshold value of 106 Ω cm2 that is considered to be protective [87,88,89].
Finally, Figure 15 shows an SEM image of sample g-0.2 after 1000 abrasion cycles. On the surface of the coating, it is possible to observe a single fGO flake, which appears lighter in the image obtained in secondary electron detection mode. Despite the material removal during the scrub test, the graphene-based fillers still seem to be anchored to the coating. As observed with AFM analyses, the sheets offer high abrasion resistance at the microscopic level, which affects the macroscopic performance of the composite coating. The high mechanical strength of graphene also enables the partial protection of the acrylic matrix surrounding the flakes, decreasing the mass loss of the coating owing to the abrasion and improving the protective performance of the composite layer. Graphene-based reinforcing fillers thus demonstrate they improve both the corrosion and abrasion resistance properties of polymer-based cataphoretic coatings.

4. Conclusions

The effect of functionalized graphene oxide filler concentration on the cathodic delamination and abrasion resistance properties of cataphoretic acrylic coating has been evaluated in this work. Despite functionalization of the fillers, high concentrations of fGO sheets exhibited agglomeration that created defects in the composite coating that resulted in a decrease in the protective performance of the coatings, as assessed by means of AC–DC–AC cycles. However, the optimized amount of filler improves the protective properties compared with the acrylic matrix with no filler, providing an effective barrier effect to solution and aggressive ions. This protection was confirmed by SKP measurements, which demonstrated the significant contribution of graphene-based fillers in decreasing cathodic delamination of the cataphoretic coating. Both AC–DC–AC and SKP delamination measurements found that the 0.2 wt.% represents the optimum amount of fGO for the protection of the acrylic matrix.
In addition to slowing to cathodic delamination processes, graphene flakes also improve the abrasion resistance of the acrylic matrix. At the microscopic level, the fGO flakes show high mechanical resistance to abrasion. AFM scratching highlighted the excellent performance of the fillers both as single flakes and as agglomerates. Furthermore, the effects caused by the use of graphene-based fillers are also evident from a macroscopic point of view; the scrub test measurements also indicated improvement in the abrasion resistance of the coatings containing the fGO flakes.
Ultimately, graphene-based fillers, if employed in the optimized concentration, can offer both improved corrosion and abrasion resistance.

Supplementary Materials

The following are available online at https://www.mdpi.com/2079-6412/10/6/602/s1, Figure S1: EIS Bode modulus and phase diagrams of (a) sample g-0, (b) sample g-0.1, (c) sample g-0.2 and (d) sample g-0.5, during the AC–DC–AC measurements. Figure S2: Working principle of the SKP equipment.

Author Contributions

Conceptualization, M.C., G.S.F. and S.R.; methodology, M.C., S.R., X.G. and G.S.F.; investigation, M.C.; data curation, M.C., S.R., X.G. and G.S.F.; writing—original draft preparation, M.C.; writing—review and editing, S.R., F.D., S.D., R.C. and G.S.F.; supervision, S.R., F.D., S.D., R.C. and G.S.F. All authors have read and agreed to the published version of the manuscript.

Funding

This research received no external funding.

Acknowledgments

The authors greatly acknowledge the contributions of Gianluca Gazzola and Marzio Marchesi (Arsonsisi, Lainate MI, Italy) regarding the paint bath supply.

Conflicts of Interest

The authors declare no conflict of interest.

References

  1. Geim, A.K.; Novoselov, K.S. The rise of graphene. Nat. Mater. 2007, 6, 183–191. [Google Scholar] [CrossRef]
  2. Novoselov, K.S.; Geim, A.K.; Morozov, S.V.; Jiang, D.; Dubonos, S.V.; Grigorieva, I.V. Electric Field Effect in Atomically Thin Carbon Films. Science 2004, 306, 666–669. [Google Scholar] [CrossRef] [Green Version]
  3. Duplock, E.J.; Scheffler, M.; Lindan, P.J.D. Hallmark of perfect graphene. Phys. Rev. Lett. 2004, 92, 1–4. [Google Scholar] [CrossRef] [Green Version]
  4. Xu, Z.; Zhang, J.; Shan, M.; Li, Y.; Li, B.; Niu, J.; Zhou, B.; Qian, X. Organosilane-functionalized graphene oxide for enhanced antifouling and mechanical properties of polyvinylidene fluoride ultrafiltration membranes. J. Membr. Sci. 2014, 458, 1–13. [Google Scholar] [CrossRef]
  5. Al-Saleh, M.H.; Sundararaj, U. Review of the mechanical properties of carbon nanofiber/polymer composites. Compos. Part A Appl. Sci. Manuf. 2011, 42, 2126–2142. [Google Scholar] [CrossRef]
  6. Lee, C.; Wei, X.; Kysar, J.W.; Hone, J. Measurement of the elastic properties and intrinsic strength of monolayer graphene. Science 2008, 321, 385–388. [Google Scholar] [CrossRef] [PubMed]
  7. Stankovich, S.; Dikin, D.A.; Dommett, G.H.B.; Kohlhaas, K.M.; Zimney, E.J.; Stach, E.A.; Piner, R.D.; Nguyen, S.T.; Ruoff, R.S. Graphene-based composite materials. Nature 2006, 442, 282–286. [Google Scholar] [CrossRef] [PubMed]
  8. Cai, D.; Yusoh, K.; Song, M. The mechanical properties and morphology of a graphite oxide nanoplatelet/polyurethane composite. Nanotechnology 2009, 20, 085712. [Google Scholar] [CrossRef]
  9. Ansari, S.; Giannelis, E.P. Functionalized graphene sheetpoly (inylidene fluoride) conductive nanocomposites. J. Polym. Sci. Part B Polym. Phys. 2009, 47, 888–897. [Google Scholar] [CrossRef]
  10. Yang, Y.G.; Chen, C.M.; Wen, Y.F.; Yang, Q.H.; Wang, M.Z. Oxidized graphene and graphene based polymer composites. New Carbon Mater. 2008, 23, 193–200. [Google Scholar] [CrossRef]
  11. Chen, F.; Ying, J.; Wang, Y.; Du, S.; Liu, Z.; Huang, Q. Effects of graphene content on the microstructure and properties of copper matrix composites. Carbon 2016, 96, 836–842. [Google Scholar] [CrossRef]
  12. Tapasztó, O.; Tapasztó, L.; Lemmel, H.; Puchy, V.; Dusza, J.; Balázsi, C.; Balázsi, K. High orientation degree of graphene nanoplatelets in silicon nitride composites prepared by spark plasma sintering. Ceram. Int. 2016, 42, 1002–1006. [Google Scholar] [CrossRef]
  13. Liu, J.; Zhang, Z.; Lv, Y.; Yan, J.; Yun, J.; Zhao, W.; Kou, K.; Zhai, C. Synthesis and characterization of ZnO NWAs/graphene composites for enhanced optical and field emission performances. Compos. B Eng. 2016, 99, 366–372. [Google Scholar] [CrossRef]
  14. Kuilla, T.; Bhadra, S.; Yao, D.; Kim, N.H.; Bose, S.; Lee, J.H. Recent advances in graphene based polymer composites. Prog. Polym. Sci. 2010, 35, 1350–1375. [Google Scholar] [CrossRef]
  15. Papageorgiou, D.G.; Kinloch, I.A.; Young, R.J. Mechanical properties of graphene and graphene-based nanocomposites. Prog. Mater. Sci. 2017, 90, 75–127. [Google Scholar] [CrossRef]
  16. Atif, R.; Shyha, I.; Inam, F. Mechanical, thermal, and electrical properties of graphene-epoxy nanocomposites—A review. Polymers 2016, 8, 281. [Google Scholar] [CrossRef]
  17. Yousefi, N.; Gudarzi, M.M.; Zheng, Q.; Lin, X.; Shen, X.; Jia, J.; Sharif, F.; Kim, J.K. Highly aligned, ultralarge-size reduced graphene oxide/polyurethane nanocomposites: Mechanical properties and moisture permeability. Compos. Part A Appl. Sci. Manuf. 2013, 49, 42–50. [Google Scholar] [CrossRef]
  18. Jing, Q.; Liu, W.; Pan, Y.; Silberschmidt, V.V.; Li, L.; Dong, Z.L. Chemical functionalization of graphene oxide for improving mechanical and thermal properties of polyurethane composites. Mater. Des. 2015, 85, 808–814. [Google Scholar] [CrossRef] [Green Version]
  19. Yu, B.; Wang, X.; Xing, W.; Yang, H.; Song, L.; Hu, Y. UV-Curable Functionalized Graphene Oxide/Polyurethane Acrylate Nanocomposite Coatings with Enhanced Thermal Stability and Mechanical Properties. Ind. Eng. Chem. Res. 2012, 51, 14629–14636. [Google Scholar] [CrossRef]
  20. Shi, Y.; Qian, X.; Zhou, K.; Tang, Q.; Jiang, S.; Wang, B.; Wang, B.; Yu, B.; Hu, Y.; Yuen, R.K.K. CuO/Graphene Nanohybrids: Preparation and Enhancement on Thermal Stability and Smoke Suppression of Polypropylene. Ind. Eng. Chem. Res. 2013, 52, 13654–13660. [Google Scholar] [CrossRef]
  21. Zhuo, D.; Wang, R.; Wu, L.; Guo, Y.; Ma, L.; Weng, Z.; Qi, J. Flame Retardancy Effects of Graphene Nanoplatelet/Carbon Nanotube Hybrid Membranes on Carbon Fiber Reinforced Epoxy Composites. J. Nanomater. 2013, 7, 1–7. [Google Scholar] [CrossRef] [Green Version]
  22. Wang, X.; Song, L.; Yang, H.; Lu, H.; Hu, Y. Synergistic Effect of Graphene on Antidripping and Fire Resistance of Intumescent Flame Retardant Poly (butylene succinate) Composites. Ind. Eng. Chem. Res. 2011, 50, 5376–5383. [Google Scholar] [CrossRef]
  23. Gong, L.; Kinloch, I.A.; Young, R.J.; Riaz, I.; Jalil, R.; Novoselov, K.S. Interfacial stress transfer in a graphene monolayer nanocomposite. Adv. Mater. 2012, 22, 2694–2697. [Google Scholar] [CrossRef] [PubMed] [Green Version]
  24. Young, R.J.; Kinloch, I.A.; Gong, L.; Novoselov, K.S. The mechanics of graphene nanocomposites: A review. Compos. Sci. Technol. 2012, 72, 1459–1476. [Google Scholar] [CrossRef]
  25. Anandan, S.; Narasinga Rao, T.; Sathish, M.; Rangappa, D.; Honma, I.; Miyauchi, M. Superhydrophilic Graphene-Loaded TiO2 Thin Film for Self-Cleaning Applications. ACS Appl. Mater. Interfaces 2012, 5, 207–212. [Google Scholar] [CrossRef]
  26. Jin, J.; Wang, X.; Song, M. Graphene-Based Nanostructured Hybrid Materials for Conductive and Superhydrophobic Functional Coatings. J. Nanosci. Nanotechnol. 2011, 11, 7715–7722. [Google Scholar] [CrossRef] [PubMed]
  27. Ramezanzadeh, B.; Ghasemi, E.; Mahdavian, M.; Changizi, E.; Mohamadzadeh Moghadam, M.H. Covalently-grafted graphene oxide nanosheets to improve barrier and corrosion protection properties of polyurethane coatings. Carbon 2015, 93, 555–573. [Google Scholar] [CrossRef]
  28. Chang, K.C.; Hsu, M.H.; Lu, H.I.; Lai, M.C.; Liu, P.J.; Hsu, C.H.; Ji, W.F.; Chuang, T.L.; Wei, Y.; Yeh, J.M.; et al. Room-temperature cured hydrophobic epoxy/graphene composites as corrosion inhibitor for cold-rolled steel. Carbon 2014, 66, 144–153. [Google Scholar] [CrossRef]
  29. Ramezanzadeh, B.; Niroumandrad, S.; Ahmadi, A.; Mahdavian, M.; Mohamadzadeh Moghadam, M.H. Enhancement of barrier and corrosion protection performance of an epoxy coating through wet transfer of amino functionalized graphene oxide. Corros. Sci. 2016, 103, 283–304. [Google Scholar] [CrossRef]
  30. Othman, N.H.; Ismail, M.C.; Mustapha, M.; Sallih, N.; Kee, K.E.; Jaal, R.A. Graphene-based polymer nanocomposites as barrier coatings for corrosion protection. Prog. Org. Coat. 2019, 135, 82–99. [Google Scholar] [CrossRef]
  31. Ray, S.C. Application and Uses of Graphene, 1st ed.; Elsevier: Amsterdam, The Netherlands, 2015; pp. 1–92. [Google Scholar]
  32. Kamal, M.R.; Uribe-Calderon, J. Nanoparticles and Polymer Nanocomposites, Graphite, Graphene, and Their Polymer Nanocomposites, 1st ed.; CRC Press: Boca Raton, FL, USA, 2013; pp. 353–392. [Google Scholar]
  33. Huang, H.D.; Ren, P.G.; Chen, J.; Zhang, W.Q.; Ji, X.; Li, Z.M. High barrier graphene oxide nanosheet/poly(vinyl alcohol) nanocomposite films. J. Membr. Sci. 2012, 409–410, 156–163. [Google Scholar] [CrossRef]
  34. Kalaitzidou, K.; Fukushima, H.; Drzal, L.T. Multifunctional polypropylene composites produced by incorporation of exfoliated graphite nanoplatelets. Carbon 2007, 45, 1446–1452. [Google Scholar] [CrossRef]
  35. Yang, S.Y.; Lin, W.N.; Huang, Y.L.; Tien, H.W.; Wang, J.Y.; Ma, C.C.M.; Li, S.M.; Wang, Y.S. Synergetic effects of graphene platelets and carbon nanotubes on the mechanical and thermal properties of epoxy composites. Carbon 2011, 49, 793–803. [Google Scholar] [CrossRef]
  36. Wang, X.; Xing, W.; Zhang, P.; Song, L.; Yang, H.; Hu, Y. Covalent functionalization of graphene with organosilane and its use as a reinforcement in epoxy composites. Compos. Sci. Technol. 2012, 72, 737–743. [Google Scholar] [CrossRef]
  37. Rossi, S.; Calovi, M. Addition of graphene oxide plates in cataphoretic deposited organic coatings. Prog. Org. Coat. 2018, 424, 40–47. [Google Scholar] [CrossRef]
  38. Pourhashem, S.; Vaezi, M.R.; Rashidi, A.; Bagherzadeh, M.R. Distinctive roles of silane coupling agents on the corrosion inhibition performance of graphene oxide in epoxy coatings. Prog. Org. Coat. 2017, 111, 47–56. [Google Scholar] [CrossRef]
  39. Pourhashem, S.; Rashidi, A.; Vaezi, M.R.; Bagherzadeh, M.R. Excellent corrosion protection performance of epoxy composite coatings filled with aminosilane functionalized graphene oxide. Surf. Coat. Technol. 2017, 317, 1–9. [Google Scholar] [CrossRef]
  40. Mo, M.; Zhao, W.; Chen, Z.; Yu, Q.; Zeng, Z.; Wu, X.; Xue, Q. Excellent tribological and anti-corrosion performance of polyurethane composite coatings reinforced with functionalized graphene and graphene oxide nanosheets. RSC Adv. 2015, 5, 56486–56497. [Google Scholar] [CrossRef]
  41. Mo, M.; Zhao, W.; Chen, Z.; Liu, E.; Xue, Q. Corrosion inhibition of functional graphene reinforced polyurethane nanocomposite coatings with regular textures. RSC Adv. 2016, 6, 7780–7790. [Google Scholar] [CrossRef]
  42. Ramezanzadeh, B.; Bahlakeh, G.; Mohamadzadeh Moghadam, M.H.; Miraftab, R. Impact of size-controlled p-phenylenediamine (PPDA)-functionalized graphene oxide nanosheets on the GO-PPDA/Epoxy anti-corrosion, interfacial interactions and mechanical properties enhancement: Experimental and quantum mechanics investigations. Chem. Eng. J. 2018, 335, 737–755. [Google Scholar] [CrossRef]
  43. Yu, Y.-H.; Lin, Y.-Y.; Lin, C.-H.; Chan, C.-C.; Huang, Y.-C. High-performance polystyrene/graphene-based nanocomposites with excellent anti-corrosion properties. Polym. Chem. 2014, 5, 535–550. [Google Scholar] [CrossRef]
  44. Calovi, M.; Callone, E.; Ceccato, R.; Deflorian, F.; Rossi, S.; Dirè, S. Effect of the organic functional group on the grafting ability of trialkoxysilanes onto graphene oxide: A combined NMR, XRD and ESR study. Materials 2019, 12, 3828. [Google Scholar] [CrossRef] [PubMed] [Green Version]
  45. Calovi, M.; Dirè, S.; Ceccato, R.; Deflorian, F.; Rossi, S. Corrosion protection properties of functionalized graphene—Acrylate coatings produced by cataphoretic deposition. Prog. Org. Coat. 2019, 136. [Google Scholar] [CrossRef]
  46. Calovi, M.; Rossi, S.; Deflorian, F.; Dirè, S.; Ceccato, R. Effect of functionalized graphene oxide concentration on the corrosion resistance properties provided by cataphoretic acrylic coatings. Mat. Chem. Phys. 2020, 239, 121984–121996. [Google Scholar] [CrossRef]
  47. Almeida, E.; Alves, I.; Brites, C.; Fedrizzi, L. Cataphoretic and autophoretic automotive primers A comparative study. Prog. Org. Coat. 2003, 46, 8–20. [Google Scholar] [CrossRef]
  48. Rossi, S.; Calovi, M.; Fedel, M. Corrosion protection of aluminum foams by cataphoretic deposition of organic coatings. Prog. Org. Coat. 2017, 109, 144–151. [Google Scholar] [CrossRef]
  49. Ramdé, T.; Ecco, L.G.; Rossi, S. Visual appearance durability as function of natural and accelerated ageing of electrophoretic styrene-acrylic coatings: Influence of yellow pigment concentration. Prog. Org. Coat. 2017, 103, 23–32. [Google Scholar] [CrossRef]
  50. Deflorian, F.; Rossi, S.; Prosseda, S. Improvement of corrosion protection system for aluminium body bus used in public transportation. Mater. Des. 2006, 27, 758–769. [Google Scholar] [CrossRef]
  51. Fedrizzi, L.; Rodriguez, F.J.; Rossi, S.; Deflorian, F. Corrosion study of industrial painting cycles for garden furniture. Prog. Org. Coat. 2003, 46, 62–73. [Google Scholar] [CrossRef]
  52. Zadeh, M.A.; van der Zwaag, S.; García, S.J. Assessment of healed scratches in intrinsic healing coatings by AC/DC/AC accelerated electrochemical procedure. Surf. Coat. Technol. 2016, 303, 396–405. [Google Scholar] [CrossRef]
  53. Khun, N.W.; Frankel, G.S. Effects of surface roughness texture and polymerdegradation on cathodic delamination of epoxy coated steel samples. Corros. Sci. 2013, 67, 152–160. [Google Scholar] [CrossRef]
  54. Leng, A.; Streckel, H.; Stratmann, M. The delamination of polymeric coatingsfrom steel. Part 1: Calibration of the Kelvin probe and basic delaminationmechanism. Corros. Sci. 1999, 41, 547–578. [Google Scholar] [CrossRef]
  55. Frankel, G.S.; Stratmann, M.; Rohwerder, M.; Michalik, A.; Maier, B.; Dora, J.; Wicinski, M. Potential control under thin aqueous layers using a Kelvin probe. Corros. Sci. 2007, 49, 2021–2036. [Google Scholar] [CrossRef] [Green Version]
  56. Khun, N.W.; Frankel, G.S. Cathodic delamination of polyurethane/multiwalled carbon nanotubecomposite coatings from steel substrates. Prog. Org. Coat. 2016, 99, 55–60. [Google Scholar] [CrossRef]
  57. Paints and Varnishes—Determination of Wet-Scrub Resistance and Cleanability of Coatings; BS EN ISO 11998:2006; BSI British Standards: London, UK, 2006; pp. 1–11.
  58. Da Silva Lopes, T.; Lopes, T.; Martins, D.; Carneiro, C.; Machado, J.; Mendes, A. Accelerated aging of anticorrosive coatings: Two-stage approach to the AC/DC/AC electrochemical method. Prog. Org. Coat. 2020, 138, 105365. [Google Scholar] [CrossRef]
  59. Allahar, K.N.; Upadhyay, V.; Bierwagen, G.P. Characterizing the Relaxation of the Open-Circuit Potential During an AC-DC-AC Accelerated Test. Corrosion 2010, 66, 095001–095011. [Google Scholar] [CrossRef]
  60. García, S.J.; Suay, J. Optimization of deposition voltage of cataphoretic automotive primers assessed by EIS and AC/DC/AC. Prog. Org. Coat. 2009, 66, 306–313. [Google Scholar] [CrossRef]
  61. Qian, X.; Song, L.; Yu, B.; Yang, W.; Wang, B.; Hu, Y.; Yuen, R.K.K. One-pot surface functionalization and reduction of graphene oxide with long-chain molecules: Preparation and its enhancement on the thermal and mechanical properties of polyuria. Chem. Eng. J. 2014, 236, 233–241. [Google Scholar] [CrossRef]
  62. Nazarov, A.; Olivier, M.G.; Thierry, D. SKP and FT-IR microscopy study of the paint corrosion de-adhesion from the surface of galvanized steel. Prog. Org. Coat. 2012, 74, 356–364. [Google Scholar] [CrossRef]
  63. Glover, C.F.; Richards, C.A.J.; Williams, G.; McMurray, H.N. Evaluation of multi-layered graphene nano-platelet composite coatings for corrosion control part II—Cathodic delamination kinetics. Corros. Sci. 2018, 136, 304–310. [Google Scholar] [CrossRef] [Green Version]
  64. Leng, A.; Streckel, H.; Stratmann, M. The delamination of polymeric coatings from steel. Part 2: First stage of delamination effect of type and concentration of cations on delamination, chemical analysis of the interface. Corros. Sci. 1999, 41, 579–597. [Google Scholar] [CrossRef]
  65. Wielant, J.; Ponser, R.; Grundmeier, G.; Terryn, H. Cathodic delamination ofpolyurethane films on oxide covered steel-combined adhesion and interfaceelectrochemical studies. Corros. Sci. 2009, 51, 1664–1670. [Google Scholar] [CrossRef]
  66. Stratmann, M.; Leng, A.; Furbeth, W.; Streckel, H.; Gehmecker, H.; Grobe-Brinkhaus, K.H. The scanning Kelvin probe; a new technique for the in situanalysis of the delamination of organic coatings. Prog. Org. Coat. 1996, 27, 261–267. [Google Scholar] [CrossRef]
  67. Linossier, I.; Gaillard, M.; Romand, M. A spectroscopic technique for studies ofwater transport along the interface and hydrolytic stability ofpolymer/substrate systems. J. Adhes. 1999, 70, 221–239. [Google Scholar] [CrossRef]
  68. Kinloch, A.J. The science of adhesion. Part 2: Mechanics and mechanisms of adhesion. J. Mater. Sci. 1982, 17, 617–651. [Google Scholar] [CrossRef]
  69. Tong, L.B.; Zhang, J.B.; Xu, C.; Wang, X.; Song, S.Y.; Jiang, Z.H.; Kamado, S.; Cheng, L.R.; Zhang, H.J. Enhanced corrosion and wear resistances by graphene oxide coating on the surface of Mg-Zn-Ca alloy. Carbon 2016, 109, 340–351. [Google Scholar] [CrossRef]
  70. Feng, J.; Wang, X.; Guo, P.; Wang, Y.; Luo, X. Mechanical Properties and Wear Resistance of Sulfonated Graphene/Waterborne Polyurethane Composites Prepared by In Situ Method. Polymers 2018, 10, 75. [Google Scholar] [CrossRef] [Green Version]
  71. Wang, L.; Liu, S.; Guo, J.; Zhang, Q.; Zhou, F.; Wang, Y.; Chu, R. Study on the wear resistance of graphene modified nanostructured Al2O3/TiO2 coatings. Appl. Surf. Sci. 2019, 492, 272–279. [Google Scholar] [CrossRef]
  72. Wang, X.; Qi, X.; Lin, Z.; Battocchi, D. Graphene Reinforced Composites as Protective Coatings for Oil and Gas Pipelines. Nanomaterials 2018, 8, 1005. [Google Scholar] [CrossRef] [Green Version]
  73. Adhikari, S.; Frankel, G.S.; Bammel, B.D.; Zimmerman, J. AFM Scratching for Adhesion Studies of Thin Polymer Coatings on Steel. J. Adhes. Sci. Technol. 2012, 26, 1591–1609. [Google Scholar] [CrossRef]
  74. Khun, N.W.; Frankel, G.S.; Zimmerman, J. Investigation of Surface Morphology, Wear Resistance, and Adhesiveness of AA6061-T6 Treated in a Hexafluorozirconic Acid-Based Solution. Corrosion 2013, 69, 259–267. [Google Scholar] [CrossRef]
  75. Seong, J.; Frankel, G.S. Assessment of Coating Adhesion Degradation by Atomic Force Microscopy Scratching. Corrosion 2012, 68. [Google Scholar] [CrossRef]
  76. Wang, X.; Tang, F.; Qi, X.; Lin, Z. Mechanical, electrochemical, and durability behavior of graphene nano-platelet loaded epoxy-resin composite coatings. Compos. Part B 2019, 176, 107103. [Google Scholar] [CrossRef]
  77. Kalea, M.B.; Luo, Z.; Zhang, X.; Dhamodharan, D.; Divakaran, N.; Mubarak, S.; Wu, L.; Xu, Y. Waterborne polyurethane/graphene oxide-silica nanocomposites with improved mechanical and thermal properties for leather coatings using screen printing. Polymer 2019, 170, 43–53. [Google Scholar] [CrossRef]
  78. Wu, L.; Wu, R.; Hou, L.; Zhang, J.; Zhang, M. Microstructure, mechanical properties and wear performance of AZ31 matrix composites reinforced by graphene nanoplatelets(GNPs). J. Alloys Compd. 2018, 750, 530–536. [Google Scholar] [CrossRef]
  79. Kirsch, S.; Pfau, A.; Frechen, T.; Schrof, W.; Pfohler, P.; Francke, D. Scrub resistance of highly pigmented paints: A study on abrasion mechanisms of different scrub techniques. Prog. Org. Coat. 2001, 43, 99–110. [Google Scholar] [CrossRef]
  80. Lopez, A.B.; De la Cal, J.C.; Asua, J.M. From fractal polymer dispersions to mechanically resistant waterborne superhydrophobic coatings. Polymer 2017, 124, 12–19. [Google Scholar] [CrossRef]
  81. Kaew-on, N.; Katemake, P.; Prasongsuk, S. Primer formulations with antibacterial properties for murals. Prog. Org. Coat. 2020, 138, 105395. [Google Scholar] [CrossRef]
  82. Kok, K.; Young, T.M. Evaluation of insect residue resistant coatings—Correlation of a screening method with a conventional assessment technique. Prog. Org. Coat. 2014, 77, 1382–1390. [Google Scholar] [CrossRef]
  83. Féat, A.; Federle, W.; Kamperman, M.; Murray, M.; Van der Gucht, J.; Taylor, P. Slippery paints: Eco-friendly coatings that cause ants to slip. Prog. Org. Coat. 2019, 135, 331–344. [Google Scholar] [CrossRef]
  84. De Oliveira, M.P.; Reggiani Silva, C.; Muller Guerrini, L. Effect of itaconic acid on the wet scrub resistance of highly pigmented paints for architectural coatings. J. Coat. Technol. Res. 2011, 8, 439–447. [Google Scholar] [CrossRef]
  85. Zhang, J.; Lan, P.; Li, J.; Xu, H.; Wang, Q.; Zhang, X.; Zheng, L.; Lu, Y.; Dai, N.; Song, W. Sol–gel derived near-UV and visible antireflection coatings from hybridized hollow silica nanospheres. J. Sol-Gel Sci. Technol. 2014, 71, 267–275. [Google Scholar] [CrossRef]
  86. Khanjani, J.; Hanifpour, A.; Pazokifard, S.; Zohuriaan-Mehr, M.J. Waterborne acrylic-styrene/PDMS coatings formulated by different particle sizes of PDMS emulsions for outdoor applications. Prog. Org. Coat. 2020, 141, 105267. [Google Scholar] [CrossRef]
  87. Rossi, S.; Deflorian, F.; Fontanari, L.; Cambruzzi, A.; Bonora, P.L. Electrochemical measurements to evaluate the damage due to abrasion on organic protective system. Prog. Org. Coat. 2005, 52, 288–297. [Google Scholar] [CrossRef]
  88. Akbarinezhad, E.; Bahremandi, M.; Faridi, H.R.; Rezaei, F. Another approach for ranking and evaluating organic paint coatings via electrochemical impedance spectroscopy. Corros. Sci. 2009, 51, 356–363. [Google Scholar] [CrossRef]
  89. Amirudin, D.T.A.; Amirudin, A.; Thierry, D. Application of electrochemical impedance spectroscopy to study the degradation of polymer-coated metals. Prog. Org. Coat. 1995, 26, 1–28. [Google Scholar] [CrossRef]
Figure 1. Schematic of the AC–DC–AC (alternating-direct-alternating current method) test procedure [52].
Coatings 10 00602 g001
Figure 2. Bright field image and corresponding EDS (Energy Dispersive X-ray Spectrometry) maps of functionalized graphene oxide (fGO) flakes observed by scanning transmission electron microscope (S/TEM). (a) TEM micrograph; (b) carbon element map; (c) oxygen element map; (d) silicon element map.
Coatings 10 00602 g002aCoatings 10 00602 g002b
Figure 3. Dimensional distribution of the flakes inside the coatings, with relative stereomicroscope observation (in the inset). (a) sample g-0.1; (b) sample g-0.2; (c) sample g-0.5.
Coatings 10 00602 g003
Figure 4. Evolution of the Bode modulus |Z|(0.01) during the AC–DC–AC cycles. Solid and dashed lines represent replicates of the same series of samples.
Coatings 10 00602 g004
Figure 5. Optical stereomicroscope observations of the blister at the end of the AC–DC–AC test. (a) sample g-0; (b) sample g-0.1; (c) sample g-0.2; (d) sample g-0.5.
Coatings 10 00602 g005
Figure 6. Scanning Kelvin probe (SKP) potential profiles of acrylic coated carbon steel sample with different amounts of fGO flakes measured with 3.5 wt.% NaCl solution as a function of time. SHE, standard hydrogen electrode. (a) sample g-0; (b) sample g-0.1; (c) sample g-0.2; (d) sample g-0.5.
Coatings 10 00602 g006
Figure 7. Delamination front positions of acrylic composite coated carbon steel samples with different fGO contents as a function of time, determined from the SKP potential profiles presented in Figure 6.
Coatings 10 00602 g007
Figure 8. Surface topography of sample g-0.5 after scratching the surface with a first 50 μm by 50 μm scan area at a set-point voltage of 4 V, and a subsequent 100 μm by 100 μm scan area at a set-point voltage of 0 V: (a) top view and (b) 3D image.
Coatings 10 00602 g008
Figure 9. Detail of the abrasion front, with related profile analysis. The orange line represents the profile of an area of the acrylic matrix, while the blue line indicates the profile of an area with agglomerates of fGO.
Coatings 10 00602 g009
Figure 10. Surface topography evolution of sample g-0.5 after scratching the surface with several 70 μm by 70 μm scan areas at a set-point voltage of 3 V. (a) 1 scan; (b) 20 scans; (c) 40 scans; (d) 60 scans.
Coatings 10 00602 g010
Figure 11. 3D surface topography of sample g-0.5 after scratching the surface with a 100 μm by 100 μm scan area at a set-point voltage of 0 V. On the left, focus on the performance of individual fGO flakes.
Coatings 10 00602 g011
Figure 12. Loss in coatings mass per unit area, as a function of the abrasion cycles number.
Coatings 10 00602 g012
Figure 13. Bode impedance modulus |Z|(0.01 Hz) before and after the scrub test.
Coatings 10 00602 g013
Figure 14. Optical stereomicroscope (a) and SEM (b,c) micrographs of sample g-0.1 surface morphology after the 1000 scrub test cycles.
Coatings 10 00602 g014
Figure 15. SEM micrograph of a fGO flake on g-0.2 surface after the 1000 cycles of scrub test.
Coatings 10 00602 g015
Table 1. Labelling of samples with different functionalized graphene oxide (fGO) concentration.
BathfGO Concentration (wt.%)Sample Nomenclature
Clear coat0.0g-0
0.1g-0.1
0.2g-0.2
0.5g-0.5
Table 2. Flakes’ dimension distribution inside the cataphoretic coatings.
Diameter Range (µm)Sample g-0.1Sample g-0.2Sample g-0.5
Percentage (%)
0–566.4167.5168.63
5–1023.0921.8618.88
10–158.596.496.53
15–202.432.252.75
20–251.060.921.39
25–300.280.510.77
30–350.160.190.38
35–400.040.090.33
40–45-0.060.12
45–50-0.070.07
50–55-0.010.07
55–60-0.030.06
60–65---
65–70--0.01
70–75--0.01
Table 3. Coating thickness, with relative largest filler agglomeration detected.
SampleCoating Thickness (µm)Largest Filler Agglomeration Range (µm)
g-030.4 ± 2.50
g-0.126.4 ± 1.335–40
g-0.225.4 ± 1.055–60
g-0.517.8 ± 0.970–75

