Experimental Assessment of the Performance of Two Marine Coatings to Curb Biofilm Formation of Microfoulers

 , , ,
, , ,  ,
,  and
and
Abstract
1. Introduction
2. Materials and Methods
2.1. Surface Preparation
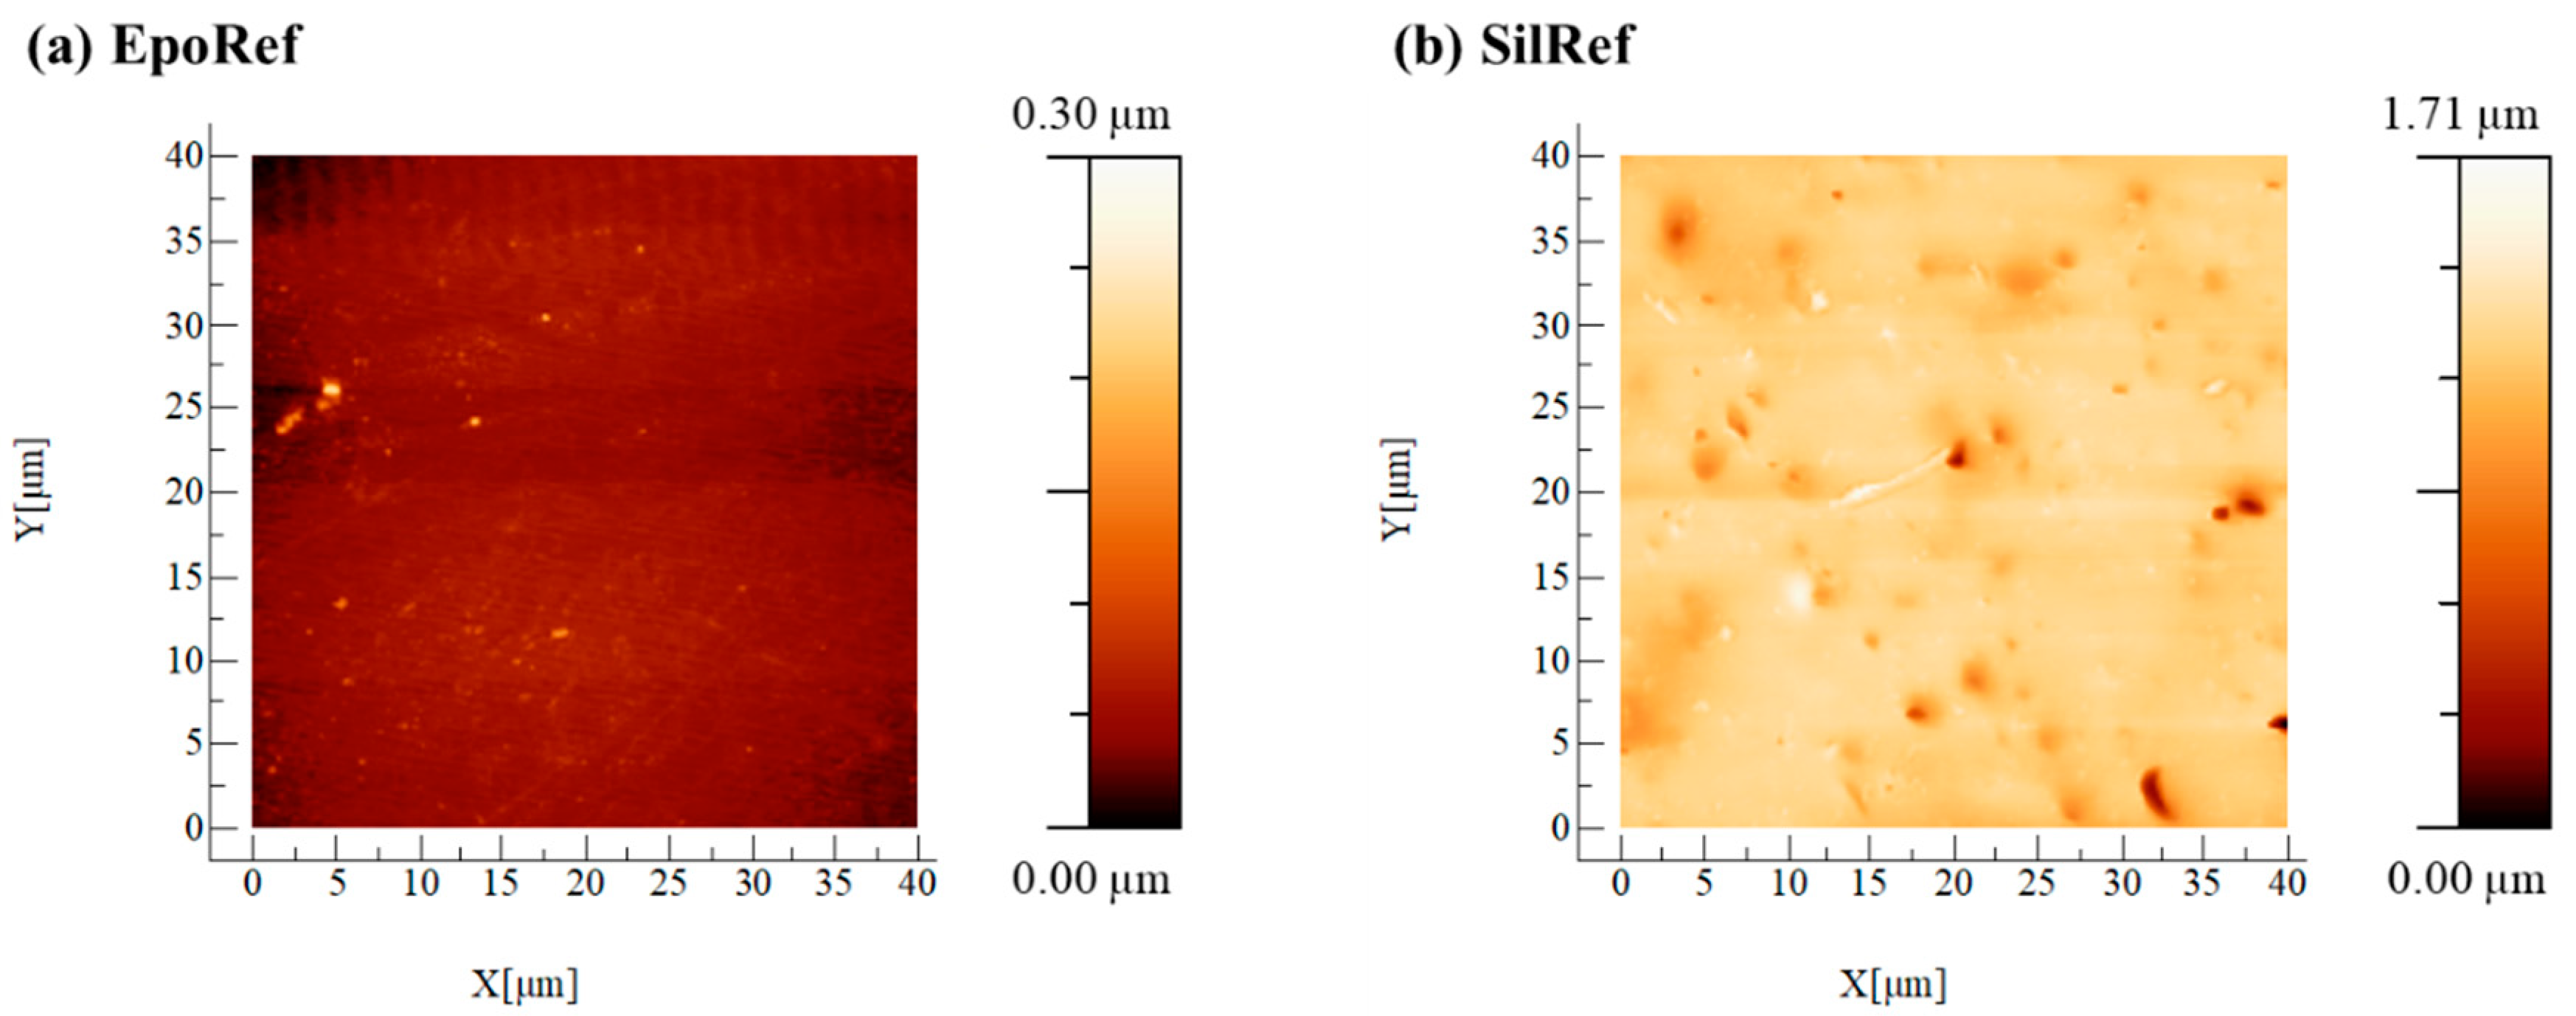
2.2. Surface Characterization
2.2.1. Atomic Force Microscopy (AFM)
2.2.2. Static Contact Angle Measurements and Surface Free Energy Estimation
2.3. Marine Organisms and Growth Conditions
2.4. Biofilm Formation
2.5. Biofilm Analysis
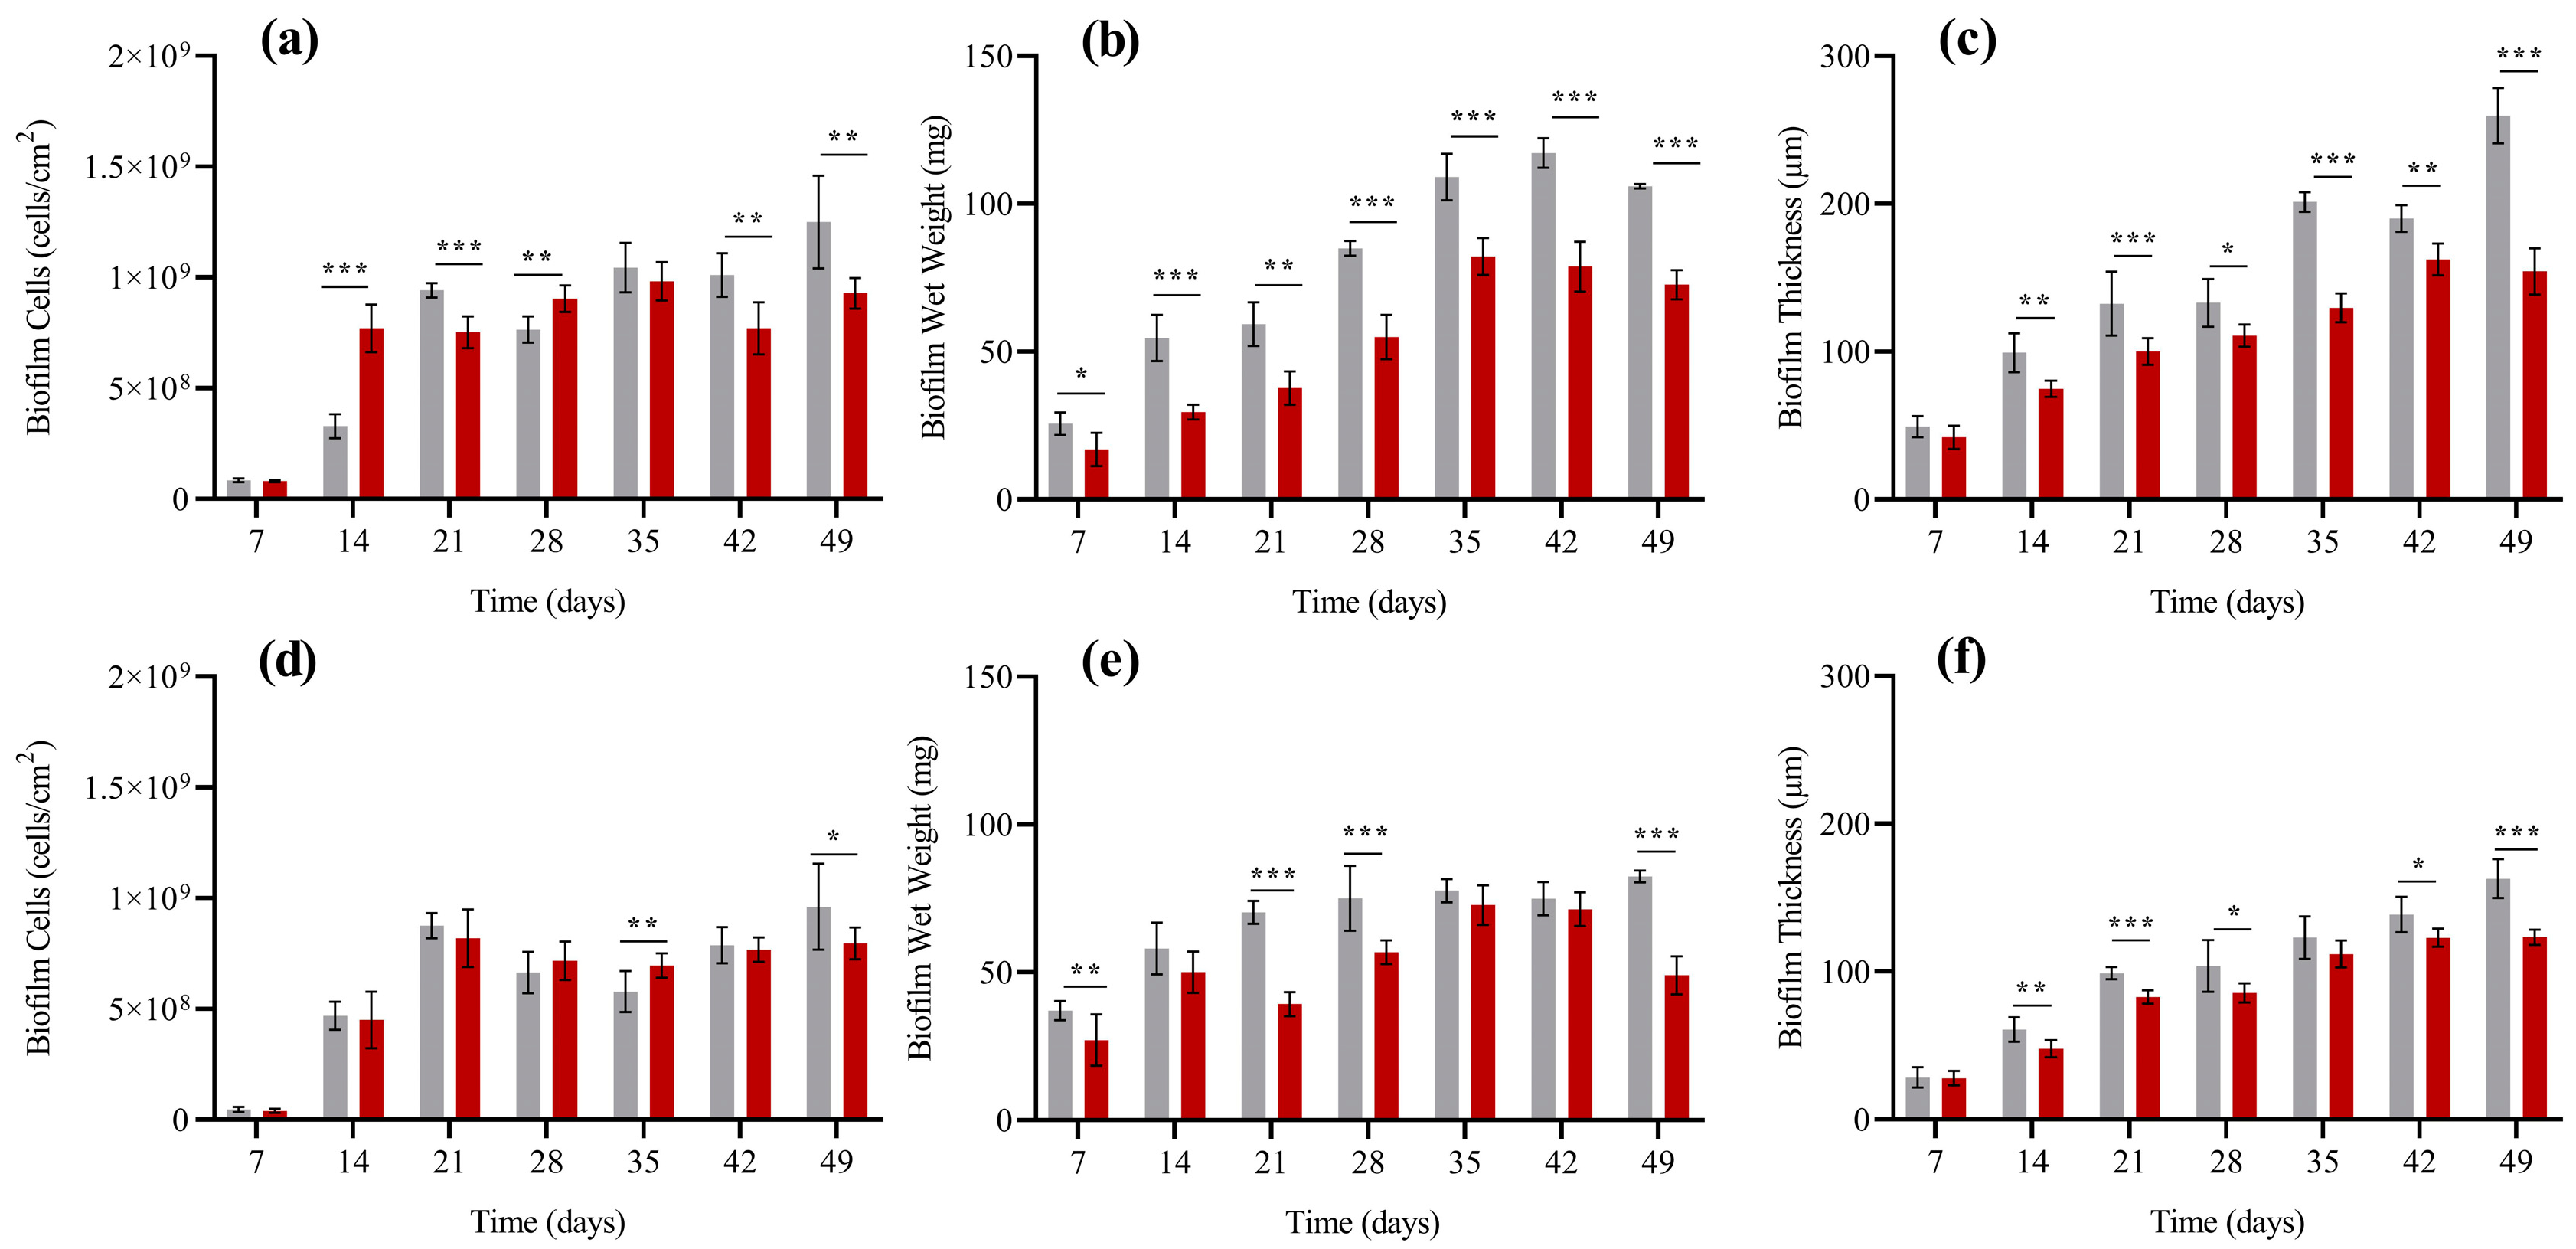
2.5.1. Biofilm Cell Counting and Wet Weight
2.5.2. Biofilm Thickness
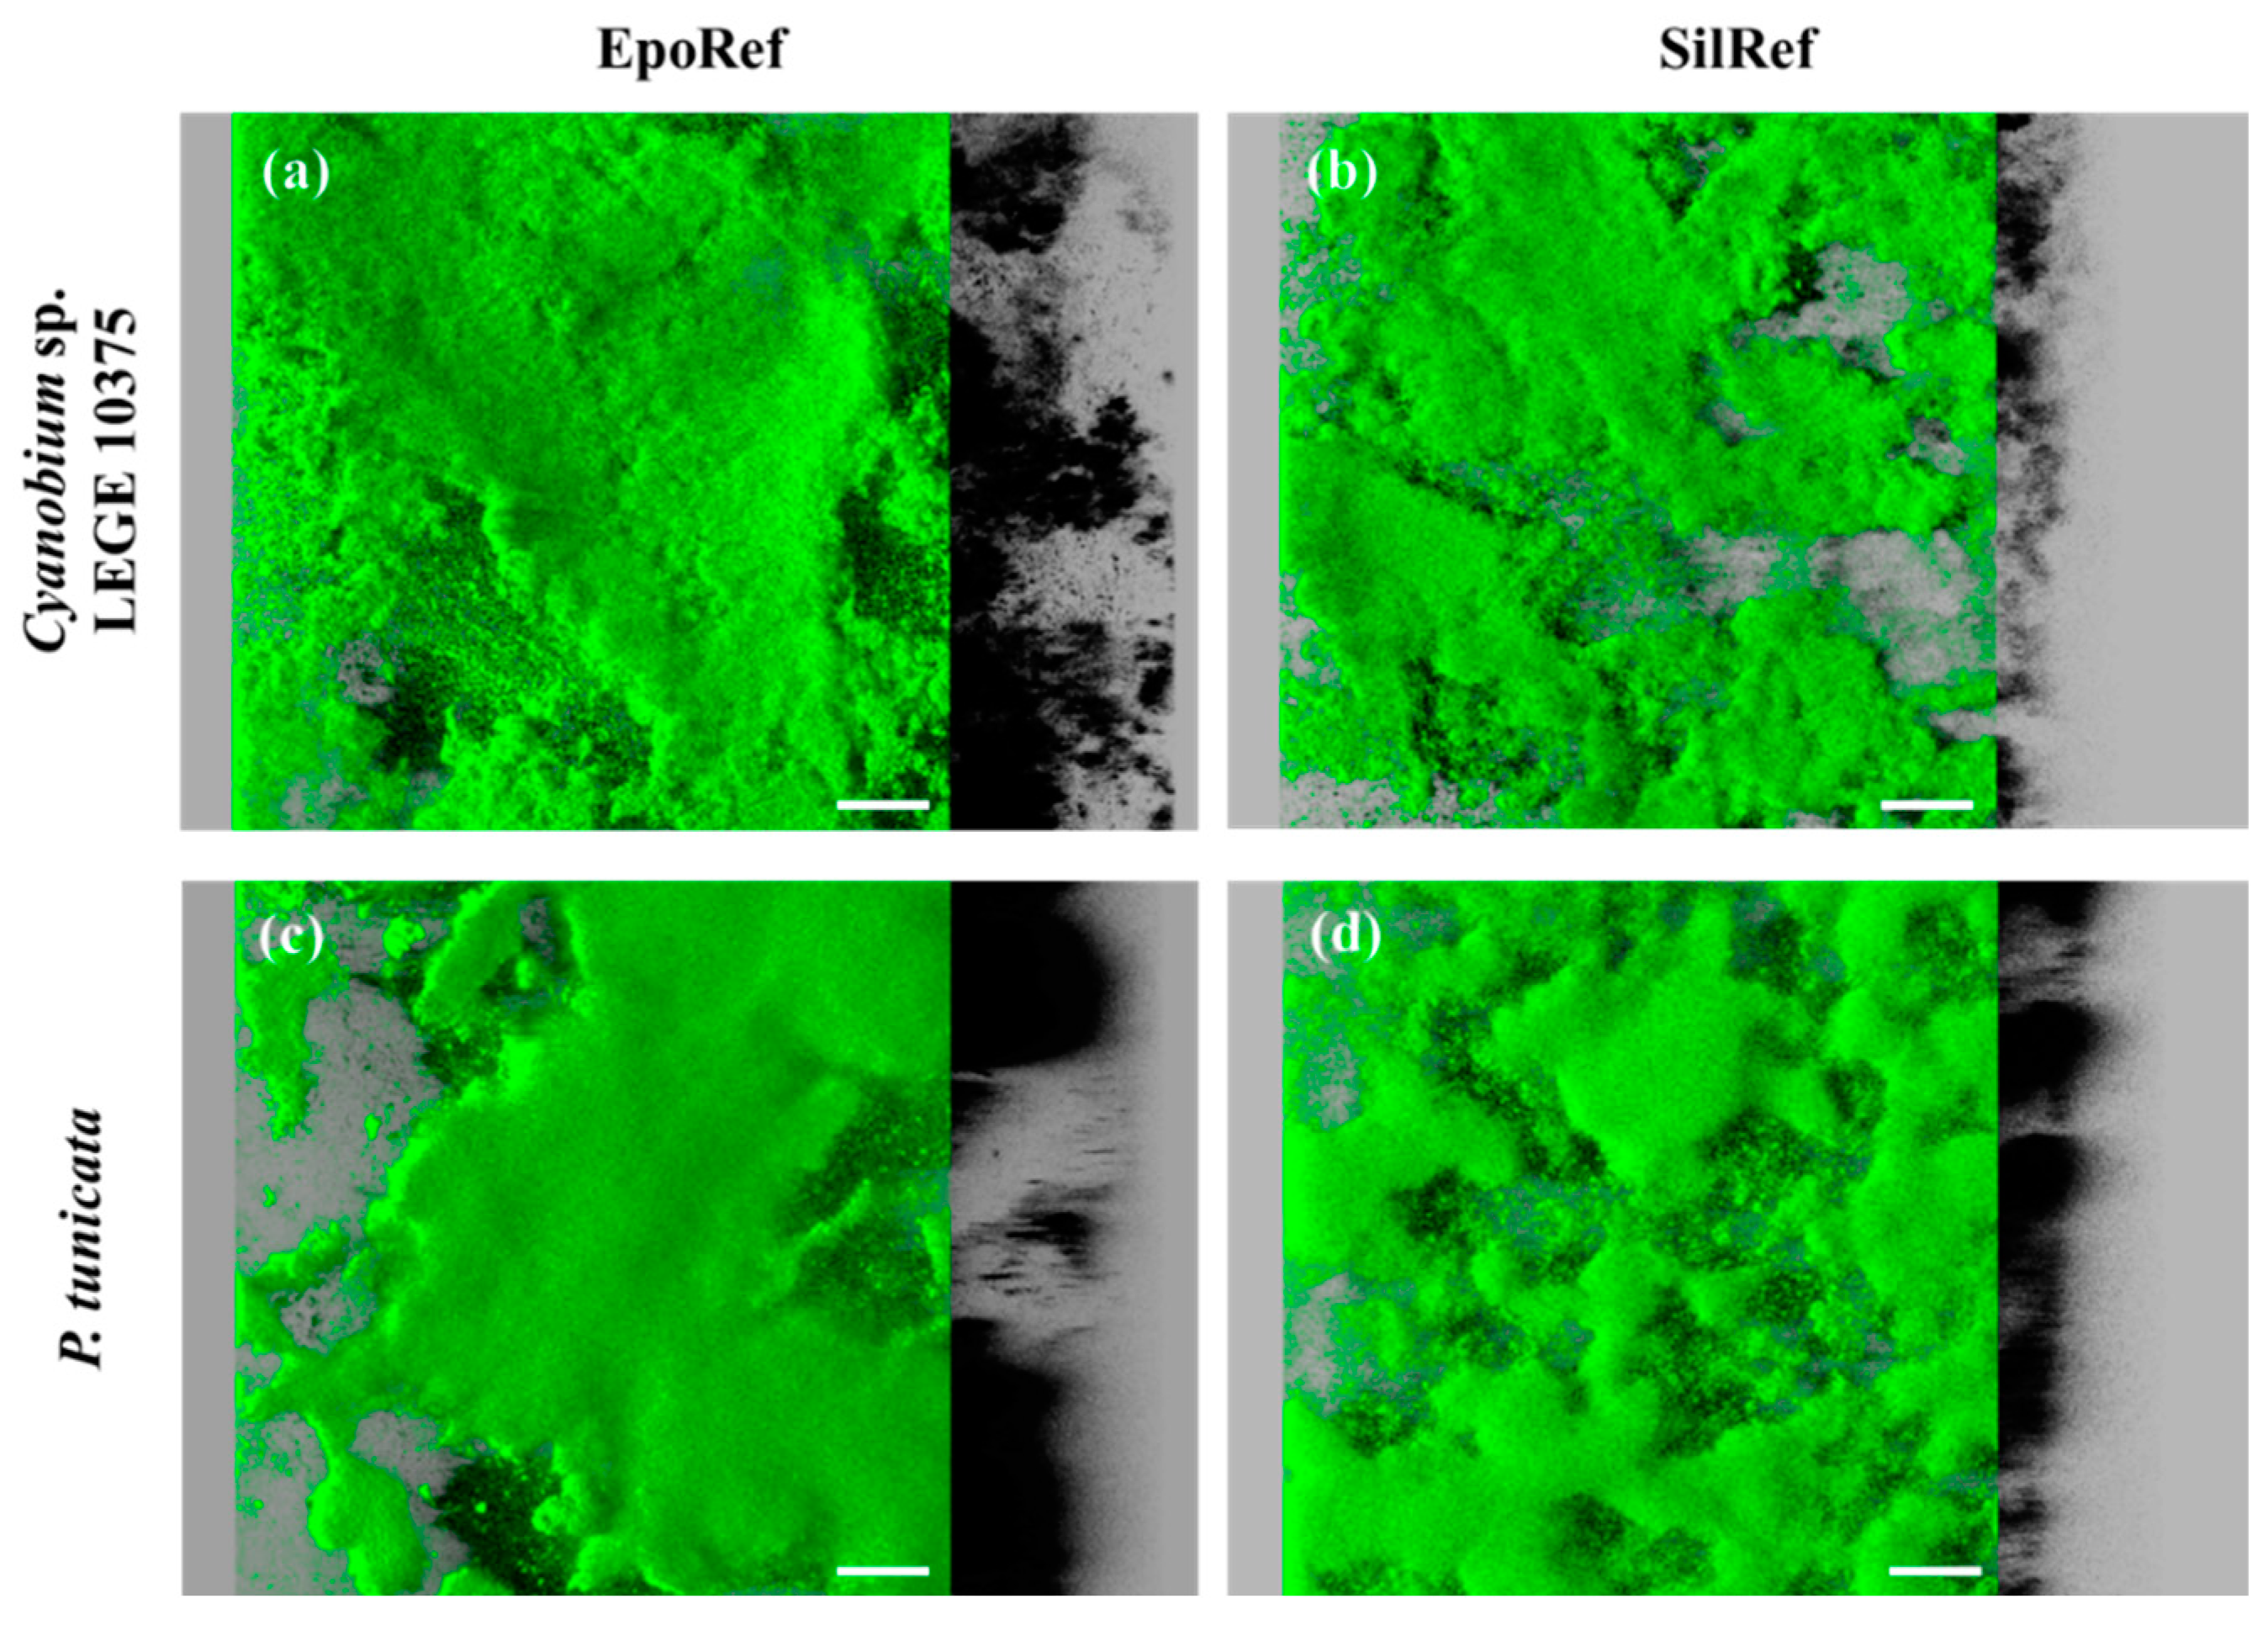
2.5.3. Confocal Laser Scanning Microscopy (CLSM)
2.6. Data Analysis
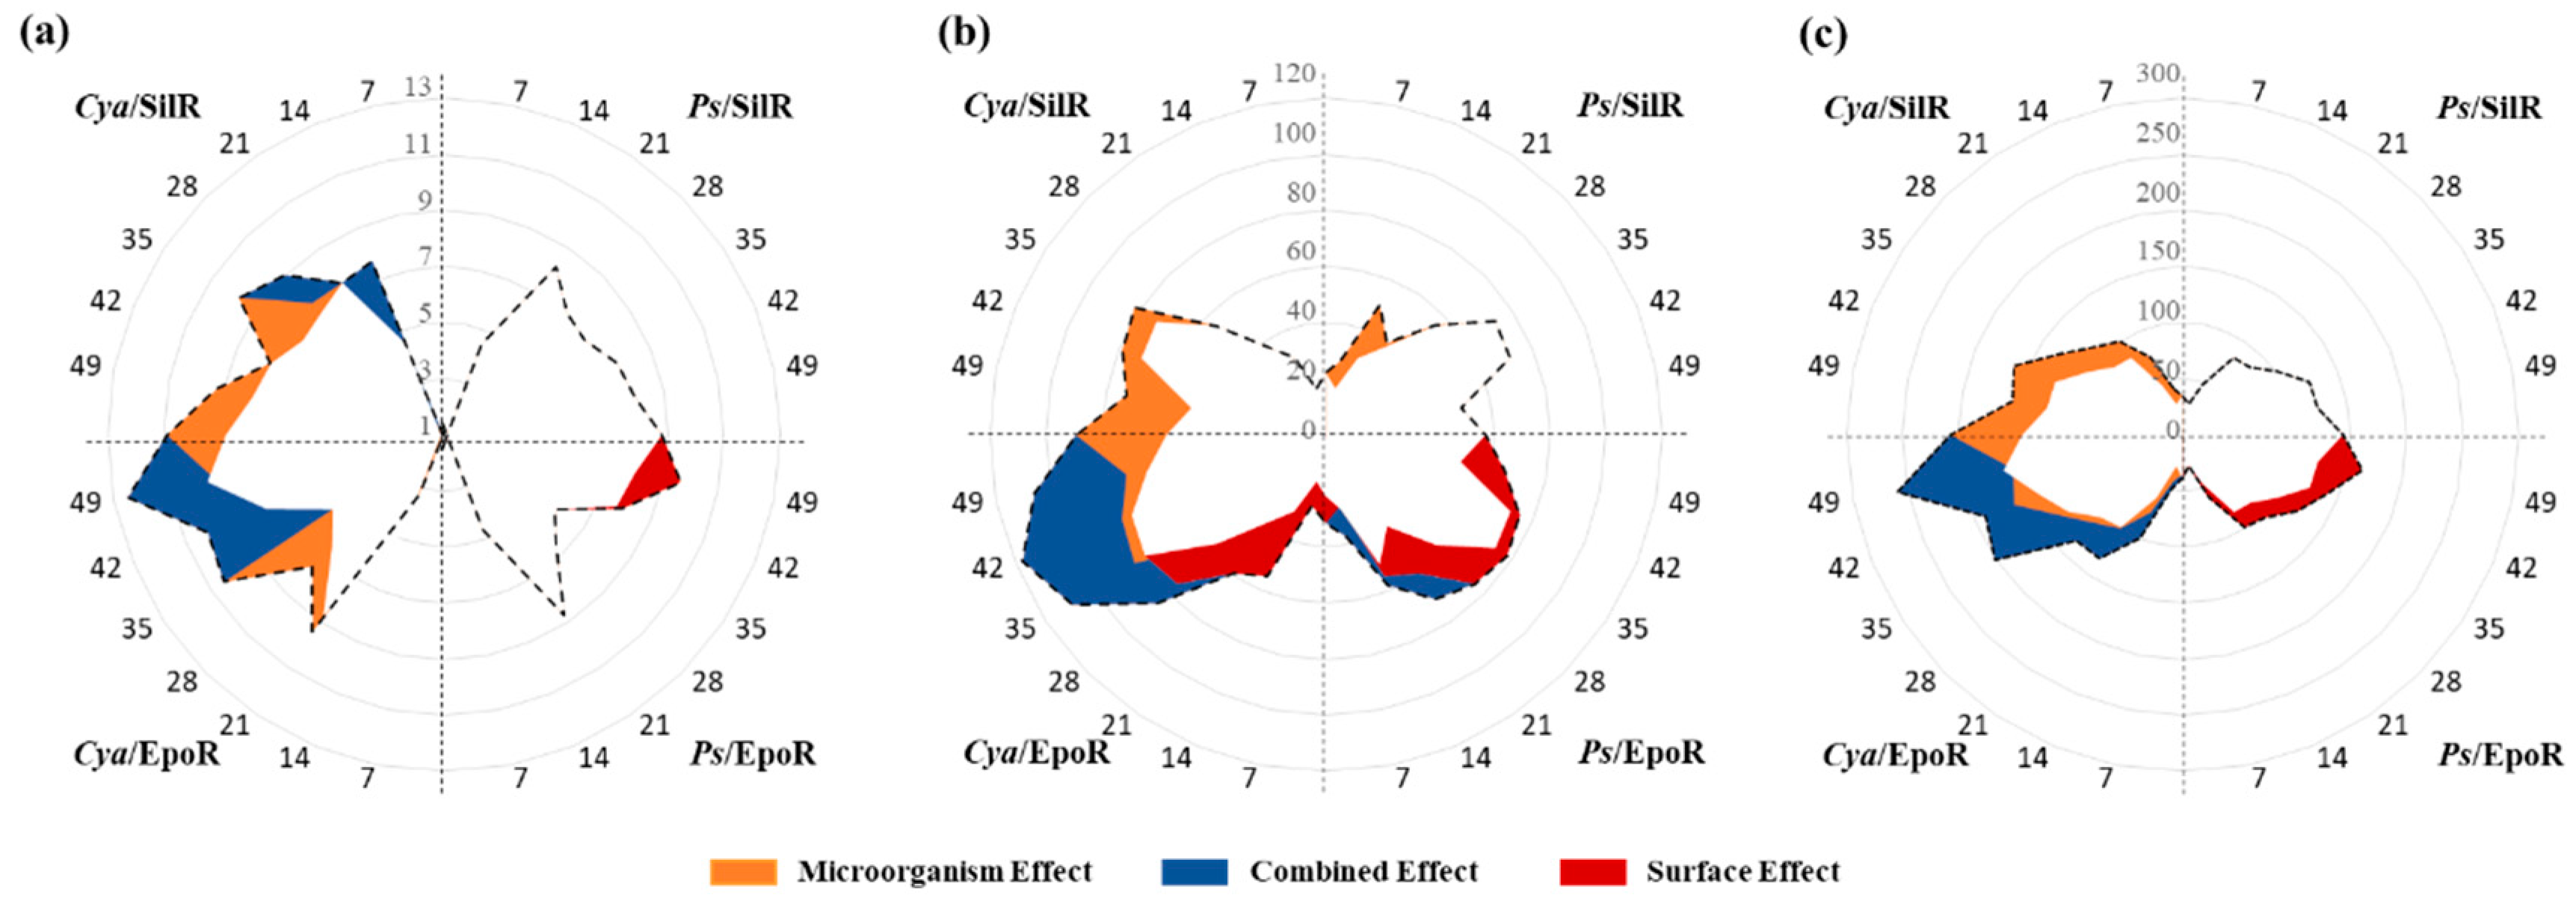
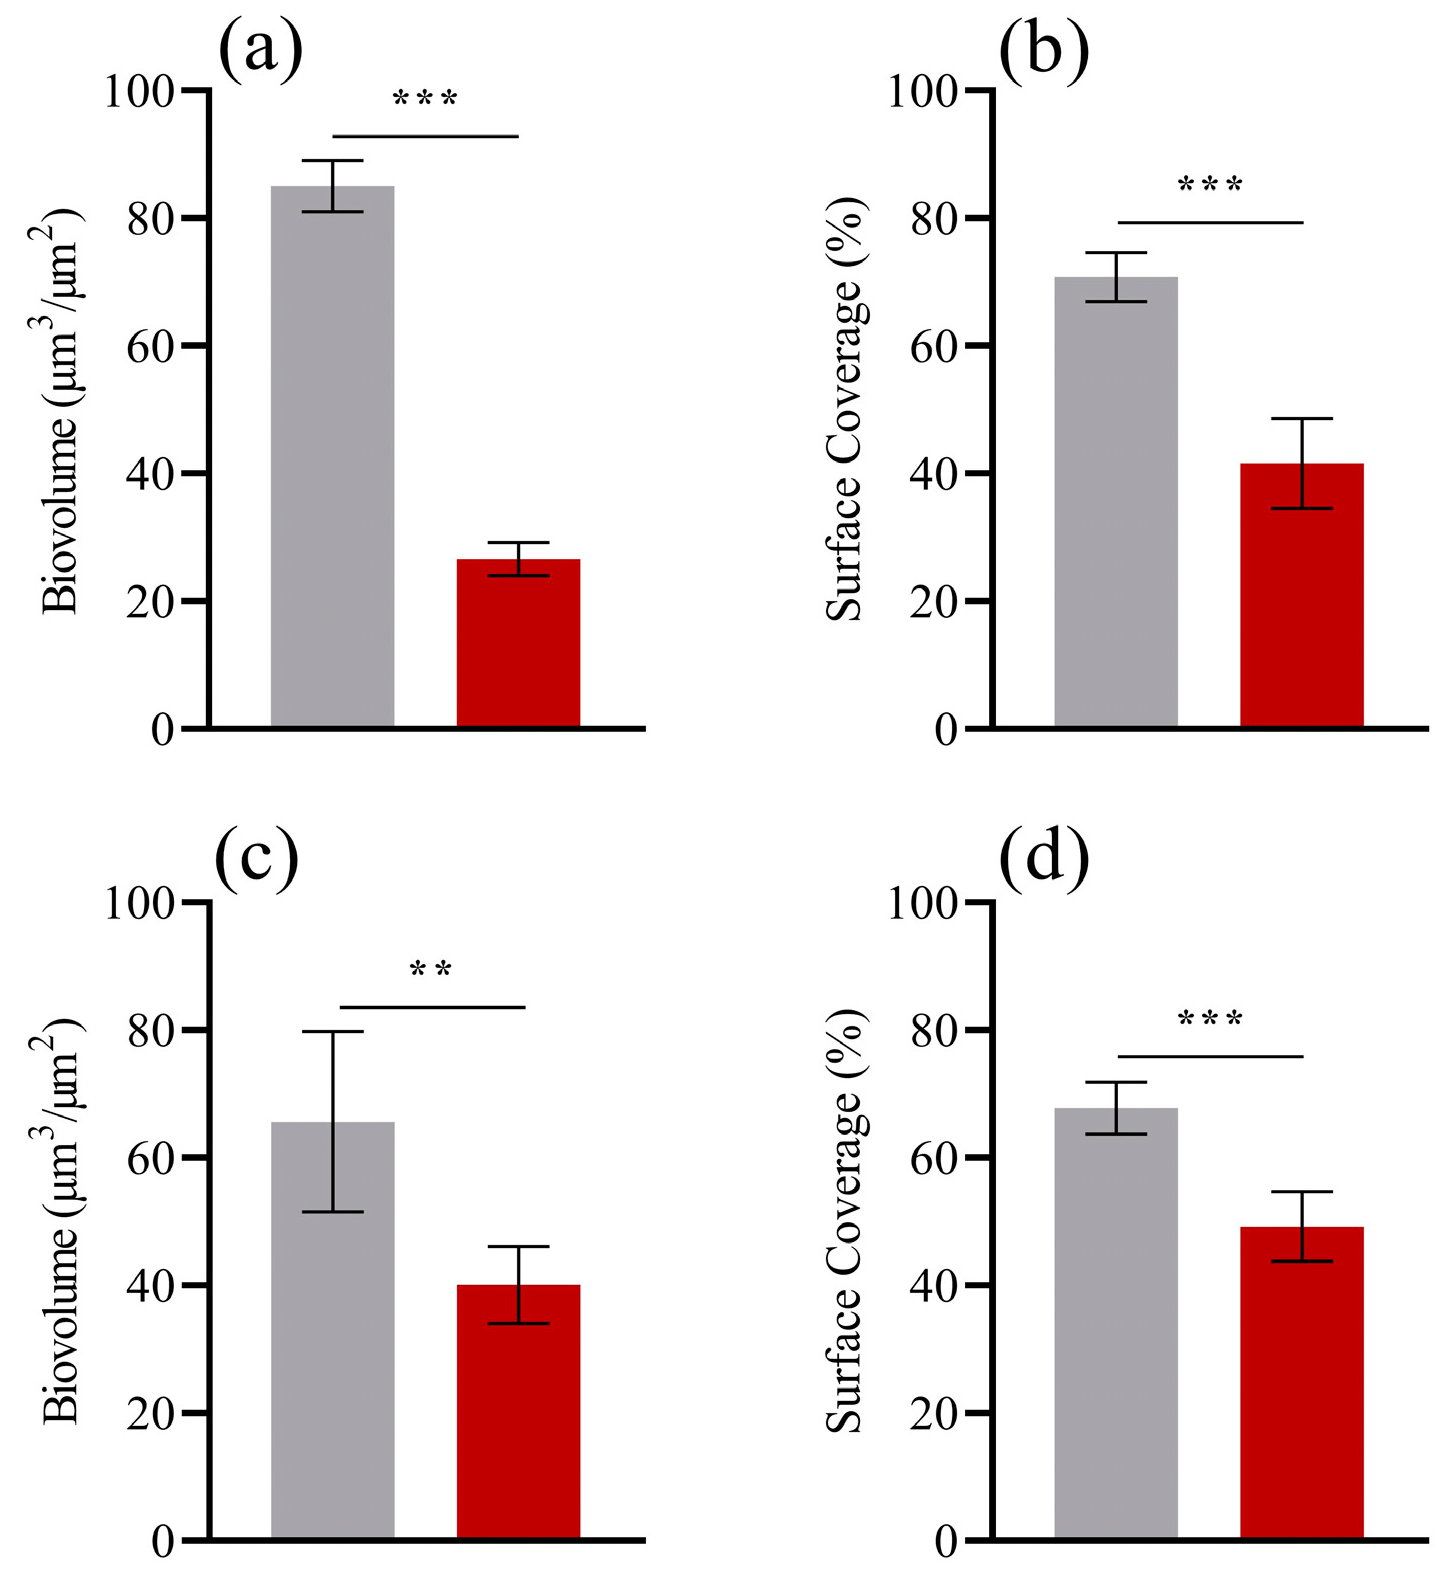
3. Results
4. Discussion
5. Conclusions
Supplementary Materials
Author Contributions
Funding
Conflicts of Interest
References
- Tian, L.; Yin, Y.; Jin, H.; Bing, W.; Jin, E.; Zhao, J.; Ren, L. Novel marine antifouling coatings inspired by corals. Mater. Today Chem. 2020, 17, 100294. [Google Scholar] [CrossRef]
- Silva, E.; Ferreira, O.; Ramalho, P.; Azevedo, N.; Bayón, R.; Igartua, A.; Bordado, J.; Calhorda, M. Eco-friendly non-biocide-release coatings for marine biofouling prevention. Sci. Total Environ. 2019, 650, 2499–2511. [Google Scholar] [CrossRef] [PubMed]
- Kuliasha, C.A.; Fedderwitz, R.L.; Finlay, J.A.; Franco, S.C.; Clare, A.S.; Brennan, A.B. Engineered Chemical Nanotopographies: Reversible Addition–Fragmentation Chain-Transfer Mediated Grafting of Anisotropic Poly (acrylamide) Patterns on Poly (dimethylsiloxane) To Modulate Marine Biofouling. Langmuir 2019, 36, 379–387. [Google Scholar] [CrossRef]
- Mineur, F.; Johnson, M.P.; Maggs, C.A.; Stegenga, H. Hull fouling on commercial ships as a vector of macroalgal introduction. Mar. Biol. 2007, 151, 1299–1307. [Google Scholar] [CrossRef]
- Lacoursière-Roussel, A.; Forrest, B.M.; Guichard, F.; Piola, R.F.; McKindsey, C.W. Modeling biofouling from boat and source characteristics: A comparative study between Canada and New Zealand. Biol. Invasions 2012, 14, 2301–2314. [Google Scholar] [CrossRef]
- Neves, A.R.; Almeida, J.R.; Carvalhal, F.; Câmara, A.; Pereira, S.; Antunes, J.; Vasconcelos, V.; Pinto, M.; Silva, E.R.; Sousa, E. Overcoming environmental problems of biocides: Synthetic bile acid derivatives as a sustainable alternative. Ecotoxicol. Environ. Saf. 2020, 187, 109812. [Google Scholar] [CrossRef]
- Gu, J.-D. Microbial Biofilms, Fouling, Corrosion, and Biodeterioration of Materials. In Handbook of Environmental Degradation of Materials; Elsevier: Oxford, UK, 2018; pp. 273–298. [Google Scholar]
- Selim, M.S.; Shenashen, M.; El-Safty, S.A.; Higazy, S.; Selim, M.M.; Isago, H.; Elmarakbi, A. Recent progress in marine foul-release polymeric nanocomposite coatings. Prog. Mater. Sci. 2017, 87, 1–32. [Google Scholar] [CrossRef]
- Tu, C.; Chen, T.; Zhou, Q.; Liu, Y.; Wei, J.; Waniek, J.J.; Luo, Y. Biofilm formation and its influences on the properties of microplastics as affected by exposure time and depth in the seawater. Sci. Total Environ. 2020, 734, 139237. [Google Scholar] [CrossRef]
- Hempel. Product Data HEMPASIL X3+ 87500; Hempel: Lyngby, Denmark, 2016. [Google Scholar]
- Banerjee, I.; Pangule, R.C.; Kane, R.S. Antifouling coatings: Recent developments in the design of surfaces that prevent fouling by proteins, bacteria, and marine organisms. Adv. Mater. 2011, 23, 690–718. [Google Scholar] [CrossRef]
- Hu, P.; Xie, Q.; Ma, C.; Zhang, G. Silicone-based fouling-release coatings for marine antifouling. Langmuir 2020, 36, 2170–2183. [Google Scholar] [CrossRef]
- Krishnan, S.; Weinman, C.J.; Ober, C.K. Advances in polymers for anti-biofouling surfaces. J. Mater. Chem. 2008, 18, 3405–3413. [Google Scholar] [CrossRef]
- Zhu, H.-W.; Zhang, J.-N.; Su, P.; Liu, T.; He, C.; Feng, D.; Wang, H. Strong adhesion of poly (vinyl alcohol)-glycerol hydrogels onto metal substrates for marine antifouling applications. Soft Matter 2020, 16, 709–717. [Google Scholar] [CrossRef] [PubMed]
- Murosaki, T.; Ahmed, N.; Gong, J.P. Antifouling properties of hydrogels. Sci. Technol. Adv. Mater. 2012. [Google Scholar] [CrossRef] [PubMed]
- Chambers, L.D.; Stokes, K.R.; Walsh, F.C.; Wood, R.J. Modern approaches to marine antifouling coatings. Surf. Coat. Technol. 2006, 201, 3642–3652. [Google Scholar] [CrossRef]
- Palmer, J.; Flint, S.; Brooks, J. Bacterial cell attachment, the beginning of a biofilm. J. Ind. Microbiol. Biotechnol. 2007, 34, 577–588. [Google Scholar] [CrossRef]
- Mostafaei, A.; Nasirpouri, F. Preparation and characterization of a novel conducting nanocomposite blended with epoxy coating for antifouling and antibacterial applications. J. Coat. Technol. Res. 2013, 10, 679–694. [Google Scholar] [CrossRef]
- Hoge, J.; Leach, C. Epoxy resin infused boat hulls. Reinf. Plast. 2016, 60, 221–223. [Google Scholar] [CrossRef]
- Rao, D.; Webb, J.S.; Kjelleberg, S. Competitive interactions in mixed-species biofilms containing the marine bacterium Pseudoalteromonas tunicata. Appl. Environ. Microbiol. 2005, 71, 1729–1736. [Google Scholar] [CrossRef]
- Abouelkheir, S.S.; Ghozlan, E.A.A.H.A.; Sabry, S.A. Characterization of Biofilm Forming Marine Pseudoalteromonas spp. J. Mar. Sci. 2020, 2. [Google Scholar] [CrossRef]
- Komárek, J.; Anagnostidis, K. Cyanoprokaryota, Part 1: Chroococcales; Gustav Fischer Verlag: Stuttgart, Germany, 1998. [Google Scholar]
- Faria, S.I.; Teixeira-Santos, R.; Romeu, M.J.; Morais, J.; Vasconcelos, V.; Mergulhão, F.J. The Relative Importance of Shear Forces and Surface Hydrophobicity on Biofilm Formation by Coccoid Cyanobacteria. Polymers 2020, 12, 653. [Google Scholar] [CrossRef]
- Horcas, I.; Fernández, R.; Gomez-Rodriguez, J.; Colchero, J.; Gómez-Herrero, J.; Baro, A. WSXM: A software for scanning probe microscopy and a tool for nanotechnology. Rev. Sci. Instrum. 2007, 78, 013705. [Google Scholar] [CrossRef] [PubMed]
- van Oss, C. Interfacial Forces in Aqueous Media; Marcel Dekker: New York, NY, USA, 1994. [Google Scholar]
- Gomes, L.C.; Silva, L.N.; Simões, M.; Melo, L.F.; Mergulhão, F.J. Escherichia coli adhesion, biofilm development and antibiotic susceptibility on biomedical materials. J. Biomed. Mater. Res. Part A 2015, 103, 1414–1423. [Google Scholar] [CrossRef] [PubMed]
- Lee, J.-W.; Nam, J.-H.; Kim, Y.-H.; Lee, K.-H.; Lee, D.-H. Bacterial communities in the initial stage of marine biofilm formation on artificial surfaces. J. Microbiol. 2008, 46, 174–182. [Google Scholar] [CrossRef] [PubMed]
- Sekar, R.; Venugopalan, V.; Satpathy, K.; Nair, K.; Rao, V. Laboratory studies on adhesion of microalgae to hard substrates. In Asian Pacific Phycology in the 21st Century: Prospects and Challenges; Springer: Amsterdam, The Netherlands, 2004; pp. 109–116. [Google Scholar]
- Holmström, C.; James, S.; Neilan, B.A.; White, D.C.; Kjelleberg, S. Pseudoalteromonas tunicata sp. nov., a bacterium that produces antifouling agents. Int. J. Syst. Evol. Microbiol. 1998, 48, 1205–1212. [Google Scholar] [CrossRef]
- Ramos, V.; Morais, J.; Castelo-Branco, R.; Pinheiro, Â.; Martins, J.; Regueiras, A.; Pereira, A.L.; Lopes, V.R.; Frazão, B.; Gomes, D.; et al. Cyanobacterial diversity held in microbial biological resource centers as a biotechnological asset: The case study of the newly established LEGE culture collection. J. Appl. Phycol. 2018, 30, 1437–1451. [Google Scholar] [CrossRef]
- Kotai, J. Instructions for Preparation of Modified Nutrient Solution Z8 for AlgaeNorwegian; Institute for Water Research: Oslo, Norway, 1972. [Google Scholar]
- Romeu, M.J.; Alves, P.; Morais, J.; Miranda, J.M.; de Jong, E.D.; Sjollema, J.; Ramos, V.; Vasconcelos, V.; Mergulhão, F.J. Biofilm formation behaviour of marine filamentous cyanobacterial strains in controlled hydrodynamic conditions. Environ. Microbiol. 2019, 21, 4411–4424. [Google Scholar] [CrossRef]
- Bakker, D.; Van der Plaats, A.; Verkerke, G.; Busscher, H.; Van Der Mei, H. Comparison of velocity profiles for different flow chamber designs used in studies of microbial adhesion to surfaces. Appl. Environ. Microbiol. 2003, 69, 6280–6287. [Google Scholar] [CrossRef]
- Telegdi, J.; Trif, L.; Románszki, L. Smart anti-biofouling composite coatings for naval applications. In Smart Composite Coatings and Membranes; Elsevier: Amsterdam, The Netherlands, 2016; pp. 123–155. [Google Scholar]
- Romeu, M.J.; Domínguez-Pérez, D.; Almeida, D.; Morais, J.; Campos, A.; Vasconcelos, V.; Mergulhão, F.J. Characterization of planktonic and biofilm cells from two filamentous cyanobacteria using a shotgun proteomic approach. Biofouling 2020, 36, 631–645. [Google Scholar] [CrossRef]
- Heydorn, A.; Nielsen, A.T.; Hentzer, M.; Sternberg, C.; Givskov, M.; Ersbøll, B.K.; Molin, S. Quantification of biofilm structures by the novel computer program COMSTAT. Microbiology 2000, 146, 2395–2407. [Google Scholar] [CrossRef]
- Schneider, C.A.; Rasband, W.S.; Eliceiri, K.W. NIH Image to ImageJ: 25 years of image analysis. Nat. Methods 2012, 9, 671–675. [Google Scholar] [CrossRef]
- Fang, H.; Huang, L.; Zhao, H.; Cheng, W.; Chen, Y.; Fazeli, M.; Shang, Q. Biofilm Growth and the Impacts on Hydrodynamics. In Mechanics of Bio-Sediment Transport; Springer: Berlin/Heidelberg, Germany, 2020; pp. 153–208. [Google Scholar]
- Ali, A.; Jamil, M.I.; Jiang, J.; Shoaib, M.; Amin, B.U.; Luo, S.; Zhan, X.; Chen, F.; Zhang, Q. An overview of controlled-biocide-release coating based on polymer resin for marine antifouling applications. J. Polym. Res. 2020, 27, 1–17. [Google Scholar] [CrossRef]
- De-la-Pinta, I.; Cobos, M.; Ibarretxe, J.; Montoya, E.; Eraso, E.; Guraya, T.; Quindós, G. Effect of biomaterials hydrophobicity and roughness on biofilm development. J. Mater. Sci. Mater. Med. 2019, 30, 77. [Google Scholar] [CrossRef] [PubMed]
- Ozkan, A.; Berberoglu, H. Cell to substratum and cell to cell interactions of microalgae. Colloids Surf. B Biointerfaces 2013, 112, 302–309. [Google Scholar] [CrossRef] [PubMed]
- Moreira, J.M.R.; Gomes, L.C.; Whitehead, K.A.; Lynch, S.; Tetlow, L.A.; Mergulhão, F.J. Effect of surface conditioning with cellular extracts on Escherichia coli adhesion and initial biofilm formation. Food Bioprod. Process. 2017, 104, 1–12. [Google Scholar] [CrossRef]
- Mazumder, S.; Falkinham, J.O., III; Dietrich, A.M.; Puri, I.K. Role of hydrophobicity in bacterial adherence to carbon nanostructures and biofilm formation. Biofouling 2010, 26, 333–339. [Google Scholar] [CrossRef]
- Thomen, P.; Robert, J.; Monmeyran, A.; Bitbol, A.-F.; Douarche, C.; Henry, N. Bacterial biofilm under flow: First a physical struggle to stay, then a matter of breathing. PLoS ONE 2017, 12, e0175197. [Google Scholar] [CrossRef]
- Di Martino, P. Extracellular polymeric substances, a key element in understanding biofilm phenotype. AIMS Microbiol. 2018, 4, 274. [Google Scholar] [CrossRef]
- Vidakovic, L.; Singh, P.K.; Hartmann, R.; Nadell, C.D.; Drescher, K. Dynamic biofilm architecture confers individual and collective mechanisms of viral protection. Nat. Microbiol. 2018, 3, 26–31. [Google Scholar] [CrossRef]
- Serra, D.O.; Richter, A.M.; Klauck, G.; Mika, F.; Hengge, R. Microanatomy at cellular resolution and spatial order of physiological differentiation in a bacterial biofilm. MBio 2013, 4. [Google Scholar] [CrossRef]
- Gittens, J.E.; Smith, T.J.; Suleiman, R.; Akid, R. Current and emerging environmentally-friendly systems for fouling control in the marine environment. Biotechnol. Adv. 2013, 31, 1738–1753. [Google Scholar] [CrossRef]


| Surface | Contact Angles (°) | Hydrophobicity (mJ/m2) ∆G | Roughness (nm) Ra | ||
|---|---|---|---|---|---|
| θw | θF | θB | |||
| EpoRef | 69.4 ± 3.0 | 56.8 ± 3.0 | 23.3 ± 2.2 | −26.7 | 12.9 ± 2.9 |
| SilRef | 108.4 ± 3.5 | 104.0 ± 1.9 | 70.0 ± 2.0 | −55.8 | 49.7 ± 8.3 |
© 2020 by the authors. Licensee MDPI, Basel, Switzerland. This article is an open access article distributed under the terms and conditions of the Creative Commons Attribution (CC BY) license (http://creativecommons.org/licenses/by/4.0/).
Share and Cite
Faria, S.I.; Teixeira-Santos, R.; Gomes, L.C.; Silva, E.R.; Morais, J.; Vasconcelos, V.; Mergulhão, F.J.M. Experimental Assessment of the Performance of Two Marine Coatings to Curb Biofilm Formation of Microfoulers. Coatings 2020, 10, 893. https://doi.org/10.3390/coatings10090893
Faria SI, Teixeira-Santos R, Gomes LC, Silva ER, Morais J, Vasconcelos V, Mergulhão FJM. Experimental Assessment of the Performance of Two Marine Coatings to Curb Biofilm Formation of Microfoulers. Coatings. 2020; 10(9):893. https://doi.org/10.3390/coatings10090893
Chicago/Turabian StyleFaria, Sara I., Rita Teixeira-Santos, Luciana C. Gomes, Elisabete R. Silva, João Morais, Vítor Vasconcelos, and Filipe J. M. Mergulhão. 2020. "Experimental Assessment of the Performance of Two Marine Coatings to Curb Biofilm Formation of Microfoulers" Coatings 10, no. 9: 893. https://doi.org/10.3390/coatings10090893
APA StyleFaria, S. I., Teixeira-Santos, R., Gomes, L. C., Silva, E. R., Morais, J., Vasconcelos, V., & Mergulhão, F. J. M. (2020). Experimental Assessment of the Performance of Two Marine Coatings to Curb Biofilm Formation of Microfoulers. Coatings, 10(9), 893. https://doi.org/10.3390/coatings10090893