Article

A Sinter Visualization Device for Observing the Relationship Between Fillers and Porosity of Precursor-Derived Ceramic Coatings

College of Metrological Technology and Engineering, China Jiliang University, Hangzhou 310018, China
*
Author to whom correspondence should be addressed.
Coatings 2020, 10(6), 552; https://doi.org/10.3390/coatings10060552
Submission received: 7 May 2020 / Revised: 2 June 2020 / Accepted: 8 June 2020 / Published: 9 June 2020
(This article belongs to the Special Issue Innovative Surface Modification Techniques for Biodegradable Implants)

Abstract

:
Adding fillers to polysilazane (PSZ)-derived ceramic coating is one of the main methods used to reduce PSZ porosity. In this study, we designed a sinter visualization device for understanding the effect of fillers on coating porosity and observed pore evolution within the coating sintering process using different filler ratios. When there was no filler in the coating, gas evolution occurred at the initial sintering stage due to a PSZ pyrolysis reaction. In the final stage, numerous cracks appeared because of volume shrinkage. It was determined that such coatings cannot provide good protection. Although the cracks disappeared after adding glass powder, many bubbles appeared. After adding ZrO2, the bubbles in the coating significantly reduced. When the volume ratio of PSZ/glass powder/ZrO2 was 1:2:1, the coating porosity after sintering was the lowest. Based on our visualization experimental results, we concluded that the glass powder’s healing effect and the ZrO2 skeleton effect were the main reasons for the reduced coating porosity. In addition, the sinter visualization device can be used to observe the surface morphology of other similar coatings during the sintering processes.

1. Introduction

Precursor-derived ceramic coatings have great application prospects in the field of anticorrosion due to their good corrosion resistance [1,2]. In the preparation process of ceramic coatings with polysilazane (PSZ) as a precursor, pyrolysis is accompanied by the escape of small-molecular gas [1], which makes its volume shrink and density increase, resulting in the formation of a large number of pores and cracks in the ceramic product [3]. The pores and cracks in the coating will reduce the compactness, seriously weakening the service life and anti-corrosion effects of the coating.
At present, adding fillers to the precursor is the main method used to solve this problem. Adding inert fillers such as SiC, Si3N4, BN, AlN, or ZrO2, and active fillers such as Al, Nb, Ti, or MoSi2 to the precursor can effectively relieve volume shrinkage during pyrolysis [4,5,6,7,8,9]. Konegger et al. studied the interactions between PSZ- and Al2O3- or Y2O3-stabilized ZrO2 fillers, and found that the PSZ filler interface played a decisive role in reducing porosity [10]. In addition, glass powder is a silicate with stable chemical properties and strong acid/alkali corrosion resistance, and therefore it can also be used as a coating filler. Günthner et al. added two different glass powders with different melting points to the precursor, which resulted in a dense and uniform coating surface and increased the coating thickness. However, using scanning electron microscopy (SEM), they found that there were pores with larger diameters in the middle of the coating [9]. They added ZrO2 to adjust the pore size, and finally obtained a precursor-derived ceramic coating with low porosity and high pore size uniformity. Justus et al. verified the method of preparing low-porosity ceramic coatings by adding ZrO2 and glass powder to PSZ. No significant defects in the sintered coating were found [5].
The abovementioned researchers studied pore coatings mainly through SEM to directly observe the sintered surface and cross-section of sintered coatings. Farhadian et al. used a focused ion beam SEM to slice and image the ZrO2-SiO2 coating layer by layer and got a 3D image of the coating [11]. However, there is insufficient research on the characteristics of pore changes during the coating sintering process. To understand the root mechanism of coating pores and to alleviate the large pore problem, it is necessary to observe coating during sintering.
Based on the research of Günthner et al., Schütz et al., and Motz et al. [9,12,13], we designed a sintering visualization device to observe the sintering process of three kinds of PSZ-derived ceramic coatings, which included: (1) no addition; (2) added glass powder; and (3) different added proportions of glass powder and ZrO2. The influence of glass powder and ZrO2 on the porosity of the PSZ-derived ceramic coating was analyzed and the inhibition mechanism of porosity was analyzed by adjusting the filler ratio. The best ratio was selected to obtain the precursor-derived ceramic coating with the lowest porosity.

2. Materials and Methods

2.1. Preparation of Sample

In this experiment, PSZ was used as a precursor; glass powder and ZrO2 as fillers; and butyl acetate as the solvent to prepare the coating slurry. The material description is shown in Table 1. In order to compare the effects of adding fillers on the coating porosity, we formulated five different composition ratios of ceramic slurries. The ratios are shown in Table 2. After mixing according to the proportions, the mixture was ultrasonically vibrated and stirred for 30 min, respectively, to obtain the coating slurry.

2.2. Visualization Method of the Coating Sintering Process

The sintering visualization device can observe, in real-time, the change in the coating surface under increasing temperature. The experimental system is shown in Figure 1. The system device included a hot-stage, high-temperature microscope, charge-coupled device (CCD) camera, and computer. The hot stage was fixed on a microscopic stage, using a 100× lens to aim at the hot table’s observation hole. The hot stage was divided into two parts: the cover part and the heating part. Four screws fixed together the two parts. There was a gasket between the two parts. The heating part had two vents that were used to discharge the gas in the stage and inlet other gas due to atmospheric protection. The heating part was heated by the heating wire inside the sample platform and the temperature was raised to 1000 °C. The temperature control device was connected to the heating wire and the thermocouple. The device combined with the water-cooling cycle controlled the hot stage’s temperature. The temperature inside the sample platform used to place samples was read in real-time on the temperature control device. The computer was connected to the temperature control device and the CCD camera; the heating program can be read and set by the computer. The video data transmitted by the CCD camera realized the real-time collection of image data during the sample heating process.
The sample was placed inside the sample platform and isolated by covering a cover glass. Then, the hot stage was closed and the water-cooling cycle was opened. The hot stage’s heating rate and temperature range were set by the computer. The heating rate of this experiment was 10 K/min and the temperature was raised to 700 °C.
The captured pictures were processed using an image analysis method. The image analysis method converted the captured image into a grayscale image and the grayscale image was then used to divide the different grayscale areas of the image. Due to the high contrast between the pores or cracks and the coating material under a high-magnification lens, the grayscale processing of the image presented different gray levels. Thus, the threshold processing was used to distinguish the coating material from the cracks. The image grayscale analysis method can accurately measure the distribution and pore structure of the coating surface [14,15]. The reliability of the porosity statistical results reached more than 95% [16]. The image-processing software (Image J 1.52v, developed by National Institutes of Health, Bethesda, MD, USA) was used to quantitatively study the coating surface’s pore distribution and size. Images were converted to binary and particle analysis was used to count the number and area of pores in the image. Through approximating the pore area to a circle, according to the formula of the circular area, the pore diameter of each pore was deduced. This method has certain requirements for image resolution, i.e., the higher the resolution, the more accurate the statistical results. Image resolution in this system was 5440 × 3648. According to the scale, 1 pixel is 0.08 μm in length. For the convenience of statistics, pores less than 0.1 μm were ignored. In Equation (1), the porosity is represented by P
P = S p o r S p i c × 100 %
where Spor is the total area of pores and Spic is the total area of the analyzed picture. The average number of pores per square millimeter is represented by n ¯
n ¯ = n i S p i c × 10 6 ( mm 2 )
where n i is the total number of pores per analyzed picture. In this paper, Spic = 1.2 × 105 μm2. Three experiments were carried out for each coating sample. The n ¯ , P, and pore size of each group were averaged. The sintered coating with the best ratio was analyzed using SEM.

3. Results and Discussion

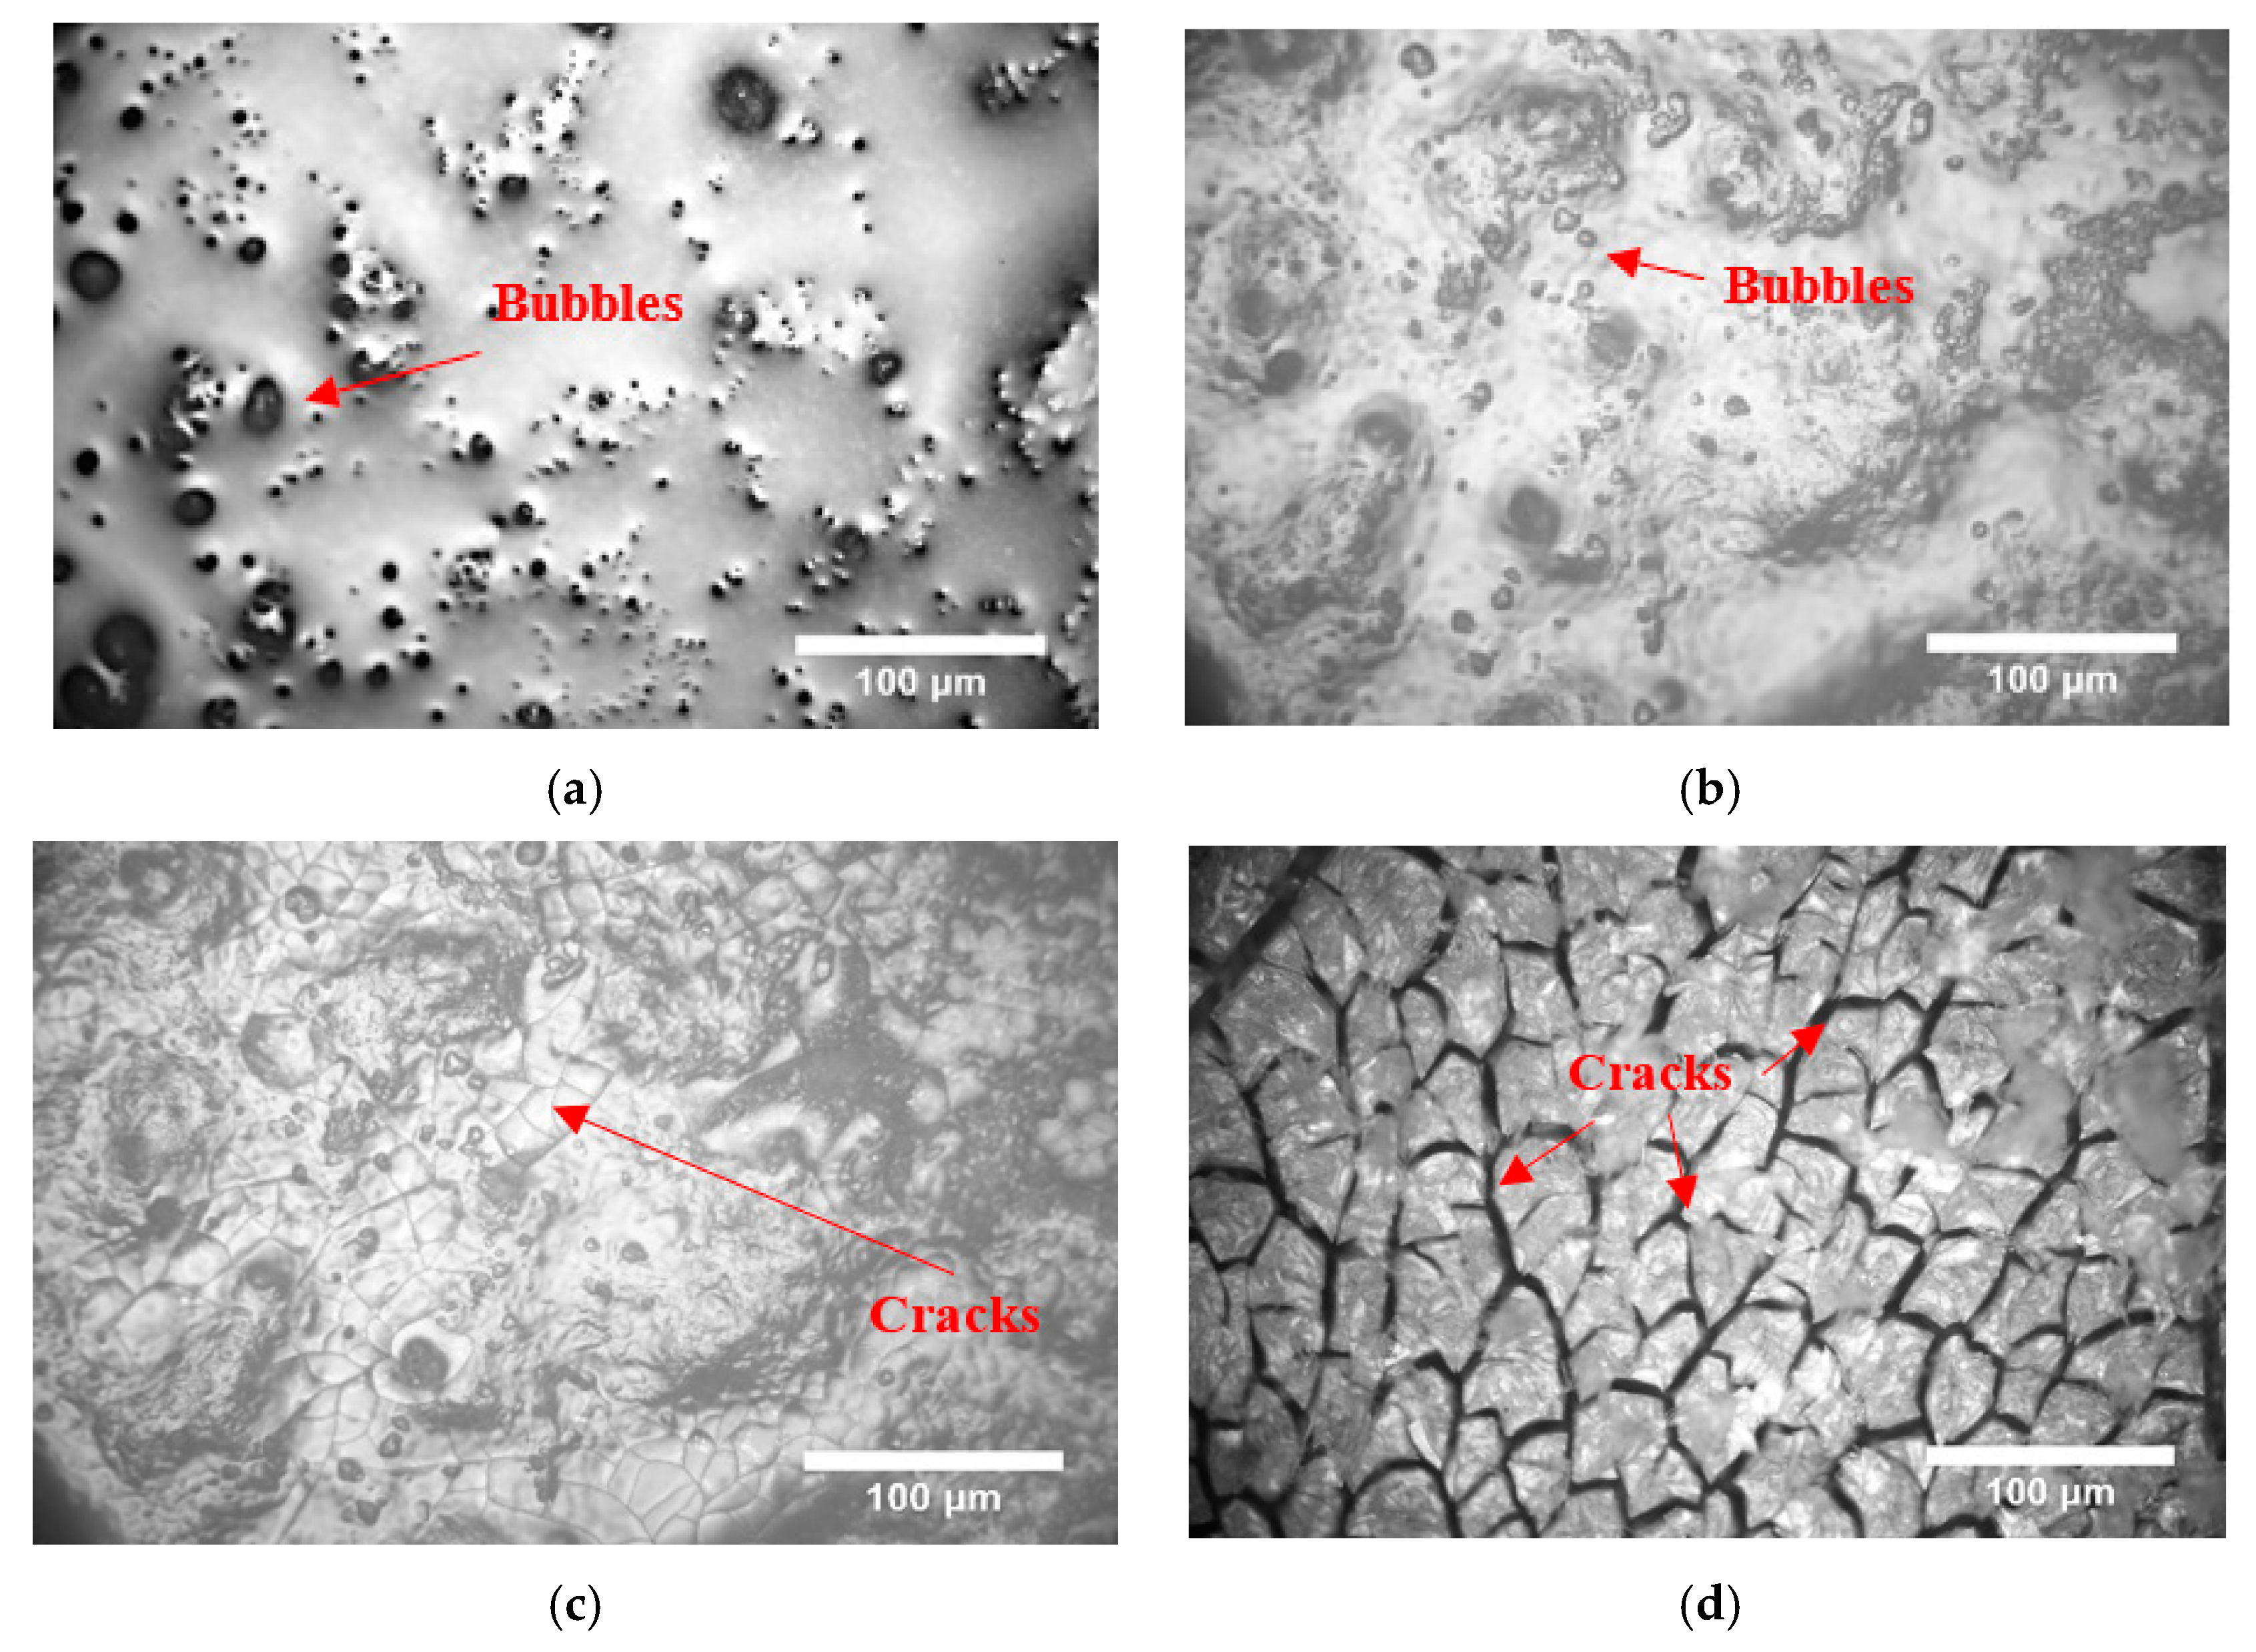
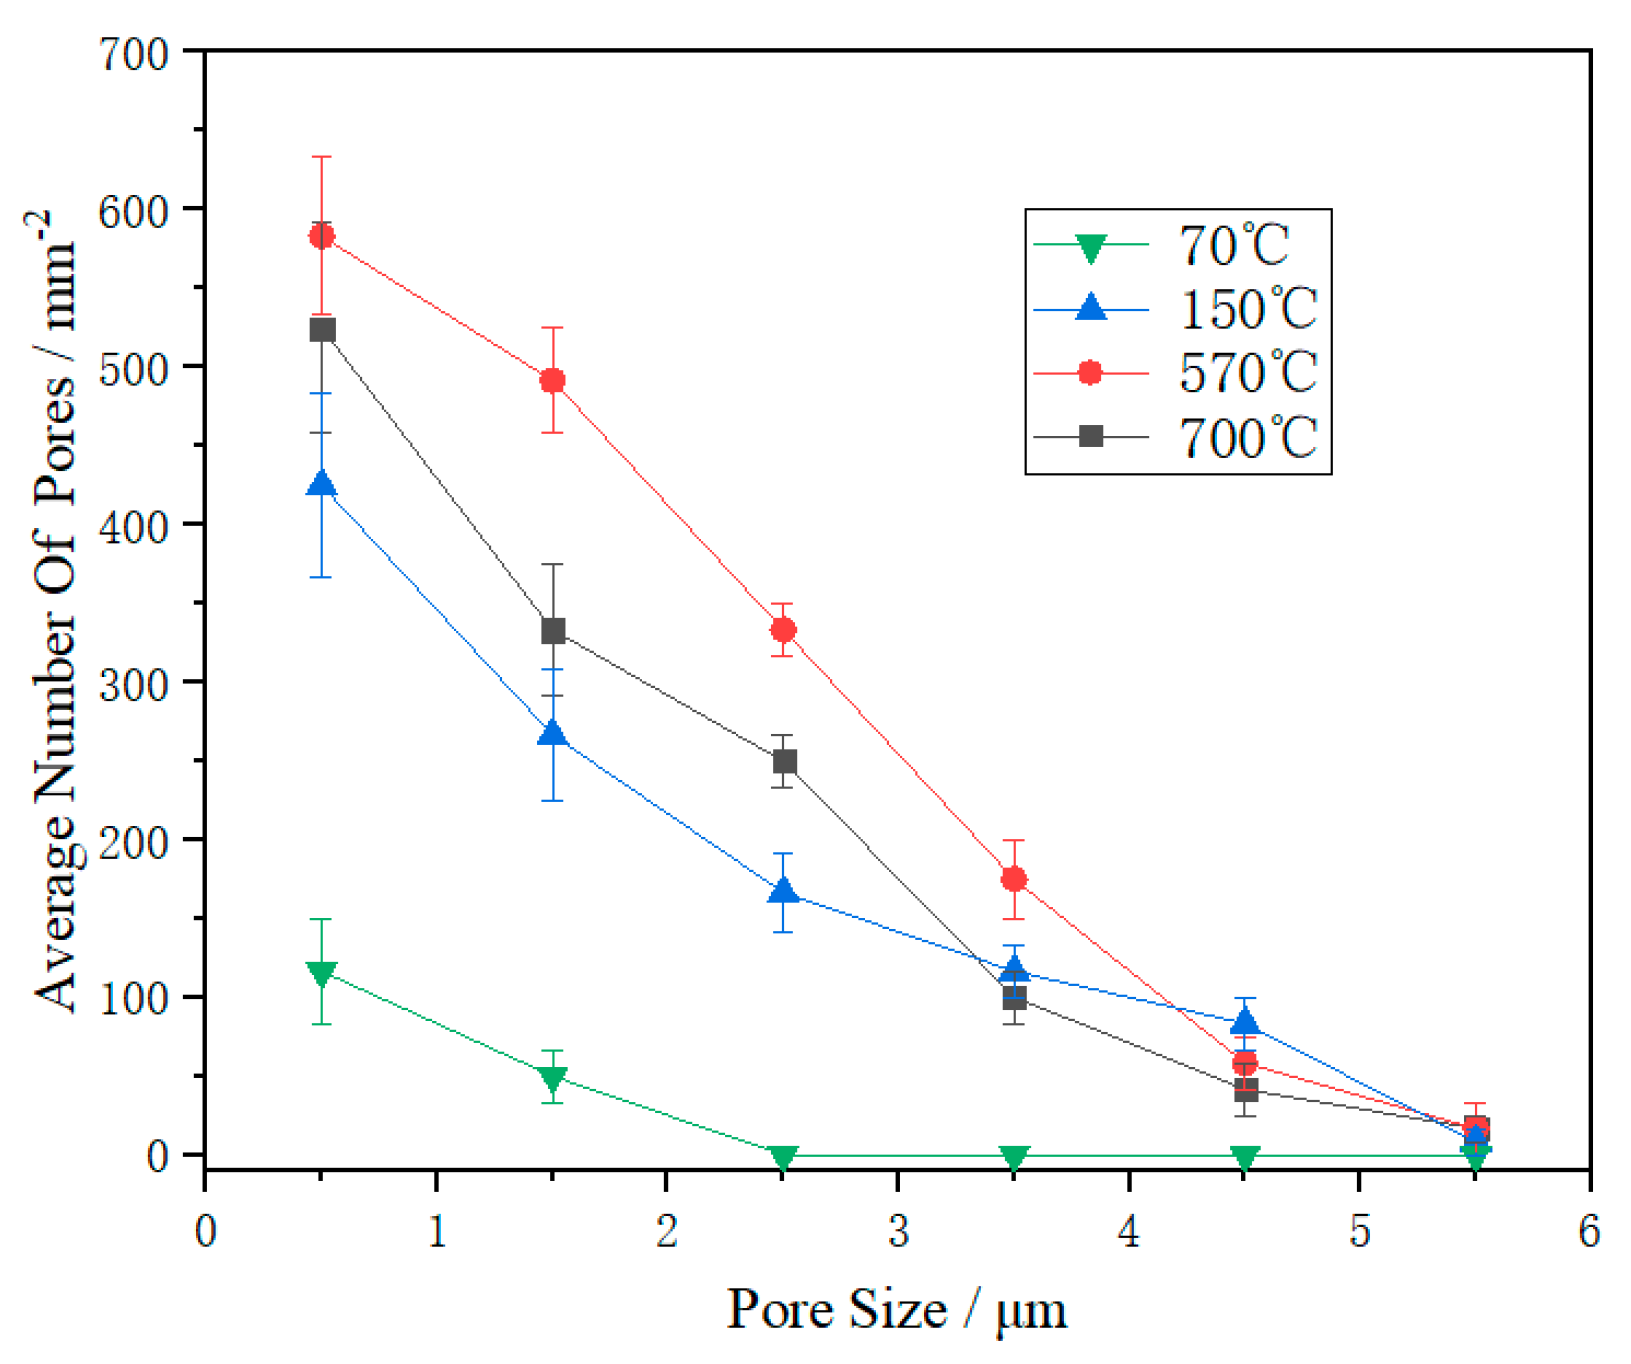
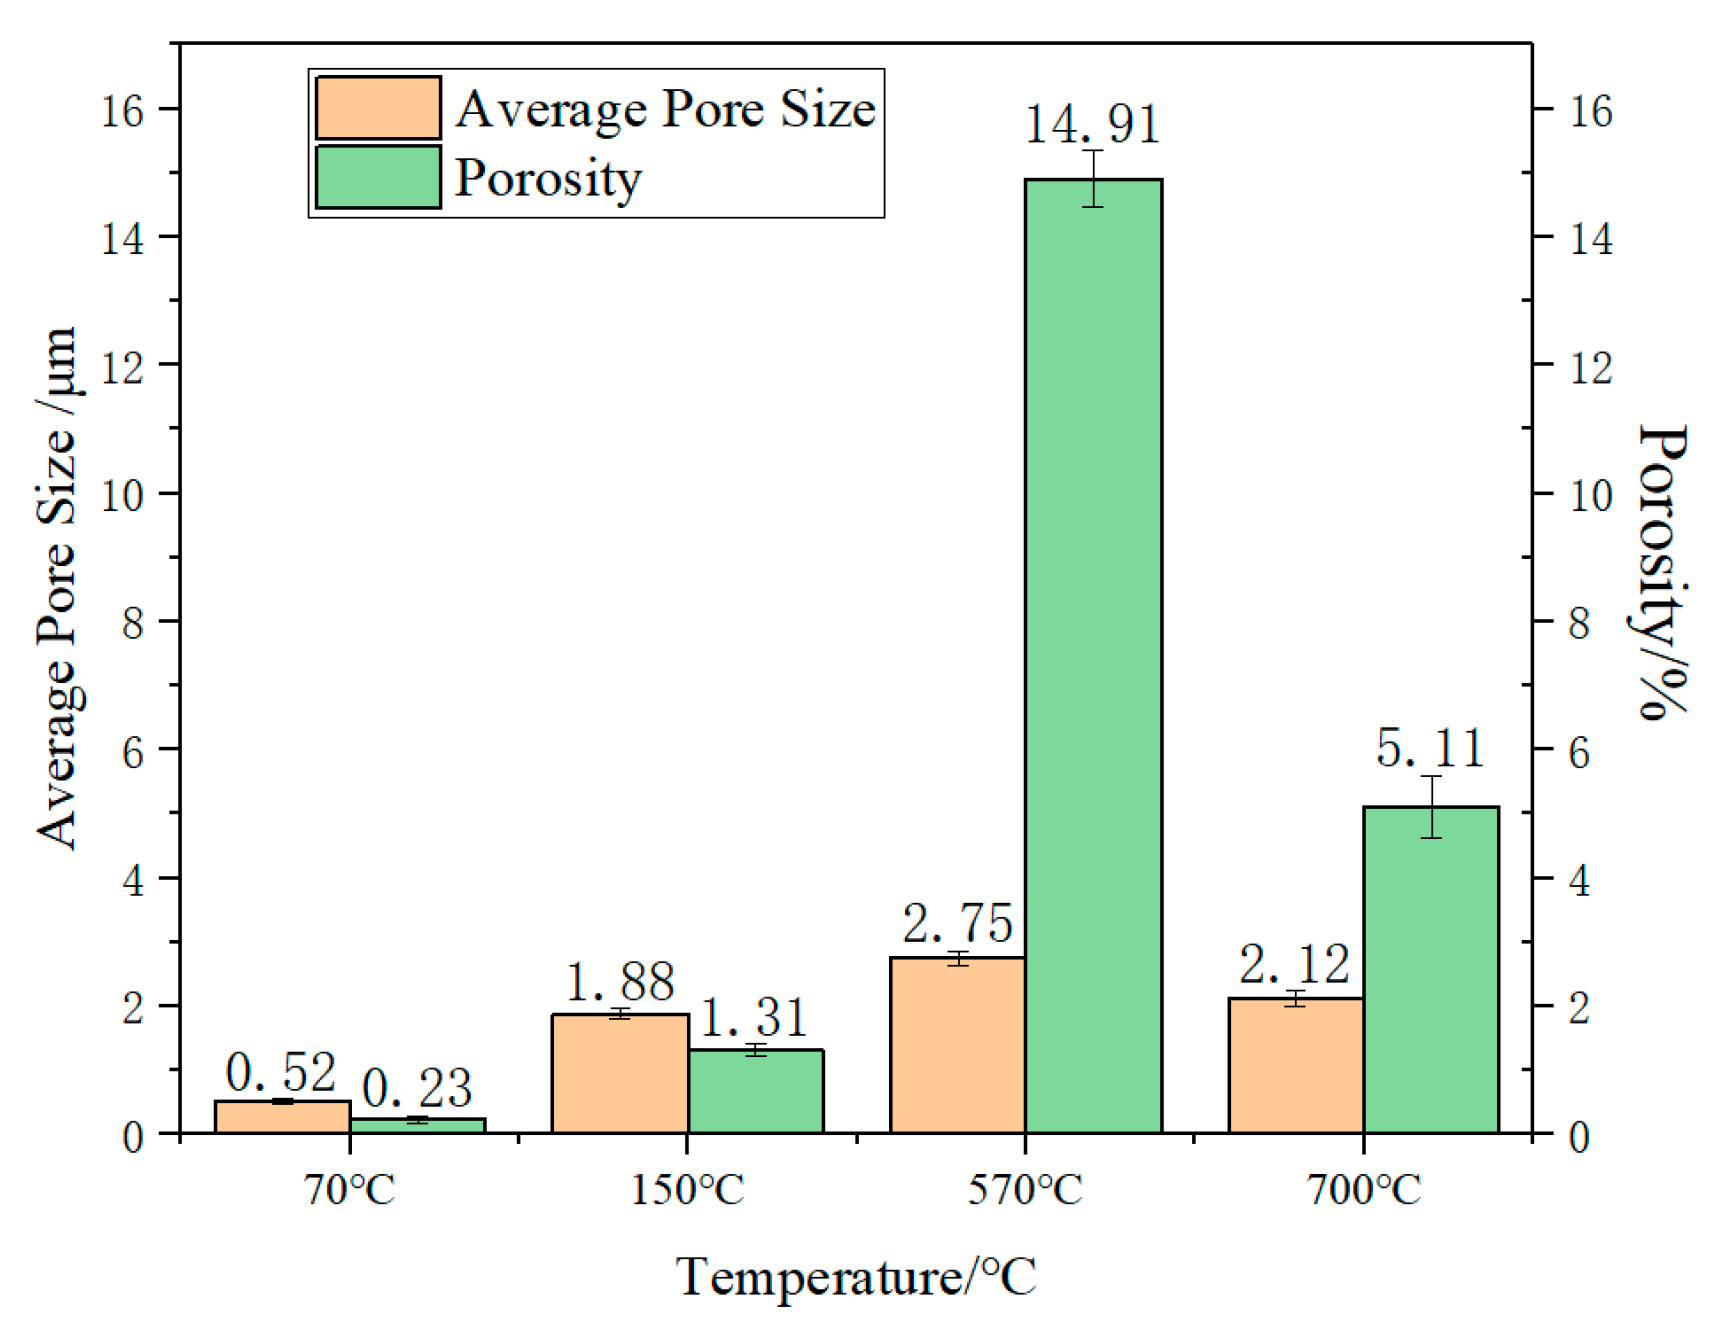
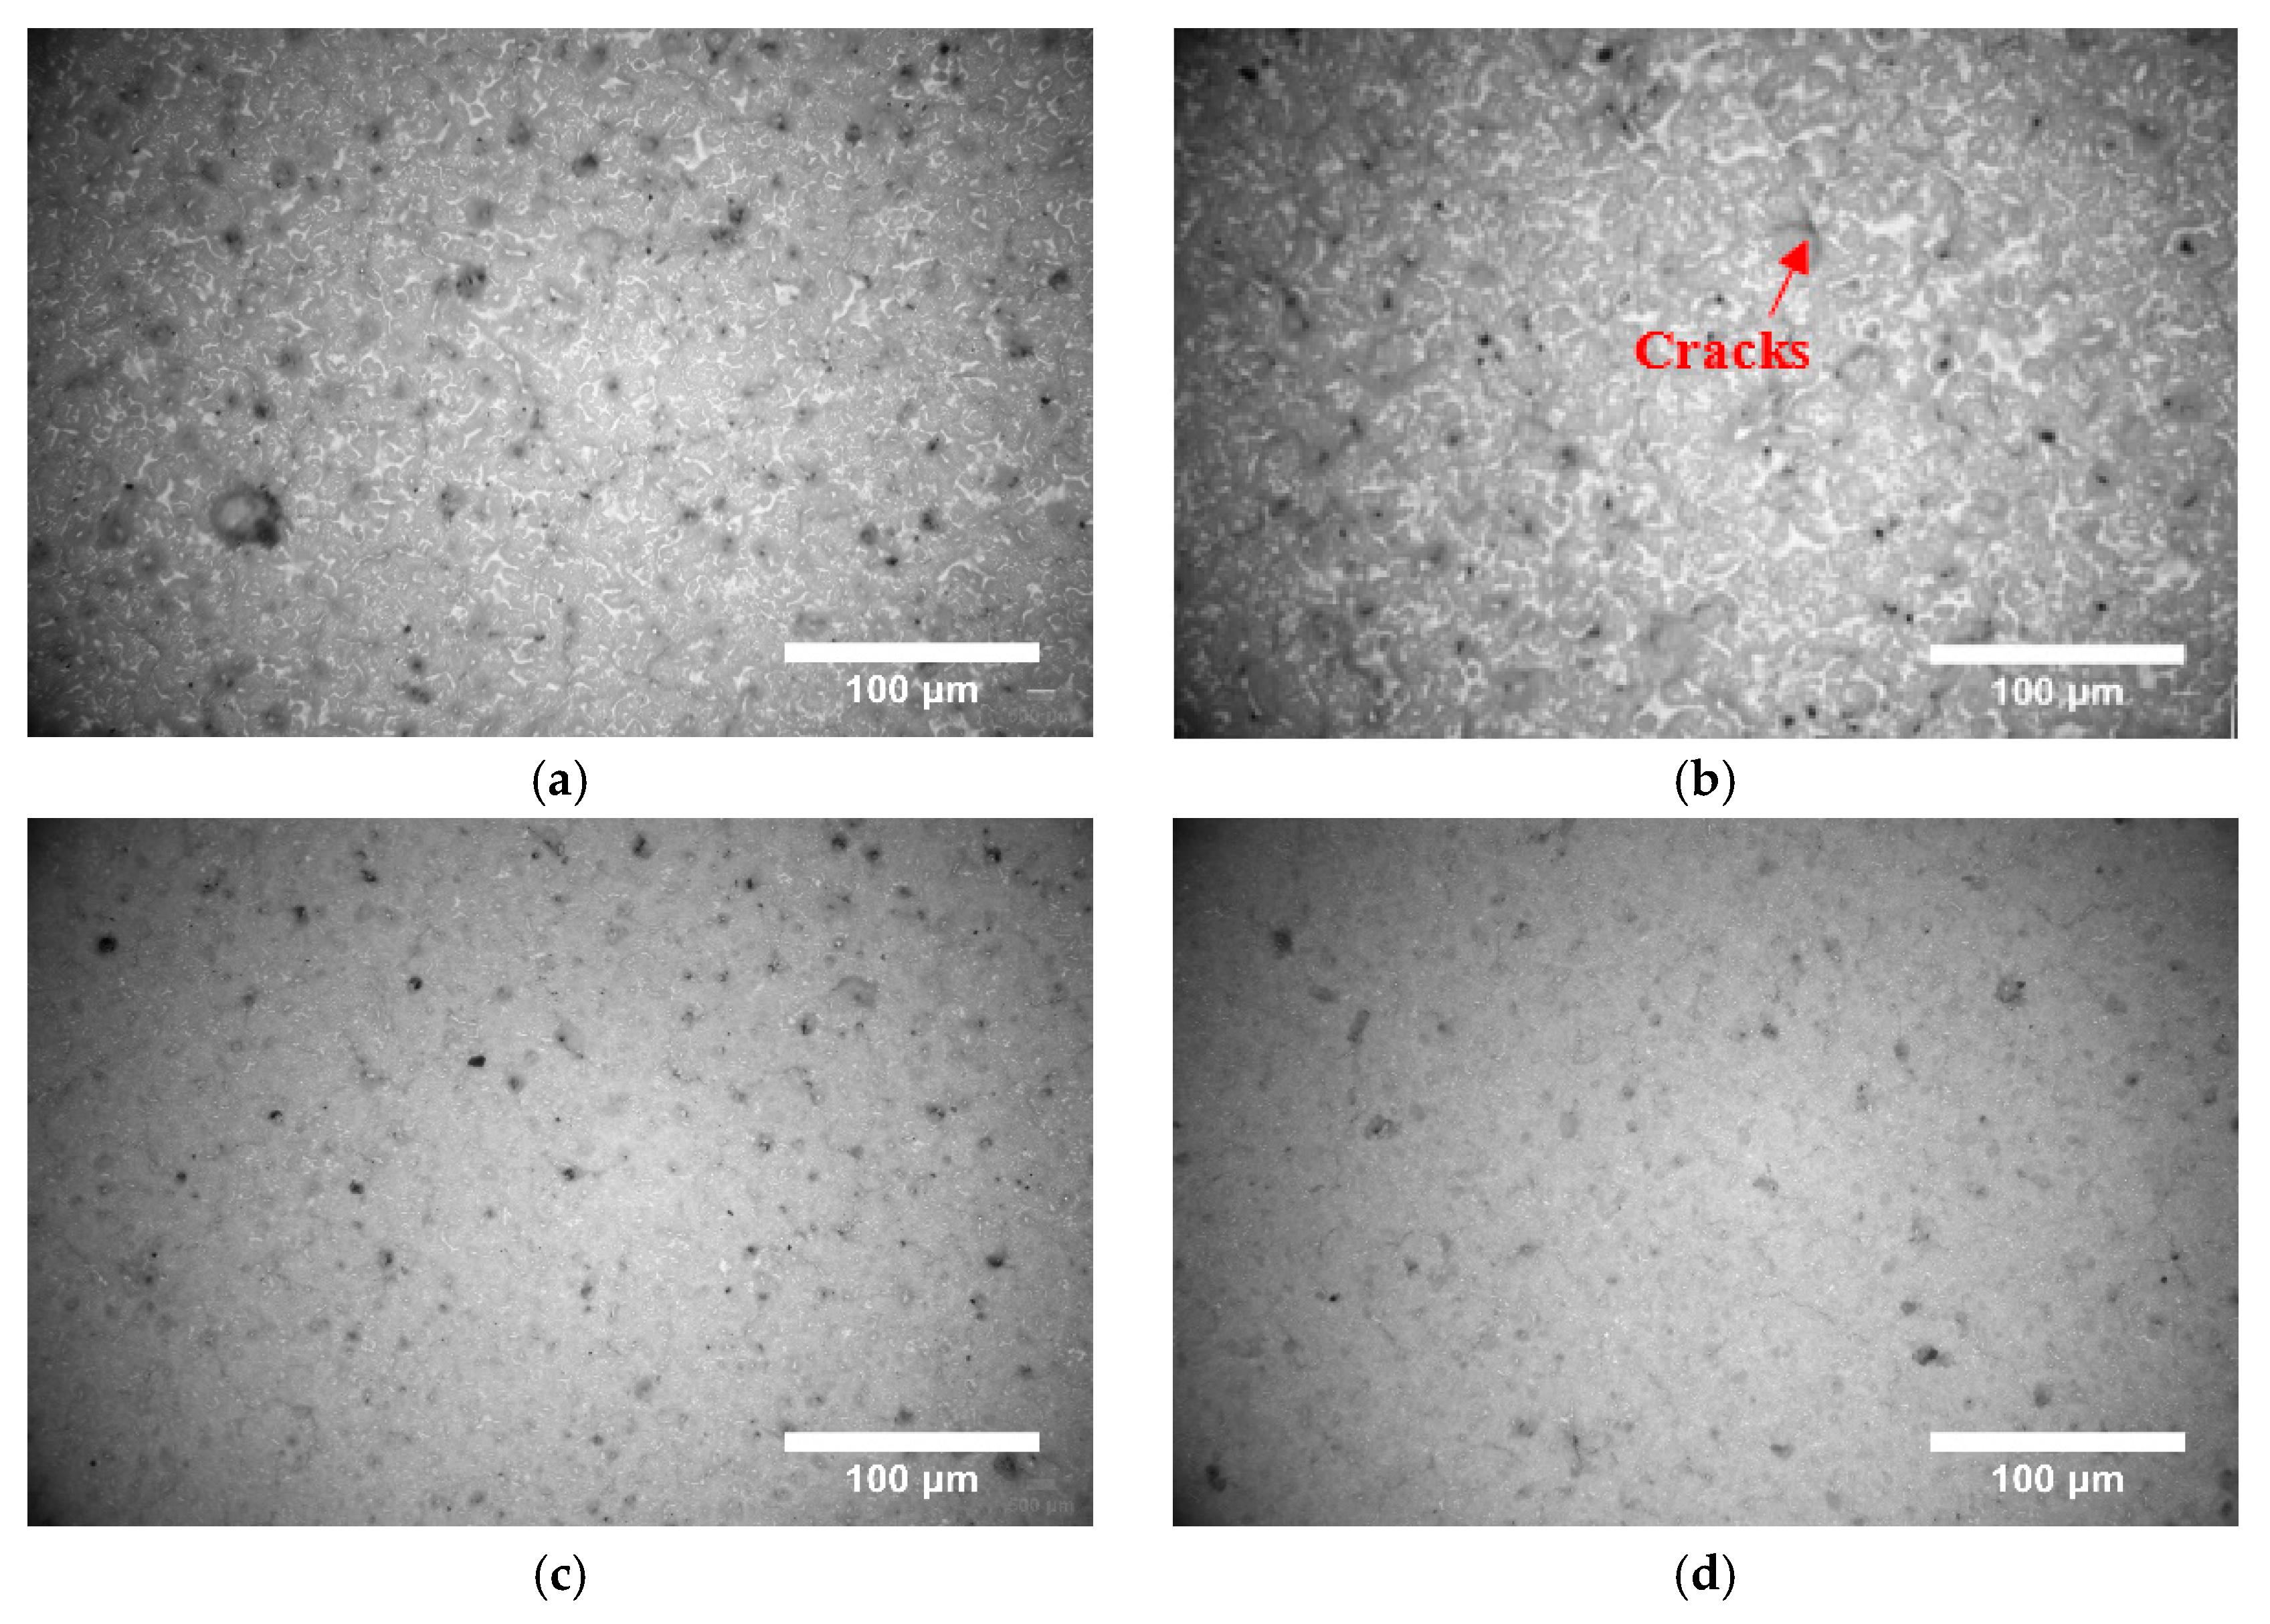
3.1. Surface Morphology of PSZ During Heating

Figure 2 shows the surface morphology of PSZ coatings at different temperatures during sintering. As can be seen, a few bubbles emerged from the PSZ at 70 °C. The PSZ progressively transformed from a soluble liquid into an unmeltable and insoluble solid below 200 °C [17]. At 150 °C, gas continuously escaped. When the coating surface cracked at 570 °C, many bubbles were generated, which was attributed to alkyl groups in PSZ decomposing into methane, methylene, propene, and other unsaturated hydrocarbons [18]. When the temperature increased to 700 °C, cracks in the PSZ surface began to form after pyrolysis. Evidently, the coating made only with PSZ could not provide effective protection.

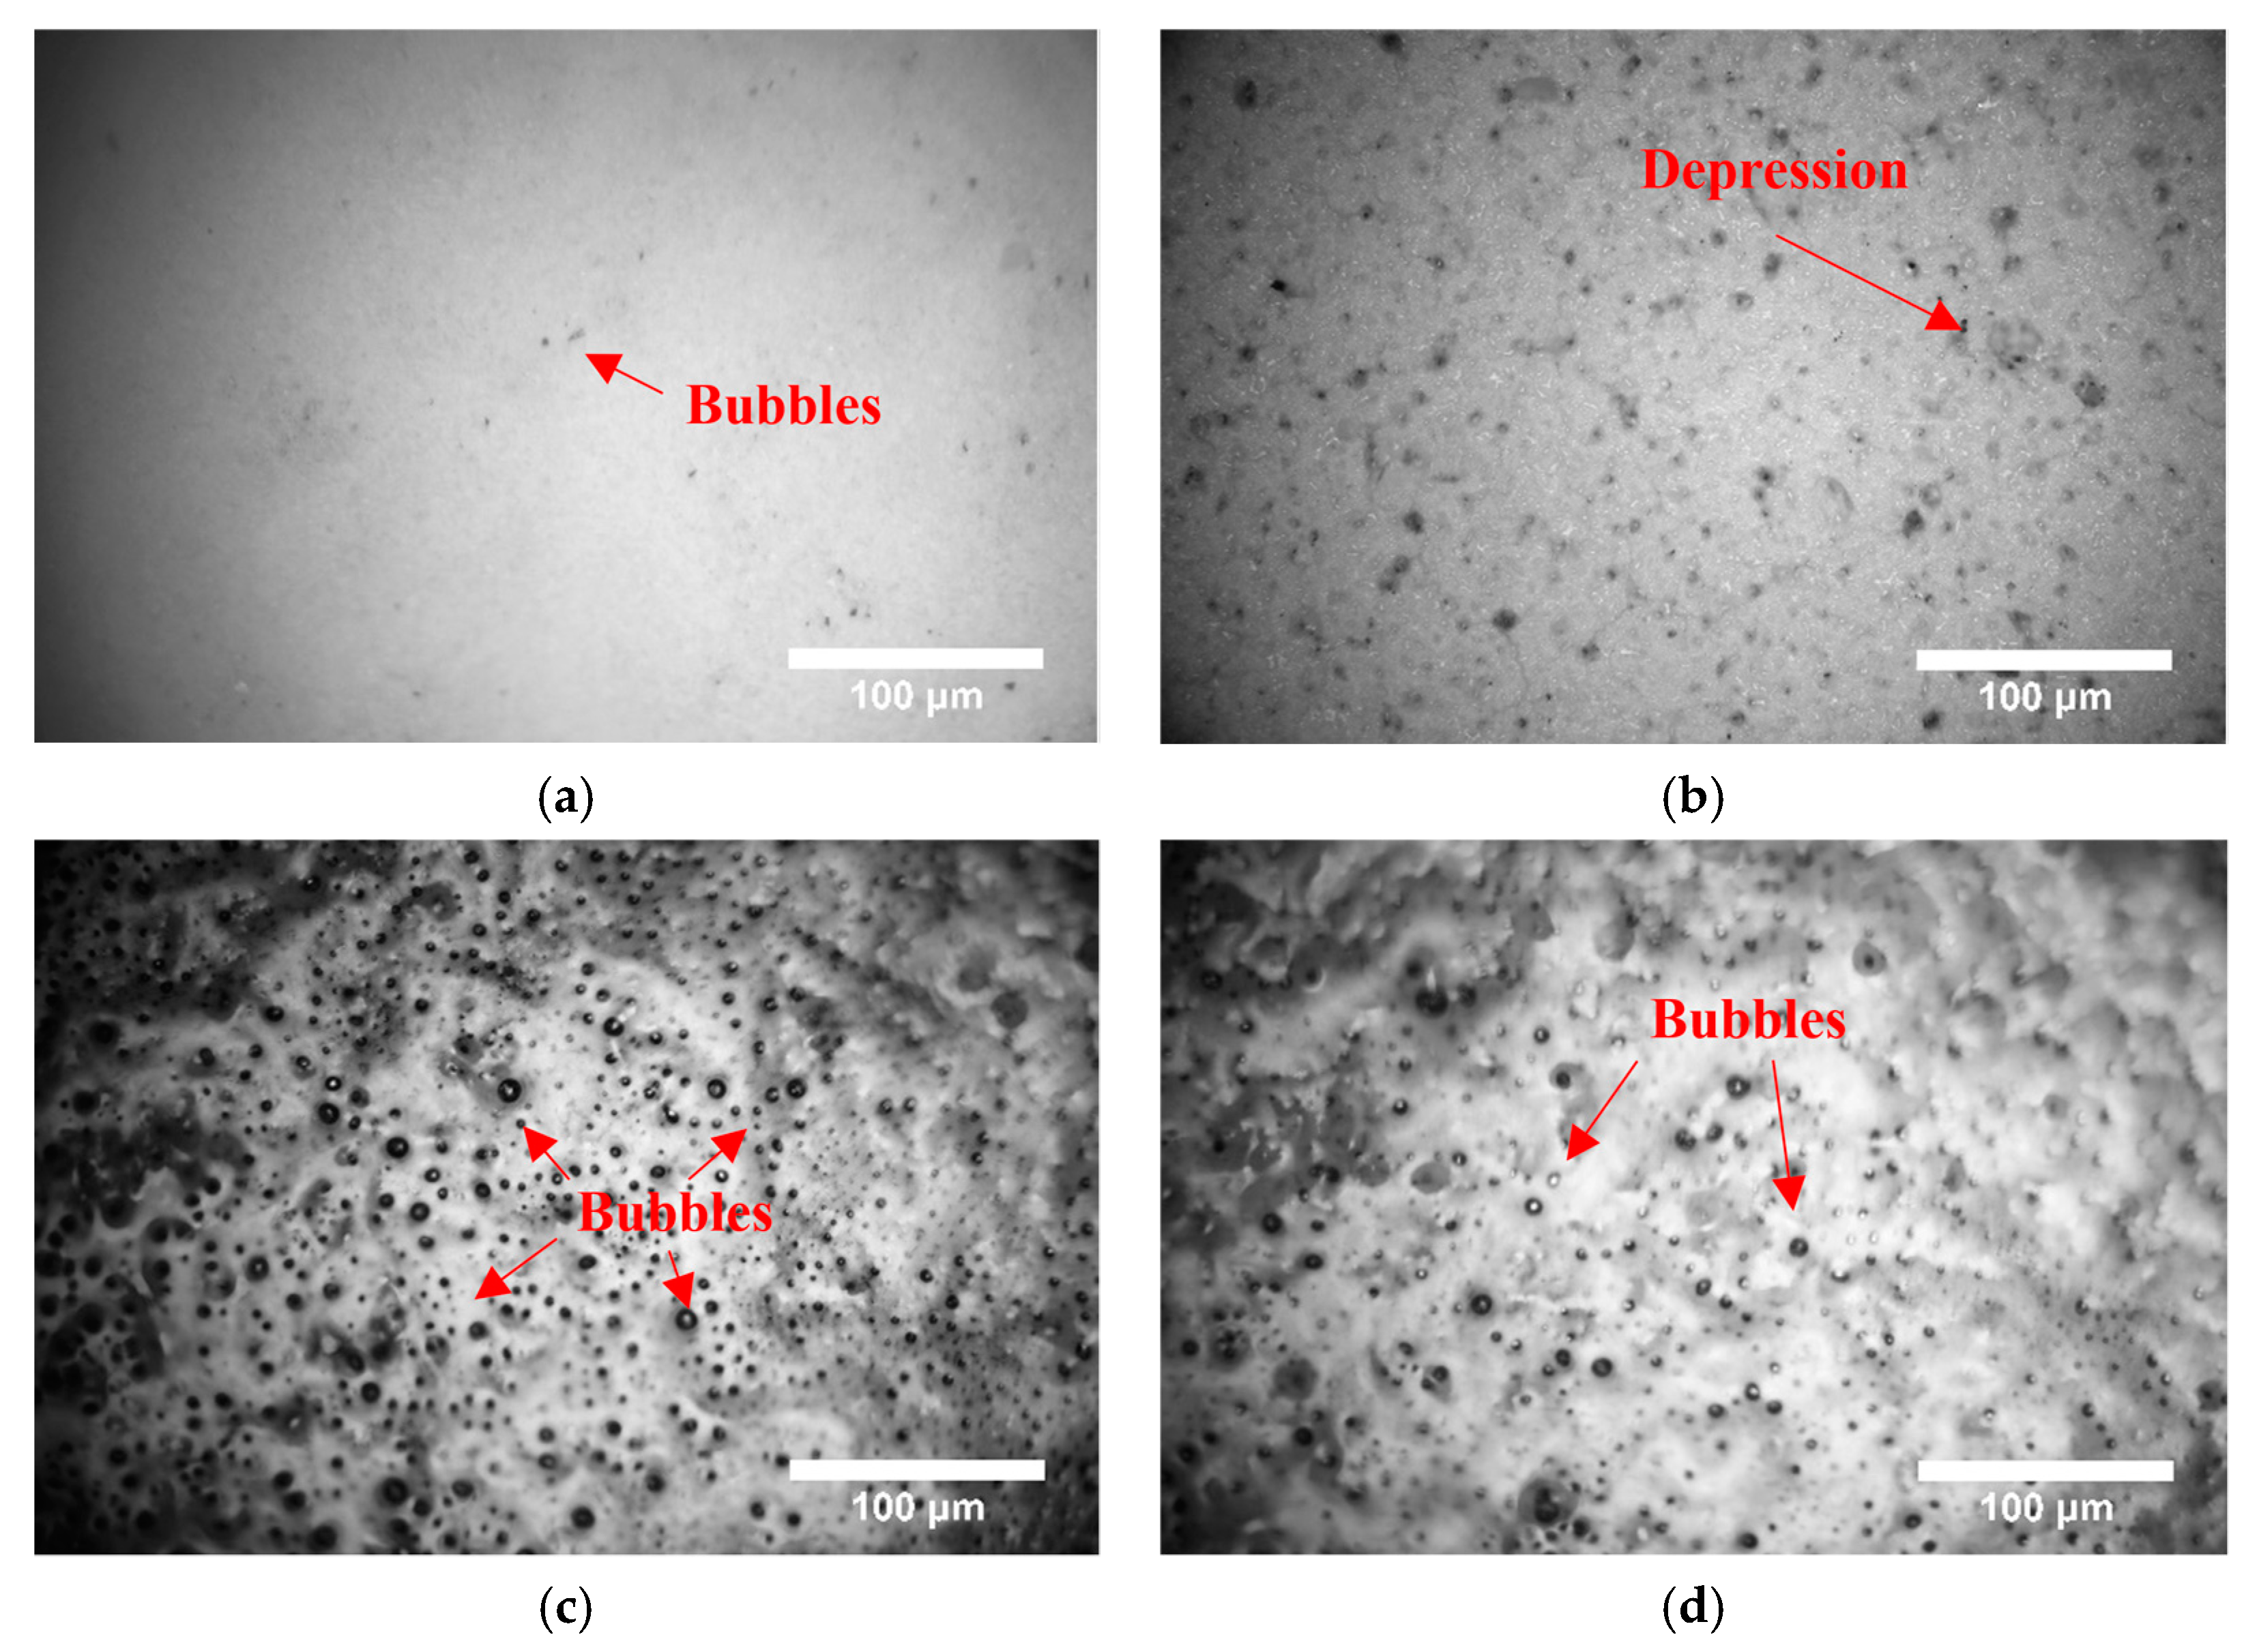
3.2. Surface Morphology after Adding Glass Powder to PSZ During Heating

Figure 3 shows that PSZ is pyrolyzed at 70 °C, and a trace of gas escaped from the coating. When the temperature rose to 150 °C, PSZ continued to pyrolyze and released gas. The glass powder did not melt and the coating’s surface depressed after the gas escaped. When the temperature rose to 570 °C, the glass powder was in a melting state. Moreover, the gas heated from the coating was violent and the number of pores sharply increased. When the temperature increased to 700 °C, the number of pores on the coating surface decreased.
The n ¯ , P, and pore size at each temperature are shown in Figure 4 and Figure 5. At 570 °C, n ¯ reaches 1658. The average pore size was about 2.75 μm and the porosity was 14.91%. This was much higher than the porosity at 150 °C, which limited the escape of PSZ gas via the molten glass powder’s high viscosity. When the temperature rose to 700 °C, n ¯ decreased to 1267 and the porosity also greatly decreased, indicating that the pyrolysis reaction of PSZ weakened.
After adding glass powder, no cracks appeared on the final coating surface. This occurred because the glass powder played a healing role. However, due to the molten glass powder’s high viscosity, the PSZ-produced gas escaped rapidly and completely. This resulted in a large number of pores in the coating. The porosity phenomenon first increased and then decreased as the temperature increased during the coating’s sintering process. It is commonly believed that porosity reduces after increasing the sintering temperature and prolonging the sintering time because more gas escapes from the coating.

3.3. Surface Morphology after Adding Glass Powder and ZrO2 to PSZ during Heating

Figure 6 shows the surface morphology of the four kinds of coatings after sintering at 700 °C. When the proportion of ZrO2 was too high (Figure 6a,b), the coating surface cracked and affected smoothness. When a high proportion of glass powder was added (Figure 6c,d), the cracks on the coating surface disappeared. The glass powder enables the components to combine closely to form a uniform coating system.
The average pore size and porosity of each sample’s coating surface are calculated, as shown in Figure 7. The pores on each sample’s surface were dominated by microbubbles of less than 1 μm, especially when the average pore size was relatively small. When the ratio of PSZ, glass powder, and ZrO2 was 1:2:1, the porosity was as low as 0.19%, which was much smaller than the other coatings. Thus, the precursor-derived ceramic coating was prepared using this composition ratio.
Figure 8 shows pore size distributions for every sample after sintering. When comparing Samples 4 and 5, it can be seen that the optimal ratio for the pore distribution coating was mainly concentrated between 0 and 1 μm, whereas the maximum pore size did not exceed 3 μm. However, the pore size of Sample 5 was concentrated between 1 and 2 μm, and the average number of pores per square millimeter ranged between 2 and 4 μm. Further, the maximum pore size exceeded 4 μm. This clearly shows that ZrO2 effectively limited bubbles clustering into large pores and reduced the growth of bubble pore sizes. The porosity of Sample 4 met the requirements and achieved the expected effect.

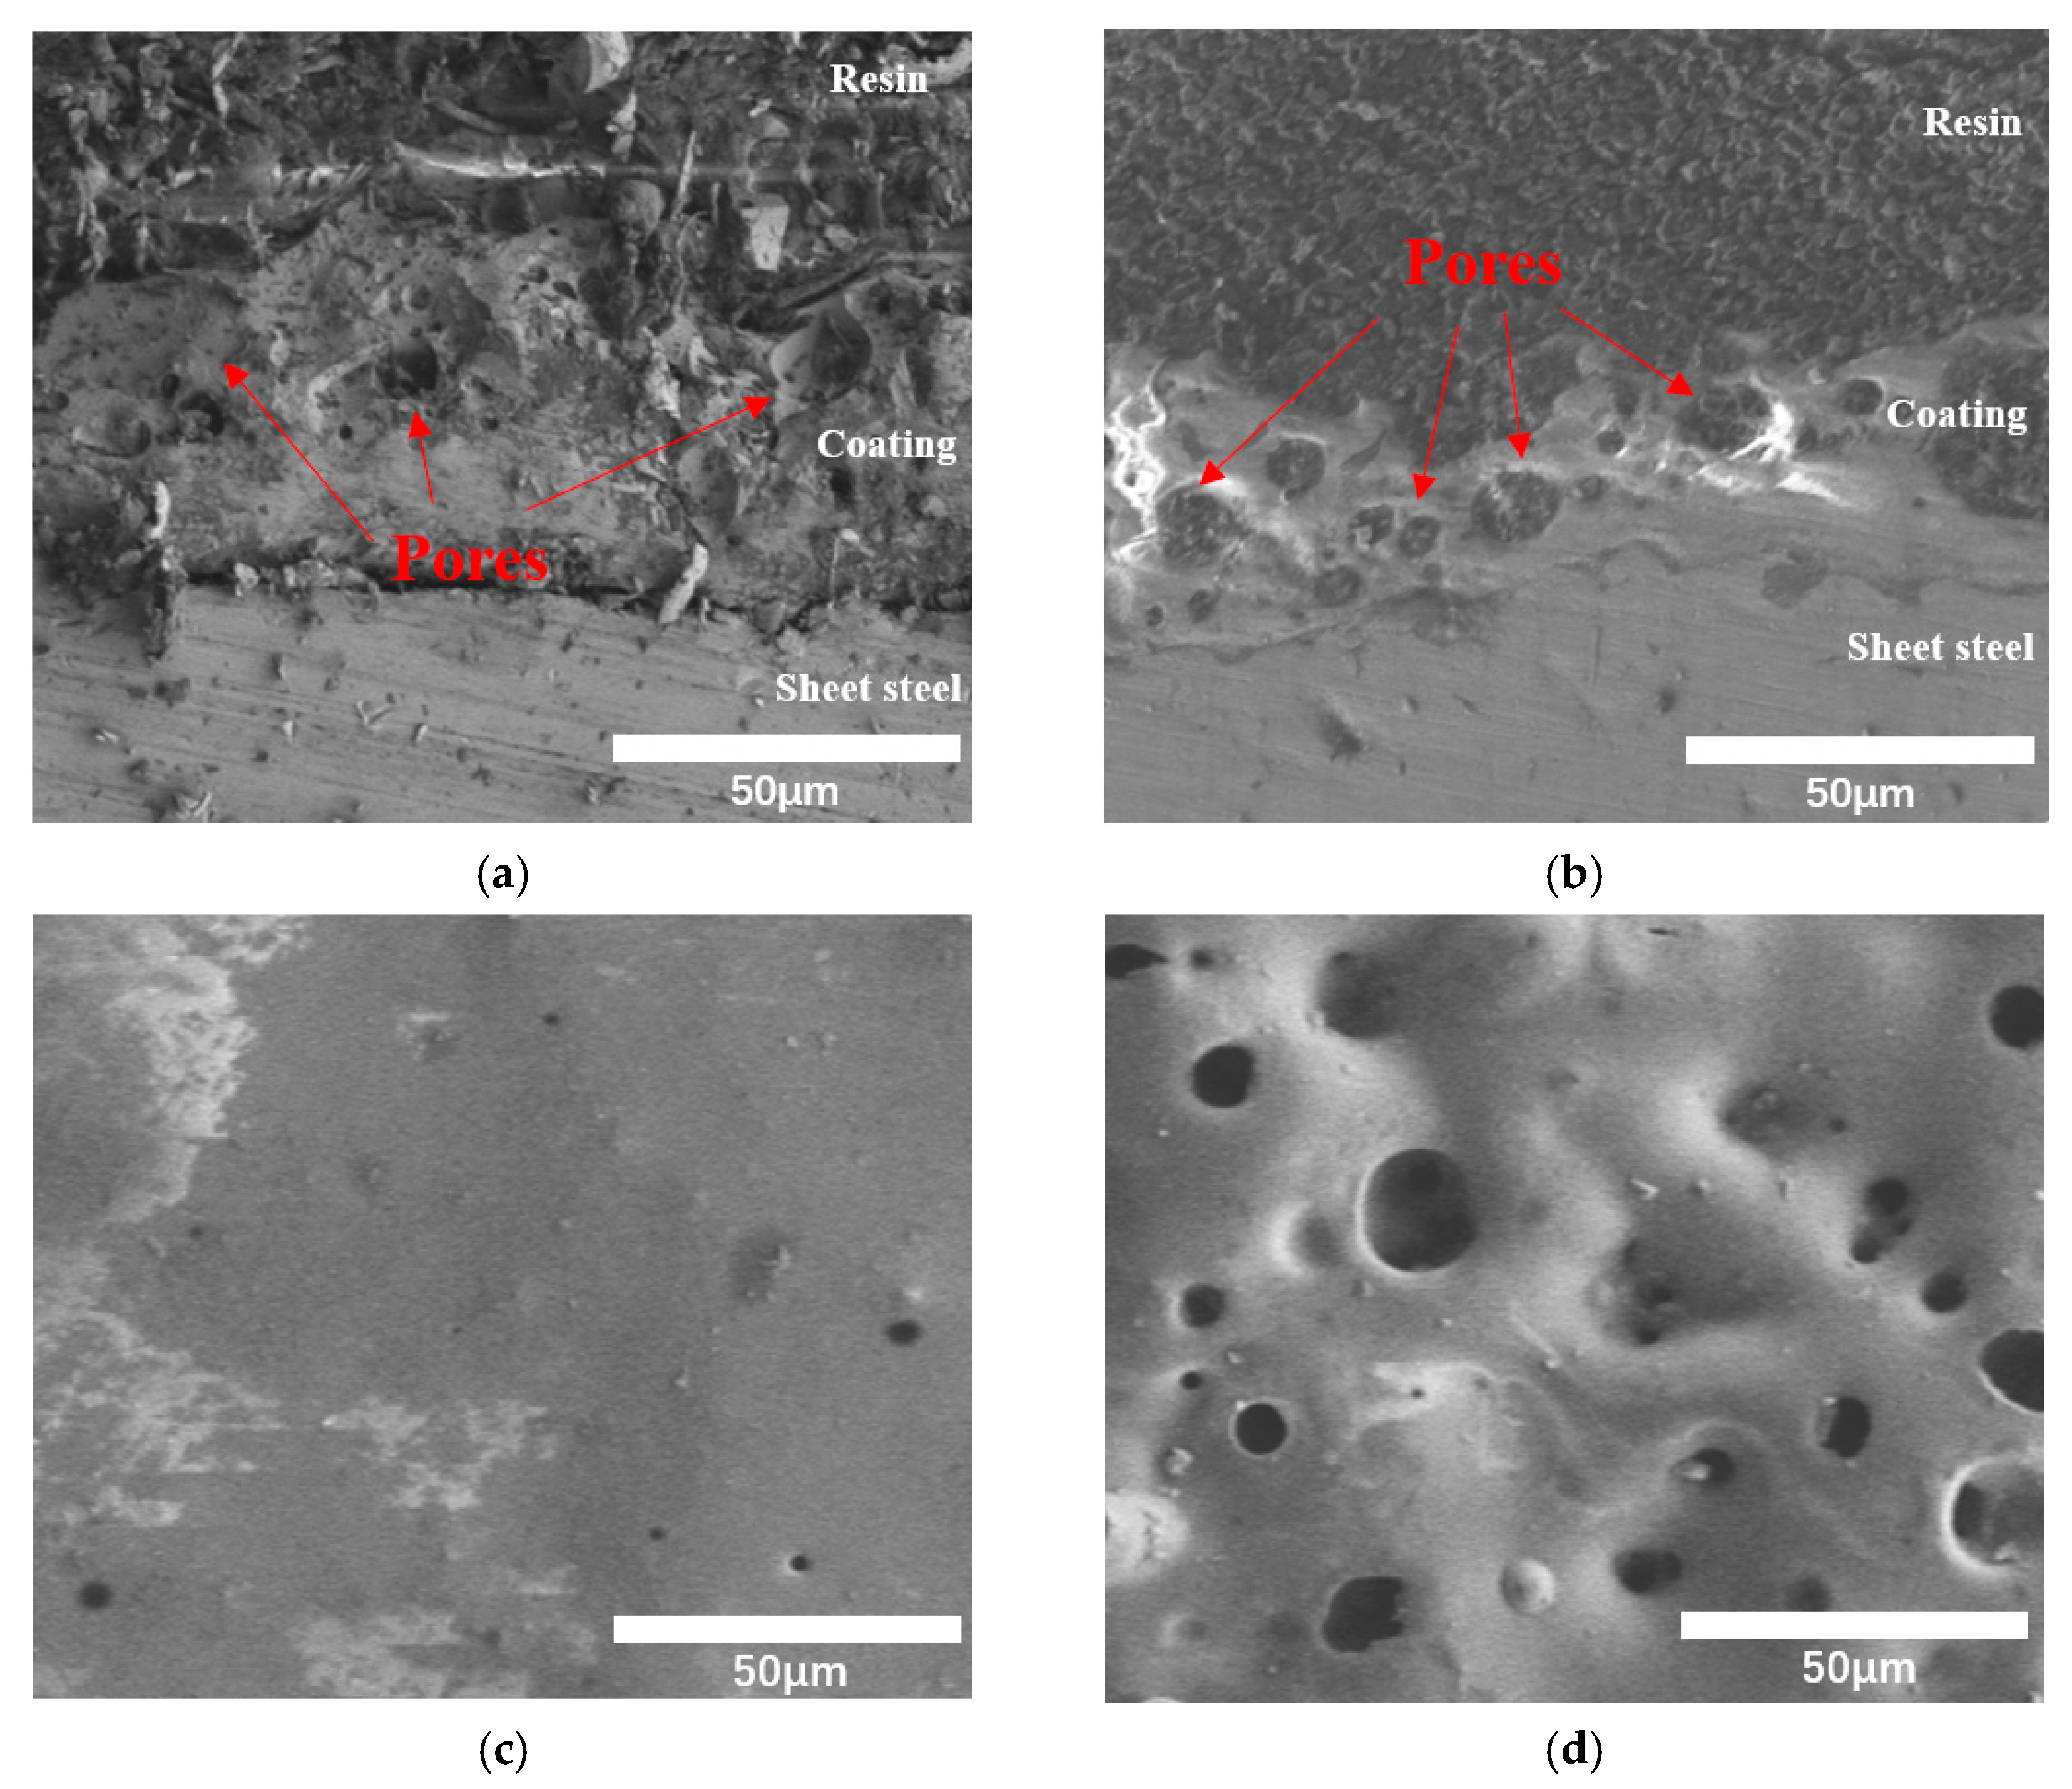
3.4. Cross Section and Surface Morphology of Coating

Because Sample 4 is the best one among all the coatings added ZrO2, we carried out a morphology analysis of its surface and cross section. Sample 5 was used for comparison. Figure 9 clearly shows that the coating with added glass powder had many large pores and its coating quality was poor. After adding ZrO2, the number of macropores decreased and was replaced by many small pores. Some small pores increased the coating porosity and reduced the coating modulus, thus reducing the thermal stress [19]. Therefore, proper retention of suspended air bubbles did not impact the coating density. Moreover, it improved the coating’s mechanical properties. Compared to Sample 5, the coating thickness increased to 80 μm after adding ZrO2, leading to a denser coating.
However, Figure 9a,c shows a small number of large pore bubbles, proving that ZrO2 has certain limitations in blocking large pores, i.e., it cannot completely eliminate them. As such, further research is needed.

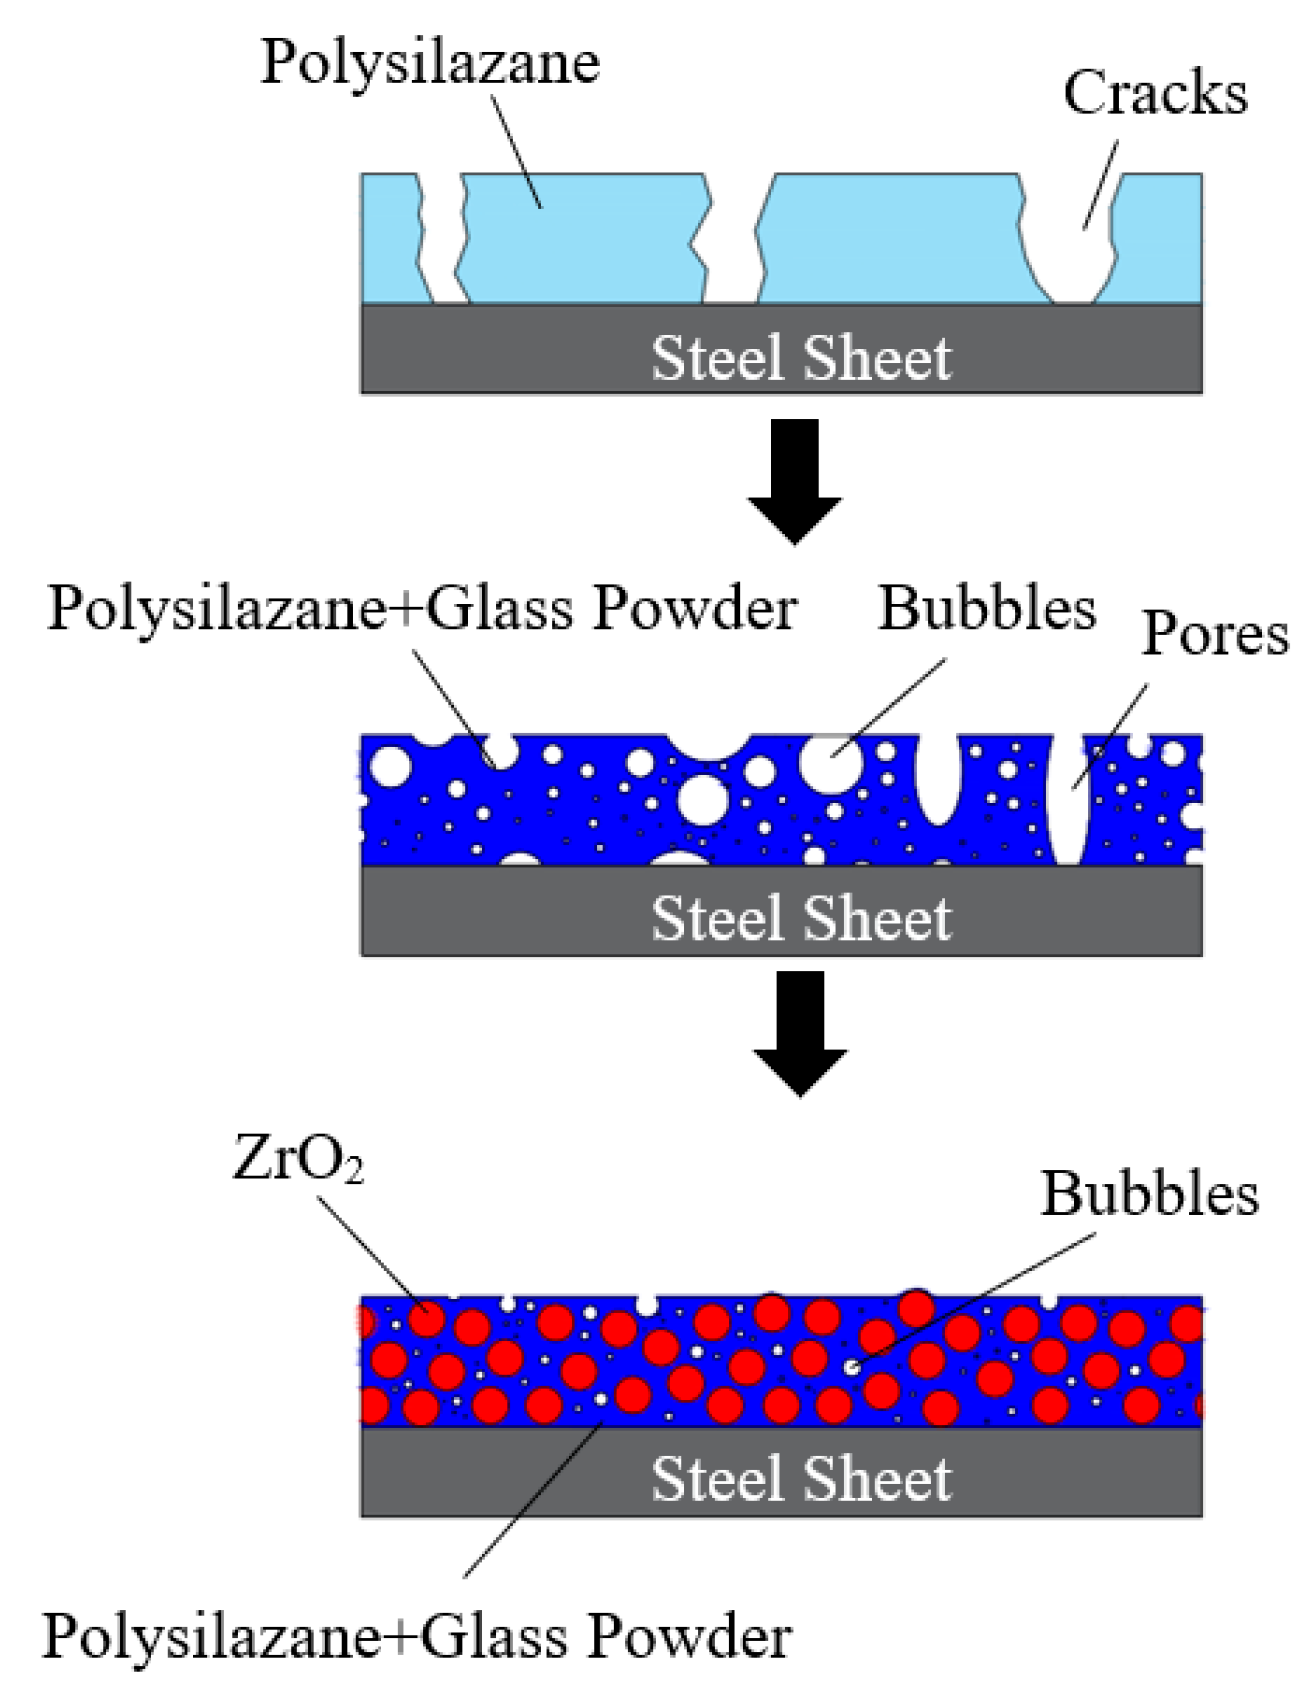
3.5. Mechanism of Pore Inhibition by Adding Fillers to the Coating

Figure 10 shows the pore-inhibition mechanism, which adds fillers to the coating. During PSZ pyrolysis, which produced ceramic products, surface defects such as cracks and pores were generated, making the coating less dense. Due to the healing effect of glass powder, the coating surface became smoother and denser after sintering, thus eliminating cracks. However, the molten glass’ high viscosity limited the gas released from the PSZ to the outside, making the gas remain in the coating and form a large pore. However, the addition of ZrO2 effectively limited the formation of large pores. The molten glass powder generated bubbles and increased porosity, which effectively limited the addition of ZrO2. ZrO2 is an inert filler with a low thermal expansion coefficient and adjusts the coating’s overall thermal expansion coefficient to reduce cracks [19]. Because of its high melting point, ZrO2 always remained in a solid state and was dispersed in the coating during the sintering process, forming the whole framework of the coating. In this case, the coating was regarded as a porous medium; the framework prevented pores from coalescing into a larger pore. The small pores had a smaller flow resistance, which easily overflowed from the gas channel formed by the gap between ZrO2 particles, reducing the coating’s overall porosity.

4. Conclusions

In this paper, we observed the how pores in the coating changed during sintering using a sintering visualization device. Moreover, we studied the effect of fillers on pore evolution in a PSZ precursor-derived ceramic coating during sintering. We herein deduced the following conclusions:
  • When the temperature increased, the PSZ-derived ceramic coating cracked and released gas, and the porosity increased gradually. Additionally, many cracks formed on the coating surface. After adding glass powder, the cracks in the coating disappeared. When the temperature increased, the porosity increased and then decreased. Thus, increasing the sintering temperature and prolonging the sintering time effectively reduced and even eliminated porosity. Further, the addition of ZrO2 effectively prevented the formation of large bubbles and reduced pore size;
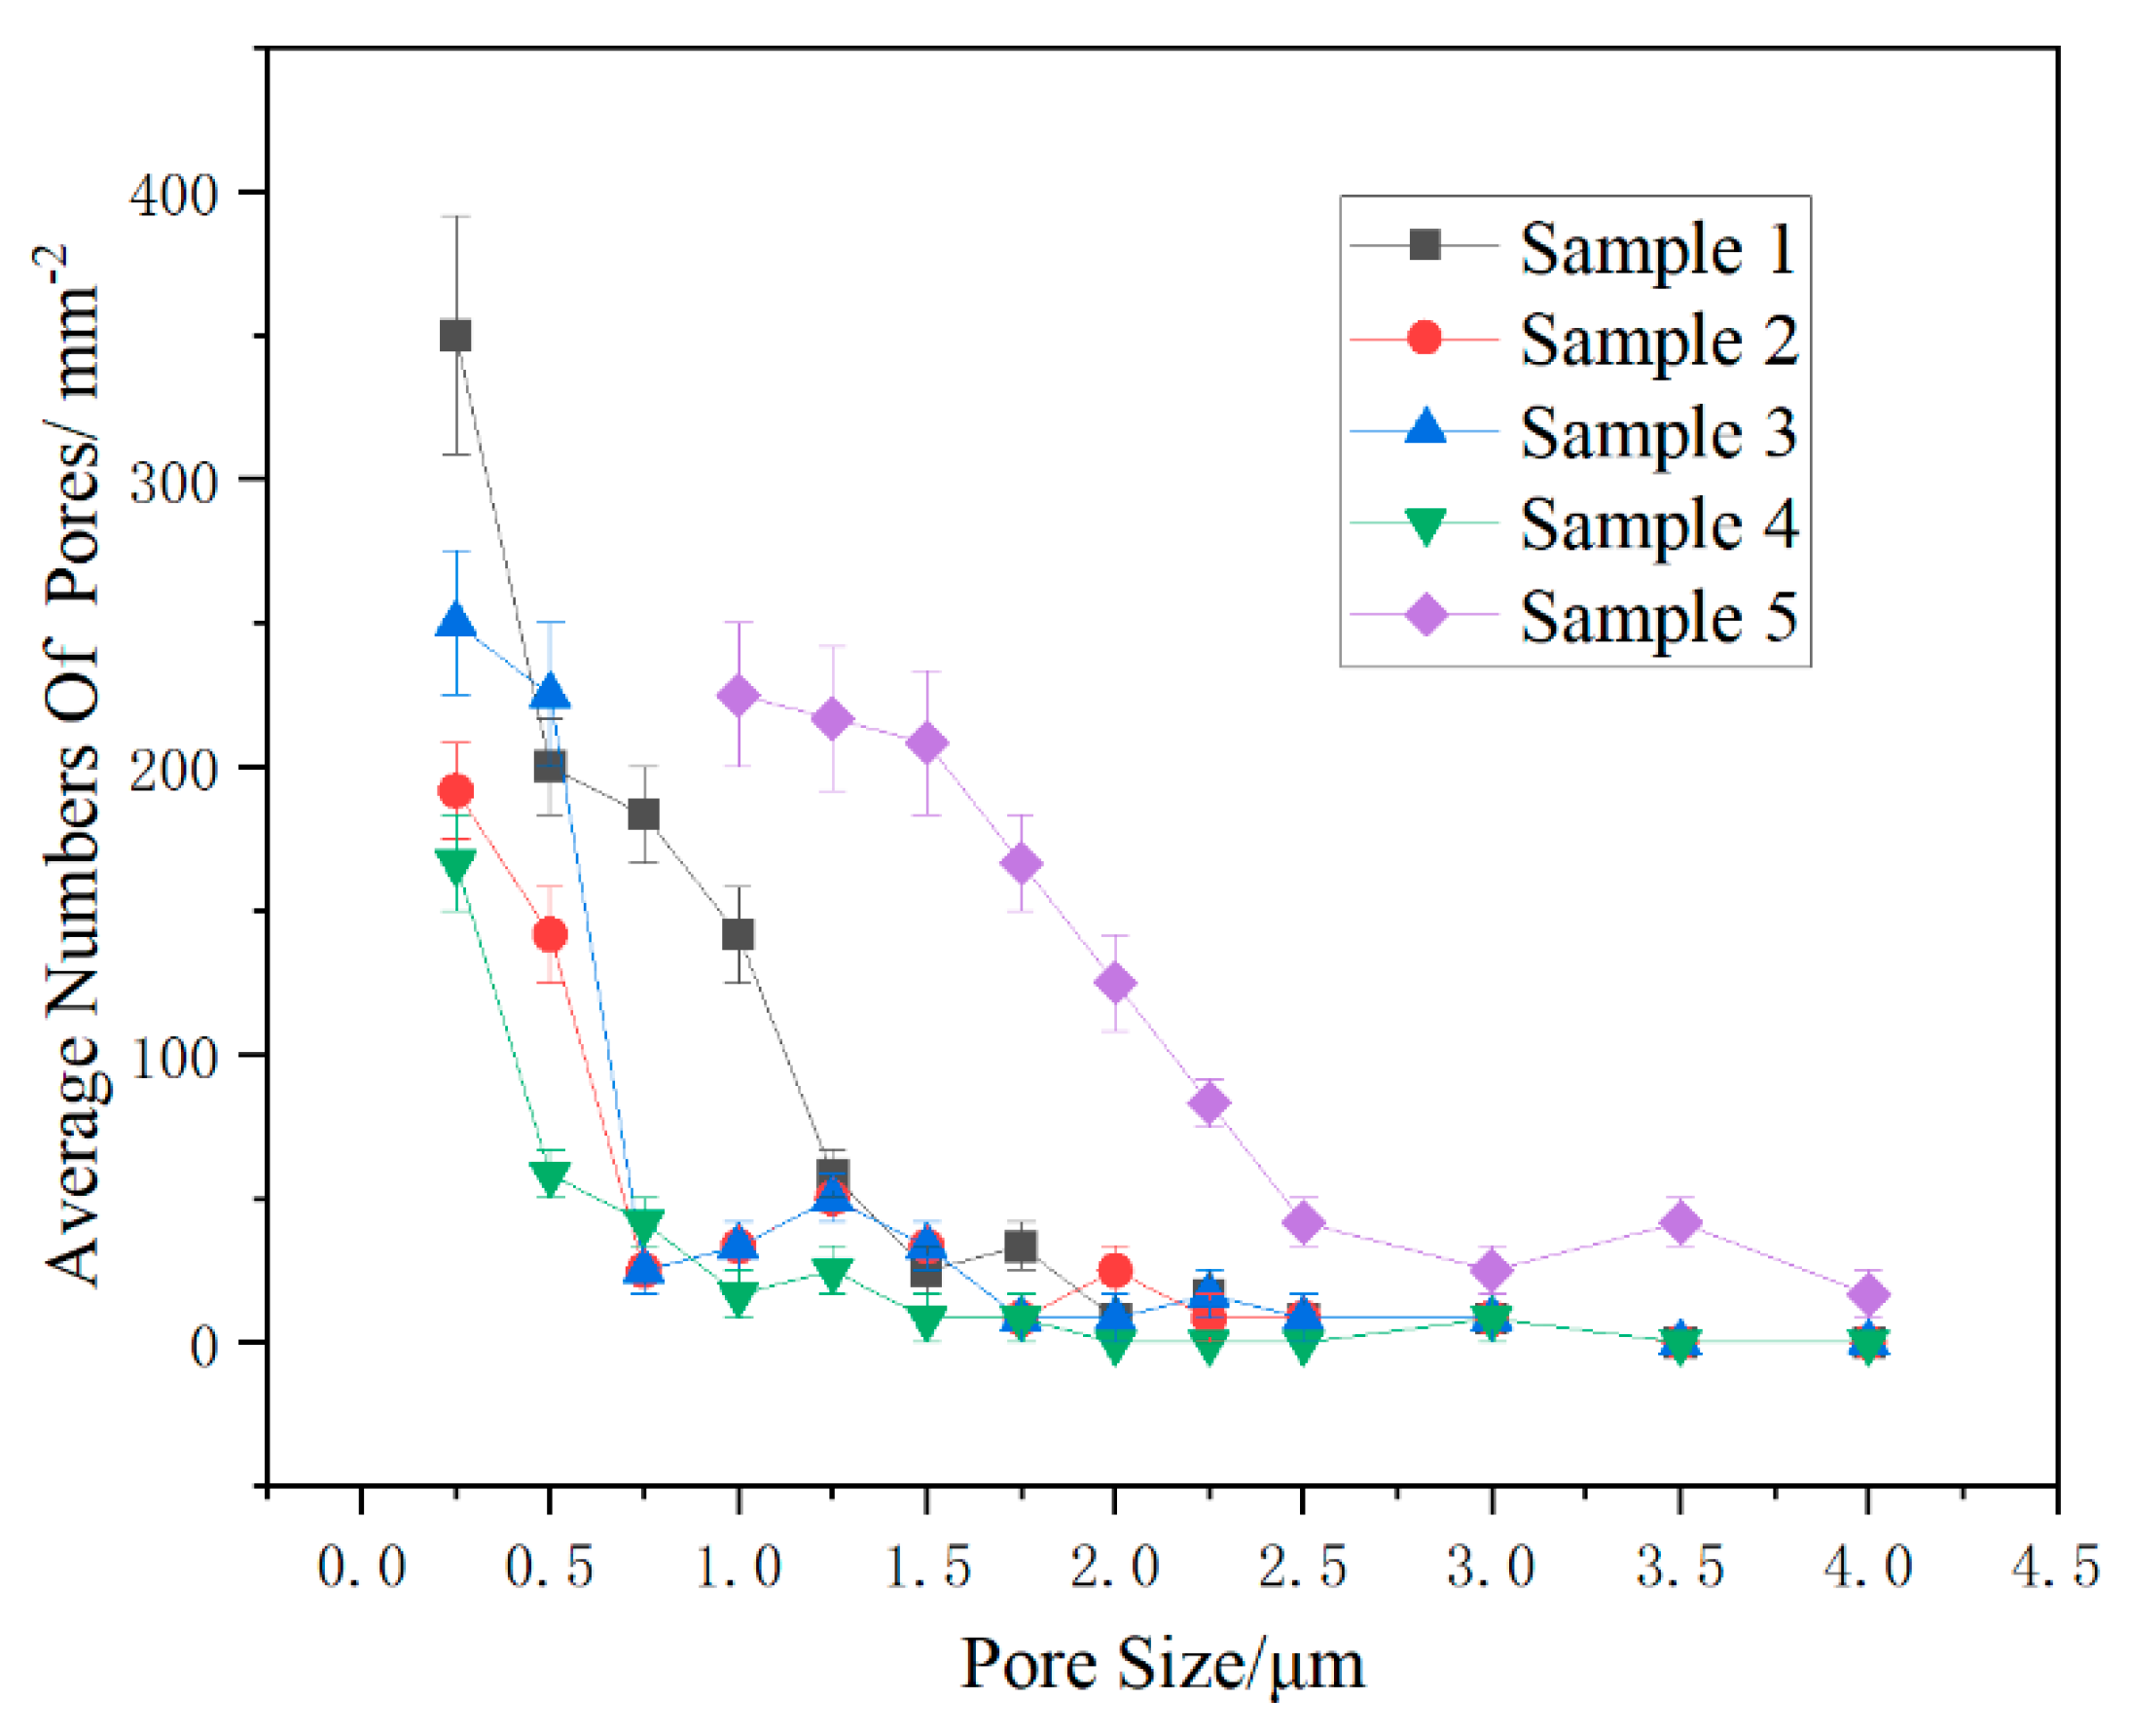
  • When the ratio of PSZ, glass powder, and ZrO2 was 1:2:1, the porosity was at its lowest. The coating surface was mainly comprised of 1 μm micropores. After sintering, the pore distribution in the coating cross-section showed a decrease in the large pores and thus the coating became denser. However, more research is needed to eliminate macropores;
  • Mechanism used for pores inhibition by adding fillers in coating was the healing effect of the glass powder. In addition, ZrO2 played a skeleton role which can adjust the thermal expansion coefficient. After the glass powder melted, its good fluidity facilitated the healing of cracks. ZrO2 formed a skeleton structure to prevent cracks and inhibit the formation of large pores. Moreover, ZrO2 facilitated small bubbles with small flow resistance to overflow from the coating, thus reducing the porosity and the number of large pores.

Author Contributions

Methodology, G.W., J.W. (Jie Wang), Z.Z., Z.F., and Y.X.; Data Curation, J.W. (Jie Wang); Writing-Original Draft Preparation, G.W.; Writing-Review & Editing, G.W. and J.W. (Jinqing Wang); Supervision, J.W. (Jinqing Wang), Z.C. and G.Z.; Project Administration, Z.C.; Funding Acquisition, J.W. (Jinqing Wang). All authors have read and agreed to the published version of the manuscript.

Funding

This research was funded by the Zhejiang Natural Science Foundation, grant number LQ20E060017 and the National Natural Science Foundation of China, grant number 51876197.

Conflicts of Interest

All authors declare no conflict of interest.

References

  1. Fedel, M.; Gómez, F.J.R.; Rossi, S.; Deflorian, F. Characterization of polyorganosilazane-derived hybrid coatings for the corrosion protection of mild steel in chloride solution. Coatings 2019, 9, 680. [Google Scholar] [CrossRef] [Green Version]
  2. Riedel, R.; Mera, G.; Hauser, R.; Klonczynski, A. Silicon-based polymer-derived ceramics: Synthesis properties and applications—A Review. Ceram. Soc. Jpn. 2006, 114, 425–444. [Google Scholar] [CrossRef] [Green Version]
  3. Günthner, M.; Kraus, T.; Dierdorf, A.; Decker, D.; Krenkel, W.; Motz, G. Advanced coatings on the basis of Si(C)N precursors for protection of steel against oxidation. J. Eur. Ceram. Soc. 2008, 29, 2061–2068. [Google Scholar] [CrossRef]
  4. Colombo, P.; Mera, G.; Riedel, R.; Sorarù, G.D. Polymer-derived ceramics: 40 years of research and innovation in advanced ceramics. J. Am. Ceram. Soc. 2010, 93, 1805–1837. [Google Scholar] [CrossRef]
  5. Justus, T.; Gonçalves, P.; Seifert, M.; Leite, M.L.; Probst, S.M.H.; Binder, C.; Motz, G.; Klein, A.N. Oxidation resistance and microstructure evaluation of a polymer derived ceramic (PDC) composite coating applied onto sintered steel. Materials 2019, 12, 914. [Google Scholar] [CrossRef] [PubMed] [Green Version]
  6. Vijay, V.; Biju, V.M.; Devasia, R. Active filler controlled polymer pyrolysis—A promising route for the fabrication of advanced ceramics. Cerm. Int. 2016, 42, 15592–15596. [Google Scholar] [CrossRef]
  7. Yang, D.; Yu, Y.; Zhao, X.; Song, Y.; Lopez-Honorato, E.; Xiao, P.; Lai, D. Fabrication of silicon carbide (SIC) coatings from pyrolysis of polycarbosilane/aluminum. J. Inorg. Organomet. Polym. Mater. 2011, 21, 534–540. [Google Scholar] [CrossRef]
  8. Seifert, M.; Travitzky, N.; Krenkel, W.; Motz, G. Multiphase ceramic composites derived by reaction of Nb and SiCN precursor. J. Eur. Ceram. Soc. 2014, 34, 1913–1921. [Google Scholar] [CrossRef]
  9. Günthner, M.; Kraus, T.; Krenkel, W.; Motz, G.; Dierdorf, A.; Decker, D. Particle-filled PHPS silazane-based coatings on steel. Int. J. Appl. Ceram. Technol. 2009, 6, 373–380. [Google Scholar] [CrossRef]
  10. Konegger, T.; Potzmann, R.; Puchberger, M.; Liersch, A. Matrix–filler interactions in polysilazane-derived ceramics with Al2O3 and ZrO2 fillers. J. Eur. Ceram. Soc. 2011, 31, 3021–3031. [Google Scholar] [CrossRef]
  11. Farhadian, M.; Raeissi, K.; Golozar, M.A.; Labbaf, S.; Hajilou, T.; Barnoush, A. 3D-Focused ion beam tomography and quantitative porosity evaluation of ZrO2-SiO2 composite coating; amorphous SiO2 as a porosity tailoring agent. Appl. Surf. Sci. 2020, 511, 145567. [Google Scholar] [CrossRef]
  12. Günthner, M.; Schütz, A.; Glatzel, U.; Wang, K.; Bordia, R.K.; Greißl, O.; Krenkel, W.; Motz, G. High performance environmental barrier coatings, Part I: Passive filler loaded SiCN system for steel. J. Eur. Ceram. Soc. 2011, 31, 3003–3010. [Google Scholar] [CrossRef]
  13. Schütz, A.; Günthner, M.; Motz, G.; Greißl, O.; Glatzel, U. High temperature (salt melt) corrosion tests with ceramic-coated steel. Mater. Chem. Phys. 2015, 159, 10–18. [Google Scholar] [CrossRef]
  14. Deshpande, S.; Kulkarni, A.; Sampath, S.; Herman, H. Application of image analysis for characterization of porosity in thermal spray coatings and correlation with small angle neutron scattering. Surf. Coat. Technol. 2004, 187, 6–16. [Google Scholar] [CrossRef]
  15. Kulkarni, A.; Wang, Z.; Nakamura, T.; Sampath, S.; Goland, G.; Herman, H.; Allen, J.; Ilavsky, J.; Long, G.; Frahm, J. Comprehensive microstructural characterization and predictive property modeling of plasma-sprayed zirconia coatings. Acta Mater. 2003, 51, 2457–2475. [Google Scholar] [CrossRef]
  16. Fowler, D.B.; Riggs, W.; Russ, J. Inspecting thermally sprayed coatings. Adv. Mater. Process. 1990, 138, 1990–2009. [Google Scholar]
  17. Kong, J.; Kong, M.; Zhang, X.; Chen, L.; An, L. Magnetoceramics from the bulk pyrolysis of polysilazane cross-linked by polyferrocenylcarbosilanes with hyperbranched topology. ACS Appl. Mater. Interfaces 2013, 5, 10367–10375. [Google Scholar] [CrossRef] [PubMed]
  18. Kim, K.; Ju, H.; Kim, J. Pyrolysis behavior of polysilazane and polysilazane-coated-boron nitride for high thermal conductive composite. Compos. Sci. Technol. 2017, 141, 1–7. [Google Scholar] [CrossRef]
  19. Barroso, G.S.; Krenkel, W.; Motz, G. Low thermal conductivity coating system for application up to 1000 °C by simple PDC processing with active and passive fillers. J. Eur. Ceram. Soc. 2015, 35, 3339–3348. [Google Scholar] [CrossRef]
Figure 1. The sinter visualization system: (a) hot stage structure and (b) photograph of the hot stage. (1) Temperature control device; (2) high-temperature microscope with charge-coupled device (CCD) camera; (3) computer; (4) circulation pump.
Coatings 10 00552 g001
Figure 2. Surface morphology of polysilazane (PSZ) coating during heating taken by CCD camera: (a) 70 °C; (b) 150 °C; (c) 570 °C; and (d) 700 °C.
Coatings 10 00552 g002
Figure 3. Surface morphology after adding glass powder to PSZ during heating taken by CCD camera: (a) 70 °C; (b) 150 °C; (c) 570 °C; and (d) 700 °C.
Coatings 10 00552 g003
Figure 4. Pore size distribution of coating at different temperatures.
Coatings 10 00552 g004
Figure 5. Average pore size and porosity at different temperatures.
Coatings 10 00552 g005
Figure 6. Surface morphology of the different coating samples after sintering taken by CCD camera: (a) Sample 1 (1:1:2); (b) Sample 2 (1:2:2); (c) Sample 3 (1:1:1); and (d) Sample 4 (1:2:1).
Coatings 10 00552 g006
Figure 7. Average pore size and porosity of the coating samples.
Coatings 10 00552 g007
Figure 8. Pore size distributions of the coating samples after sintering.
Coatings 10 00552 g008
Figure 9. Cross-section morphology and surface morphology of Samples 4 and 5 taken by SEM: (a) cross-section morphology of Sample 4; (b) cross-section morphology of Sample 5; (c) surface morphology of Sample 4; and (d) surface morphology of Sample 5.
Coatings 10 00552 g009
Figure 10. Mechanism of pore inhibition by adding fillers to the coating.
Coatings 10 00552 g010
Table 1. Information on the experimental materials.
MaterialTypeDensity (g/cm3)Average Diameter d50 (μm)
PSZDURAZANE 18000.900~1.005
ZrO2BYZ(Y-TZP)-26.051
Butyl AcetateB1196850.88
Glass PowderGlass 84702.843.3
Table 2. Composition ratios of ceramic slurries (volume ratios).
Sample12345
PSZ/glass powder/ZrO21:1:21:2:21:1:11:2:11:1:0

