Article

Enhancement of the Electrochemical Properties of an Open-Pore Graphite Foam with Electrochemically Reduced Graphene Oxide and Alternating Current Dispersed Platinum Particles

1
Departamento de Ingeniería Textil y Papelera, Escuela Politécnica Superior de Alcoy, Universitat Politècnica de València, Plaza Ferrándiz y Carbonell, s/n, 03801 Alcoy, Spain
2
Departamento de Química Inorgánica de la Universidad de Alicante e Instituto Universitario de Materiales de Alicante, University of Alicante, Ap 99, E-03080 Alicante, Spain
*
Author to whom correspondence should be addressed.
Coatings 2020, 10(6), 551; https://doi.org/10.3390/coatings10060551
Submission received: 12 May 2020 / Revised: 1 June 2020 / Accepted: 5 June 2020 / Published: 8 June 2020
(This article belongs to the Special Issue Synthesis, Properties and Applications of Graphene Oxide)

Abstract

:
This paper aimed to improve the electrochemical activity of a pitch-derived open-pore graphite foam (GF) by an electrochemical coating of reduced graphene oxide (RGO) and platinum particles without significantly affecting its 3D-structure. RGO was synthesized using cyclic voltammetry (CV) from a 3 g L−1 GO and 0.1 M LiClO4 solution. For the electrodeposition of Pt particles, an alternating current method based on electrochemical impedance spectroscopy (EIS) was used. A sinusoidal voltage from a fixed potential Ei was varied following a selected amplitude (ΔEac = ± 0.35 V) in a frequency range of 8 Hz ≤ fi ≤ 10Hz, where i = 500. This method proved its efficiency when compared to the traditional CV by obtaining more highly electroactive coatings in less synthesis time. For samples’ characterization, physical measures included permeability, pressure drop, and nitrogen adsorption isotherms. The electrochemical characterization was performed by CV. The surface morphology and chemical composition were examined using field emission electron microscopy (FESEM) and energy-dispersive X-ray spectroscopy (EDX), respectively. RGO improved the electron transfer rate constant of GF, and a more homogeneous coating distribution of reduced size Pt particles was obtained.

1. Introduction

Success in the application of the replication technique, extensively used in the fabrication of metal foams, has led to the manufacture of pitch-derived open-pore foams with a high degree of graphitization. With the application of this technique, precise control of the volume fraction of pores, shape, size, and distribution of pores has also been possible [1,2]. In addition, due to high electronic conductivity, strong resistance to acidic/alkaline environments, and enhanced accessibility of active sites, 3D porous carbonaceous materials have attracted attention as electrodes for electrocatalytic applications [3]. Graphene is a material with unique properties, such as high electrical and thermal conductivity, high electron mobility (~200,000 cm2 V−1 s−1), excellent mechanical/thermal stability, prominent stability for chemical agents, and a high surface area (2630 m2 g−1) [4,5,6,7]. Graphene oxide (GO) is the most common precursor for graphene and its derivatives. To recover the graphitic structure and electrical conductivity of graphene, GO has to be reduced [8,9,10,11,12]. In the present work, the reduction of GO was carried out by cyclic voltammetry (CV). The electrochemical reduction of GO has the advantage of being eco-friendly and provides accurate control of the synthesis parameters [8]. Besides its good electrical properties, RGO possesses a large conjugated aromatic ring structure that can physically interact with porous carbon materials [13]. Given its high surface area, graphene is also a good substrate for dispersing metal particles and producing metal-carbon hybrids with improved electrocatalytic activity. In this regard, electrochemical studies based on graphene/platinum materials have been widely reported [14,15,16,17,18,19,20]. In the present work, an open-pore graphite foam electrode (GFE) was electrochemically modified with RGO and Pt particles to improve its electrochemical properties while maintaining the 3D structure of the graphite foam. The evolution of cyclic voltammograms with a number of scans was used to optimize the RGO synthesis. An alternating current method based on electrochemical impedance spectroscopy (EIS) was used to perform the Pt particle synthesis. This technique has already been used by Lupu et al. [21] and Molina et al. [22]. It was reported that this method is of interest to minimize the synthesis time and obtain coatings with greater electroactivity in comparison with the best results obtained under potentiostatic conditions. In the present work, the results were compared with those obtained by CV in accordance with the range of potentials established for Pt electrodeposition. The different surface materials were characterized physically and electrochemically. For physical characterization, measurements of permeability, pressure drop, and nitrogen adsorption isotherms were carried out. The surface morphology was examined using field emission electron microscopy (FESEM, Valencia, Spain). The electrochemical activity of different electrodes was measured by CV and their chemical composition by energy-dispersive X-ray spectroscopy (EDX, Valencia, Spain). At this point, a series of electrochemical studies were initiated to study the applicability of the electrodes as anodes for the oxidation of emerging pollutants, such as non-steroidal anti-inflammatories.

2. Materials and Methods

2.1. Chemicals

Graphene oxide (GO) was purchased from Nanoinnova Technologies SL (Toledo, Spain). A GO characterization sheet is available on the website [23]. Hexachloroplatinic (IV) acid hexahydrate (4% Pt) was acquired from Merck (Darmstadt, Germany). The other reagents were analysis-pur (a.p.). Ultrapure water (18.2 mΩ cm) was dispensed from an Elix 3 Millipore-Milli-Q Advantage A10 system (MerckMillipore, Burlington, MA, USA). The solutions were deoxygenated with N2 (99.9992%).

2.2. GFE Preparation

The open-pore graphite foam samples used for the fabrication of GFE were rectangular prisms, sized 2.7 × 0.6 × 0.6 cm. A copper wire was wrapped around the top for electric contact. The GFE was then covered with Teflon tape, except for the lower surface 0.6 × 0.6 cm, which was immersed in the solution. Before each experiment, this surface was sanded with 400–600 grit grinding papers. The surface was then cleaned in an ultrasonic bath and dried at room temperature. The GFE for the physical characterization was similarly prepared, but in this case, the usable surface was 2.0 × 0.6 × 0.6 cm.

2.3. Electrochemical Measurements

The CV and EIS measurements were performed in a conventional cell of three electrodes with an Eco-Chemie Autolab PGSTAT302 potentiostat/galvanostat (Metrohm Autolab B.V., Utrecht, The Netherlands). For the electrochemical measures, a Pt wire of 1 cm2 and Ag/AgCl (3 M KCl) were used as counter and reference electrodes, respectively. In the preparation of the coating of the electrodes for physical characterization, a Pt cylindrical mesh was used as a counter electrode to ensure homogeneous coating around the electrode.

2.4. Physical Measurements

The permeability and pressure drop measurements were made using a homemade device, already presented in [24], and equipped with ±0.001 bar precision manometers at both ends of the sample. Permeability was estimated with injection experiments using water as fluid by monitoring water mass (g) with time (s) on a ±0.1 mg precision balance Precisa ES320A, (Precisa Ltd., Livingston, UK). The inlet air flow was regulated with a ±0.01 bar precision manometer. Any negligible water mass loss due to evaporation from the collecting container was discarded as the total time of each measurement was <2 min. Using the same device, the pressure drop was measured by injecting air as a fluid. Airflow was followed with an air flowmeter operating within the 0–30 L min−1 flow range (Ki Key Instruments, Trevose, UK). The nitrogen adsorption isotherms were collected at −196 °C in an Autosorb 6-b produced by Quantachrome Instruments (Anton Paar QuantaTec Inc., Boynton Beach, FL, USA) and analyzed within the frame of the standard Brunauer–Emmett–Teller (BET) theory [25]. The surface morphology was studied with a Zeiss Ultra 55 FESEM microscope (Zeiss, Oberkochen, Germany) using an acceleration voltage of 3 kV. For the EDX measurements, the same FESEM microscope with EDX detector (Oxford Instruments, Abingdon, UK), operating at an acceleration voltage of 20 kV, was used. The mass of coated Pt was determined with an Ohaus DV215CD semi-micro balance (Ohaus Corporation, Parsippany, NJ, USA), with the readability of 0.00001 g. Before each measurement, the samples were carefully dried in a desiccator for 72 h at room temperature.

3. Results and Discussion

3.1. Synthesis, FESEM, and EDX Analysis

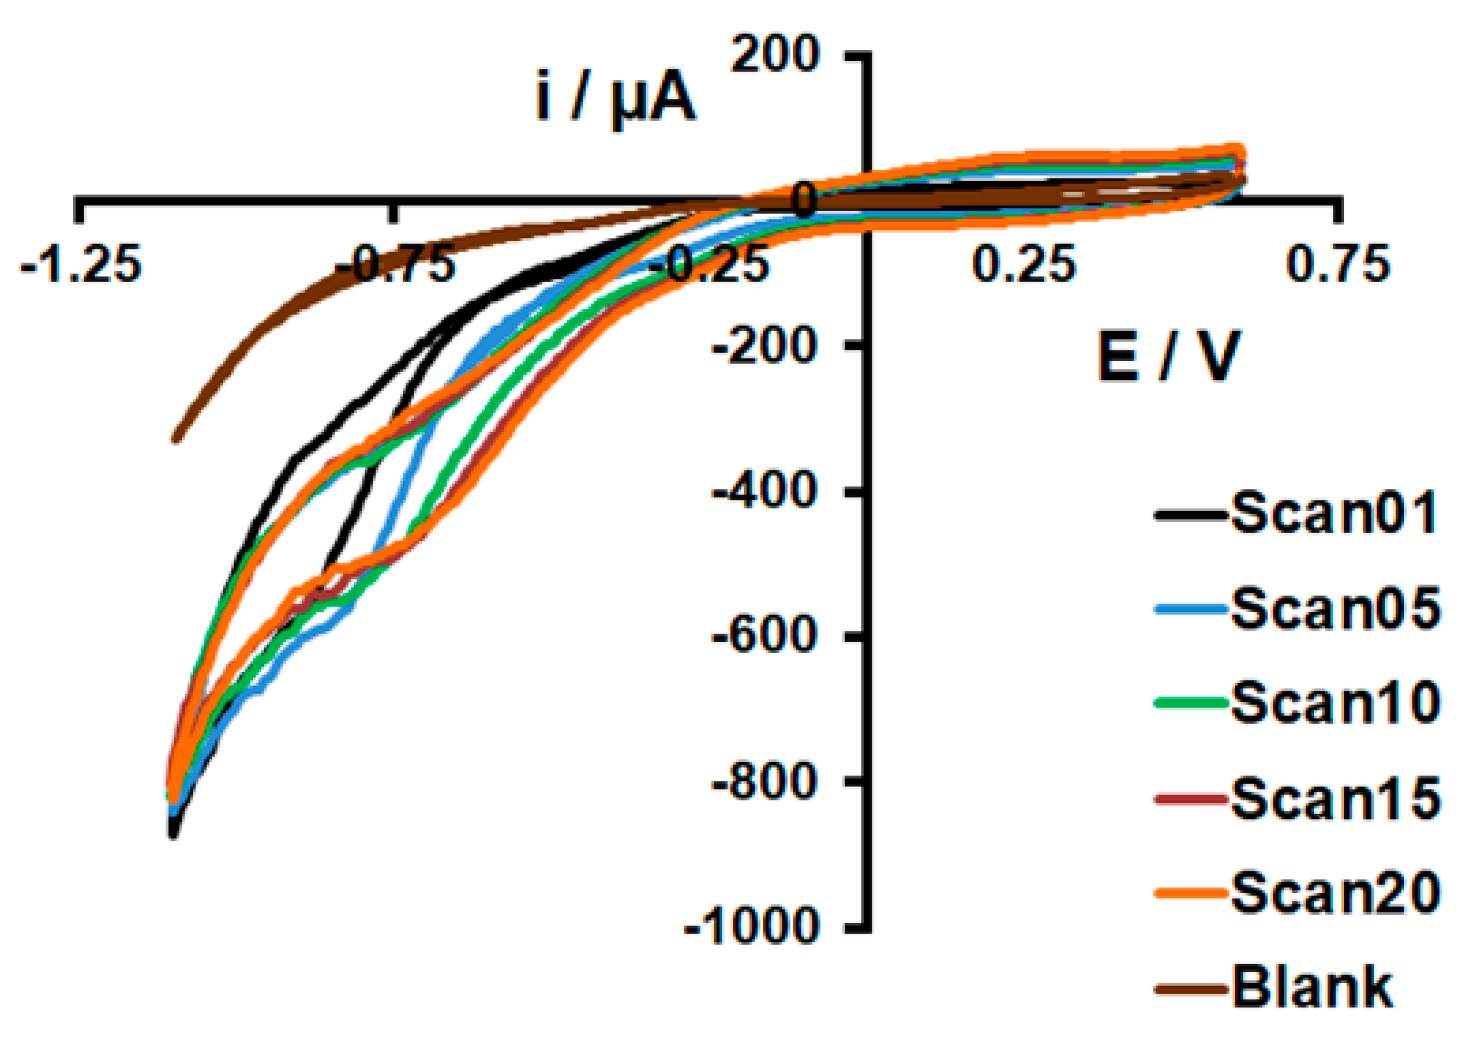
3.1.1. RGO Synthesis
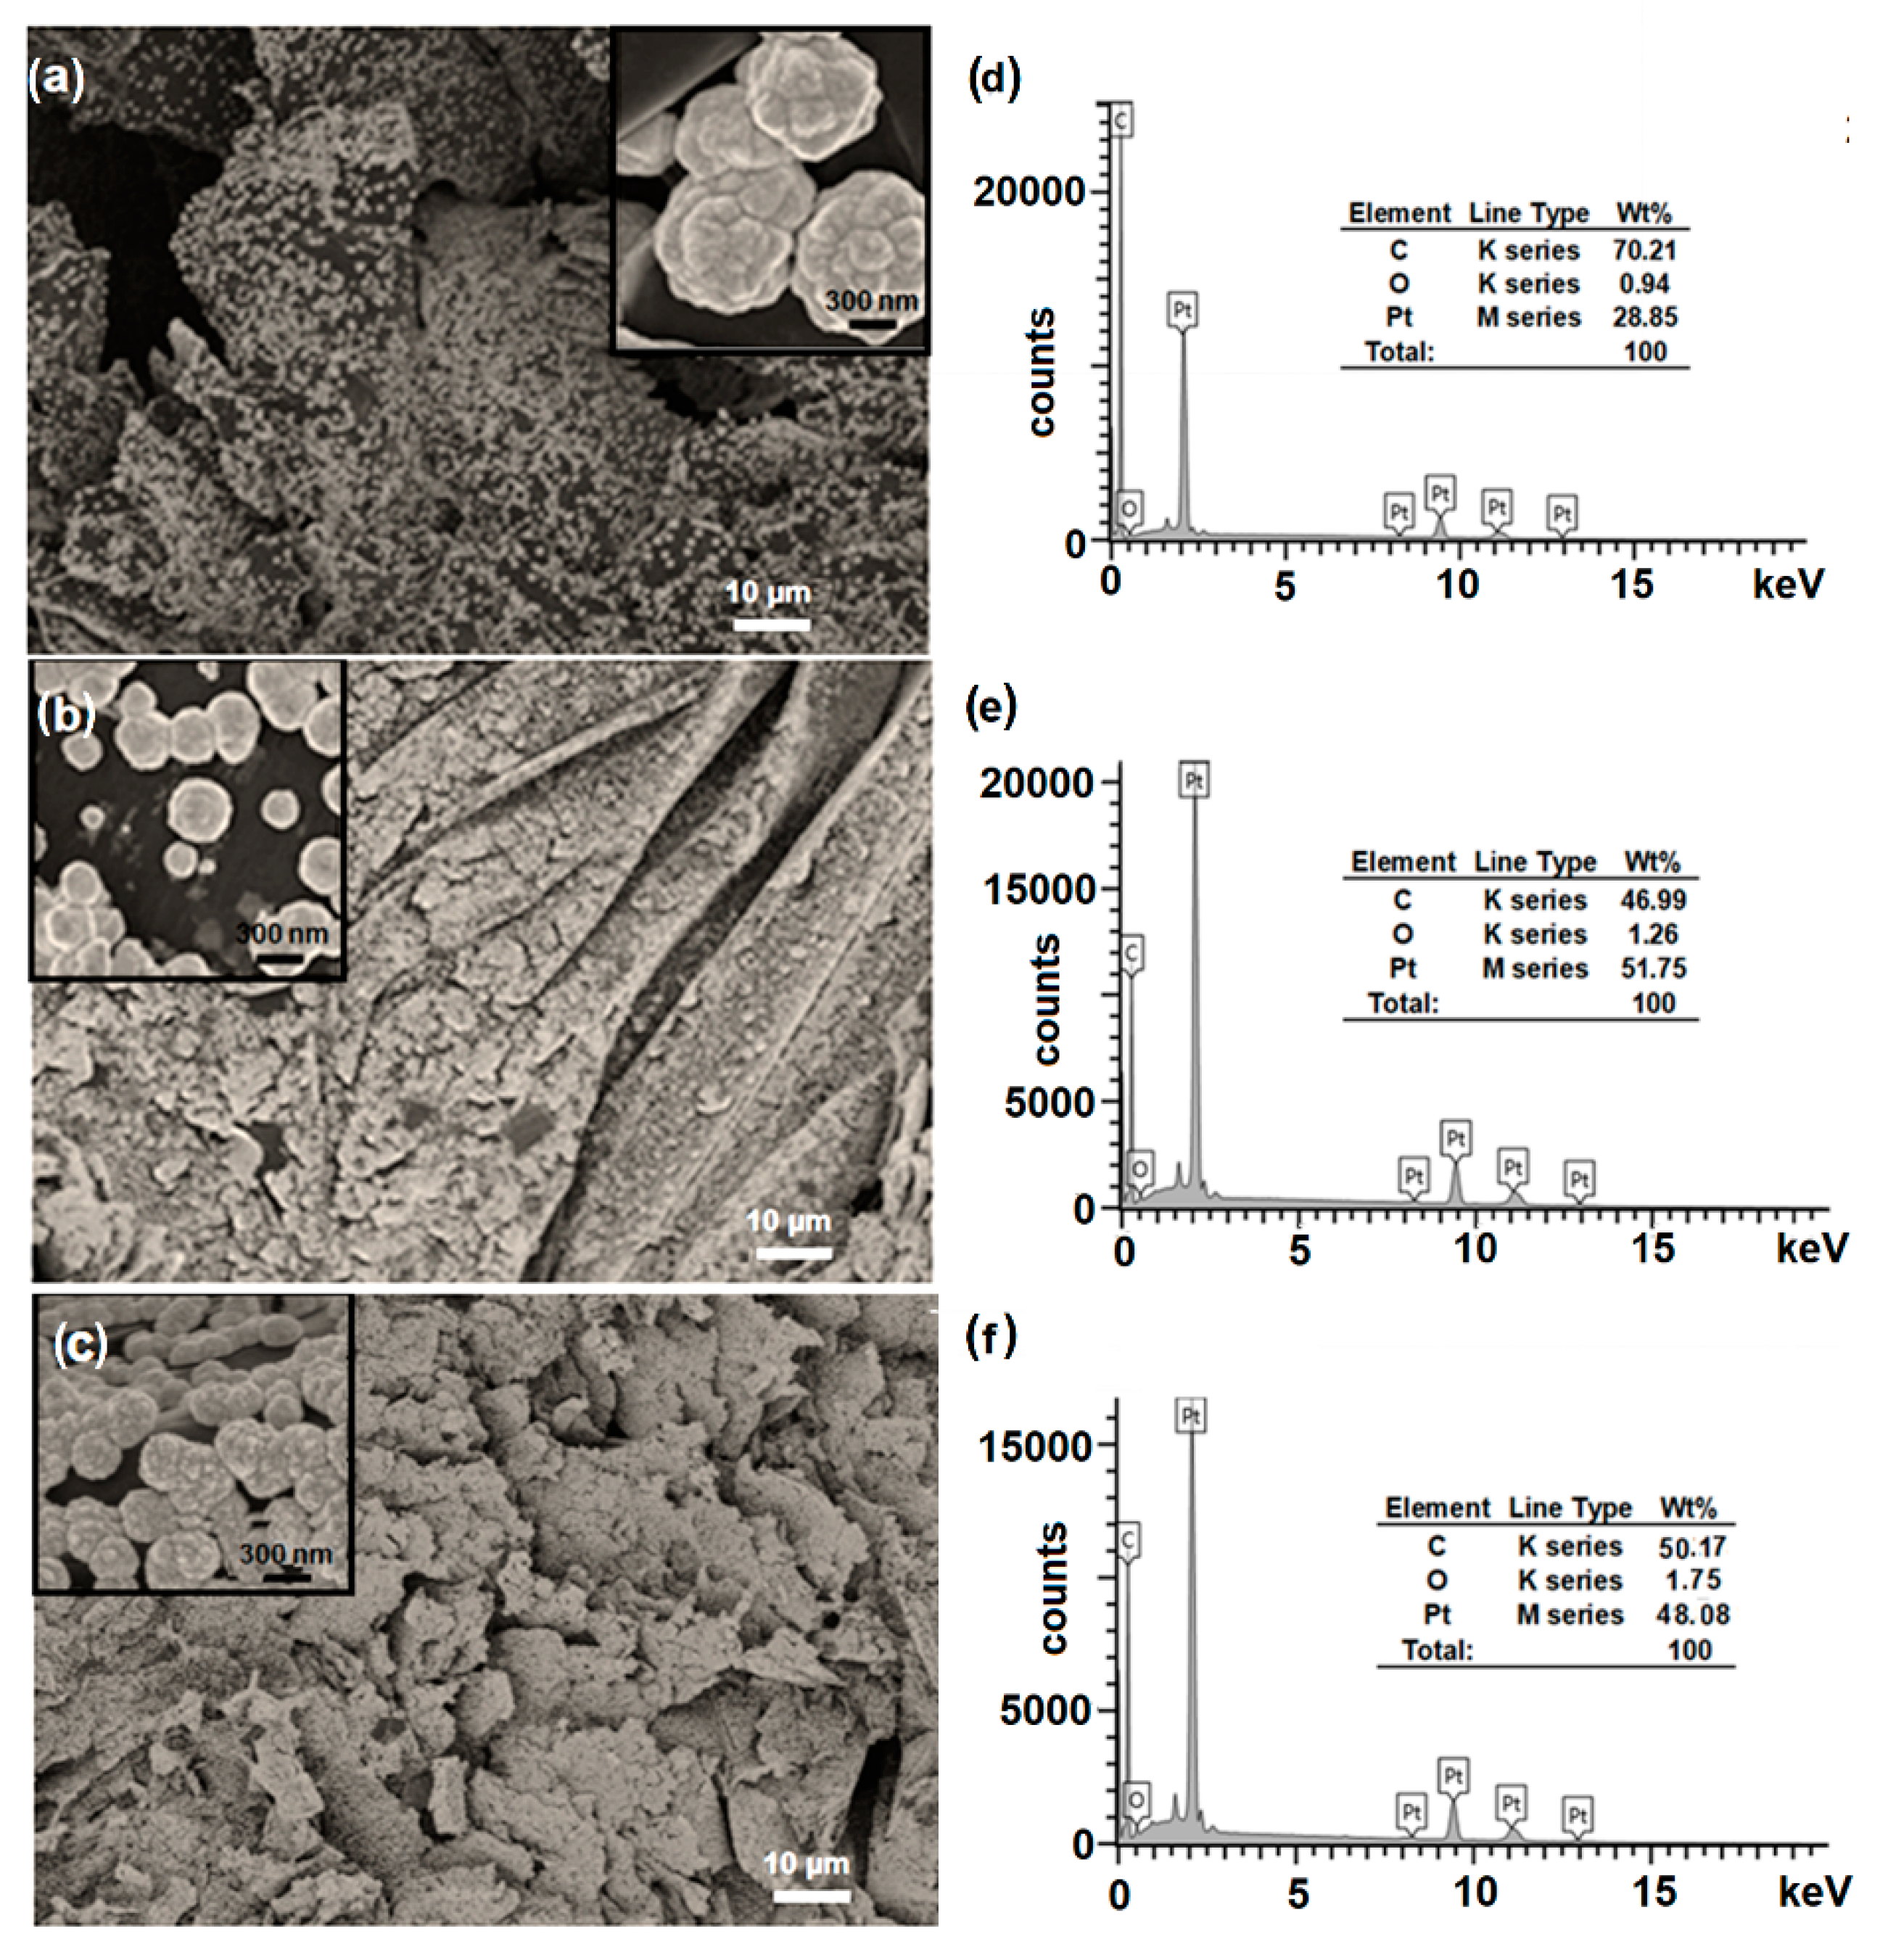
RGO synthesis was carried out in a gently stirred 3 g L−1 GO and 0.1 M LiClO4 aqueous suspension at a scan rate of 20 mV s−1. The evolution of the voltammograms during the synthesis is shown in Figure 1. As can be seen, from the 15th cycle, an overlap was observed for the rest of the cycles. The large wave attributed to the irreversible reduction of oxygenated groups present in the GO structure [26], evolved from −0.86 V (1st cycle) to −0.75 V (20th cycle), and this indicated an increasingly electroactive surface. After the 20th cycle, the voltammograms no longer underwent significant changes. Given these results, 20 synthesis cycles were considered appropriate to modify effectively the GFE surface.
Figure 2a,b show the micrographs of GFE and GFE/RGO, respectively.
As can be seen in Figure 2a, the graphitized structures appeared clear and smooth, whereas, in Figure 2b, it was possible to distinguish the typical wrinkles of RGO sheets [27]. The evolution of morphologies and sizes of GO to electrochemical reduced GO (RGO) has been studied by SEM and XPS in previous works [22,28].

3.1.2. Pt Particle

A 5 mM H2Pt(Cl)6 solution containing 0.5 M H2SO4 was used in each assay. For the EIS platinum electrodeposition, a selected potential (Ei) was sinusoidally varied according to an amplitude (±ΔEac) and for each frequency (fi). To determine the amplitude (potential range), a previous cycle of Pt deposition on GFE and GFE/RGO was recorded at a 50 mV s−1 scan rate (see Figure 3a). From the voltammograms, the reduction of PtCl62− began at about 0.50 V. The reduction of PtCl62− at 0.20 V only involves Pt particles growing if the nuclei have been previously formed at much lower potentials (limiting nucleation potential at around −0.20 V) [29]. It was observed that the current associated with the nucleation of Pt was higher for the GFE/RGO electrode. The micrographs in Figure 3b,c also showed that the amount of nuclei was higher for GFE/RGO versus GFE.
These results indicated that RGO promoted Pt nuclei formation and enhanced the electrodeposition process. In the micrograph of Figure 3c, RGO sheets appeared like faint veils on the surface. There was also a tendency for Pt nanoparticles to agglomerate on RGO irregularities. Accordingly, three Ei potentials of 0.15, 0.20, and 0.25 V were tested for an amplitude of ΔEac = ± 0.35 V (±0.35 V was the maximum allowed by the equipment). The number of frequencies (fi) between 10 and 8 Hz was 500. Fewer frequencies were tried, but a very erratic response was obtained. The selection of frequency range was based on previous studies [22], in which it was concluded that the most electroactive RGO/Pt coatings were obtained for frequencies of 10 Hz ˃ 1 Hz ˃ 0.1 Hz. Higher frequencies (100 Hz) were also tested, but, in this case, a massively cracked coating with no good electroactivity was obtained [22]. In Figure 4a, the plots of impedance modulus |Z| versus frequency (Hz) during the Pt synthesis on GFE/RGO at potential ranges of 0.15 ± 0.35, 0.20 ± 0.35, and 0.25 ± 0.35 V are shown. A decrease in the impedance modulus |Z| down to 5 Ω was observed for the synthesis at Ei = 0.15 and 0.20 V instead of 13 Ω that was observed for the synthesis at Ei = 0.25 V. This result could be explained from the CVs in Figure 3a. For Ei = 0.15 and 0.20 V, the limit potentials were −0.20 and −0.15 V, respectively, whereas, for Ei = 0.15 V, the limit potential was higher (−0.10 V). So that, for the two first potentials, the Pt synthesis was more developed, more Pt particles were synthetized, and therefore, lower impedance modulus. From the 9 Hz frequency, the three electrodes showed the behavior of pure resistors, where the impedance was almost constant. This meant that the GFE/RGO substrate promoted low-resistance electron flow during synthesis at Ei ± 0.35 V potential ranges since the resistance values from 5 to 13 ohms were small, which means that the whole electrical resistance (ionic, charge transfer, the resistivity of the film, and contact resistance) presented low values. To observe the influence of RGO on EIS synthesis and to compare EIS versus traditional CV, two more GFE/Pt (Ei = 0.20 V) and GFE/RGOPt50 electrodes were prepared, respectively. To obtain GFE/RGOPt50, 50 synthesis cycles were selected to obtain an amount of Pt similar to that for GFE/RGOPt (Ei = 0.15 and 0.20 V) in accordance with the EDX and gravimetric analyses. Figure 4b reports the CVs recorded during electrochemical Pt deposition at 50 mV s−1 scan rate. A significant decrease in the nucleation peak current at −0.20 V (1st cycle) was observed. From about the 5th cycle, the current steadily increased in the potential range between 0.25 and −0.25 V, and this was associated with the continuous growth of Pt nanoparticles and the hydrogen adsorption/desorption processes characteristic of Pt, the latter at potentials of between 0 and −0.25 V.
The micrographs of EIS GFE/Pt (Ei = 0.20 V), GFERGO/Pt (Ei = 0.20 V), and GFE/RGOPt50 are shown in Figure 5a–c, respectively. A good dispersion of Pt particles was observed in all cases. The size of the spherical Pt particles on GFE/Pt (Ei = 0.20 V) surface was about three times larger than for GFERGO/Pt (Ei = 0.20 V). A greater number of Pt particles (size about 300 nm) on the GFERGO/Pt (Ei = 0.20 V) surface was also observed. This last result was important because the surface catalytic activity increases when the Pt particle size decreases [30]. The EDX analyses showed an increase of about 23% in the Pt content for GFE/RGOPt (Ei = 0.20 V) vs. GFE/Pt (Ei = 0.20 V). Nevertheless, Pt mass was estimated at 0.00116 g for GFE/Pt (Ei = 0.20 V) and 0.00120 g for GFE/RGOPt (Ei = 0.20 V) and 0.00141 g for GFE/RGOPt50. Moreover, when the Ei potential increased, a noticeable decrease of Pt mass was observed; for instance, Pt mass for GFERGO/Pt (Ei = 0.25 V) was 0.00015 g. These results indicated that the presence of RGO mainly conditioned how nuclei formation and growth of Pt particles occurred during synthesis rather than the amount of Pt synthetized and thereby the different electrochemical behavior of the electrodes. From the micrograph and EDX analysis for GFE/RGOPt50 (Figure 5c,f), it could be concluded that the Pt mass and Pt particle size were similar to those for GFE/RGOPt (Ei = 0.20 V), which was consistent with the presence of RGO.

3.2. Electrochemical Characterization
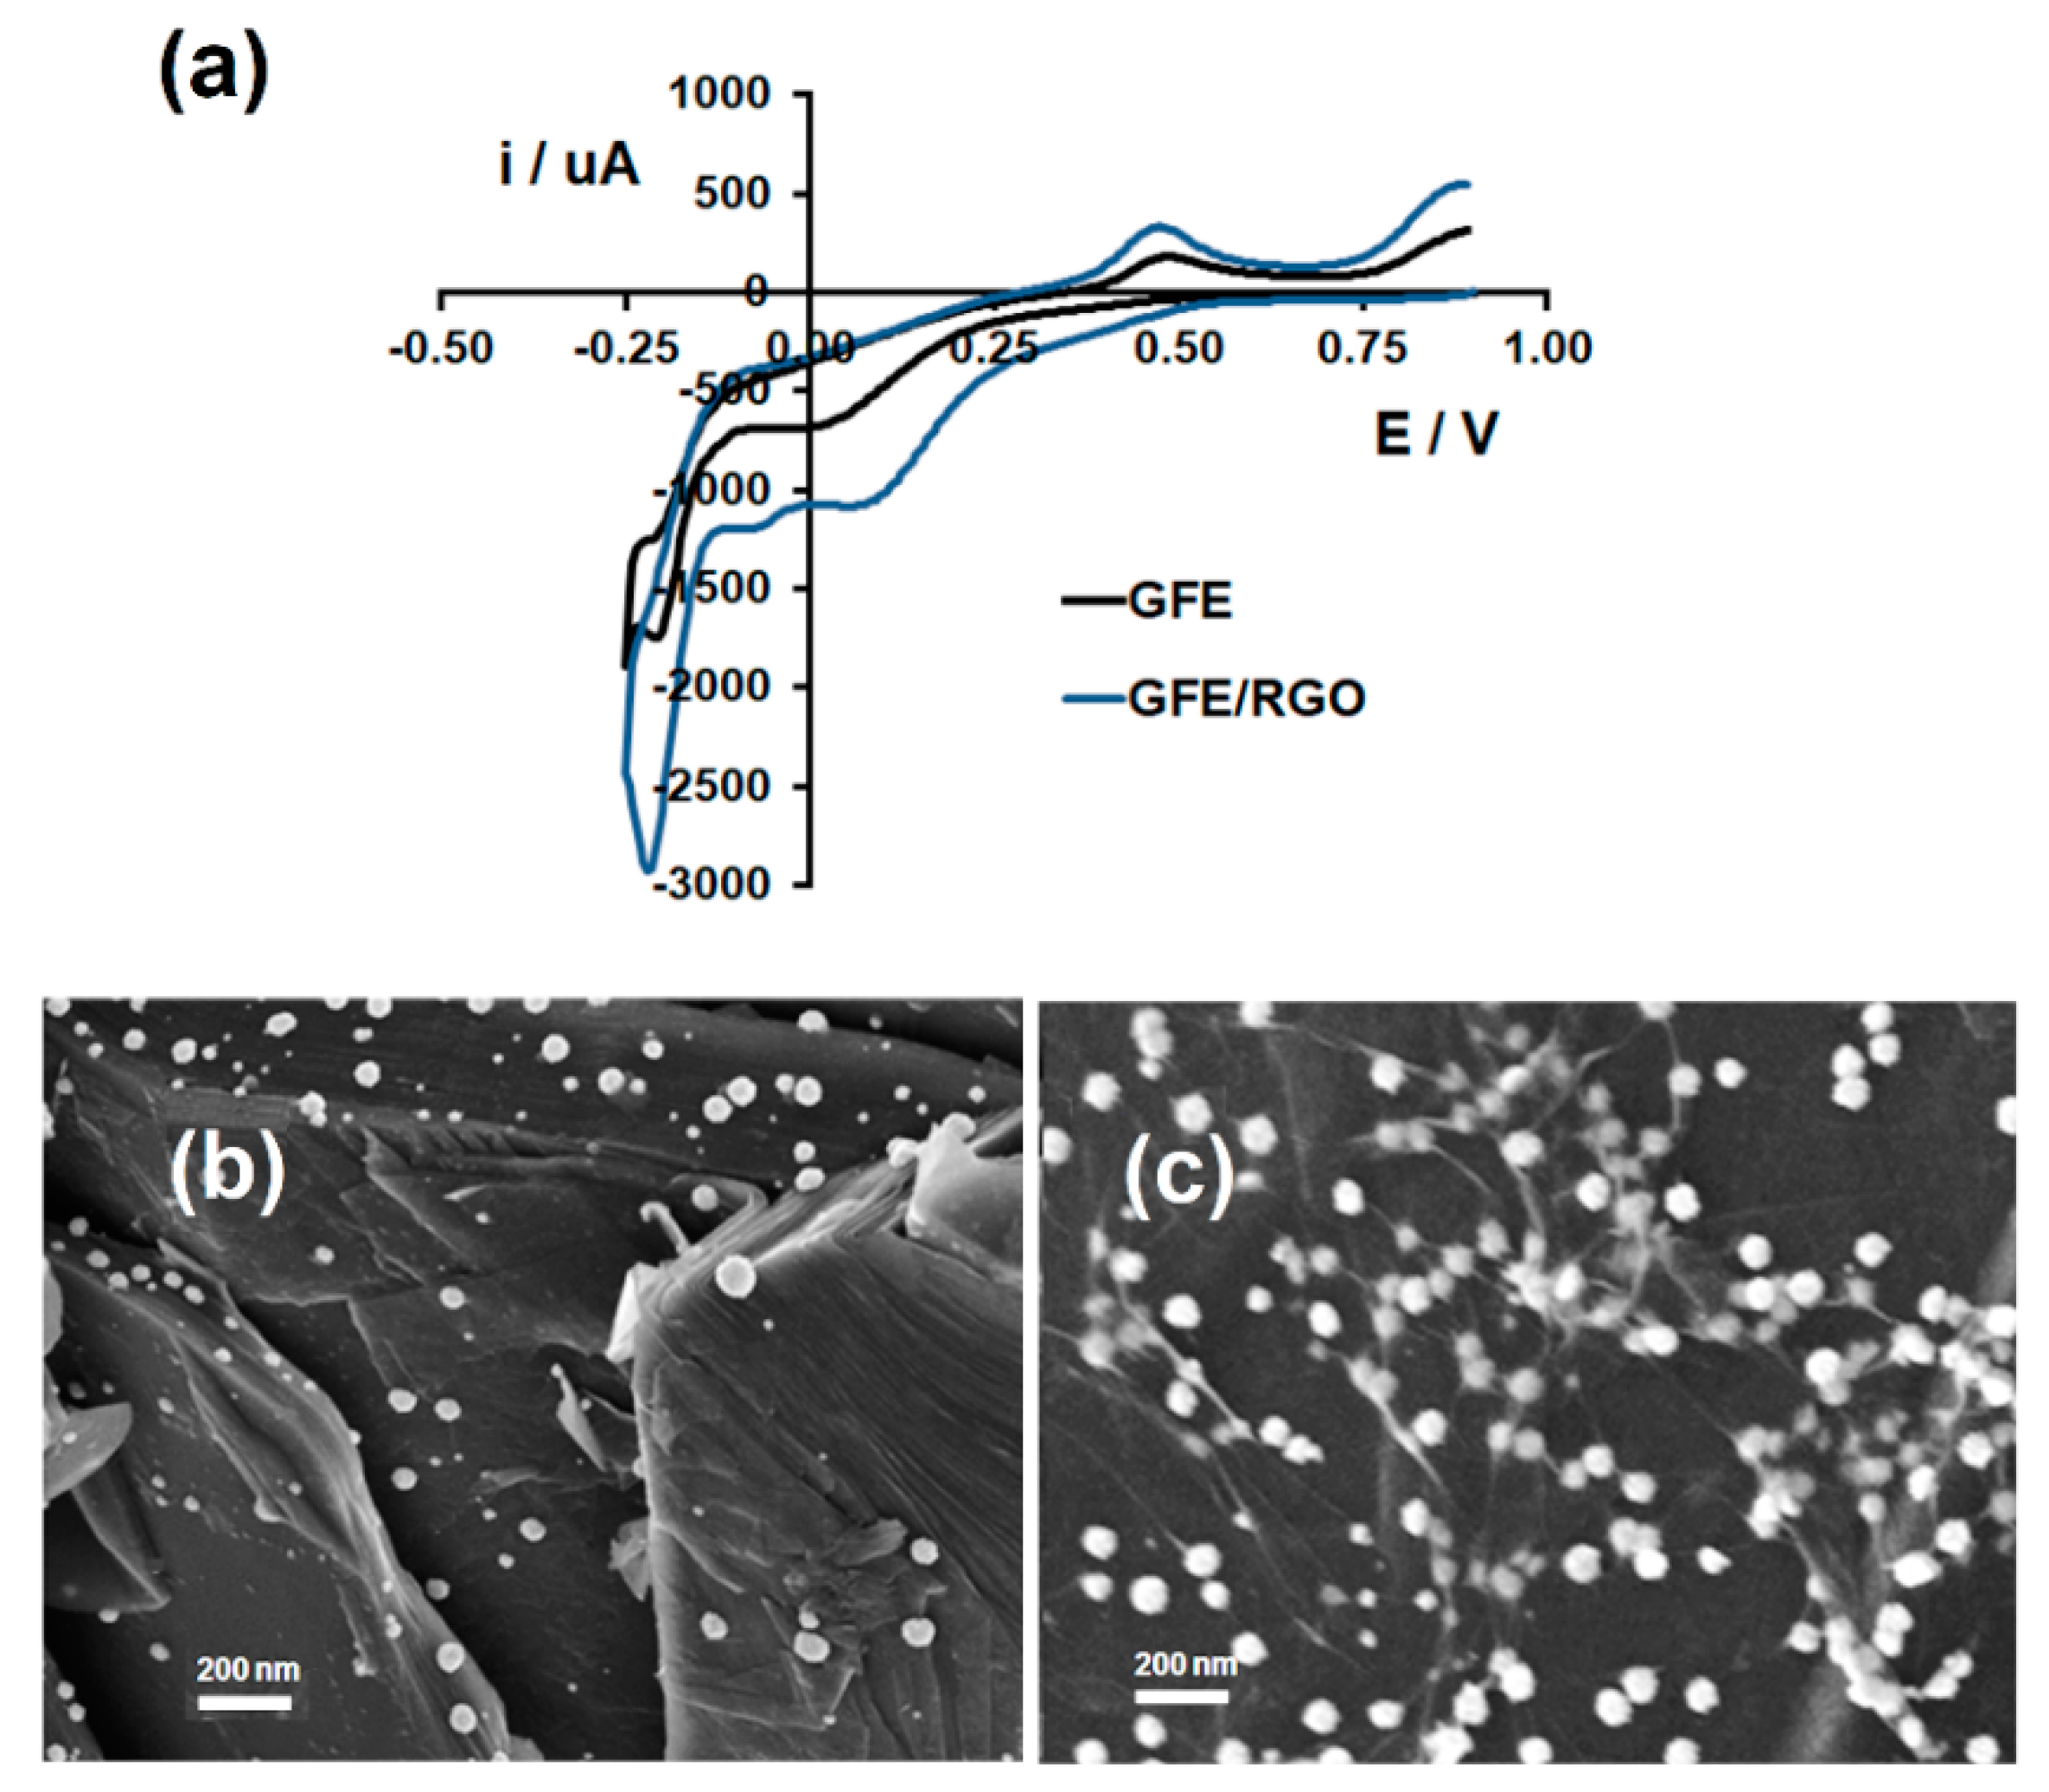
3.2.1. GFE/RGO

Figure 6a,b show cyclic voltammograms for GFE and GFE/RGO at different scan rates in 5 mM K3Fe(CN)6 containing 0.1 M KCl solution. The parameters obtained after the analyses of the voltammograms are summarized in Figure 7a–d.
The results for both GFE and GFE/RGO indicated that the anodic and cathodic peak current intensities increased with the square root of v. The greater slope for GFE/RGO in the equations from the linear regression analysis together with an Ipa/Ipc ~ 1 from scan rates higher than 50 mV s−1 meant that there was an increase in the apparent diffusivity of ferricyanide/ferrocyanide ions when compared to unmodified GFE. Moreover, anodic and cathodic peak potential separation (ΔEp) increased with v for GFE and GFE/RGO (which was in accordance with a quasi-reversible system). The values of the electron transfer rate constant, k0 (cm s−1), were obtained from the ∆Ep values following Nicholson’s method (that relates the value of ∆Ep with the kinetic parameter Ψ by means of a working curve for a quasi-reversible system) [31], where Ψ is
Ψ = k0(DO/DR)α/2/(πDOFv/RT)0.5
the dimensionless kinetic parameter, α is the transfer coefficient (α = 0.5), n is the number of electrons transferred (n = 1), v is the scan rate (V s−1), DO and DR are the diffusion coefficients of Fe(CN)63− (7.17 × 10⁻⁶ cm2 s−1) and Fe(CN)64− (6.56 × 10⁻⁶ cm2 s−1), F is Faraday’s constant (96487 C mol−1), R (8.314 J K−1 mol−1) is the gas constant, and T (298 K) is the temperature. As could be observed, the k0 values for GFE/RGO remained above those for GFE in the range of v. This result was indicative of a higher electron transfer between the electroactive species (Fe(CN)63−/Fe(CN)64−) in solution and the surface of GFE/RGO. Given these results, it could be concluded that the presence of RGO improved the electroactivity of the graphitized foam.

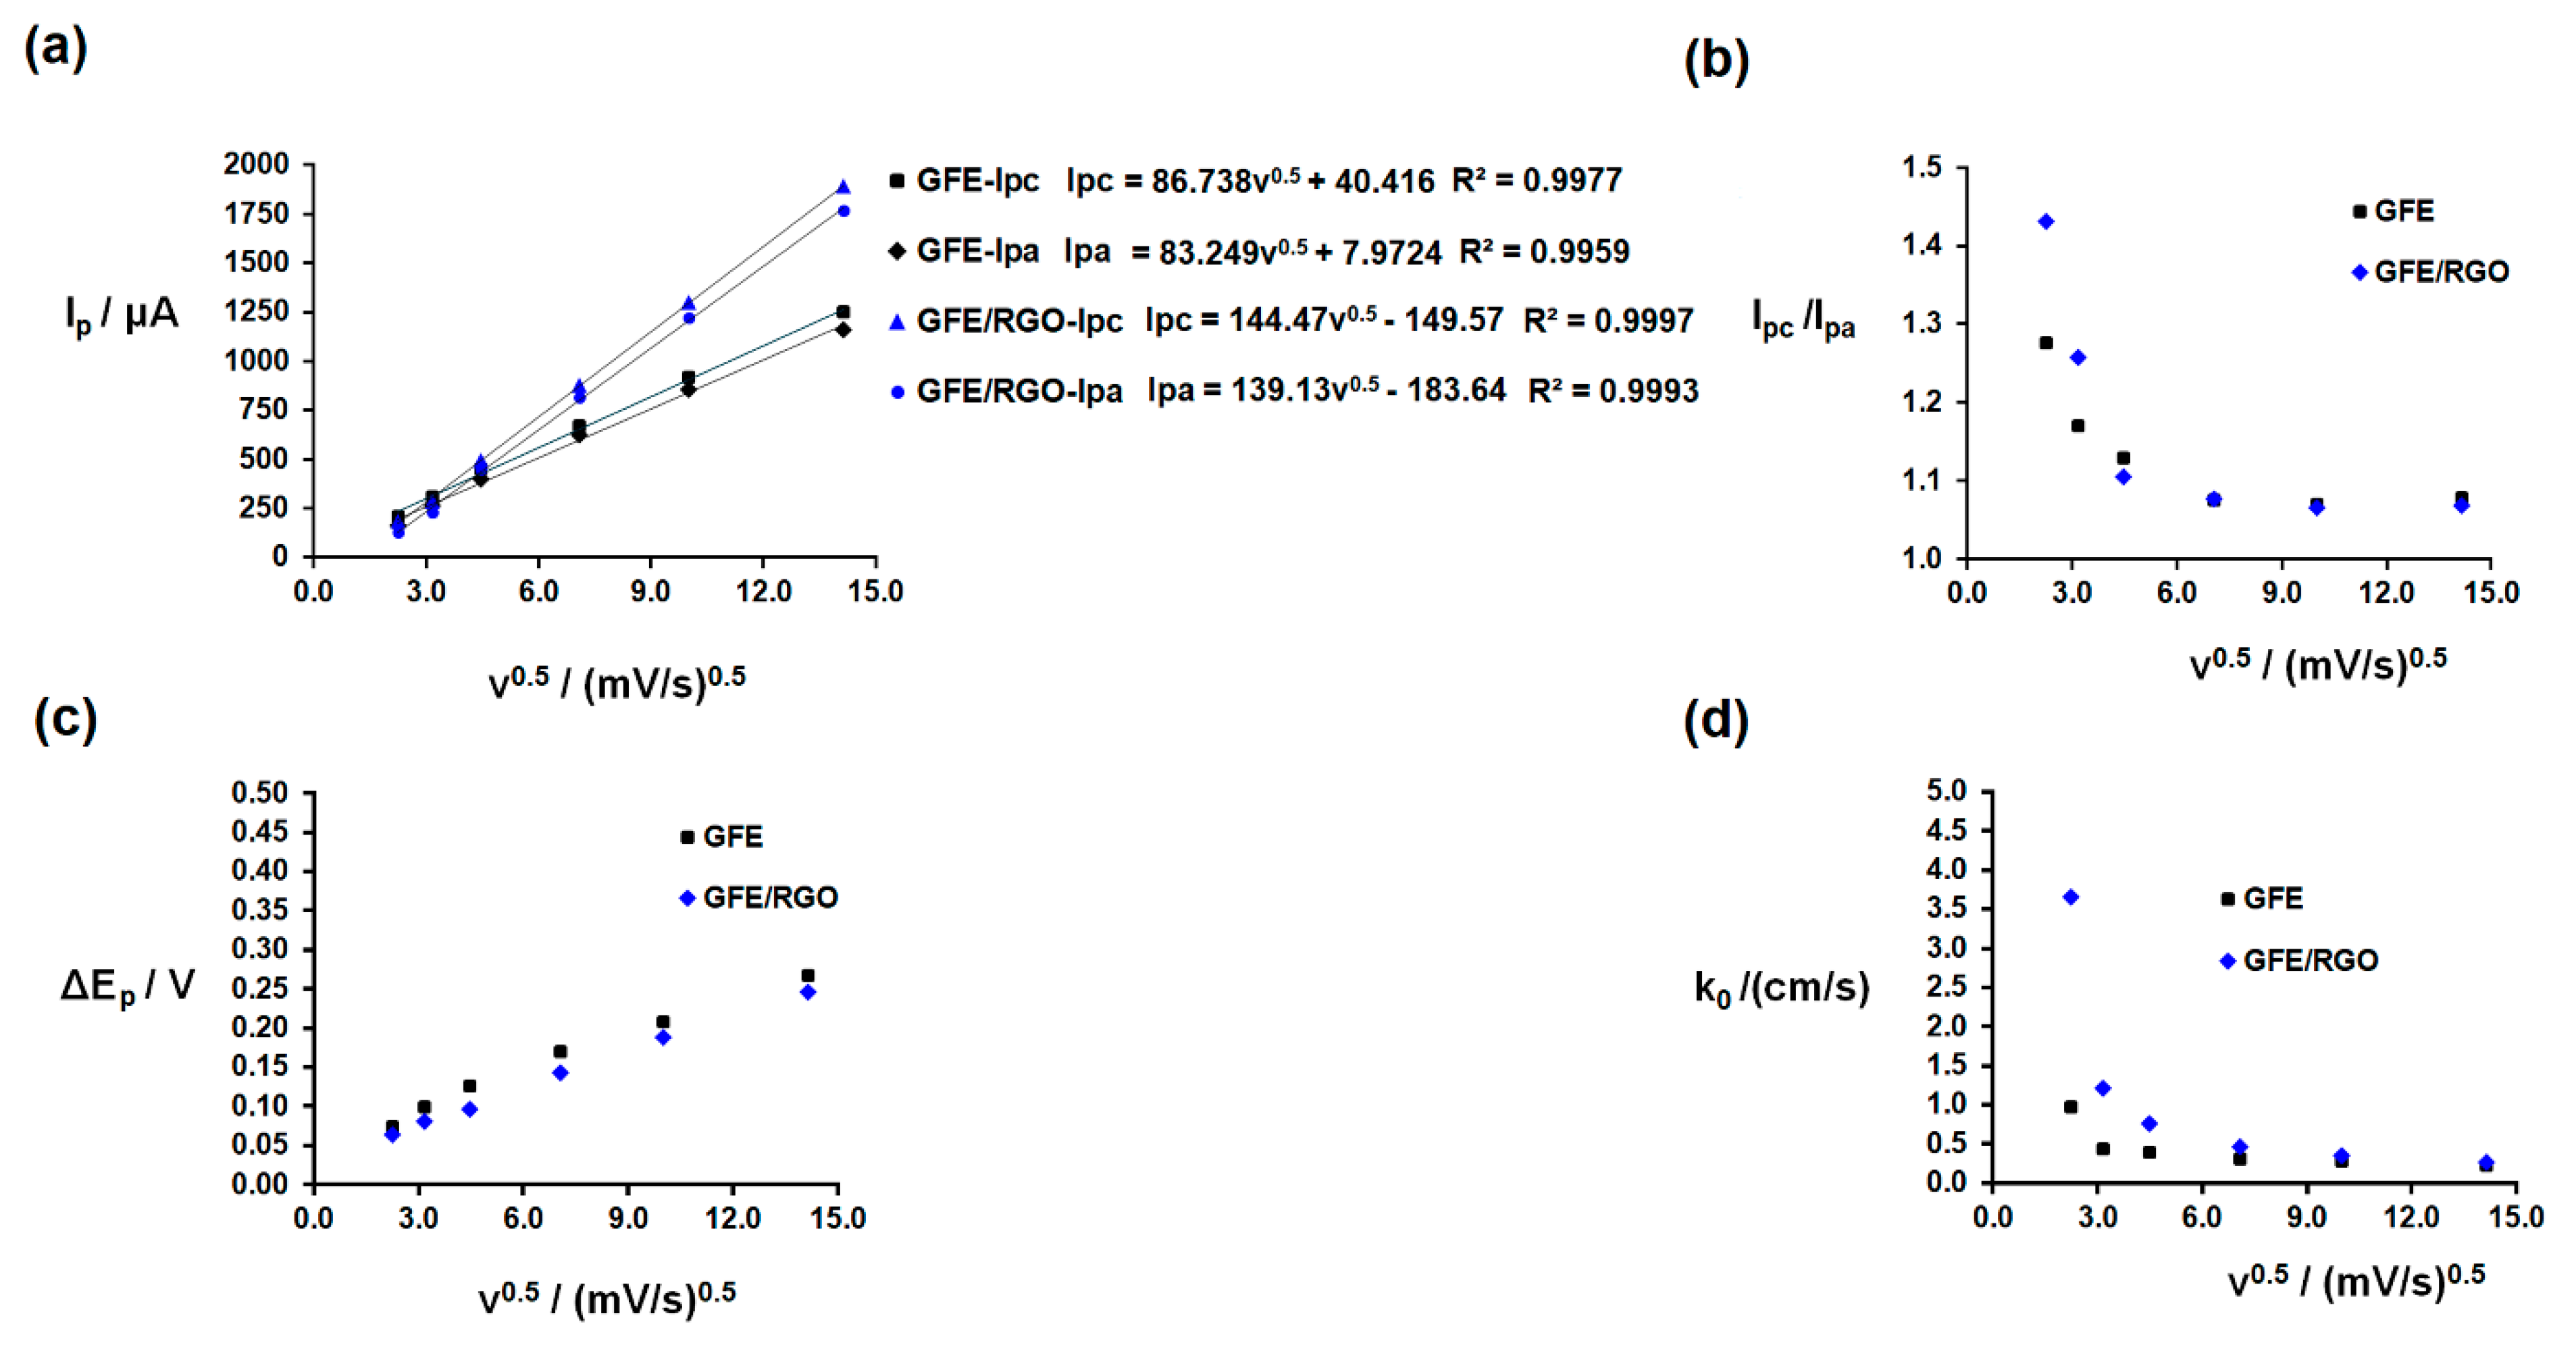
3.2.2. Pt-Modified Electrodes

The electroactivity of Pt-modified electrodes was examined by CV in a 0.5 M H2SO4 solution at 50 mV s−1. In Figure 8a, the voltammograms for GFE/RGOPt (EIS) and GFE/RGOPt50 are shown.
From the hydrogen adsorption/desorption zone, it could be concluded that the electroactivity of GFE/RGOPt (EIS) synthesized at Ei = 0.15 and 0.20 V was similar but higher than that for the Ei = 0.25 V electrode. These electrodes also presented a higher electroactivity than for GFE/RGOPt50, which was remarkable, taking into account that 50 cycles of synthesis at 50 mV s−1 took 1400 s vs. 56 s for EIS synthesis. It could be concluded that the EIS method minimized the synthesis time and enabled the preparation of metal-hybrid electrodes with high electroactivity. To compare the electrochemical behavior of two EIS electrodes—with and without RGO—GFE/RGOPt (Ei = 0.20 V) and GFE/Pt (Ei = 0.20 V) were characterized in 0.5 M H2SO4 solution. The characteristic peak associated with the reduction of platinum oxides at about 0.60 V and the characteristic processes attributed, among others, to the adsorption/desorption of hydrogen ions and the beginning of hydrogen evolution were clearly visible in the voltammograms of Figure 8b. The overall charge associated with the voltammetric profile of GFE/RGOPt was higher than that obtained with GFE/Pt, which was the expected result in accordance with the previous results (see Figure 3 and Figure 5).

3.3. Physical Characterization

To know the influence of electrochemical coatings on the physical properties of graphitized foam, measurements of permeability, pressure drop, and nitrogen adsorption isotherms were performed.

3.3.1. Nitrogen Adsorption Isotherms

Figure 9 shows the nitrogen adsorption isotherms of the different samples. Following the International Union of Pure and Applied Chemistry (IUPAC) classification, the isotherms had sufficient characteristics to be classified as type II.
Type II isotherms presented the normal form obtained with a non-porous or macroporous adsorbent and represented unrestricted monolayer-multilayer adsorption. It was easily seen that isotherms had a very small contribution of micropores (adsorption corresponding to very low relative pressures) and a limited contribution of mesopores. As a result, hysteresis, which is common in mesoporous solids, was very reduced. The specific surface areas were representative of the changes caused by electrochemical treatments. Thus, the RGO coating raised the specific area of GFE/RGO by about twice as much. Moreover, it was a non-continuous coating that produced coverage irregularities, resulting in increased micro and mesoporosity over untreated foam porosity (see Table 1). GFE/RGOPt (Ei = 0.20 V) showed a decrease in the specific surface area compared with the GFE/RGO. It was previously observed in Section 3.2 that the growth of Pt particles was favored in areas with irregularities in the RGO coating (see Figure 3b,c), likely contributing to the blockage of access to certain porosity (Table 1 displays a lower micro and mesoporosity in the GFE/RGOPt (Ei = 0.20 V) with respect to the GFE/RGO).

3.3.2. Permeability and Pressure Drop Measurements

From Figure 10, identical permeability values (taking into account the error associated with the measurement) were found for the three materials analyzed, GFE = 5.3 × 10⁻¹² m2, GFE/RGO = 5.8 × 10⁻¹² m2, and GFE/RGOPt (Ei = 0.20 V) = 5.3 × 10⁻¹² m2. The estimated error in permeability measurements was ±0.5 × 10⁻¹² m2.
This result indicated that the three samples showed the same 3D pore structure responsible for their fluid dynamic behavior. This indicated that the electrochemical coatings of RGO or RGO/Pt did not significantly alter the size of the interconnection windows between pores.

4. Conclusions

A pitch-derived open-pore graphite foam (GF) was successfully modified using electrochemically synthetized RGO and Pt particles. The alternating current method for Pt particle synthesis, in which a sinusoidal potential was applied, enabled more highly electroactive coatings to be obtained in less synthesis time than the traditional CV. It was shown that RGO improved the electron transfer rate constant of GF, and RGO coating raised the specific area. With regard to Pt particles’ synthesis, RGO conditioned the nuclei formation and growth of Pt during the synthesis, more than the total mass of Pt synthesized, which depended on synthesis time and/or applied potential range. In this respect, the size of Pt particles was minimized, and a more homogeneous distribution of Pt particles was achieved with GFE/RGO.

Author Contributions

Conceptualization, F.C.; Methodology, J.F. and F.C.; Validation, J.F., J.B., J.M.M., and F.C.; Formal Analysis, J.F.; Investigation, J.F., J.B., J.M.M., and F.C.; Resources, F.C.; Data Curation, J.F., J.B., J.M.M., and F.C.; Writing-Original Draft Preparation, J.F.; Writing-Review & Editing, J.F., J.B., J.M.M., and F.C.; Visualization, J.F.; Supervision, F.C.; Project Administration, F.C.; Funding Acquisition, F.C. All authors have read and agreed to the published version of the manuscript.

Funding

This research was funded by the Spanish Agencia Estatal de Investigación (AEI) and the European Union (FEDER funds) contracts (MAT2016-77742-C2-1-P, MAT2016-77742-C2-2-P).

Acknowledgments

Financial support of Network E3TECH (CTQ2017-90659-REDT) is acknowledged.

Conflicts of Interest

The authors declare no conflict of interest and that the funders had no role in the design of the study; in the collection, analyses, or interpretation of data; in the writing of the manuscript, or in the decision to publish the results.

References

  1. Prieto, R.; Louis, E.; Molina, J.M. Fabrication of mesophase pitch-derived open-pore carbon foams by replication processing. Carbon 2012, 50, 1904–1912. [Google Scholar] [CrossRef]
  2. Molina, J.M. Mesophase pitch-derived graphite foams with selective distribution of TiC submicron particles for catalytic applications. Carbon 2016, 103, 5–8. [Google Scholar] [CrossRef] [Green Version]
  3. Lai, J.; Nsabimana, A.; Luque, R.; Xu, G. 3D Porous carbonaceous electrodes for electrocatalytic applications. Joule 2018, 2, 76–93. [Google Scholar] [CrossRef] [Green Version]
  4. Morozov, S.V.; Novoselov, K.S.; Katsnelson, M.I.; Schedin, F.; Elias, D.C.; Jaszczak, J.A.; Geim, A.K. Giant intrinsic carrier mobilities in graphene and its bilayer. Phys. Rev. Lett. 2008, 100, 016602. [Google Scholar] [CrossRef] [Green Version]
  5. Singh, V.; Joung, D.; Zhai, L.; Das, S.; Khondaker, S.I.; Seal, S. Graphene based materials: Past present and future. Prog. Mater. Sci. 2011, 56, 1178–1271. [Google Scholar] [CrossRef]
  6. Shinde, D.B.; Vishal, V.M.; Kurungot, S.; Pillai, V.K. Electrochemical preparation of nitrogen-doped graphene quantum dots and their size-dependent electrocatalytic activity for oxygen reduction. Bull. Mater. Sci. 2015, 38, 435–442. [Google Scholar] [CrossRef] [Green Version]
  7. Mitra, S.; Banerjee, S.; Datta, A.; Chakravorty, D. A brief review on graphene/inorganic nanostructure composites: Materials for the future. Indian J. Phys. 2016, 90, 1019–1032. [Google Scholar] [CrossRef]
  8. Kauppila, J.; Kunnas, P.; Damlin, P.; Viinikanoja, A.; Kvarnström, C. Electrochemical reduction of graphene oxide films in aqueous and organic solutions. Electrochim. Acta 2013, 89, 84–89. [Google Scholar] [CrossRef]
  9. Chen, L.; Tang, Y.; Wang, K.; Liu, C.; Luo, S. Direct electrodeposition of reduced graphene oxide on glassy carbon electrode and its electrochemical application. Electrochem. Commun. 2011, 13, 133–137. [Google Scholar] [CrossRef]
  10. Hilder, M.; Winther-Jensen, B.; Li, D.; Forsyth, M.; MacFarlane, D.R. Direct electro-deposition of graphene from aqueous suspensions. Phys. Chem. Chem. Phys. 2011, 13, 9187–9193. [Google Scholar] [CrossRef]
  11. Zhou, M.; Wang, Y.; Zhai, Y.; Zhai, J.; Ren, W.; Wang, F.; Dong, S. Controlled synthesis of large-area and patterned electrochemically reduced graphene oxide film. Chem. Eur. J. 2009, 15, 6116–6120. [Google Scholar] [CrossRef] [PubMed]
  12. Bonanni, A.; Pumera, M. Electroactivity of graphene oxide on different substrates. R. Soc. Chem. Adv. 2012, 2, 10575–10578. [Google Scholar] [CrossRef]
  13. Zhong, M.; Song, Y.; Li, Y.; Ma, C.; Zhai, X.; Shi, J.; Guo, Q.; Liu, L. Effect of reduced graphene oxide on the properties of an activated carbon cloth/polyaniline flexible electrode for supercapacitors application. J. Power Sources 2012, 217, 6–12. [Google Scholar] [CrossRef]
  14. Yoo, E.; Okata, T.; Akita, T.; Kohyama, M.; Nakamura, J.; Honna, I. Enhanced electrocatalytic activity of Pt subnanoclusters on graphene nanosheet surface. Nano Lett. 2009, 9, 2255–2259. [Google Scholar] [CrossRef]
  15. Kundu, P.; Nethravathi, C.; Deshpande, P.A.; Rajamathi, M.; Madras, G.; Ravishankar, N. Ultrafast microwave-assisted route to surfactant-free ultrafine Pt nanoparticles on graphene: Synergistic co-reduction mechanism and high catalytic activity. Chem. Mater. 2011, 23, 2772–2780. [Google Scholar] [CrossRef]
  16. Xin, Y.; Liu, J.; Zhou, Y.; Liu, W.; Gao, J.; Xie, Y.; Yin, Y.; Zou, Z. Preparation and characterization of Pt supported on graphene with enhanced electrocatalytic activity in fuel cell. J. Power Sources 2011, 196, 1012–1018. [Google Scholar] [CrossRef]
  17. Zhang, Y.; Liu, C.; Min, Y.; Qi, X.; Ben, X. The simple preparation of graphene/Pt nanoparticles composites and their electrochemical performance. J. Mater. Sci. Mater. Electron. 2013, 24, 3244–3248. [Google Scholar] [CrossRef]
  18. Er, E.; Çelikkan, H.; Erk, N. A novel electrochemical nano-platform based on graphene/platinum nanoparticles/nafion composites for the electrochemical sensing of metoprolol. Sens. Actuator B Chem. 2017, 238, 779–787. [Google Scholar] [CrossRef]
  19. Ding, Y.Y.; Zheng, H.Y.; Cheng, J.J.; Xu, H.; Sun, M.X.; Yan, G. Platinum supported on reduced graphene oxide as a catalyst for the electrochemical hydrogenation of soybean oils. Solid State Sci. 2019, 92, 46–52. [Google Scholar] [CrossRef]
  20. Ghanim, A.H.; Koonce, J.G.; Hasa, B.; Rassoolkhani, A.M.; Cheng, W.; Peate, D.W.; Lee, J.; Mubeen, S. Low-loading of Pt nanoparticles on 3D carbon foam support for highly active and stable hydrogen production. Front. Chem. 2018, 6, 523. [Google Scholar] [CrossRef] [Green Version]
  21. Lupu, S.; Lakard, B.; Hihn, J.-Y.; Dejeu, J. Novel in situ electrochemical deposition of platinum nanoparticles by sinusoïdal voltages on conducting polymer films. Synth. Met. 2012, 162, 193–198. [Google Scholar] [CrossRef] [Green Version]
  22. Molina, J.; Fernandez, J.; del Río, A.I.; Bonastre, J.; Cases, F. Synthesis of Pt particles on electrochemically reduced graphene oxide by potentiostatic and alternate current methods. Mater. Charact. 2014, 89, 56–68. [Google Scholar] [CrossRef]
  23. Products: Chemically Modified Graphene Oxide. Available online: https://www.nanoinnova.com/product/chemically-modified-go (accessed on 5 June 2020).
  24. Maiorano, L.P.; Molina, J.M. Challenging thermal management by incorporation of graphite into aluminium foams. Mater. Des. 2018, 158, 160–171. [Google Scholar] [CrossRef]
  25. Brunauer, E.T.S.; Deming, L.S.; Deming, W.E. On a theory of the van der Waals adsorption of gases. J. Am. Ceram. Soc. 1940, 62, 1723–1732. [Google Scholar] [CrossRef]
  26. Chen, K.; Chen, L.; Chen, Y.; Bai, H.; Li, L. Three-dimensional porous graphene-based composite materials: Electrochemical synthesis and application. J. Mater. Chem. 2012, 22, 20968–20976. [Google Scholar] [CrossRef]
  27. Stankovich, S.; Dikin, D.A.; Dommett, G.H.B.; Kohlhaas, K.M.; Zimney, E.J.; Stach, E.A.; Piner, R.D.; Nguyen, S.T.; Ruoff, R.S. Graphene based composite materials. Nature 2006, 442, 282–286. [Google Scholar] [CrossRef]
  28. Molina, J.; Fernandez, J.; del Río, A.I.; Bonastre, J.; Cases, F. Electrochemical characterization of reduced graphene oxide-coated polyester fabrics. Electrochim. Acta 2013, 93, 44–52. [Google Scholar] [CrossRef]
  29. Li, Y.; Jiang, Y.; Chem, M.; Liao, H.; Huang, R.; Zhou, Z.; Tian, N.; Chen, S.; Sun, S. (Supporting information for) Electrochemically shape-controlled synthesis of trapezohedral platinum nanocrystals with high electrocatalytic activity. Chem. Commun. 2012, 48, 9531–9533. [Google Scholar] [CrossRef]
  30. Domínguez, S.; Arias, J.; Berenguer, A.; Morallón, E.; Cazorla, D. Electrochemical deposition of platinum submicron particles on different carbon supports and conducting polymers. J. Appl. Electrochem. 2008, 38, 259–268. [Google Scholar] [CrossRef] [Green Version]
  31. Faulkner, L.R.; Bard, A.J. Electrochemical Methods: Fundamentals and Applications, 2nd ed.; Wiley: New York, NY, USA, 1980; p. 864. [Google Scholar]
Figure 1. Cyclic voltammograms recorded during the reduced graphene oxide (RGO) synthesis on graphite foam electrode (GFE) in a 3 g L−1 graphene oxide (GO) and 0.1 M LiClO4 aqueous suspension at a scan rate of 20 mV s−1.
Coatings 10 00551 g001
Figure 2. Micrographs of the surface for (a) GFE and (b) GFE/RGO at magnification Mag = 500 X.
Coatings 10 00551 g002
Figure 3. (a) Cyclic voltammograms of the 1st cycle of the synthesis on GFE and GFE/RGO in 5 mM H2PtCl6 and 0.5 M H2SO4 at 50 mV s−1. Micrographs of the resultant surface for (b) GFE/Pt1 and (c) GFE/RGOPt1, respectively, at magnification Mag = 20.00 K X.
Coatings 10 00551 g003
Figure 4. (a) Bode plot during the Pt electrochemical impedance spectroscopy (EIS) synthesis on GFE/RGO at sinusoidal potentials of 0.15, 0.20, 0.25 ± 0.35 V in a frequency range of 10–8Hz for 500 frequencies. Arrows indicate the beginning of the syntheses, (b) Cyclic voltammograms during the Pt synthesis on GFE/RGO at a scan rate of 50 mV s−1. The syntheses were carried out in 5 mM H2PtCl6 and 0.5 M H2SO4 solution.
Coatings 10 00551 g004
Figure 5. (ac) Micrographs of GFE/Pt (Ei = 0.20 V), GFE/RGOPt (Ei = 0.20 V), and GFE/RGOPt50 at magnifications Mag = 500×. Insets: The same but at Mag. = 20.00 K X. (df) EDX analyses of GFE/Pt (Ei = 0.20 V), GFE/RGOPt (Ei = 0.20 V), and GFE/RGOPt50, respectively. For EDX, a 500 × 500 µm surface was scanned.
Coatings 10 00551 g005
Figure 6. Cyclic voltammograms of (a) GFE and (b) GFE/RGO in 5 mM K3Fe(CN)6 and 0.1 M KCl solutions.
Coatings 10 00551 g006
Figure 7. Parameters from the cyclic voltammograms of GFE and GFE/RGO in 5 mM K3Fe(CN)6 containing 0.1 M KCl at different scan rates v (mV s−1). (a,b) Ip (µA) and (c) ΔEp (mV) are the peak current intensity and the potential difference between peak potentials. The subscripts “a” and “c” stand for anodic and cathodic, respectively. (d) k0 is the electron transfer rate constant (cm s−1).
Coatings 10 00551 g007
Figure 8. (a) Cyclic voltammograms for the characterization of Pt-modified electrodes. (b) Cyclic voltammograms for the comparison between GFE/Pt (Ei = 0.20 V) and GFE/RGOPt (Ei = 0.20 V). All the voltammograms were recorded in 0.5 M H2SO4 at a scan rate of 50 mV s−1.
Coatings 10 00551 g008
Figure 9. Nitrogen adsorption isotherms (volume per mass unit versus relative pressure P/Po, where Po is the saturation pressure). Filled and empty symbols correspond to adsorption and desorption branches of each isotherm, respectively.
Coatings 10 00551 g009
Figure 10. The plot of the relative pressure drop vs. superficial velocity (mV s−1).
Coatings 10 00551 g010
Table 1. Properties of different graphite foam electrodes.
SamplesSpecific Surface Area
(m2 g−1)
Micropore Volume
(cm3 g−1)
Mesopore Volume
(cm3 g−1)
GFE3.0955.24 × 10−42.46 × 10⁻³
GFE/RGO6.0089.19 × 10−43.51 × 10⁻³
GFE/RGOPt4.4568.95 × 10−43.32 × 10⁻³
The total volume of the samples was estimated at 6.71 × 10⁻¹ (cm3 g−1); GFE, GFE/RGO and GFE/RGOPt stand for bare graphite foam electrode (GFE), reduced graphene oxide modified electrode (GFE/RGO) and RGO/platinum modified electrode (GFE/RGOPt), respectively.

