Abstract
Aluminum coatings applied to polymer films by physical vapor deposition should be defect-free for applications such as packaging and electronic devices. However, cracks can appear in the aluminum coating as the polymer film stretches, becoming manifest as an increase in resistance. We evaluated the effect of different aluminum thicknesses (10–85 nm), polymer films (polyethylene terephthalate or polypropylene), and corona doses (0–280 W∙min/m2) on the relative increase in resistance during stretching (strain = 0–100%). We found that the thickness of the aluminum coating was inversely related to the increase in resistance. Corona pretreatment led to an increase in surface energy (≤40 mN/m for polypropylene; ≤50 mN/m for polyethylene terephthalate) although high corona doses resulted in overtreatment, which limited the adhesion of aluminum to the substrate and led to a greater increase in resistance. Varying the coating thickness had a much greater effect than the corona pretreatment, suggesting that thicker aluminum coatings are more effective than corona pretreatment as a strategy to increase coating stability. The effect of aluminum thickness and strain on resistance was described using a fit function containing three fit factors.
1. Introduction
Polymer films coated with aluminum by physical vapor deposition (PVD) are used as packaging materials and in flexible and stretchable electronic devices. In packaging applications, the thin aluminum layer massively reduces the gas permeability through the polymer film, thus protecting the packaged product. In electronic devices, a coherent and defect-free layer is necessary for optimal electrical conductivity and signal processing. In both cases, the measurement of electrical resistance provides indirect information about the density of defects in the material.
Coating defects appear due to imperfect process conditions (e.g., dust particles present on the substrate falling from the surface after PVD coating, leaving pinholes behind), substrate roughness, scratches on the surface before or after coating, or the expansion of the substrate [1,2]. The expansion of polymers in roll-to-roll processes and final applications occurs due to web tension and web tension undulations [3,4]. In packaging applications, aluminum-coated polyethylene terephthalate (PET) films are crushed during transport and use, leading to defects caused by local bending and expansion of the aluminum coating [5].
Substrate roughness and aluminum thickness are major factors influencing the strain sensitivity of aluminum coatings, thus determining the crack density [6,7,8]. The extent of defects caused by strain can be evaluated by measuring the increased resistance of thin metal coatings on polymer substrates. Therefore, different values are presented: R0 being the resistance when no strain is applied, R being the measured resistance at a certain strain; and ΔR being the difference between R and R0. For example, a strain of 20% was shown to increase the resistance of thin coatings of copper (R/R0 = 1.4 [9]; ΔR/R0 = 15% [10]; R/R0 = 1.4 [11]), silver (R/R0 = 2.2 [12]) and aluminum (ΔR/R0 = 15,000 [13]), the latter depending on strain speed and aluminum thickness. This behavior was time-dependent [13] and influenced by the adhesion of the metal to the polymer substrate [11].
One easy method to vary the adhesion of metals to polymer substrates is corona pretreatment [14,15,16] which is used to increase the polarity of surfaces for industrial processes [17,18,19,20,21]. The pretreatment is based on corona discharge, which forms a plasma comprising ions, free radicals and reactive ozone that breaks H–C bonds on the polymer surface [17,22], converting them into polar carbonyl and carboxyl groups, among others [18,22,23,24,25,26,27,28,29,30,31]. This increases the polar part of surface energy and thus the overall surface energy. A high-energy impact during corona treatment yields a higher surface energy, although saturation occurs at the maximum radical concentration and further increases in corona dosage do not elevate the surface energy any further [32,33].
It is not clear how combinations of different coating thicknesses and corona pretreatments affect the sensitivity of aluminum coatings on standard packaging substrate materials such as PET and polypropylene (PP) films used for PVD, when such materials are subjected to uniaxial strain. We therefore set out to evaluate various combinations of aluminum coating thickness, corona pretreatment, and polymer substrate on the relative increase in resistance during stretching (strain = 0–100%).
2. Materials and Methods
2.1. Corona Treatment
We used two polymer films: (1) a biaxial-oriented PET film (HostaphanRN 12) with a thickness of 12 µm, supplied by Mitsubishi (Wiesbaden, Germany); and (2) a biaxial-oriented PP film (TNS) with a thickness of 20 µm, supplied by Taghleef Industries (Dubai, UAE). The films were treated on both sides at a Type CLNE corona station (Softal, Hamburg, Germany). The corona dosage E was calculated from the generator power P divided by the web velocity v and corona electrode width l as shown in Equation (1) [17,34]. After evaluation experiments, we applied corona dosages of 0, 70, 140, 210, and 280 W∙min/m2 for the PET film and 0, 10, 20, 30, 40, and 50 W∙min/m2 for the PP film. The relative humidity during the trials was 50% and the temperature was 23 °C. Following corona treatment, the film reels were stored under these same conditions.
2.2. Measurement of Surface Energy
The surface energy σ was measured according to DIN 55660-2 using a DSA 100 system (Krüss, Hamburg, Germany) up to 3 days after corona treatment. The polar and dispersive parts of the surface energy were determined using the Owens, Wendt, Rabel, and Kaelble (OWRK) data evaluation method [35,36,37,38], which is an extension of the Fowkes method [39]. The test liquids were water, diiodomethane and ethylene glycol. The contact angles were measured in equilibrium. Tests were carried out five times and mean values are presented.
2.3. Physical Vapor Deposition
PVD was carried out using the electron beam heating method. Moisture remaining in the chamber was extracted using a Meissner cold trap and the deposition roll was cooled with water. We used 99.98% pure K135 aluminum (Drahtwerk Elisental W. Erdmann, Neuenrade, Germany). The coating thickness was varied by changing the web speed from 0.5 to 3.0 m/min in steps of 0.5 m/min at an evaporation rate of 2–3.5 nm/s. Further process details are provided elsewhere [40]. Aluminum thickness was calculated as previously described [40]. We deposited aluminum coatings of 10, 12, 14, 23, 35, and 69 nm on the PET films and 10, 12, 14, 23, 35, and 85 nm on the PP films.
2.4. 180° Ethylene Acrylic Acid Copolymer Peel Test Applied to PET Samples
The 180° ethylene acrylic acid copolymer (EAA) peel test was used to assess the adhesion of aluminum coatings to the polymer substrates. Primacor 1410 EAA film (DuPont, Wilmington, DE, USA) was heat-sealed onto the metal layer at 105 °C for 20 s at 4 bar and peeled off under defined conditions using a Type RM 50 universal tensile testing device with a 50 N load cell (Schenck-Trebel, Deer Park, New York, NY, USA). The initial sample distance between the upper and lower clamps of the tensile tester was 50 mm, and the sample width was 15 mm. The test speed was 5 cm/min up to 0.5 N and 50 mm/min thereafter. EAA adheres strongly to aluminum, so the multilayer material delaminates at the interface between the aluminum and polymer substrate. The adhesion force between the aluminum and substrate can thus be determined indirectly as shown in Figure 1. Although the measurement is affected by many factors (including substrate stiffness, EAA coating thickness, and test speed), we varied only the aluminum thickness and the corona dosage while keeping all other parameters constant, allowing us to generate comparable results [41,42]. Each combination of corona dosage and aluminum thickness was tested five times, and the mean values are presented.
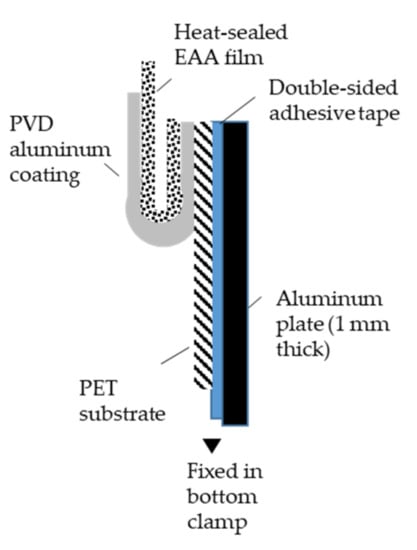
Figure 1.
Schematic representation of the 180° EAA peel test.
2.5. Tensile Test and Measurement of Electrical Resistance
The electrical resistance R under strain ε was measured as shown in Figure 2. Insulating paper was glued to the clamp jaws in the Type RM 50 universal tensile testing device. Aluminum foil was fixed in place with double-sided adhesive tape. The aluminum foil was then connected to a True RMS UT71E digital multimeter (UNI-Trend Technology, Dongguan, China). The aluminum coated sample (100 mm × 15 mm) was then placed between the clamp jaws (crosshead distance L = 50 mm) with the aluminum side facing the aluminum foil. The aluminum foil (thickness = 25 µm) has a negligible electrical resistance compared to the aluminum coating (thickness = 10–69 nm for PET and 10–85 nm for PP) so its influence was considered insignificant. The tensile test was performed at 5 m/min. The maximum strain was 100% on PET and 50% on PP. Five samples per aluminum thickness d and corona dosage E were measured, and the mean values are presented.
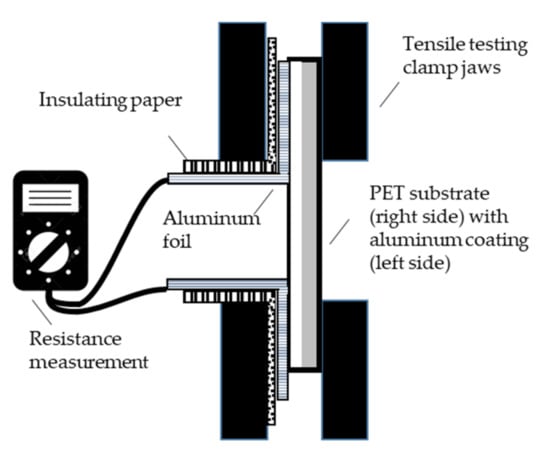
Figure 2.
Measurement of increase in resistance γ during the tensile test.
The relative increase in resistance γ was calculated from the measured resistance R at a given strain ε (ε = x) divided by the initial resistance measured when no tensile strain was applied (ε = 0%) as shown in Equation (2). The theoretical increase in resistance γtheo due to the uniaxial expansion of aluminum without any damage was estimated by assuming the volume of aluminum (aluminum cross-section A × specimen length L) remains constant under strain, such that A × L = A0 × L0. Under strain, the material expands in length, but also thins. Accordingly, A decreases and L increases through plastic deformation. These assumptions allow the derivation of Equations (3)–(5) [11].
2.6. Atomic Force Microscopy
The sample surface was scanned over an area of 50 µm × 50 µm with an alpha500 atomic force microscope (WITec GmbH, Ulm, Germany) in pulsed force mode, with 256 points per line and 265 lines per image, with data acquired from forward and backward scans. Height profiles were extracted for the surface at random positions perpendicular to the direction of tensile testing (Project Four software version 4.0; WITec GmbH). The geometrical data were then exported to OriginPro 2016 v2018.b (OriginLab, Northampton, MA, USA).
2.7. Statistical Methods
Means and standard deviations were calculated and graphs created using OriginPro. Error bars are omitted from some graphs and data points are joined by lines to improve visual clarity.
3. Results and Discussion
3.1. Surface Energy of PET and PP after Corona Treatment
PET was initially exposed to corona dosages of 52, 105, 210 and 280 W∙min/m2, but we observed no further increases in surface energy for dosages >50 W∙min/m2, with the maximum at ~50 mN/m (Figure 3) in agreement with previous reports [32,33]. PP has a lower initial surface energy than PET and was exposed to lower corona dosages, but still reached maximum surface energy of ~40 mN/m at a dosage of 10 W∙min/m2. We carried out further investigations first on the PET films and then on the PP films before comparing the results, as discussed below.
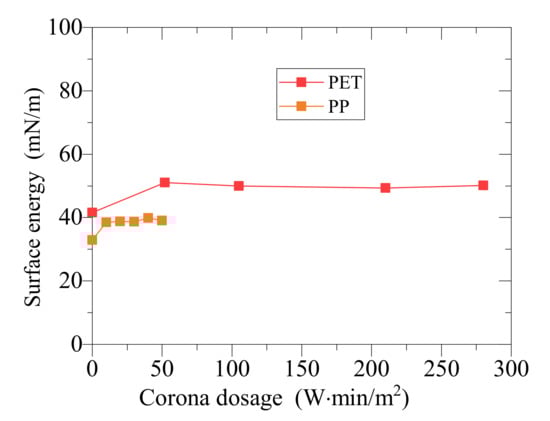
Figure 3.
Surface energy of polyethylene terephthalate (PET) and polypropylene (PP) before and after corona treatment at various dosages. Each value is a mean of n = 5 measurements.
3.2. Effect of Corona Dosage on the Adhesion of Aluminum to PET
The adhesion of aluminum to PET became weaker with increasing corona dosage (Figure 4). This probably reflects polymer chain scission (breaking of C–C bonds) on the polymer surface as a side effect of corona treatment [17,23]. This produces short-chain molecules that are only loosely bound to the surface, reducing the adhesion to aluminum [17,23].
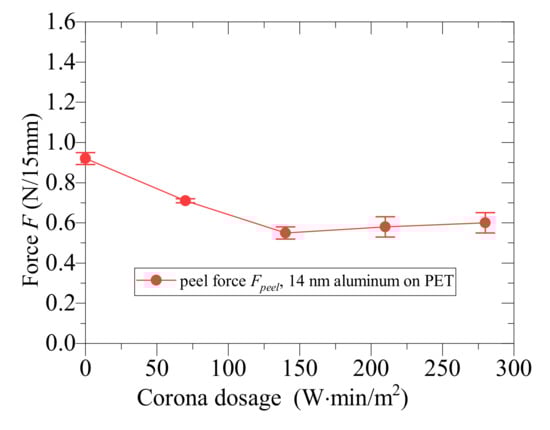
Figure 4.
Effect of corona dosage on the peel force of aluminum-coated PET films. The thickness of the aluminum coating was 14 nm (also see Figure 5c). Each value is a mean of n = 5 measurements ± standard deviations.
3.3. Effect of Corona Dosage on the Percentage Increase in Resistance of Aluminum-Coated PET under Strain
Strain increases the resistance of aluminum-coated PET films by promoting the formation of cracks. We investigated the effect of corona dosage on the response (increase in resistance) of PET films coated with different thicknesses of aluminum (Figure 5). Each graph represents a different thickness of aluminum and presents data for corona dosages of 0, 70, 140, 210, and 280 W∙min/m2. The different aluminum thicknesses shown in the individual graphs are (a) 10; (b) 12; (c) 14; (d) 23; (e) 35; and (f) 69 nm.
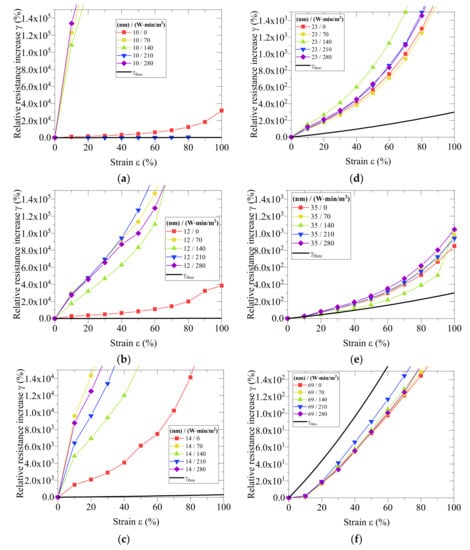
Figure 5.
Increase in resistance under strain for PET films coated with aluminum layers of different thicknesses: (a) 10; (b) 12; (c) 14; (d) 23; (e) 35; and (f) 69 nm. Colored lines in each graph represent different corona dosages ranging from 0 to 240 W∙min/m2 as shown in the key. The y-axis scales vary by a factor of up to 103. Each value is a mean of n = 5 measurements. Error bars are omitted and data points are joined by lines for visual clarity.
Generally, increasing the strain induced the formation of cracks in the aluminum coating, thus increasing the resistance by more than the theoretical value (γtheo) based on zero damage (Figure 5a–e). In each graph, this theoretical value is indicated by a black line. Exceptionally, the increase in resistance observed for the thickest coating (69 mm) was lower than the theoretical value (Figure 5f). This possibly reflects the low initial resistance at zero strain, which would increase sensitivity to experimental variations. A closer look shows that γ started to increase at 10% strain, suggesting the samples were not fully straightened before positioning between the clamps, allowing ~5 mm of movement before the samples were under tension (5 cm cross head distance L × 10% strain ε). This is likely to be the case for all samples, but becomes more obvious for thick coatings due to the relatively low initial resistance R.
Comparison of data points within each graph in Figure 5 shows that increasing the corona dosage tends to produce higher increases in resistance. As stated above, overtreatment at the corona station promotes the formation of short-chain molecules that reduce adhesion, which may contribute to a non-uniform strain distribution in the aluminum and the formation of cracks and delamination hotspots in regions without adhesion [11]. The weaker and heterogeneous adhesion between the substrate and coating may decrease the mechanical resistance of thin films exposed to tension, ultimately resulting in more defects and a higher increase in resistance.
Comparison of data points between graphs in Figure 5 reveals that the effect of corona treatment is dependent on the aluminum thickness. For the medium-thickness coatings of 12 and 14 nm, the lines representing different corona dosages are well separated (Figure 5b,c), whereas the lines overlap for thinner and thicker coatings (Figure 5a,d–f). The scaling of the y-axis confirms that thinner aluminum coatings (10 nm) lead to much higher electrical resistance (y-axis scaling up to 105), whereas thicker coatings (69 nm) lead to a lower increase in electrical resistance (y-axis scaling up to 102). This phenomenon warranted further investigation, as discussed below.
3.4. Effect of Aluminum Thickness on the Percentage Increase in Resistance of Aluminum-Coated PET under Strain
Next we investigated the effect of aluminum thickness on the response (increase in resistance) of PET films treated at different corona dosages (Figure 6). Here, each graph represents a different corona dosage and presents data for aluminum thicknesses of 10, 12, 14, 17, 23, 35, and 69 nm. The different corona dosages shown in the individual graphs are (a) 0; (b) 70; (c) 140; (d) 210 and (e) 280 W∙min/m2.
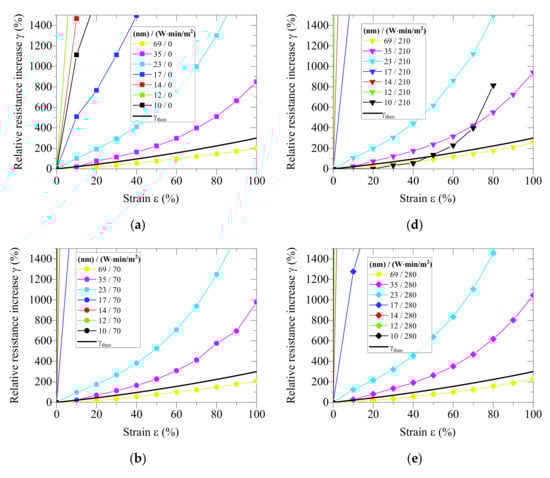
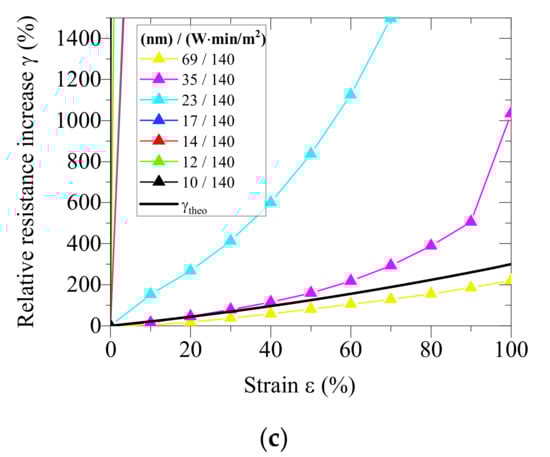
Figure 6.
Increase in resistance under strain for PET films pretreated with different corona dosages: (a) 0; (b) 70; (c) 140; (d) 210 and (e) 280 W∙min/m2. Colored lines in each graph represent different aluminum thicknesses ranging from 10 to 69 nm. The y-axis scales vary by a factor of up to 103. Each value is a mean of n = 5 measurements.
Whereas thick coatings (69 nm, yellow lines) showed a behavior close to the theoretical increase in resistance (γtheo) represented by the black lines, thinner coatings (especially those thinner than 23 nm) were much more sensitive to strain, regardless of the corona dosage, as also indicated by our atomic force microscopy data (Figure 7 and Figure 8). This contrasts with previous reports in which thinner coatings showed higher stability [13], but agrees with our earlier results from experiments with aluminum coatings on paper [1].
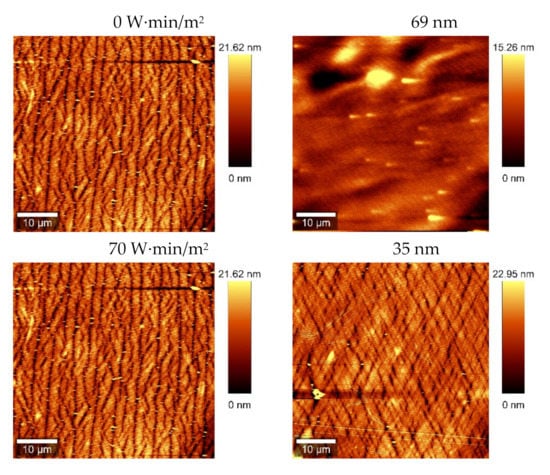
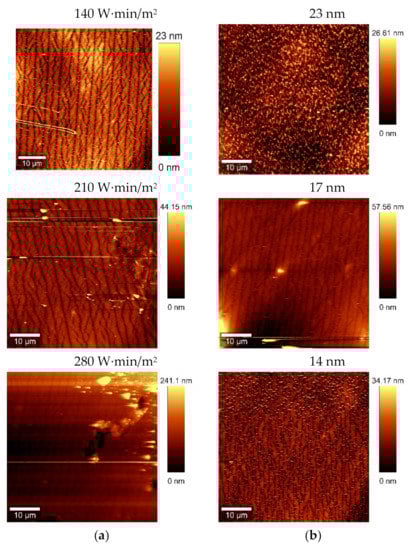
Figure 7.
Atomic force microscopy images of PET samples coated with aluminum and subjected to 20% strain for (a) different corona dosages of 0–280 W∙min/m2 at a constant thickness of 14 nm and (Refers to Figure 5c at 20% strain) (b) different aluminum thicknesses of 14–69 nm at a corona dosage of 0 W∙min/m2 (Refers to Figure 6a at 20% strain). The vertical lines indicate cracks in the aluminum.
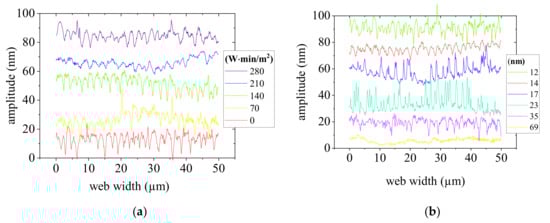
Figure 8.
Atomic force microscopy cross sections of PET samples coated with aluminum and subjected to 20% strain for (a) different corona dosages of 0–280 W∙min/m2 and (b) different aluminum thicknesses of 12–69 nm. The troughs indicate cracks in the aluminum.
Figure 7 and Figure 8 show the effect of increasing the corona dosage (left column, compare to Figure 5c at 20% strain) and decreasing the aluminum thickness (right column, compare to Figure 6a at 20% strain) on the density of coating defects. No difference in defect density was observed when comparing images representing different corona dosages at a constant aluminum thickness, suggesting differences might become visible for strains >20%. However, an increase in defect density was apparent when comparing images representing different aluminum thicknesses at the same corona dosage, in line with the observed increase is resistance for thinner coatings.
3.5. Effect of Corona Dosage on the Percentage Increase in Resistance of Aluminum-Coated PP under Strain
Next we investigated the effect of corona dosage on the response (increase in resistance) of PP films coated with different thicknesses of aluminum (Figure 9). Each graph represents a different thickness of aluminum and presents data for corona dosages of 0, 10, 20, 30, 40, and 50 W∙min/m2. The different aluminum thicknesses shown in the individual graphs are (a) 10; (b) 12; (c) 14; (d) 23; (e) 35; and (f) 85 nm.
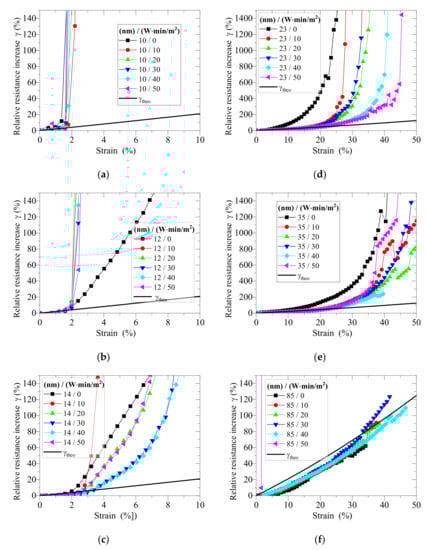
Figure 9.
Increase in resistance under strain for PP films coated with aluminum layers of different thicknesses: (a) 10; (b) 12; (c) 14; (d) 23; (e) 35; and (f) 85 nm. Colored lines in each graph represent different corona dosages ranging from 0 to 50 W∙min/m2 as shown in the key. The y-axis scales vary by a factor of up to 10. Each value is a mean of n = 5 measurements.
The results were similar to those observed for the PET films. Generally, the resistance increased with strain and the values were higher than the theoretical value representing zero damage (γtheo) indicating that the additional resistance reflects the appearance of cracks (Figure 9a–e). Again, the thickest coating behaved in an exceptional manner, with the measured increase in resistance lower than the theoretical value (Figure 9f). We offer the same potential explanation as proposed for the PET film. Comparing the different graphs in Figure 9, we observe that the crack onset strain (where the measured curve starts to deviate significantly from γtheo) increases with thicker aluminum coatings and higher corona dosages.
Comparison of data points within each graph in Figure 9d indicates that higher corona dosages tend to limit the increase in resistance on PP. On PET films, the effect of corona dosage was most visible for medium thickness coatings of 12–14 nm (Figure 5b,c), and medium thickness coatings on PP (14–35 nm) behaved in a similar manner (Figure 9c–e). This leads to the following three assumptions: (1) thin coatings (~10–12 nm) are too fragile, so that corona treatment cannot increase their stability; (2) medium thickness coatings (~12–35 nm) are less fragile, and stability can therefore be influenced by corona treatment; and (3) thick coatings (~85 nm) are already stable, and corona treatment offers no further improvement.
3.6. Effect of Aluminum Thickness the Percentage Increase in Resistance of Aluminum-Coated PP under Strain
Next we investigated the effect of aluminum thickness on the response (increase in resistance) of PP films treated at different corona dosages (Figure 10). Here, each graph represents a different corona dosage and presents data for aluminum thicknesses of 10, 12, 14, 23, 35, and 85 nm. The different corona dosages shown in the individual graphs are (a) 0; (b) 10; (c) 20; (d) 30; (e) 40; and (f) 50 W∙min/m2.
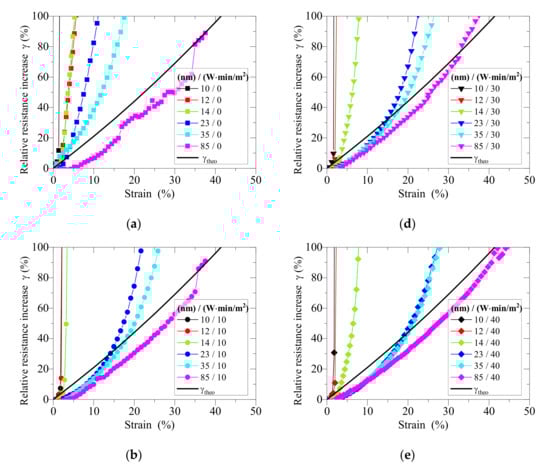
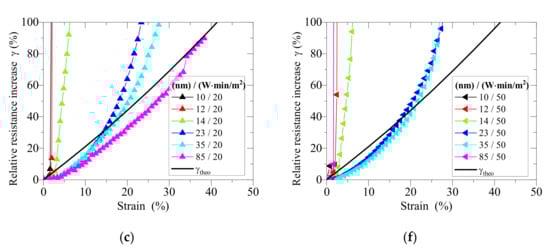
Figure 10.
Increase in resistance under strain for PP films pretreated with different corona dosages: (a) 0; (b) 10; (c) 20; (d) 30; (e) 40 and (f) 50 W∙min/m2. Colored lines in each graph represent different aluminum thicknesses ranging from 10 to 85 nm. Each value is a mean of n = 5 measurements.
As was the case for the PET films, thick coatings (85 nm, pink lines) showed a behavior close to the theoretical increase in resistance (γtheo) represented by the black lines, whereas thinner coatings were much more sensitive to strain. This effect appeared to be independent of the corona treatment, given the similar appearance of all the graphs in Figure 10.
3.7. Combined Effect of Aluminum Thickness and Corona Dosage the Percentage Increase in Resistance of Aluminum-Coated PET and PP Films under Strain
Finally, we combined the analysis of three parameters (corona dosage E, aluminum thickness d, and strain ε) for PET (Figure 11a) and PP (Figure 11b). On both substrates, aluminum thickness affected the increase in resistance significantly, whereas the effect of corona dosage was limited. The thicker aluminum coating was more stable, resulting in a lower increase in resistance. Generally, the values were higher on PET than PP, perhaps due to differences in corona (over)treatment, substrate roughness, surface energy or molecular interactions. Furthermore, the curve shapes for PET and PP were distinct, especially taking into account the different maximum strains of 100% on PET and 50% on PP.
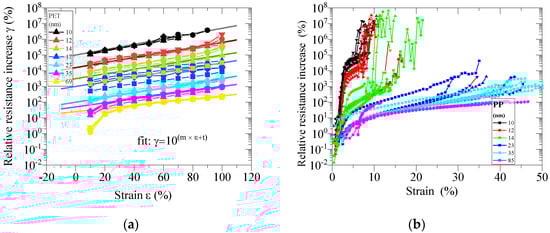
Figure 11.
Effect of corona dosage E, aluminum thickness d and tensile strain ε on the increase in resistance γ of aluminum-coated polymer films under strain. Lines of same color represent the various different corona dosages. (a) PET films. (b) PP films.
The lines representing the different thicknesses of aluminum on PET were well aligned in the logarithmic graph (Figure 11a). This suggests that the increase in resistance increases exponentially, so we fitted the lines to a linear function describing the logarithmic correlation in Equations (6) and (7). This allowed us to deduce two new parameters: m describing the slope, and t describing the y-axis intersection (Table 1). Both values correlated with the aluminum thickness d (Figure 12), but m showed a linear correlation with d whereas there was an inverse correlation between t and d shown in Equations (8) and (9). We extracted three fit factors (a, b, and c) from these graphs (Table 2) allowing us to combine Equations (7)–(9) to derive Equation (10). The latter describes the correlation between strain ε, aluminum thickness d and the increase in resistance γ on the PET substrate in the 30–100% strain range (Figure 13).

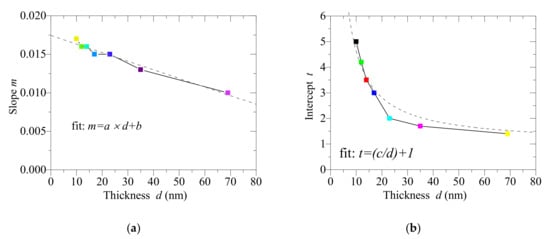
Figure 12.
Fit factors for (a) slope m and (b) intercept t depend on the thickness of the aluminum coating.
Table 2.
Fit factors a, b, and c for Equation (8) and Equation (9).
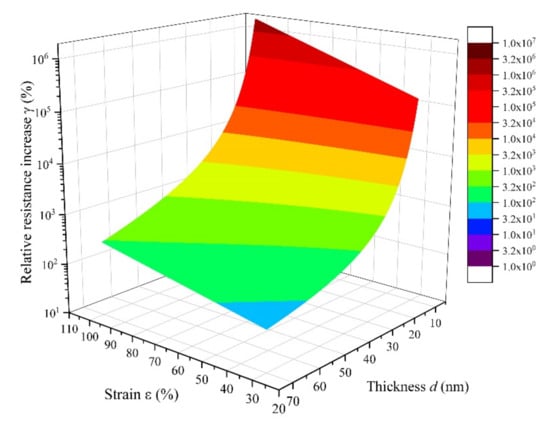
Figure 13.
Effect of aluminum thickness d and tensile strain ε on the increase of resistance γ in aluminum-coated PET films.
Figure 13 shows that a strain ε of ~30% causes a relative increase in resistance γ of 10% to 100,000%, depending on aluminum thickness d. In comparison, increases in resistance of ~40% (R/R0 = 1.4 at 200 nm thickness [9]), ~15% (ΔR/R0 = 15% at 700 nm thickness [10]) and ~40% (R/R0 = 1.4 at 10 nm thickness [11]) were reported for copper coatings, with equivalent values of ~120% (R/R0 = 2.2) for silver coatings [12] and 1,500,000% (ΔR/R0 = 15,000) for aluminum coatings, depending on the strain speed and aluminum thickness (all values represent a strain of 20%) [13]. It is therefore clear that the substrate, coating material, and experimental setup all contribute to the increase in resistance, whereas the corona pretreatment has only a marginal effect.
4. Conclusions
Aluminum-coated polymers are gaining importance as packaging and flexible electronics become part of everyday life, and it is therefore necessary to understand how process parameters affect the material properties and failures of such composites. We have shown that the thickness of the coating has a much more significant effect on the increase of resistance than the corona treatment of the substrate, suggesting that thicker coatings can be used to overcome the challenges of sensitive aluminum-coated materials. Further experiments are required to determine the effect of corona dosages in the 0–10 W∙min/m2 range, especially on polymers like PP with a low initial surface energy. These measurements should be combined with atomic force microscopy to evaluate the crack density under different combinations of coating thickness, corona treatment, and strain.
Funding
This research received no external funding.
Acknowledgments
The author acknowledges Franziska Trodtfeld, Lukas Baumgarth, Birgit Hillebrand, Dieter Bauer and Tom Colombo for experimental support.
Conflicts of Interest
The authors declare no conflict of interest.
References
- Lindner, M.; Reinelt, M.; Gilch, T.; Langowski, H.-C. Hygroexpansion, Surface roughness and porosity affect the electrical resistance of EVOH-aluminum-coated paper. Coatings 2019, 9, 295. [Google Scholar] [CrossRef]
- Kulachenko, A.; Gradin, P.; Westerlind, B. Analysis of paper web tension profiles. J. Graph. Technol. 2005, 2, 72–81. [Google Scholar]
- Glushko, O.; Cordill, M. Electrical resistance of metal films on polymer substrates under tension. Exp. Tech. 2016, 40, 303–310. [Google Scholar] [CrossRef]
- Naghdi, S.; Rhee, K.Y.; Hui, D.; Park, S.J. A review of conductive metal nanomaterials as conductive, transparent, and flexible coatings, thin films, and conductive fillers: Different deposition methods and applications. Coatings 2018, 8, 278. [Google Scholar] [CrossRef]
- Utz, H. Barriereeigenschaften Aluminiumbedampfter Kunststofffolien. Ph.D. Thesis, Technical University of Munich, Munich, Germany, 1995. [Google Scholar]
- Kraker, P.T.; Glushko, O.; Cordill, M.J. Relationship between Cracking and Resistance Increase in Polymer-Supported Metal Films under Mechanical Load; Materials Science and Engineering Darmstadt, Germany; Montan Universität: Darmstadt, Germany, 2016. [Google Scholar]
- Glushko, O.; Kraker, P.; Cordill, M. Explicit relationship between electrical and topological degradation of polymer-supported metal films subjected to mechanical loading. Appl. Phys. Lett. 2017, 110, 191904. [Google Scholar] [CrossRef]
- Jörg, T.; Music, D.; Hauser, F.; Cordill, M.J.; Franz, R.; Köstenbauer, H.; Winkler, J.; Schneider, J.M.; Mitterer, C. Deformation behavior of Re alloyed Mo thin films on flexible substrates: In situ fragmentation analysis supported by first-principles calculations. Sci. Rep. 2017, 7, 7374. [Google Scholar] [CrossRef] [PubMed]
- Berger, J.; Glushko, O.; Marx, V.M.; Kirchlechner, C.; Cordill, M.J. Effect of microstructure on the electro-mechanical behaviour of Cu films on polyimide. J. Miner. Met. Mater. Soc. 2016, 68, 1640–1646. [Google Scholar] [CrossRef]
- Niu, R.; Liu, G.; Wang, C.; Zhang, G.; Ding, X.; Sun, J. Thickness dependent critical strain in submicron Cu films adherent to polymer substrate. Appl. Phys. Lett. 2007, 90, 161907. [Google Scholar] [CrossRef]
- Lu, N.; Wang, X.; Suo, Z.; Vlassak, J. Metal films on polymer substrates stretched beyond 50%. Appl. Phys. Lett. 2007, 91, 221909. [Google Scholar] [CrossRef]
- Polywka, A.; Stegers, L.; Krauledat, O.; Riedl, T.; Jakob, T.; Görrn, P. Controlled mechanical cracking of metal films deposited on polydimethylsiloxane (PDMS). Nanomaterials 2016, 6, 168. [Google Scholar] [CrossRef]
- Hamasha, M.M.; Alzoubi, K.; Switzer, J.C.; Lu, S.; Desu, S.B.; Poliks, M. A study on crack propagation and electrical resistance change of sputtered aluminum thin film on poly ethylene terephthalate substrate under stretching. Thin Solid Films 2011, 519, 7918–7924. [Google Scholar] [CrossRef]
- Lindner, M.; Rodler, N.; Jesdinszki, M.; Schmid, M.; Sängerlaub, S. Surface energy of corona treated PP, PE and PET films, its alteration as function of storage time and the effect of various corona dosages on their bond strength after lamination. J. Appl. Polym. Sci. 2017, 135. [Google Scholar] [CrossRef]
- Bishop, C. Some considerations on fine-line patter metallization. Convert. Q. 2018, 8, 30–32. [Google Scholar]
- Bishop, C.A. Vacuum Deposition onto Webs, Films and Foils, 2nd ed.; Elsevier: Amsterdam, The Netherlands, 2011. [Google Scholar]
- Izdebska, J. Corona Treatment. In Printing on Polymers; Ebnesajjad, S., Ed.; William Andrew Publishing: Chadds Ford, PA, USA, 2016; pp. 123–142. [Google Scholar]
- Sun, C.; Zhang, D.; Wadsworth, L.C. Corona treatment of polyolefin films—A review. Adv. Polym. Technol. 1999, 18, 171–180. [Google Scholar]
- Sherman, P.B. Adhesion and corona treatment. In Proceedings of the SPE National Technical Conference: Plastic in Packaging and Acrylonitrile—A Dual Meet, Chicago, IL, USA, 13–15 November 1978; pp. 184–189. [Google Scholar]
- Pascual, M.; Calvo, O.; Sanchez-Nácher, L.; Bonet, M.A.; Garcia-Sanoguera, D.; Balart, R. Optimization of adhesive joints of low density polyethylene (LDPE) composite laminates with polyolefin foam using corona discharge plasma. J. Appl. Polym. Sci. 2009, 114, 2971–2977. [Google Scholar] [CrossRef]
- Cramm, R.H.; Bibee, D.V. Theory and Practice of Corona Treatment for Improving Adhesion; Tappi: Peachtree Corners, GA, USA, 1982; pp. 75–78. [Google Scholar]
- Zhang, D.; Sun, Q.; Wadsworth, L.C. Mechanism of corona treatment on polyolefin films. Polym. Eng. Sci. 1998, 38, 965–970. [Google Scholar] [CrossRef]
- Guimond, S.; Wertheimer, M.R. Surface degradation and hydrophobic recovery of polyolefins treated by air corona and nitrogen atmospheric pressure glow discharge. J. Appl. Polym. Sci. 2004, 94, 1291–1303. [Google Scholar] [CrossRef]
- Zenkiewicz, M. Investigation on the oxidation of surface layers of polyolefins treated with corona discharge. J. Adhes. Sci. Technol. 2001, 15, 63–70. [Google Scholar] [CrossRef]
- Strobel, M.; Lyons, C.S.; Strobel, J.M.; Kapaun, R.S. Analysis of air-corona-treated polypropylene and poly(ethylene terephthalate) films by contact-angle measurements and X-ray photoelectron spectroscopy. J. Adhes. Sci. Technol. 1992, 6, 429–443. [Google Scholar] [CrossRef]
- Sapieha, S.; Cerny, J.; Klemberg-Sapieha, J.E.; Martinu, L. Corona versus low pressure plasma treatment: Effect on surface properties and adhesion of polymers. J. Adhes. 1993, 42, 91–102. [Google Scholar] [CrossRef]
- Pascual, M.; Sanchis, R.; Sánchez, L.; García, D.; Balart, R. Surface modification of low density polyethylene (LDPE) film using corona discharge plasma for technological applications. J. Adhes. Sci. Technol. 2008, 22, 1425–1442. [Google Scholar] [CrossRef]
- Owens, D.K. The mechanism of corona and ultraviolet light-induced self-adhesion of poly(ethylene terephthalate) film. J. Appl. Polym. Sci. 1975, 19, 3315–3326. [Google Scholar] [CrossRef]
- Novák, I.; Chodák, I. Adhesion of poly(propylene) modified by corona discharge. Angew. Makromol. Chem. 1998, 260, 47–51. [Google Scholar] [CrossRef]
- Lynch, J.B.; Spence, P.D.; Baker, D.E.; Postlethwaite, T.A. Atmospheric pressure plasma treatment of polyethylene via a pulse dielectric barrier discharge: Comparison using various gas compositions versus corona discharge in air. J. Appl. Polym. Sci. 1999, 71, 319–331. [Google Scholar] [CrossRef]
- Bablyuk, E.B.; Popov, O.N.; Segueikin, G.I. Adhesion Properties of Polyethylene Terephtalate (PET) Film Treated with Corona Discharge. In Proceedings of the IS&T 49th Annual Conference, Minneapolis, MN, USA, 19–24 May 1996; pp. 556–558. [Google Scholar]
- Weber, R. Saturation phenomena in conjunction with corona treatment on different substrates. In Proceedings of the TAPPI PLACE Conference, Las Vegas, NV, USA, 25–29 September 2005; pp. 1213–1224. [Google Scholar]
- Steinhauser, H.; Ellinghorst, G. Corona treatment of isotactic polypropylene in nitrogen and carbondioxide. Macromol. Mater. Eng. 1984, 120, 177–191. [Google Scholar]
- Tuominen, M.; Lavonen, J.; Lahti, J.; Kuusipalo, J. Atmospheric plasma treatment in extrusion coating: Part 2—Surface modification of LDPE and PP coated papers. In Atmospheric Pressure Plasma Treatment of Polymers; John Wiley & Sons: Hoboken, NJ, USA, 2013; pp. 355–381. [Google Scholar]
- Law, K.Y.; Zhao, H. Surface Wetting: Characterization, Contact Angle, and Fundamentals; Springer: Berlin/Heidelberg, Germany, 2016. [Google Scholar]
- Kaelble, D. Dispersion-polar surface tension properties of organic solids. J. Adhes. 1970, 2, 66–81. [Google Scholar] [CrossRef]
- Owens, D.K.; Wendt, R. Estimation of the surface free energy of polymers. J. Appl. Polym. Sci. 1969, 13, 1741–1747. [Google Scholar] [CrossRef]
- Rabel, W. Einige aspekte der benetzungstheorie und ihre anwendung auf die untersuchung und veränderung der oberflächeneigenschaften von polymeren. Farbe Lack 1971, 77, 997–1006. [Google Scholar]
- Fowkes, F.M. Determination of interfacial tensions, contact angles, and dispersion forces in surfaces by assuming additivity of intermolecular interactions in surfaces. J. Phys. Chem. 1962, 66, 382. [Google Scholar] [CrossRef]
- Lindner, M.; Höflsauer, F.; Heider, J.; Reinelt, M.; Langowski, H.-C. Comparison of thickness determination methods for physical-vapor-deposited aluminum coatings in packaging applications. Thin Solid Films 2018, 666, 6–14. [Google Scholar] [CrossRef]
- Kucukpinar, E.; Jesdinszki, M.; Rodler, N.; Struller, C.; Noller, K.; Blondin, D.; Cassio, V.; Langowski, H.-C. Determination of metal adhesion strength of metallized films by peel tests. In Proceedings of the Web Coating and Handling Conference, Myrtle Beach, SC, USA, 19–22 October 2014. [Google Scholar]
- Jesdinszki, M.; Struller, C.; Rodler, N.; Blondin, D.; Cassio, V.; Kucukpinar, E.; Langowski, H.-C. Evaluation of adhesion strength between thin aluminum layer and poly (ethylene terephthalate) substrate by peel tests—A practical approach for the packaging industry. J. Adhes. Sci. Technol. 2012, 26, 2357–2380. [Google Scholar] [CrossRef]
Publisher’s Note: MDPI stays neutral with regard to jurisdictional claims in published maps and institutional affiliations. |
© 2020 by the author. Licensee MDPI, Basel, Switzerland. This article is an open access article distributed under the terms and conditions of the Creative Commons Attribution (CC BY) license (http://creativecommons.org/licenses/by/4.0/).