Abstract
Magnesium alloys are used in the motorsport and aerospace fields because of their high specific strength. However, due to their low corrosion resistance, protective surface treatments, such as conversion coating or electroless plating, are necessary when they are used in humid or corrosive environments. The present study aimed at evaluating the effect of plasma electrolytic oxidation (PEO), followed by the deposition of a polymeric layer by powder coating, on the rotating bending fatigue behaviour of the wrought magnesium alloy ZK60A-T5. The specimens were extracted from forged wheels of racing motorbikes and were PEO treated and powder coated. Microstructural characterization was carried out by optical (OM) and scanning electron microscopy (SEM) to analyse both the bulk material and the multilayer, consisting of the anodic oxide interlayer with the powder coating top layer (about 40 µm total thickness). Rotating bending fatigue tests were carried out to obtain the S–N curve of PEO-treated specimens. The results of the rotating bending tests evidenced fatigue strength equal to 104 MPa at 106 cycles and 90 MPa at 107 cycles. The results of the investigation pointed out that PEO led to a reduction in fatigue strength between 14% and 17% in comparison to the untreated alloy. Fracture surface analyses of the fatigue specimens, carried out by SEM and by 3D digital microscopy, highlighted multiple crack initiation sites at the interface between the PEO layer and substrate, induced by the concurrent effects of coating defects, local tensile stresses in the substrate, and increased roughness at the substrate–coating interface.
1. Introduction
Magnesium alloys, because of their low density, high specific strength, high damping capacity, and good castability [1,2,3], are attractive for lightweight applications in the automotive and aerospace industries, such as transmission housing, engine blocks, steering components, and wheels. Since many structural components are subjected to in-service cyclic stresses, the study of fatigue behaviour of both cast and wrought magnesium alloys, such as magnesium–zinc–zirconium (ZK) alloys, is gaining increasing interest [1,4,5,6,7,8,9].
Compared to other Mg alloys, ZK series show high strength and formability, mainly due to the presence of Zr, which acts as a grain refiner and leads to the development of a homogeneous equiaxed grain structure, not only in extruded but also in forged and cast-forged components [8]. In fact, even if Zn is added to produce age hardening by precipitation of intermetallic compounds, because of the moderate age hardening response of ZK alloys, the contribution of grain size strengthening is predominant [5]. For this reason, in recent years, some papers focused on the effects of the forging process on the ZK alloys’ grain structure, widely used for the production of complex components. Vasilev et al. [7] studied the effects of multiaxial isothermal forging (MIF) on the microstructure and fatigue behaviour of the as-cast ZK60 and demonstrated that MIF is able to refine coarse grains with a consequent improvement of the alloy fatigue response. Karparvarfard et al. compared the tensile and compressive behaviour [4] and the fatigue behaviour [8] of the as-cast and the cast-forged ZK60 alloy, concluding that the superior fatigue strength of the forged alloy compared to the as-cast one is due to grain refinement, the lower amount of porosities, and lower size of the intermetallics induced by plastic deformation.
Due to poor corrosion and wear resistance, when Mg components must be used in a humid or corrosive environment and/or an improvement of wear resistance is required, protective surface treatments are increasingly used [10,11,12,13,14]. For this reason, the fatigue strength of surface-treated Mg alloys has been attracting significant research interest in recent years.
Among surface modification techniques for magnesium alloys, Plasma Electrolytic Oxidation (PEO), also named Micro-Arc Oxidation (MAO), is a well-established solution for the improvement of wear and corrosion behaviour. PEO/MAO is an electrochemical conversion treatment applied not only to Mg alloys but also to Al and Ti alloys and other so-called valve metals [13,15]. This process is based on the modification of the growing anodic film by spark micro-discharges, initiated at potentials above the breakdown voltage of the oxide film [15]. Even though the PEO treatment generally improves wear and corrosion resistance, the production of a hard and rough PEO surface usually leads to a reduction in fatigue strength. This is mainly due to the generation of tensile residual stress during the oxidation treatment or to the presence of defects in the anodic layer, so that the conversion layer may be readily cracked when deformed [10,11,14].
Despite some drawbacks, these surface modification processes are widely used for the production of high-performance components. Up to now, however, only few data on the fatigue behaviour of anodized or PEO-treated magnesium alloys are available and to the best of our knowledge, no data about the effect of PEO treatment on the fatigue performance of ZK alloys are reported, even if these alloys find several applications in high strength aeronautic, military, and racing parts.
The available data on the effect of PEO on fatigue behaviour of Mg alloys, instead, concern the magnesium–gadolinium–rare earths (EV) and magnesium–aluminium–zinc (AZ) alloys [10,12,14]. Ceschini et al. [14] studied the influence of PEO on the fatigue behaviour of the sand cast EV31A Mg alloy. The results highlighted only a 15% reduction in fatigue strength of the PEO-treated alloy compared with the untreated, thanks to the low amount of defects and the good adhesion of the conversion layer. Similarly, Yerokhin et al. [10] demonstrated that PEO coating on the wrought AZ21 Mg alloy may cause no more than a 10% reduction in fatigue strength, which is lower than the effect of traditional anodizing. On the other hand, Nemcova et al. [12] showed a 35–40% reduction in fatigue properties of PEO-treated AZ61 wrought magnesium alloy with respect to the untreated one.
Based on the above, the present study aimed at evaluating the effect of PEO treatment on the rotating bending fatigue behaviour of a powder-coated ZK60A-T5 alloy. The samples were directly extracted from cast-forged wheels in order to test specimens with the same microstructure of the real component.
2. Materials and Methods
Samples used in the present investigation were extracted from forged wheels made of the ZK60A-T5 alloy (Figure 1), provided by Ducati Motor Holding SpA, Bologna (BO), Italy.
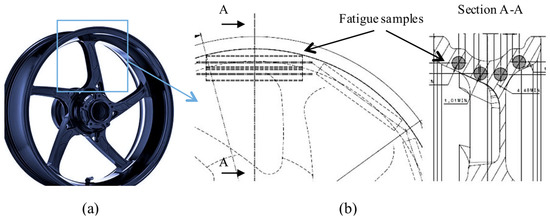
Figure 1.
Wheel shape and dimensions (width 152 mm, diameter 431 mm) (a) and scheme of the fatigue samples extraction locations (b).
The nominal chemical composition of the investigated ZK60A alloy, reported in Table 1, is characterized by the presence of Zn to induce age hardening during heat treatment [5,16,17,18] and Zr as grain refiner [5,19,20].

Table 1.
Nominal chemical composition (wt.%) of the ZK60A magnesium alloy [21].
The alloy was cast, forged, and T5 heat-treated according to the ASTM B 661 standard [22] to obtain the final geometry and increase the mechanical properties of the final wheel. The hot-working process was carried out at a temperature in the range 350−400 °C; immediately after forging, the wheels were water quenched and then, artificially aged at 150 °C for 24 h with final air cooling. Fatigue test samples were extracted from the wheels, as shown in Figure 1, and machined to the final geometry reported in Figure 2. Subsequently, they were PEO-treated and powder-coated. After PEO, the average surface roughness (Ra) was about 1.6 μm, but the deposition of the powder coating top layer decreased Ra down between 0.5 and 0.8 μm. The roughness was measured before and after deposition of the powder coating top layer by means of a stylus profilometer Hommelwerke T2000 (Hommelwerke, Schwenningen, Germany).
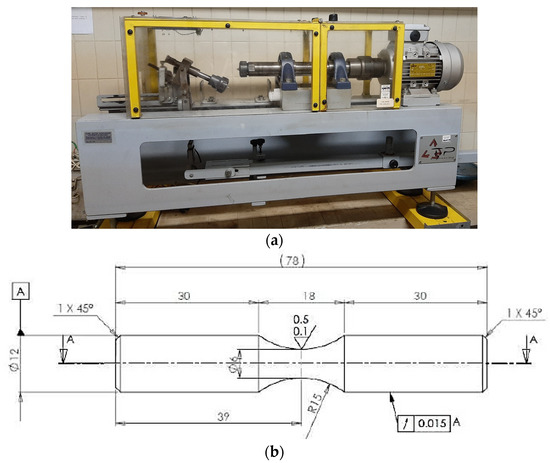
Figure 2.
Three-point rotating bending machine (a); geometry and dimensions (mm) of fatigue specimens according to ISO 1143 [24] (b).
The PEO treatment was carried out in an industrial facility, using a dilute alkaline solution containing P-based as well as Zr-based compounds, above the dielectric breakdown potential of the anodic oxide in order to induce micro-arc discharges, which facilitates the growth of a thick layer and the incorporation of electrolyte compounds [13]. Further details on the forging process and the PEO treatment cannot be disclosed due to confidentiality reasons. A polymeric top layer was deposited above the PEO layer by powder coating (i.e., electrostatic painting) to improve the corrosion resistance of the component, as well as for aesthetical reasons. The polymeric top layer consisted of a carboxyl polyester resin.
Microstructural characterization was carried out using an Axio Imager optical microscope (OM; Zeiss, Oberkochen, Germany) and a scanning electron microscope (SEM) Tescan Mira-3 (Tescan, Brno, Czech Republic) equipped with an energy dispersive X-ray spectroscopy microprobe (EDS; Bruker, Berlin, Germany). The samples were prepared by standard metallographic techniques (grinding with SiC emery papers 800, 1200, and 2000 grit; polishing with diamond 9, 3, and 1 μM) and chemically etched with Kroll’s reagent (HNO3 4% HF 2% vol. with H2O). Image analyses were carried out by the ®Image Pro-Plus software (4.5) to evaluate the recrystallized fraction (induced by forging) and the average grain size, evaluated as the square root of the average grain area.
Brinell hardness tests were performed according to the ISO 6506 standard [23] using a 62.5 kg load and a 2.5 mm steel ball indenter (HB10).
Fatigue tests were carried out by a three-point rotating bending machine (TP Engineering, Parma, Italy), shown in Figure 2, at a frequency of 47 Hz, at stress ratio R = −1, testing at least 4 samples at each stress level, in order to obtain the S–N curves according to ISO 1143 [24] and ISO 12107 [25] standards. The influence of the PEO treatment on the fatigue strength was investigated by comparing the experimental S–N curve to the literature data for the untreated alloy. The fracture surfaces, after fatigue failure, were analysed by 3D digital microscope Hirox KH-7700 (Hirox, Tokio, Japan) and by SEM–EDS.
3. Results and Discussion
3.1. Microstructure
Representative optical micrographs of the ZK60A-T5 forged alloy are reported in Figure 3, showing the presence of both large un-recrystallized dendrites oriented along the plastic flow (Figure 3a) and zones with fine and equiaxed recrystallized grains (Figure 3b) [8,26,27,28,29].
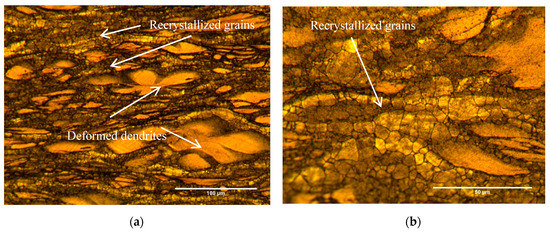
Figure 3.
Optical microscope (OM) images of the bimodal grain structure of the ZK60A-T5 alloy etched with Kroll’s reagent. Large un-recrystallized dendrites oriented along the plastic flow direction (a); fine recrystallized grains (b). The specimen was extracted from an untested fatigue sample.
Grain size distribution (Figure 4), evaluated by image analysis, confirmed a bimodal grain structure, with an average grain size of about 4.5 μm for recrystallized grains and 24 μm for un-recrystallized dendrites, even if the length of some dendrites reached 150 μm (Figure 3). The area fraction of recrystallized grains is about 60%. This grain structure is probably ascribable to the synergic effect of localized plastic flow during forging [26] and to elements segregation in the dendrites [28,29].
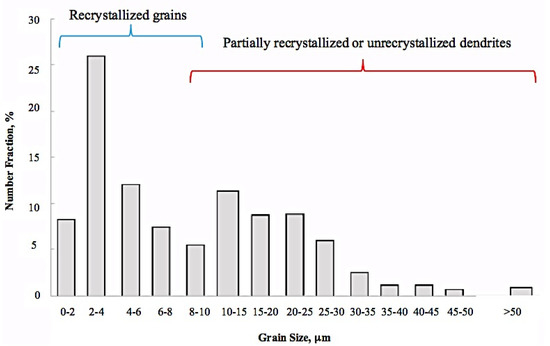
Figure 4.
Grain size distribution of ZK60A-T5 microstructure, showing a bimodal distribution due to the presence of recrystallized grains, partially recrystallized, and un-recrystallized dendrites.
Moreover, SEM–EDS analyses pointed out the presence of micrometric Zn–Zr intermetallics at the dendrite boundaries (white in Figure 5a) and different amounts of Zn and Zr in the recrystallized equiaxed grains and un-recrystallized dendrites. In Figure 5, the light grey zones, with about 6.4 wt.% of Zn and 1.5 wt.% of Zr, correspond to un-recrystallized dendrites, while the dark grey ones, with about 4.5 wt.% of Zn and 0.5 wt.% of Zr, correspond to recrystallized grains. The higher amount of Zn and Zr in the dendritic zones is probably due to the presence of sub-micrometric and nanometric Zn–Zr based precipitates. These findings are in agreement with other authors [17,27,28,29], showing that during the recrystallization of Zn–Zr magnesium alloys, fine grains nucleate near the previous casting grain boundaries, while in the grain core, finely dispersed Zn–Zr submicrometric and nanometric precipitates can pin dislocations and prevent the nucleation and growth of the new recrystallized grains. This process results in a “necklace” structure, caused by an incomplete dynamic recrystallization. Dynamic recrystallization (DRX) can occur during the hot deformation of metals and leads to the nucleation and growth of the new grains. Because during hot forging of the wheel, the alloy undergoes inhomogeneous strain rate and temperature fields, there is the possibility that in some regions, temperature or strain rate do not exceed the critical values of these parameters needed for DRX. In these regions, the recrystallization does not take place and therefore, the DRX is incomplete.
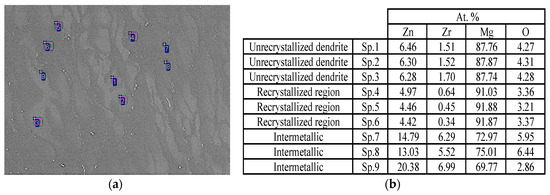
Figure 5.
SEM image highlighting un-recrystallized dendrites (light grey), recrystallized grains (dark grey), and micrometric intermetallics (white) and the EDS analysis locations (spots—Sp.) (a); table with the results of EDS analyses (b).
Representative SEM micrographs of the polished cross-section of PEO and painting layers are reported in Figure 6. The average thicknesses of the PEO base layer and the powder coating top layer were 11 ± 3 and 26 ± 3 µm, respectively. The cross-sections revealed the typical micro-defective structure of PEO layers, due to discharge events which, on the one hand, favour coating growth and on the other, induce the formation of pores, microcracks, and microchannels, which can negatively affect fatigue strength [30,31]. Micro-arc discharge events also account for the typical micro-undulation of the interface with the substrate, due to localized inward coating growth [32].
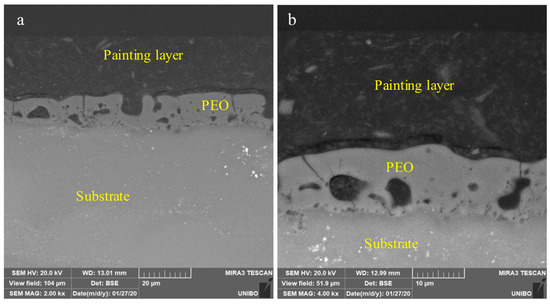
Figure 6.
SEM images at low (a) and high (b) magnifications of PEO and painting layers cross-section. The cross-sections revealed the micro-defective structure of PEO layers: pores, microcracks, and microchannels. The SEM analyses were carried out on an untested fatigue sample.
The cross-section SEM–EDS images in Figure 7 highlight the rough, micro-undulated morphology of the PEO layer/alloy interface, as already pointed out by Figure 6. Moreover, EDS X-ray maps recorded on the polished cross-section (Figure 7) revealed a homogeneous distribution of phosphorus, zirconium, and oxygen in the PEO layer, due to incorporation of P- and Zr-based compounds from the electrolyte. Moreover, EDS maps also showed the presence of C (main constituent of the polymeric powder coating) as well as of Al- and Si-based compounds, typical inorganic fillers added to the powder coating top layer. Mechanical and fatigue properties of the polymeric top layer are not available. However, the effect of this type of layer on fatigue strength is usually considered negligible [11].
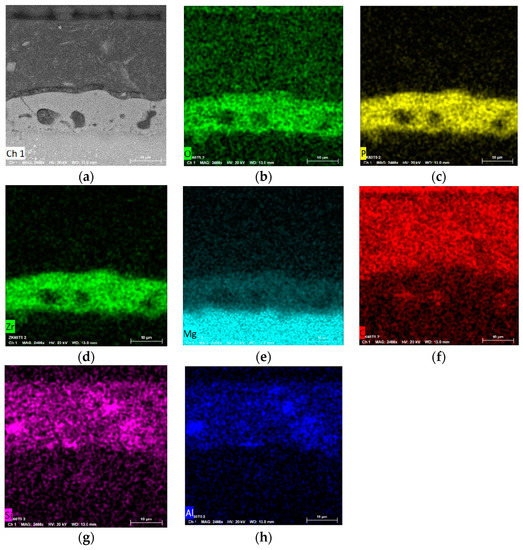
Figure 7.
SEM–EDS and X-ray EDS elemental maps of a polished cross section of the ZK60A coated alloy. SEM image of PEO and painting layers cross-section (a); X-ray EDS elemental maps of the PEO base layer and powder coating top layer (b–h). The SEM–EDS analyses were carried out on an untested fatigue sample.
3.2. Mechanical Behaviour
The results of the hardness tests, carried out on the polished cross-section of metallographic samples of the ZK60A-T5 magnesium alloy extracted from the tested fatigue samples, gave hardness values between 70 and 71 HB10, which correspond to about 73−74 HV according to ASTM E 140-07 [33].
The results of the rotating bending fatigue tests, carried out by a three-point rotating bending testing machine according to ISO 12107 [25], are reported in the S–N curves of Figure 8, corresponding to a failure probability of 10% and 50%. In fact, since fatigue tests are typically characterized by large scatter, due to several factors like material inhomogeneity or incorrect specimen alignment, statistical methods are necessary to evaluate the fatigue property of a material. Several approaches are reported in the standards [25], but usually for S–N curves, the mathematical analysis is performed to generate a curve corresponding to 50% probability of failure, although also other probabilities of failure (e.g., 10% or 90%) can be considered. According to the standard [25], the data at number of stresses represent a continuous single distribution that is log-normally distributed with constant variance as a function of stress; the failure probability represents the probability of failure of the tested material at a fixed stress within a defined number of loading cycles.
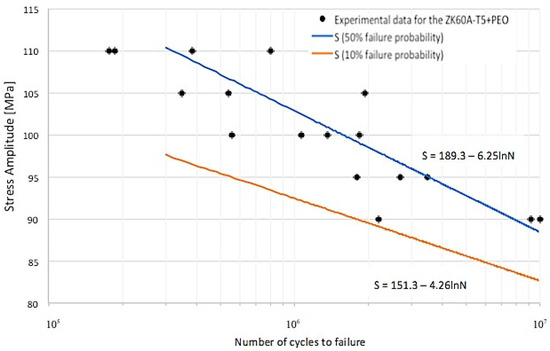
Figure 8.
Stress amplitude versus number of cycles to failure (S–N curves) of the PEO-treated and powder coated ZK60A-T5 alloy (ZK60A-T5 + PEO), showing the typical linear fatigue response: the two straight lines correspond to 50% and 10% fatigue failure probability.
The fatigue strength for 50% probability of failure was equal to 104 MPa at 106 cycles and 90 MPa at 107 cycles. A comparison of these data with the literature data for the forged ZK60A-T6 alloy without PEO treatment [7,34] is reported in Figure 9. Slight differences can be observed in the S–N curves (failure probability of 50%), due to the differences in the forging processes of the alloy. In fact, while in [7] the data refer to a multiaxial isothermal forged and T6 heat treated alloy, the data reported in [34] concern a uniaxial forged and T6 heat-treated alloy.
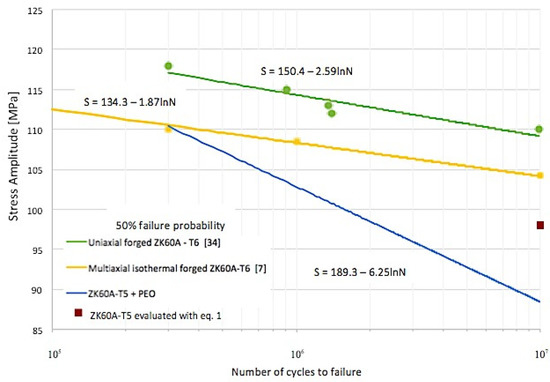
Figure 9.
Comparison of the stress amplitude versus number of cycles to failure (S–N curves) at 50% failure probability of the PEO-treated ZK60A-T5 alloy (ZK60A-T5 + PEO), the uniaxial forged untreated ZK60A-T6 alloy [34], and the multiaxial isothermal forged untreated ZK60A-T6 alloy [7]. The fatigue strength for the ZK60A-T5 at 107 cycles, evaluated with Equation (1), is also reported.
The comparison of the literature fatigue data for the untreated ZK60A-T6 alloy [7] with those obtained in the present study for the PEO-treated alloy (Figure 9) showed that PEO induced a 4% decrease in the alloy fatigue strength at 106 cycles (108 vs. 104 MPa) and a 14% decrease at 107 cycles (104 vs. 90 MPa). When comparing the fatigue behaviour of the PEO-treated alloy with those reported for the untreated substrate in [34], the reduction in fatigue strength was 8% at 106 cycles (113 vs. 104 MPa) and 17% at 107 cycles (108 vs. 90 MPa).
Similar results were also reported by Ceschini et al. [14] for the PEO-treated cast EV31A magnesium alloy, showing that the conversion treatment induced a 15% reduction in fatigue strength. Yerokhin et al. [10] also reported a fatigue strength reduction in the range 3–10% induced by PEO treatment on the extruded AZ21 alloy. Nemcova et al. [12], instead, showed a 35–40% reduction in fatigue properties of PEO-treated extruded AZ61 alloy compared to the untreated one. The detrimental influence of the PEO layer on fatigue behaviour of Mg alloys can be ascribed to a combination of factors leading to enhanced surface stresses: high defect density and microcracks in the coating as well as roughness of the alloy/coating interface (Figure 6 and Figure 7), which can produce multiple crack initiation sites [12].
According to [10,12,13,14], the reduction in fatigue strength, in fact, is mainly related to the intrinsic defectiveness of the ceramic conversion layer. The micro-discharges cause local melting of the growing oxide layer, inducing the formation of pores, microchannels, and microcracks, as well as the typical volcano-like surface features responsible for surface roughness increase. The subsequent very rapid solidification also generates tensile residual stresses that notoriously negatively affect fatigue strength.
In order to further confirm the previous assessments, an evaluation of the effect of PEO treatment on fatigue behaviour of the ZK60A-T5 alloy has been also carried out by comparing the results of fatigue tests with the fatigue strength of the untreated alloy evaluated from hardness data. According to [6], indeed, a good linear relationship can be established between rotating fatigue strength at 107 cycles and the hardness of different cast and wrought heat-treated magnesium alloys. The linear relationship between fatigue strength (Sf) and Vickers hardness of magnesium alloys is given by:
where HV is the Vickers hardness, and n is a coefficient generally equal to 1.32 and 1.66 for artificially and naturally aged alloys, respectively. On the basis of the fatigue strength and hardness values, the n coefficient for the PEO-treated ZK60A-T5 is approximately 1.21, which is about 10% lower than the value reported in [6] for artificially aged magnesium alloys. Therefore, the fatigue strength of the PEO-treated alloy is about 10% lower than the fatigue strength expected for an untreated alloy according to (1), that is equal to 98 MPa (Figure 9). This is in agreement with the results of the previous comparison of the experimental and literature fatigue data, respectively, for PEO-treated and untreated alloys.
Sf ≈ n·HV
3.3. Fracture Surfaces Analysis
Fractographic analyses were carried out firstly by 3D digital microscopy and then, by SEM. A representative low magnification micrograph of the fatigue fracture surface is reported in Figure 10. The surface is characterized by the presence of multiple and superficial nucleation sites, radial ratchet marks in the crack propagation region, and a rough feature in the final fracture zone due to overloading. The presence of the ratchet marks is a consequence of the multiple nucleation sites, since they develop when fatigue cracks, initiated at different positions and propagated in different planes, join together, creating steps on the fracture surface [35,36].
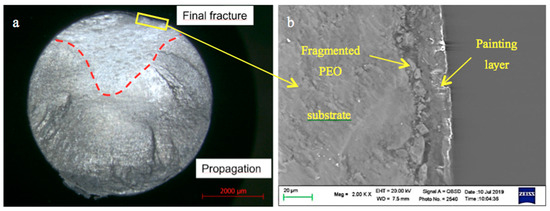
Figure 10.
Representative 3D digital microscopy of the fracture surface of a PEO-treated ZK60A-T5 fatigue sample tested at 100 MPa and failed after 1.5 × 10⁶ cycles (a); SEM image of the morphology of the PEO layer next to a crack nucleation site (b).
High magnification analyses of the nucleation sites (Figure 10b) pointed out the presence of zones with cracked, fragmented, and even detached PEO coating, which led to an increased roughness of the interface between substrate and PEO layer in comparison to the untested material. Therefore, the multiple nucleation sites, slightly below the specimen surface, could be the result of the synergic effect of the coating defects, tensile stresses in the substrate at the interface with the coating [10,12], and the increased roughness of the interface induced by fragmentation and debonding of the coating during cyclic loading. According to [11,12], in fact, not only tensile stresses in the substrate and coating defects, but also roughness at the interface, acting as a stress riser, can facilitate fatigue crack nucleation during cyclic loading.
Furthermore, the absence, next to the initiation sites, of typical forging defects (e.g., oxides), large intermetallics, or slip bands, that usually induce local stress concentration and the formation of cracks [36] confirms that the observed fatigue strength reduction is mainly due to the detrimental effect of the PEO layer whose typical microstructure facilitates crack nucleation.
A representative SEM image of the crack growth region is shown in Figure 11. The propagation zone (Figure 11a) shows the presence of classic fatigue striations, bright micro-cliffs, respectively, perpendicular and parallel to the direction of crack propagation [8,35], as well as secondary cracks probably due to the local strengthening of the matrix [8] or the activation of twinning during cycling loading [9]. Both for primary and secondary cracks, the crack path is mainly transgranular [12], as highlighted in the OM cross-sections in Figure 12.
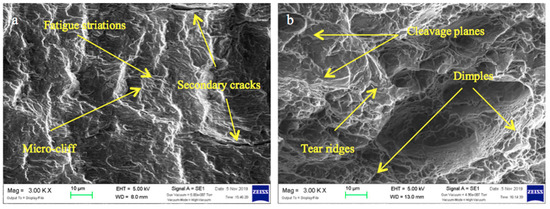
Figure 11.
Representative SEM images at high magnification of the crack growth region with fatigue striations and secondary cracks (a), and of the overloading region with dimples and cleavage planes (b). Fatigue samples tested at 100 MPa and failed after 1.5 × 10⁶ cycles.
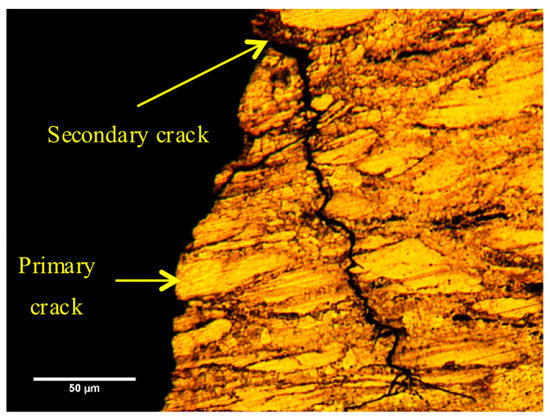
Figure 12.
OM image of a fracture surface cross section, highlighting the presence of transgranular secondary cracks. Fatigue samples tested at 95 MPa and failed after 3.5 × 10⁶ cycles.
SEM image of the overloading region in Figure 11b, instead, display a mixed morphology with quasi-cleavage features and zones with dimples and tear ridges, the latter typical of a ductile fracture [8].
4. Conclusions
The present study investigated the effect of PEO-treatment on fatigue behaviour of the ZK60A-T5 alloy by testing samples directly extracted from forged wheels under rotating bending conditions. The following conclusions can be drawn:
- The microstructure of the alloy was partially recrystallized, with zones of fine equiaxed grains mixed with un-recrystallized dendrites, the latter characterized by a higher amount of Zr than the recrystallized ones.
- The PEO coating was uniform but with the typical micro-defective structure of these layers such as pores, microcracks, and microchannels.
- The PEO-treatment induced a fatigue strength reduction in the range of 14–17% at 107 cycles compared to the literature data for the untreated alloy.
- The fatigue strength reduction is probably mainly related to the intrinsic defectiveness of the PEO and the residual tensile stresses generated during the treatment. These induce PEO layer fragmentation during cyclic loading, facilitating the formation of fatigue crack nucleation sites.
Author Contributions
Conceptualization, A.M., L.C., and C.M.; data curation, A.M. and A.B.; formal analysis, A.M., L.C., and C.M.; investigation, A.M. and A.B.; methodology, A.M., L.C., and C.M.; validation, A.M., C.M., and A.B.; writing—original draft, A.M. and A.B.; writing—review and editing, L.C. and C.M. All authors have read and agreed to the published version of the manuscript.
Funding
This research received no external funding.
Acknowledgments
This research did not receive any specific grant from funding agencies in the public, commercial, or not-for-profit sectors. We wish to thank Iuri Boromei at the Dept. of Industrial Engineering (University of Bologna) for SEM observations and EDS analyses of PEO-treated samples, as well as Andrea Morri for his support of experimental work. We also wish to thank Simone Messieri for providing fatigue samples.
Conflicts of Interest
The authors declare no conflict of interest.
References
- Li, Z.M.; Wang, Q.G.; Luo, A.A.; Peng, L.M.; Fu, P.H.; Wang, Y.X. Improved high cycle fatigue properties of a new magnesium alloy. Mater. Sci. Eng. A 2013, 582, 170–177. [Google Scholar] [CrossRef]
- Friedrich, H.; Schumann, S. Research for a “new age of magnesium” in the automotive industry. J. Mater. Process. Technol. 2001, 117, 276–281. [Google Scholar] [CrossRef]
- Pantelakis, S.G.; Alexopoulos, N.D.; Chamos, S.N. Mechanical performance evaluation of cast magnesium alloys for automotive and aeronautical applications. J. Eng. Mater. Technol. 2007, 129, 422–430. [Google Scholar] [CrossRef]
- Karparvarfard, S.M.H.; Shaha, S.K.; Behravesh, S.B.; Jahed, H.; Williams, B.W. Microstructure, texture and mechanical behavior characterization of hot forged cast ZK60 magnesium alloy. J. Mater. Sci. Technol. 2017, 33, 907–918. [Google Scholar] [CrossRef]
- Robson, J.D.; Paa-Rai, C. The interaction of grain refinement and ageing in magnesium–zinc–zirconium (ZK) alloys. Acta Mater. 2015, 95, 10–19. [Google Scholar] [CrossRef]
- Li, Z.; Wang, Q.; Luo, A.A.; Fu, P.; Peng, L. Fatigue strength dependence on the ultimate tensile strength and hardness in magnesium alloys. Int. J. Fatigue 2015, 80, 468–476. [Google Scholar] [CrossRef]
- Vasilev, E.; Linderov, M.; Nugmanov, D.; Sitdikov, O.; Markushev, M.; Vinogradov, A. Fatigue performance of Mg–Zn–Zr alloy processed by hot severe plastic deformation. Metals 2015, 5, 2316–2327. [Google Scholar] [CrossRef]
- Karparvarfard, S.M.H.; Shaha, S.K.; Behravesh, S.B.; Jahed, H.; Williams, B.W. Fatigue characteristics and modeling of cast and cast-forged ZK60 magnesium alloy. J. Mater. Sci. Technol. 2019, 118, 282–297. [Google Scholar] [CrossRef]
- Yang, F.; Yin, S.M.; Li, S.X.; Zhang, Z.F. Crack initiation mechanism of extruded AZ31 magnesium alloy in the very high cycle fatigue regime. Mater. Sci. Eng. A 2008, 491, 131–136. [Google Scholar] [CrossRef]
- Yerokhin, A.L.; Shatrov, A.; Samsonov, V.; Shashkov, P.; Leyland, A.; Matthews, A. Fatigue properties of keronite coatings on a magnesium alloy. Surf. Coat. Technol. 2004, 182, 78–84. [Google Scholar] [CrossRef]
- Khan, S.A.; Miyashita, Y.; Mutoh, Y.; Koike, T. Effect of anodized layer thickness on fatigue behavior of magnesium alloy. Mater. Sci. Eng. A 2008, 474, 261–269. [Google Scholar] [CrossRef]
- Nemcova, A.; Skeldon, P.; Thompson, G.E.; Morse, S.; Cizek, J.; Pacal, B. Influence of plasma electrolytic oxidation on fatigue performance of AZ61 magnesium alloy. Corros. Sci. 2014, 82, 58–66. [Google Scholar] [CrossRef]
- Blawert, C.; Bala, P. Plasma electrolytic oxidation treatment of magnesium alloy. In Surface Engineering of Light Alloys; Dong, H., Ed.; Woodhead Publishing Limited: Cambridge, UK, 2010; pp. 155–183. [Google Scholar]
- Ceschini, L.; Morri, A.; Angelini, V.; Messieri, S. Fatigue behavior of the rare earth rich EV31A Mg alloy: Influence of plasma electrolytic oxidation. Metals 2017, 7, 212. [Google Scholar] [CrossRef]
- Yerokhin, A.L.; Nie, X.; Leyland, A.; Matthews, A.; Dowey, S.J. Plasma electrolysis for surface engineering. Surf. Coat. Technol. 1999, 122, 73–93. [Google Scholar] [CrossRef]
- Chen, H.; Kang, S.B.; Yu, H.; Cho, J.; Kim, H.W.; Min, G. Effect of heat treatment on microstructure and mechanical properties of twin roll cast and sequential warm rolled ZK60 alloy sheets. J. Alloy Compd. 2009, 476, 324–328. [Google Scholar] [CrossRef]
- Whalen, S.; Overman, N.; Joshi, V.; Varga, T.; Graff, D.; Lavender, C. Magnesium alloy ZK60 tubing made by shear assisted processing and extrusion (ShAPE). Mater. Sci. Eng. A 2019, 755, 278–288. [Google Scholar] [CrossRef]
- Gao, X.; Nie, J.F. Characterization of strengthening precipitate phases in a Mg–Zn alloy. Scr. Mater. 2007, 56, 645–648. [Google Scholar] [CrossRef]
- Volkova, E.F. Microstructural and mechanical characterization of magnesium based alloy MA14 (ZK60 A): Evolution under deformation and heat treatment. WIT Trans. Built Environ. 2014, 137, 17–23. [Google Scholar]
- Sun, M.; Easton, M.A.; StJohn, D.H.; Wu, G.; Abbott, T.B.; Ding, W. Grain refinement of magnesium alloys by Mg–Zr Master Alloys: The role of alloy chemistry and Zr particle number density. Adv. Eng. Mater. 2013, 15, 373–378. [Google Scholar] [CrossRef]
- ASTM B91-17, Standard Specification for Magnesium-Alloy Forgings; ASTM International: West Conshohocken, PA, USA, 2017; Available online: http://www.astm.org/cgi-bin/resolver.cgi?B91 (accessed on 3 April 2020).
- ASTM B661-12, Standard Practice for Heat Treatment of Magnesium Alloys; ASTM International: West Conshohocken, PA, USA, 2012; pp. 1–5. Available online: http://www.astm.org/cgi-bin/resolver.cgi?B661-12 (accessed on 3 April 2020).
- ISO 6506-1:2014 Metallic Materials–Brinell Hardness Test–Part 1: Test Method; International Organization for Standardization: Brussels, Belgium, 2014; Available online: https://www.iso.org/obp/ui/#iso:std:iso:6506:-1:ed-3:v1:en (accessed on 22 March 2020).
- ISO 1143:2010 Metallic Materials–Rotating Bar Bending Fatigue Testing; International Organization for Standardization: Brussels, Belgium, 2010; Available online: https://www.iso.org/obp/ui/#iso:std:41875:en (accessed on 9 January 2020).
- ISO 12107:2012 Metallic Materials–Fatigue Testing–Statistical Planning and Analysis of Data; International Organization for Standardization: Brussels, Belgium, 2012. Available online: https://www.iso.org/obp/ui/#iso:std:iso:12107:ed-2:v1:en (accessed on 9 January 2020).
- Wang, C.Y.; Wang, X.J.; Chang, H.; Wu, K.; Zheng, M.Y. Processing maps for hot working of ZK60 magnesium alloy. Mater. Sci. Eng. A 2007, 464, 52–58. [Google Scholar] [CrossRef]
- Jamali, A.; Mahmudi, R. Evolution of microstructure, texture, and mechanical properties in a multidirectionally forged ZK60 Mg alloy. Mater. Sci. Eng. A 2019, 752, 55–62. [Google Scholar] [CrossRef]
- Hadadzadeh, A.; Mokdad, F.; Shalchi Amirkhiz, B.; Wells, M.A.; Williams, B.W.; Chen, D.L. Bimodal grain microstructure development during hot compression of a cast-homogenized Mg–Zn–Zr alloy. Mater. Sci. Eng. A 2018, 724, 421–430. [Google Scholar] [CrossRef]
- Ohishi, K.; Mendis, C.L.; Homm, T.; Kamado, S.; Ohkubo, T.; Hono, K. Bimodally grained microstructure development during hot extrusion of Mg–2.4 Zn–0.1 Ag–0.1 Ca–0.16 Zr (at.%) alloys. Acta Mater. 2009, 57, 5593–5604. [Google Scholar] [CrossRef]
- Arrabal, R.; Matykina, E.; Hashimoto, T.; Skeldon, P.; Thompson, G.E. Characterization of AC PEO coatings on magnesium alloys. Surf. Coat. Technol. 2009, 203, 2207–2220. [Google Scholar] [CrossRef]
- Ko, Y.G.; Namgung, S.; Shin, D.H. Correlation between KOH concentration and surface properties of AZ91 magnesium alloy coated by plasma electrolytic oxidation. Surf. Coat. Technol. 2010, 205, 2525–2531. [Google Scholar] [CrossRef]
- Gao, Y.; Yerokhin, A.; Parfenov, E.; Matthews, A. Application of Voltage Pulse Transient Analysis during Plasma Electrolytic Oxidation for Assessment of Characteristics and Corrosion Behaviour of Ca- and P-containing Coatings on Magnesium. Electrochim. Acta 2014, 149, 218–230. [Google Scholar] [CrossRef]
- ASTM E140-12b. Standard Hardness Conversion Tables for Metals Relationship among Brinell Hardness, Vickers Hardness, Rockwell Hardness, Superficial Hardness, Knoop Hardness, and Scleroscope Hardness; ASTM International: West Conshohocken, PA, USA, 2002; pp. 1–25. Available online: http://www.astm.org/cgi-bin/resolver.cgi?E140-12b (accessed on 18 May 2020).
- Shiozawa, K. Databook on Fatigue Strength of Metallic Materials; Elsevier: Amsterdam, The Netherlands, 1996. [Google Scholar]
- Sachs, N.W. Understanding the surface features of fatigue fractures: How they describe the failure cause and the failure history. J. Fail. Anal. Prev. 2005, 5, 11–15. [Google Scholar] [CrossRef]
- Becker, W.T.; Shipley, R.J. ASM Handbook: Failure Analysis and Prevention; ASM International: Materials Park, OH, USA, 2002; Volume 11, pp. 559–586. [Google Scholar]
Publisher’s Note: MDPI stays neutral with regard to jurisdictional claims in published maps and institutional affiliations. |
© 2020 by the authors. Licensee MDPI, Basel, Switzerland. This article is an open access article distributed under the terms and conditions of the Creative Commons Attribution (CC BY) license (http://creativecommons.org/licenses/by/4.0/).