Tribological Behavior of Ni-Based Coatings Deposited via Spray and Fuse Technique

Abstract
1. Introduction
2. Materials and Methods
3. Results and Discussion
3.1. Crystallographic Characterization
3.2. Microhardness
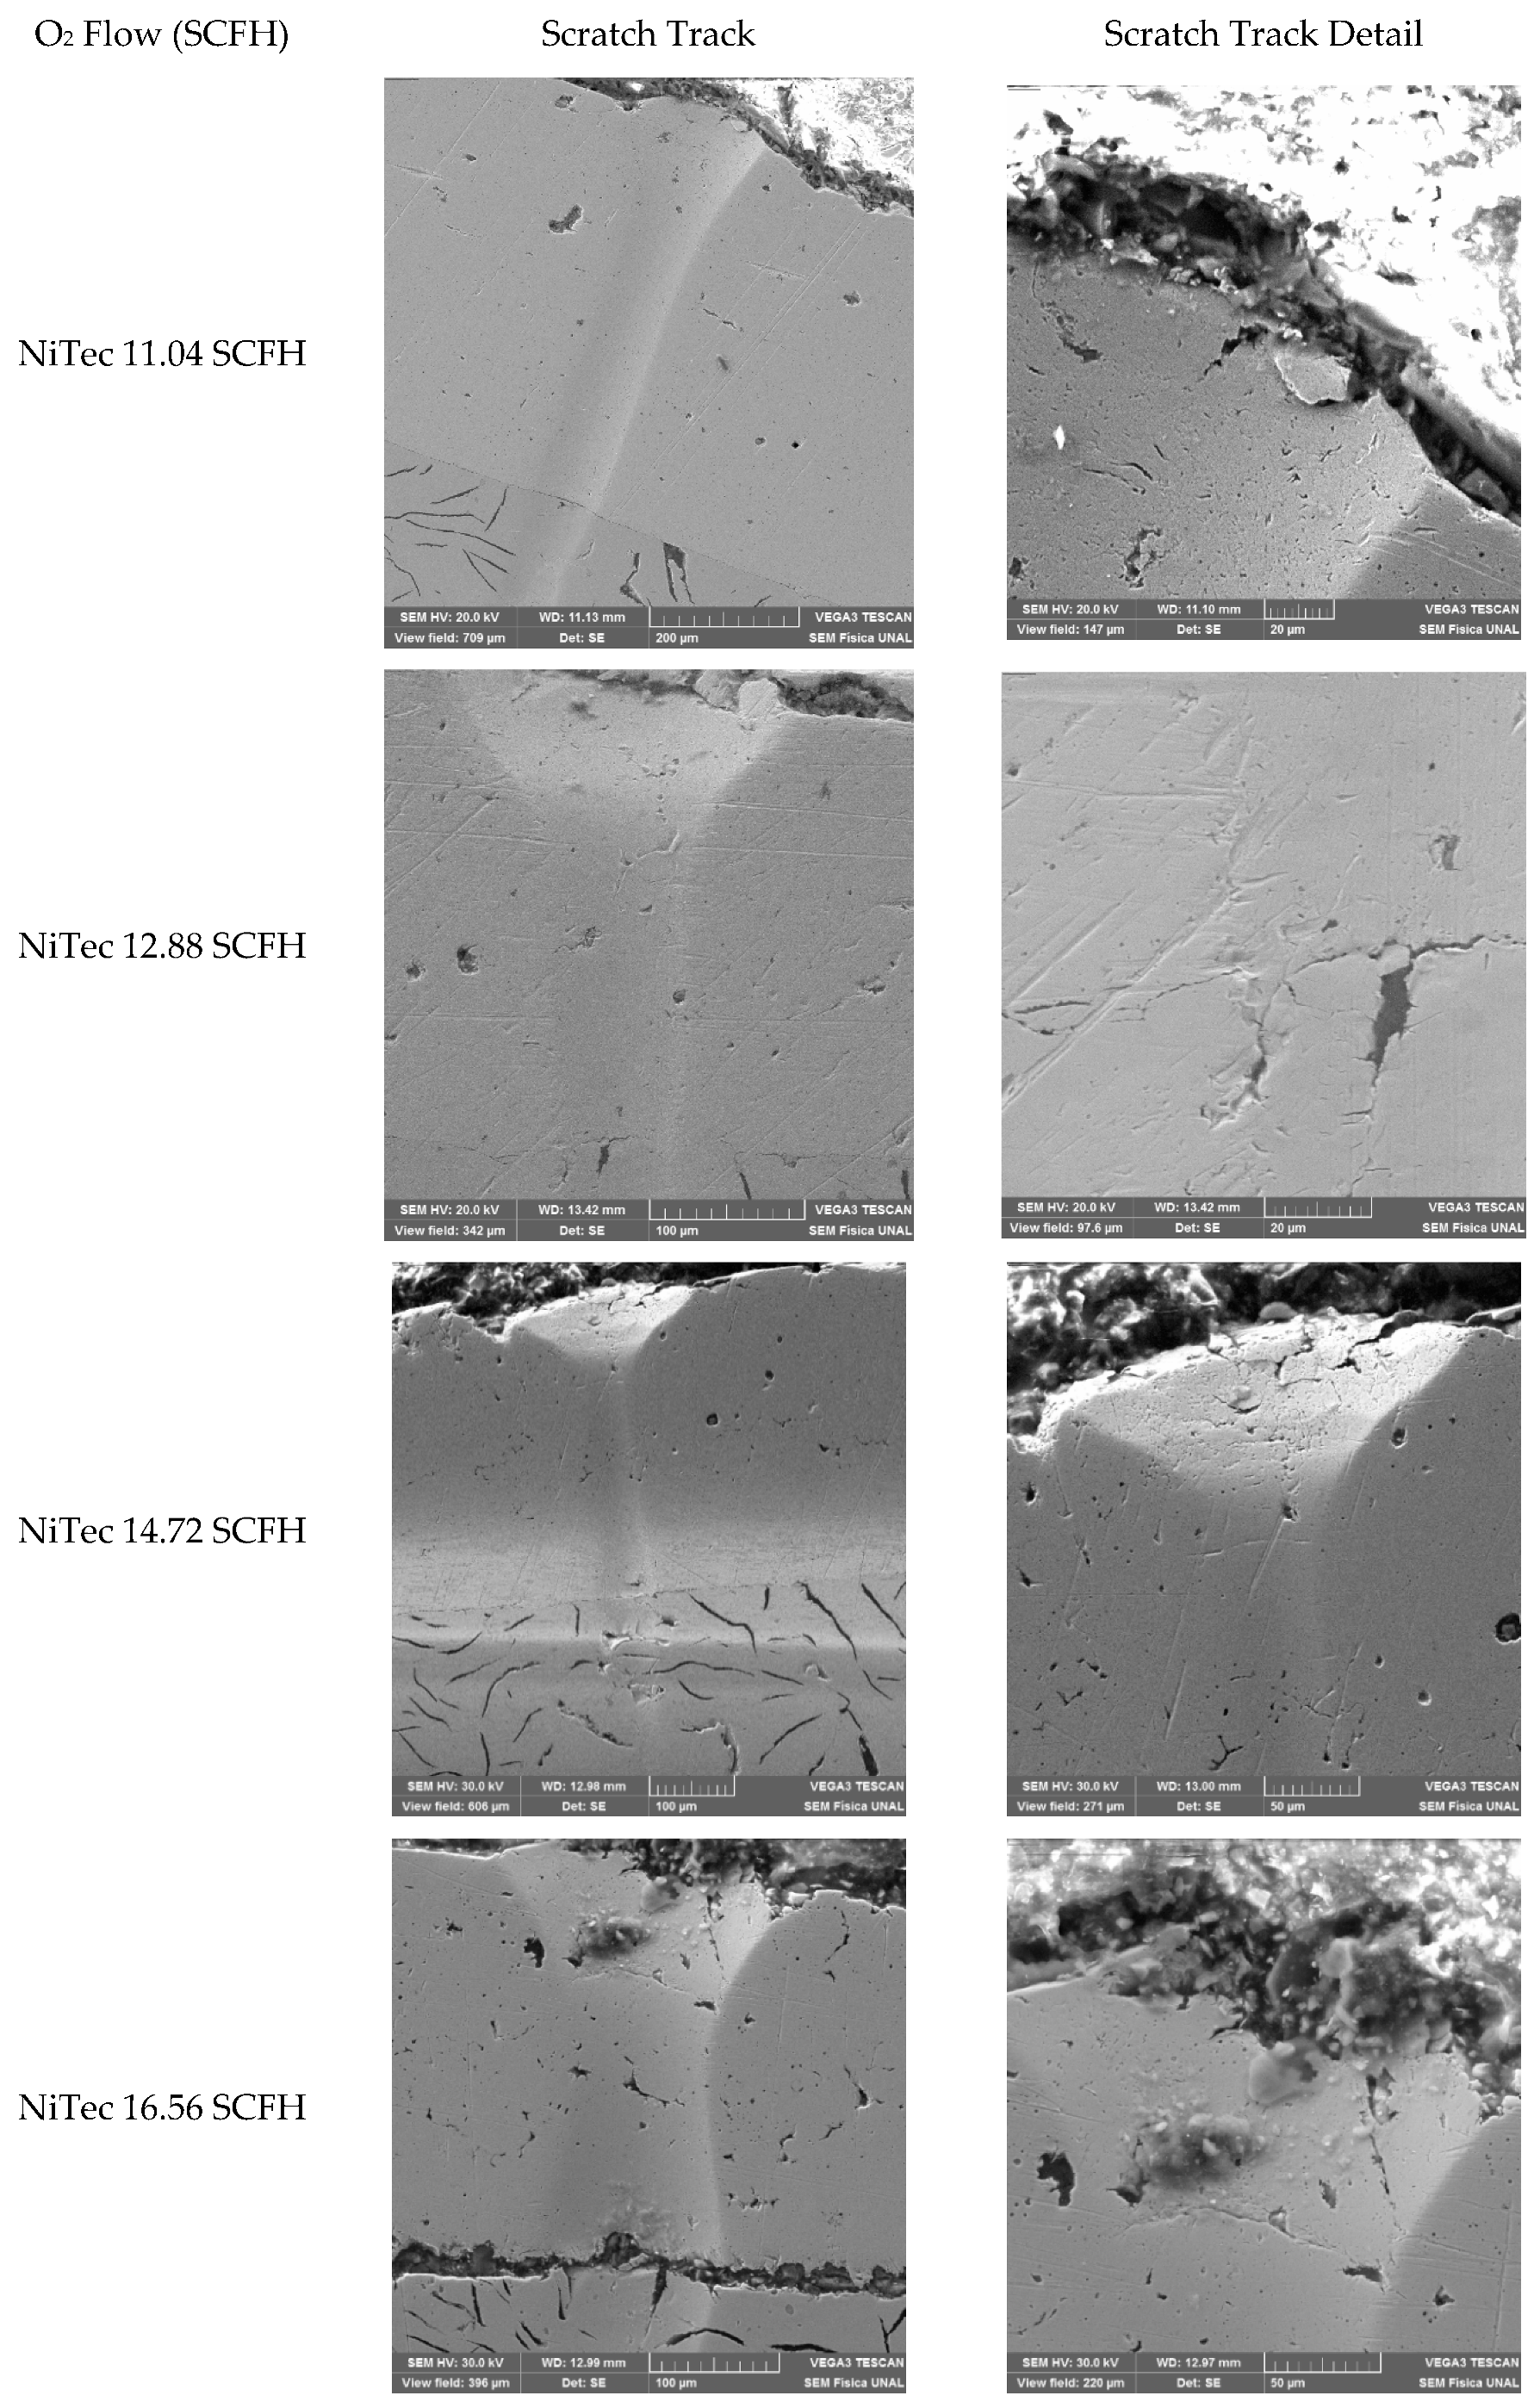
3.3. Scratch Test Results
3.4. Adhesive Wear
3.5. Abrasive Wear
4. Conclusions
- The coefficient of crystallographic orientation has the same value that the powder in all planes and have little variations with the oxygen flux.
- The values of surface microhardness have fluctuations with the oxygen flux that can be explain it for defects such as pores.
- Calculations that include the porosity shows that dislocation density determined the microhardness.
- The scratch test shows that the coatings deposited at high flux has adhesive–cohesive failure.
- Pin-on-disk tests, allowed determined that the worn volume, friction coefficient and wear coefficient are fluctuating with the oxygen flux.
Author Contributions
Funding
Acknowledgments
Conflicts of Interest
References
- Kim, H.J.; Hwang, S.Y.; Lee, C.H.; Juvanon, P. Assessment of wear performance of flame sprayed and fused Ni-based coatings. Surf. Coat. Technol. 2003, 172, 262–269. [Google Scholar] [CrossRef]
- Giacomantonio, M.; Gulizia, S.; Jahedi, M.; Wong, Y.; Moore, R.; Valimbert, M. Heat treatment of thermally sprayed Ni-based wear and corrosion coatings. Mater. Forum 2011, 35, 48–55. [Google Scholar]
- Jing, Y.; Bo, S. Friction and wear behavior of a Ni-based alloy coating fabricated using a multistep induction cladding technique. Results Phys. 2018, 11, 105–111. [Google Scholar]
- Fazel, M.; Jazi, M.G.; Bahramzadeh, S.; Bakhshi, S.R.; Ramazani, M. Effect of solid lubricant particles on room and elevated temperature tribological properties of Ni–SiC composite coating. Surf. Coat. Technol. 2014, 254, 252–259. [Google Scholar] [CrossRef]
- Sugiarti, E.; Destyorini, F.; Zaini, K.A.; Wang, Y.; Hashimoto, N.; Ohnuki, S.; Hayashi, S. Characterization of Ni-based coatings on carbon steel by electron microscopy. Surf. Coat. Technol. 2015, 265, 68–77. [Google Scholar] [CrossRef]
- Wang, C.; Gao, Y.; Zeng, Z.; Fu, Y. Effect of rare-earth on friction and wear properties of laser cladding Ni-based coatings on 6063Al. J. Alloy. Compd. 2017, 727, 278–285. [Google Scholar] [CrossRef]
- Lee, L.; Behera, P.; Sriraman, K.R.; Chromik, R.R. The effect of contact stress on the sliding wear behaviour of Zn-Ni electrodeposited coatings. Wear 2018, 400, 82–92. [Google Scholar] [CrossRef]
- ASTM G65, Standard Test Method for Measuring Abrasion Using the Dry Sand/Rubber Wheel Apparatus, Active Standard ASTM G65 | Developed by Subcommittee: G02.30 Book of Standards Volume: 03.02. Available online: https://www.astm.org/Standards/G65 (accessed on 22 September 2020).
- ASTM G99–04, Standard Test Method for Wear Testing with a Pin-on-Disk Apparatus. Available online: https://reference.globalspec.com/standard/3815788/astm-g99-04 (accessed on 22 September 2020).
- Jiménez, H.; Olaya, J.J.; Alfonso, J.E.; Pineda-Vargas, C.A. Corrosion resistance of Ni-based coatings deposited by spray and fuse technique varying oxygen flow. Surf. Coat. Technol. 2017, 321, 341–349. [Google Scholar] [CrossRef]
- Rusu, D.I.; Rusu, G.G.; Luca, D. Structural characteristics and optical properties of thermally oxidized Zinc films. Acta Phys. Pol. A 2011, 119, 850–856. [Google Scholar] [CrossRef]
- Jang, B.K.; Matsubara, H. Influence of porosity on hardness and Young’s modulus of nanoporous EB-PVD TBCs by nanoindentation. Mater. Lett. 2005, 59, 3462–3466. [Google Scholar] [CrossRef]
- Balak, Z.; Zakeri, M.; Rahimipur, M.R.; Salahi, E.; Nasiri, H. Effect of open porosityon flexural strength and hardness of ZrB2-based composites. Ceram. Int. 2015, 41, 8312–8319. [Google Scholar] [CrossRef]
- Paneto, F.J.; Pereira, J.L.; Lima, J.O.; Jesus, E.J.; Silva, L.A.; Lima, E.S.; Cabral, R.F.; Santos, C. Effect of porosity on hardness of Al2O3–Y3Al5O12 ceramic composite. Int. J. Refract. Met. Hard Mater. 2015, 48, 365–368. [Google Scholar] [CrossRef]
- Sheng-Nian Luo, J.G.; Swadener, C.M.; Oliver, T. Examining crystallographic orientation dependence of hardness of silica stishovite. Phys. B 2007, 399, 138–142. [Google Scholar]
- Roa, J.J.; Fargas, G.; Mateo, A.; Jiménez-Piqué, E. Dependence of nanoindentation hardness with crystallographic orientation of austenite grains in metastable stainless steels. Mater. Sci. Eng. A 2015, 645, 188–195. [Google Scholar] [CrossRef]
- Vencl, A.; Arostegui, S.; Favaro, G.; Zivic, F.; Mrdak, M.; Mitrović, S.; Popovic, V. Evaluation of adhesion/cohesion bond strength of the thick plasmas pray coatings by scratch testing on coatings cross-sections. Tribol. Int. 2011, 44, 1281–1288. [Google Scholar] [CrossRef]
- Nohava, J. Characterization of Thermal Spray Coatings by Instrumented Indentation and Scratch Testing: Part I; CSM Instruments: Peseux, Switzerland, 2009. [Google Scholar]
- Saastamoinen, A.; Kaijalainen, A.; Porter, D.; Suikkanen, P.; Yang, J.R.; Tsai, Y.T. The effect of finish rolling temperature and tempering on the microstructure, mechanical properties and dislocation density of direct quenched Steel. Mater. Charact. 2018, 139, 1–10. [Google Scholar] [CrossRef]
- He, S.H.; He, B.B.; Zhu, K.Y.; Huang, M.X. Evolution of dislocation density in bainitic steel: Modeling and experiments. Acta Mater. 2018, 149, 46–56. [Google Scholar] [CrossRef]
- Rodrigues, A.C.P.; Yonamine, T.; Sinatora, A.; Azevedo, C.R.F. Pin-on-disc tribotests with the addition of Cu particles as an interfacial media: Characterization of disc tribo surfaces using SEM-FIB techniques. Tribol. Int. 2016, 100, 351–359. [Google Scholar] [CrossRef]
- Rahaman, M.L.; Zhang, L.; Liu, M.; Liu, W. Surface roughness effect on the friction and wear of bulk metallic glasses. Wear 2015, 332–333, 1231–1237. [Google Scholar] [CrossRef]
- Mohanty, M.; Smith, R.W.; de Bonte, M.; Celis, L.P.; Lugscheider, E. Sliding wear behavior of thermally sprayed 75/25 Cr3C2/NiCr wear resistant coatings. Wear 1996, 198, 251–266. [Google Scholar] [CrossRef]
- Gopi, V.; Sellamuthu, R.; Arul, S. Measurement of hardness, wear rate and coefficient of friction of surface refined Al-Cu alloy. Procedia Eng. 2014, 97, 1355–1360. [Google Scholar] [CrossRef]
- Trevisiol, C.; Jourani, A.; Bouvier, S. Effect of hardness, microstructure, normal load and abrasive size on friction and on wear behaviour of 35NCD16 steel. Wear 2017, 388–389, 101–111. [Google Scholar] [CrossRef]
- Buckley, D.H. The Influence of Crystal Structure, Orientation and Solubility on the Adhesion and Sliding Friction of Various Metal Single Crystals in Vacumm; NASA Technical Memorándum: Hampton, Virginia, 1966. [Google Scholar]
- Kovaříková, I.; Szewczyková, B.; Blaškoviš, P.; Hodúlová, E.; Lechovič, E. Study and Characteristic of Abrasive Wear Mechanisms; Institute of Production Technologies, Faculty of Materials Science and Technology, Slovak University of Technology: Bratislava, Slovakia, 2009. [Google Scholar]
- Melendez, N.M.; Narulkar, V.V.; Fisher, G.A.; McDonald, A.G. Effect of reinforcing particles on the wear rate of low-pressure cold-sprayed WC-based MMC coatings. Wear 2013, 306, 185–195. [Google Scholar] [CrossRef]
- Zhang, L.; Qu, X.H.; Duan, B.H.; He, X.B.; Qin, M.L. Effect of porosity on wear resistance of SiCp/Cu composites prepared by pressureless infiltration. Trans. Nonferrous Met. Soc. China 2008, 18, 1076–1082. [Google Scholar] [CrossRef]
- Nair, S.; Sellamuthu, R.; Saravanan, R. Effect of nickel content on hardness and wear rate of surface modified cast aluminium bronze alloy. Mater. Proc. 2018, 5, 6617–6625. [Google Scholar]


| Torch | SuperJet Eutalloy | |||
|---|---|---|---|---|
| O2 Pressure (Psi) | 39 | |||
| C2H2 Pressure (Psi) | 7 | |||
| O2 Flow (SCFH) | 11.04 | 12.88 | 14.72 | 16.56 |
| C2H2 Flow (SCFH) | 14.64 | |||
| Powder composition | Ni + 5% Fe, B, Si | |||
| Powder code | Eutalloy 10,224 (NiTec) | |||
| Powder size (µm) | 140 + 120 | |||
| Spray-Fuse distances (mm) | 150–50 | |||
| Nozzle | B2 | |||
| Sample | Average Microhardness (MPa) |
|---|---|
| Substrate | 3475.48 ± 54.21 |
| NiTec (reported hardness) | 2354 * |
| (11.04 SCFH) | 2104.72 ± 42.16 |
| (12.88 SCFH) | 2055.26 ± 48.32 |
| (14.72 SCFH) | 2128.91 ± 51.15 |
| (16.56 SCFH) | 1708.54 ± 47.43 |
| O2 Flow (SCFH) | Scratch Test Load (N) | Cone Projected Area Ac (µm2) | Coefficient of Variation Cv (%) | Kind of Failure |
|---|---|---|---|---|
| 11.04 | 5 | 8379 | 16.12 | Cohesive |
| 10 | 15,361.5 | 18.16 | Cohesive | |
| 15 | 19,511 | 19.21 | Cohesive | |
| 12.88 | 5 | 13,857.5 | 18.33 | Cohesive |
| 10 | 20,570 | 20.12 | Cohesive | |
| 15 | 32,448 | 16.42 | Cohesive | |
| 14.72 | 5 | 5675.8 | 20.1 | Cohesive |
| 10 | 13,050 | 19.62 | Cohesive | |
| 15 | 27,072 | 14.85 | Cohesive | |
| 16.56 | 5 | 18,447.5 | 21.33 | Adhesive-cohesive |
| 10 | 28,318.5 | 18.85 | Adhesive-cohesive | |
| 15 | 30,846 | 19.33 | Adhesive-cohesive |
| Zone | Element | Unn. C. (wt.%) | Norm. C. (wt.% ) | Atom. C. (at.% ) | (1. Sigma) (wt.% ) |
|---|---|---|---|---|---|
| 1 | Ni | 78.17 | 83.52 | 61.18 | 2.03 |
| O2 | 12.14 | 12.97 | 34.87 | 2.76 | |
| Fe | 1.74 | 1.86 | 1.43 | 0.10 | |
| Si | 1.54 | 1.65 | 2.52 | 0.15 | |
| 2 | Ni | 83.28 | 94.92 | 87.58 | 2.17 |
| Si | 2.88 | 3.28 | 6.32 | 0.22 | |
| O2 | 1.58 | 1.80 | 6.10 | 0.78 | |
| 3 | Ni | 68.29 | 85.33 | 65.20 | 1.78 |
| O2 | 8.61 | 10.76 | 30.17 | 2.12 | |
| Fe | 1.64 | 2.04 | 1.64 | 0.10 | |
| Si | 1.50 | 1.87 | 2.98 | 0.15 |
| Muestra | Vdes (mm3) | K | COF |
|---|---|---|---|
| NiTec (11.04 SCFH) | 0.156 ± 0.012 | 7.32 × 10⁻⁷ ± 0.03 | 0.713 ± 0.013 |
| NiTec (12.88 SCFH) | 0.166 ± 0.051 | 8.15 × 10⁻⁷ ± 0.12 | 0.692 ± 0.021 |
| NiTec (14.72 SCFH) | 0.021 ± 0.042 | 1.02 × 10⁻⁷ ± 0.16 | 0.564 ± 0.015 |
| NiTec (16.56 SCFH) | 0.195 ± 0.033 | 9.57 × 10⁻⁷ ± 0.17 | 0.604 ± 0.006 |
| Sample | Mass Loss (g) | Wear Volume (mm3) | Wear Coefficient K (×10−3) | Wear Rate W (×10−4 mm3/Nm) |
|---|---|---|---|---|
| Substrate | 1.6082 ± 0.0064 | 223.36 ± 0.02 | 2.7 | - |
| NiTec (11.04 SCFH) | 1.8401 ± 0.0025 | 206.75 ± 0.06 | 1.5 | 7.2 ± 0.3 |
| NiTec (12.88SCFH) | 1.8634 ± 0.0037 | 209.37 ± 0.01 | 1.5 | 7.3 ± 0.1 |
| NiTec (14.72 SCFH) | 1.6665± 0.0152 | 187.25 ± 0.02 | 1.4 | 6.5 ± 0.1 |
| NiTec (16.56 SCFH) | 2.3186± 0.0108 | 260.52 ± 0.04 | 1.6 | 9.2 ± 0.2 |
Publisher’s Note: MDPI stays neutral with regard to jurisdictional claims in published maps and institutional affiliations. |
© 2020 by the authors. Licensee MDPI, Basel, Switzerland. This article is an open access article distributed under the terms and conditions of the Creative Commons Attribution (CC BY) license (http://creativecommons.org/licenses/by/4.0/).
Share and Cite
Hernando, J.; Jairo, O.J.; Edgar, A.J. Tribological Behavior of Ni-Based Coatings Deposited via Spray and Fuse Technique. Coatings 2020, 10, 1080. https://doi.org/10.3390/coatings10111080
Hernando J, Jairo OJ, Edgar AJ. Tribological Behavior of Ni-Based Coatings Deposited via Spray and Fuse Technique. Coatings. 2020; 10(11):1080. https://doi.org/10.3390/coatings10111080
Chicago/Turabian StyleHernando, Jiménez, Olaya Jhon Jairo, and Alfonso José Edgar. 2020. "Tribological Behavior of Ni-Based Coatings Deposited via Spray and Fuse Technique" Coatings 10, no. 11: 1080. https://doi.org/10.3390/coatings10111080
APA StyleHernando, J., Jairo, O. J., & Edgar, A. J. (2020). Tribological Behavior of Ni-Based Coatings Deposited via Spray and Fuse Technique. Coatings, 10(11), 1080. https://doi.org/10.3390/coatings10111080