Article

Non-Destructive Monitoring of P. fluorescens and S. epidermidis Biofilm under Different Media by Fourier Transform Infrared Spectroscopy and Other Corroborative Techniques

1
Department of Biotechnology, Chemistry and Pharmacy, University of Siena, Via A. Moro 2, 53100 Siena, Italy
2
Procter & Gamble Ltd.—Newcastle Innovation Centre, Whitley Road, Longbenton, Newcastle upon Tyne NE12 9BZ, UK
*
Authors to whom correspondence should be addressed.
Both authors contributed equally to this work.
Coatings 2020, 10(10), 930; https://doi.org/10.3390/coatings10100930
Submission received: 4 September 2020 / Revised: 24 September 2020 / Accepted: 25 September 2020 / Published: 28 September 2020
(This article belongs to the Special Issue Antibacterial Coatings and Biofilm)

Abstract

:
In the present study, the early stage of bacteria biofilm formation has been studied as a function of different nutrients. Infrared spectra of Pseudomonas fluorescens (PF) and Staphylococcus epidermidis (SE), on germanium ATR crystal, were collected under deionized water H2O, phosphate buffered solution (PBS) and PBS with glucose (PBS-G). In H2O, protein bands of PF increased while, no difference in PBS and PBS-G were observed until 135 min. SE strain showed a low sensitivity to PBS composition starting to expose proteins on surfaces after 120 min. SE shows a low polysaccharides increase in H2O while, in bare and enriched PBS their intensity increases after 120 and 75 min. in PBS and PBS-G respectively. PF exhibits a peculiar behavior in H2O where the saccharide bands increased strongly after 100 min, while under all the other conditions, the intensity of polysaccharide bands increased up to the plateau probably because the layer of the biofilm exceeded the penetration capability of FTIR technique. All data suggest that, under lack of nutrients, both the bacteria tend to firmly anchor themselves to the support using proteins.

1. Introduction

Most bacteria, when propagated in static liquid culture, grow within the broth phase or quickly sediment to the bottom. External environmental conditions deeply affect the success in surface colonization and the consequent pathogenesis of biofilm related infections [1,2,3,4,5]. Bacteria are equipped to live at the solid–liquid interface using their flagella, pili, exopolysaccharides, and other adhesive components, often using also external environmental substances. Indeed, bacteria are able to respond to environmental stimuli, by appropriately changing their metabolism and producing extracellular polymeric substances (EPS) that permit a prompt formation of surface-related bacterial communities [6,7]. Metals [8], nanoparticles [9], extracellular DNA [10], and different media [6,7] induce changes in polysaccharides, proteins, and extracellular DNA composing the EPS [11]. Several studies have highlighted the influence of external environment also on attached bacteria in terms of metabolic cascades and cell–cell communications that differ significantly from what observed in a planktonic state [12,13]. Even though the extensive scientific literature on the influence of external environment in several biofilm processes, the signals that influence the system at a very beginning state, promoting surface attachment and growing, are not yet clear. When attached to the surfaces, bacteria can be seen as highly heterogeneous communities that exhibit complex biochemical processes. Their development involves initial attachment of the microorganism to the surface, the formation of microcolonies, and, finally, differentiation of microcolonies into exopolysaccharide-encased mature biofilms [7,8]. Limited to the early stage of bacteria attachment and EPS development, several components play a key role as polysaccharides, proteins and lipids [14]. Polysaccharides play a fundamental role in the biofilm’s matrix. Some of the most common polysaccharides are cellulose, Psl, Pel, alginate, and the staphylococcal polysaccharide intercellular adhesin [15,16,17,18,19]. Proteins also play a critical role and, in some cases, are present at higher concentrations than polysaccharides [20,21]. Common proteins present in the matrix are amyloid fiber [22]. Knowing how proteins and polysaccharides change under different stimuli is fundamental to understand the biofilm evolution. In fact, biofilm phenotype is not only different from the planktonic phenotype, but it changes during the biofilm development as a function of external physico-chemical stimuli [7,8,9,10,23]. The whole picture of biofilm formation is extremely challenging because of the inherent complexity and the multifactorial dependence of bacterial biofilm. In fact, not only different bacterial species may form different biofilm structures under identical conditions, but also the same bacterial species may form different biofilm structures under different environmental conditions. Pseudomonas aeruginosa forms mushroom-shaped microcolonies when it grows in the presence of glucose medium, whereas it forms flat biofilms when in citrate medium [24].
ATR-FTIR spectroscopy has proven to be a useful analytical tool for monitoring biofilms in situ, being non-destructive, in real-time and under fully hydrated conditions technique [11,19,25,26,27,28,29]. Boualam et al. [30] showed that ATR-FTIR technique permitted to differentiate biofilms as a function of water samples containing variable quantities of biodegradable organic matter.
This work focus on the study of the early stages of bacteria attachment to germanium crystal surface, using attenuated total reflectance Fourier transform infrared (ATR-FTIR) technique. A detailed analysis of the whole spectral profile of bacteria under study has been performed to gain more insight at the molecular level into biochemical and physiological changes during the early stages of biofilm development. In fact, through the analysis of the whole spectra of the bacteria, it is possible to monitor spectra changes, even weak, induced by metabolic changes induced by environmental changes [22]. Pseudomonas fluorescens (PF) and Staphylococcus epidermidis (SE) bacteria were chosen as a model because of their inclination to be surface bound in diverse environmental conditions. In particular, PF, a Gram-negative bacterium, was chosen as the reference Gram-negative bacterium for the following reasons: (i) It is present in drinking water distribution networks [31], (ii) can be grown in low-nutrient situations [32], (iii) is used in a standard procedure for measurement of assimilable organic carbon in water [32], and (iv) has been widely used in model bacterial surface colonization studies [2,15,26,33]. SE, a Gram-positive bacterium, was picked because: (i) It is an opportunistic agent possessing an intrinsic pathogenic character [34], (ii) is part of the normal mucosa and skin microflora, and (iii) is the causative agent in numerous invasive and toxigenic diseases [34].

2. Materials and Methods

2.1. Materials

All reagents, salts, nutrients, agar (analytical grade), and solvents (HPLC grade) were purchased from Sigma-Aldrich (Milan, Italy) and used without any additional purification. Non-pathogenic strain of Pseudomonas fluorescens was purchased from the Leibniz Institute DSMZ-German Collection of Microorganisms and Cells Cultures (Braunschweig, Germany). Staphylococcus epidermidis NCTC 11,047 Lenticule® discs were purchased from Sigma Aldrich company.

2.2. Media Used and Their Preparation

H2O: Deionized water, freshly made by Acquinity P/7 apparatus (MembraPure GmbH, Berlin, Germany)
PBS: Phosphate Buffer Saline PBS for microbiology (catalogue n° P3813 Sigma Aldrich) was dissolved in deionized water according to the instruction. The final pH was 7.5.
PBS-G: Was prepared by adding glucose to a PBS solution to a final concentration of 2.5 g/L. The final pH was 7.5.
All media were autoclaved at 121 °C for 21 min prior to use.

2.3. Bacteria Cultivation

Lyophilized bacteria pellets were rehydrated adding 4 mL of sterile Tryptic soy broth (TSB) media. After 30 min, the bacteria suspensions were gently mixed. 0.5 mL of each bacterial suspension were collected and transferred to Petri dishes containing nutrient agar to permit the growth of bacterial colonies. PF was incubated at room condition (21 ± 2 °C) under laminar chamber whereas SE was incubated at 36 °C till colonies formation on the agar plate are evident. Then, a loopful of bacterial biomass was transferred from the nutrient agar plate to fresh 100% TSB medium and incubated for 24 h. Optical density for Pseudomonas strain at 570 nm (OD 570) and Staphylococcus at 600 nm (OD 600) have been measured to monitor bacterial growth.

2.4. Planktonic P. fluorescens and S. epidermidis Preparation for ATR Analysis

TSB media bacteria suspension were centrifuged for 10 min at 4000 rpm. The supernatant was discarded, the pellet was resuspended in desired medium and the optical density was reduced to 0.23 by adding appropriate volume of media. The final suspension has been used for experiment without any additional treatment.
Comparison of bacteria at the beginning and after 180 min in contact with the media of interest have been performed drying the bacteria on the ATR crystal using a homemade top, equipped with a diffusor able to flow dry nitrogen homogeneously onto ATR crystal surface. Drying take about 5 min at a temperature of 23 ± 2 °C. Three repetitions of ATR spectra measurement were performed for each bacteria and media system.

2.5. Spectroscopy Study

All the samples were analyzed using a Nicolet IS50 FTIR spectrophotometer (Thermo Nicolet Corp., Madison, WI, USA), equipped with nine-reflection germanium ATR crystal (Pike 16154, Pike Technologies) and a deuterated-triglycine sulphate (DTGS) detector [35]. Before each experiment Ge crystal was treated with 70% ethanol overnight and dried under a flow of sterilized nitrogen. Typically, 128 scans at a resolution of 4 cm−1 in the range of 4000–800 cm−1 were recorded. The frequency scale was internally calibrated with a helium–neon reference laser to an accuracy of 0.01 cm−1. OMNIC software (OMNIC software system Version 9.8 Thermo Nicolet) was used for spectra manipulation. MinMax normalization was applied to the spectra where they are first offset-corrected by setting the minimum intensity of the whole spectrum, or of a defined spectral region, to zero. Spectra are then scaled with the maximum intensity value equaling to one and a piecewise baseline correction was performed. Baseline is obtained by several user-defined points which are connected by straight lines. Correction is achieved by subtracting the baseline from the sample spectrum. Chosen points are the same for all the spectra [36]. The second derivative of the FTIR spectra were calculated using the Savitsky–Golay method (29 points and third-degree polynomial) by OMNIC software (Thermo Nicolet Corp., Madison, WI, USA).

2.6. Adhesion Assay

Adhesion of bacteria was quantified by using a crystal violet method (CV). The experiments have been performed on the same bacterial suspension used for spectroscopy studies and using the same experimental conditions, together with control samples (TSB medium). CV has been made as described by Genevaux et al. [37] with minor modifications. Briefly, each bacterial strain suspended in the media of interest was monitored for 240 min (early stage) to follow biofilm growth using a rapid screening method in 96-well microliter plates. At predefined time, unbound cells were removed by vigorous washing for 5 times with PBS buffer. Then, 200 µL of 0.1% aqueous CV was added to each well and the plate was left to stand for 30 min, then, 180 µL of each well was aspirated again and each well was washed 5 times with large amount of water. Finally, CV bound biofilm was eluted by adding 200 µL of 96% ethanol to each well and left to stand for 30 min before reading it with a micro-plate reader at 540 nm using Biotrak II (Amersham Bioscience).
O-safranin assay (SN) was carried out at the end of spectroscopy study. The amount of formed biofilm was quantified by staining samples with 0.1% of safranin (incubation time: 10 min). Then, each sample was vigorously washed 5 times with PBS and photographed by a digital camera (Olympus Camedia C2000Z, Olympus Corporation Tokyo, Japan)

3. Results and Discussion
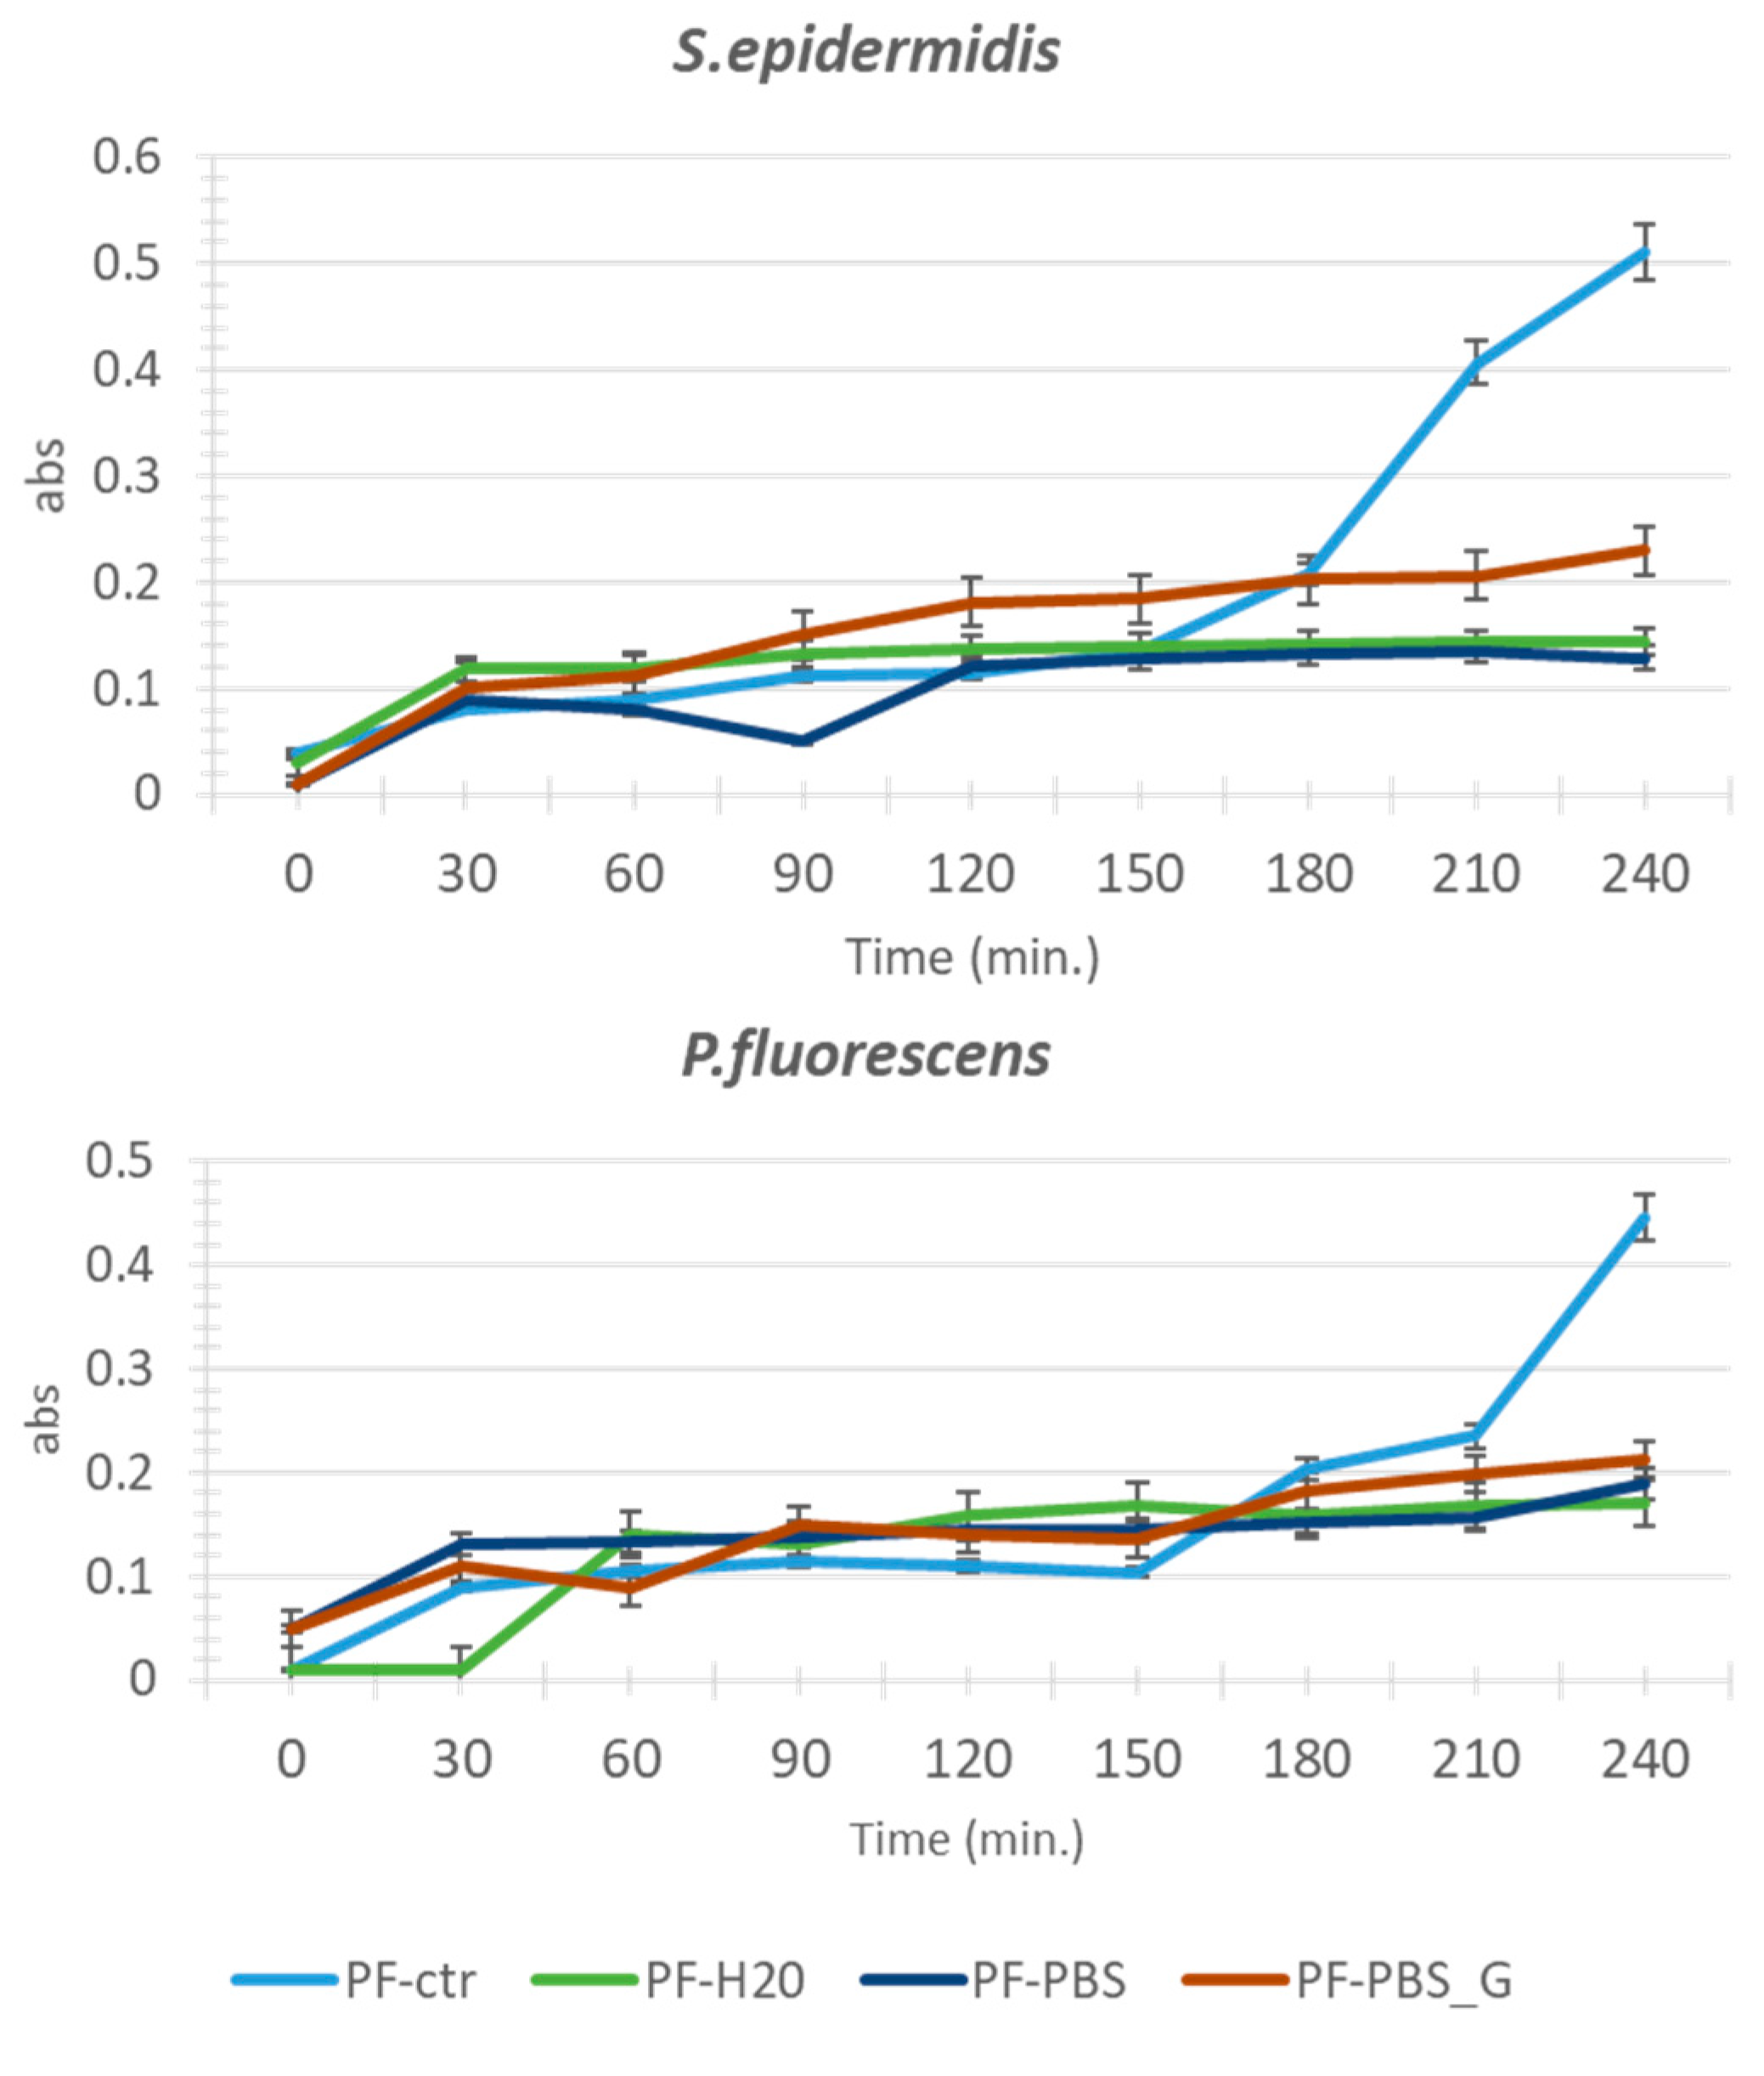
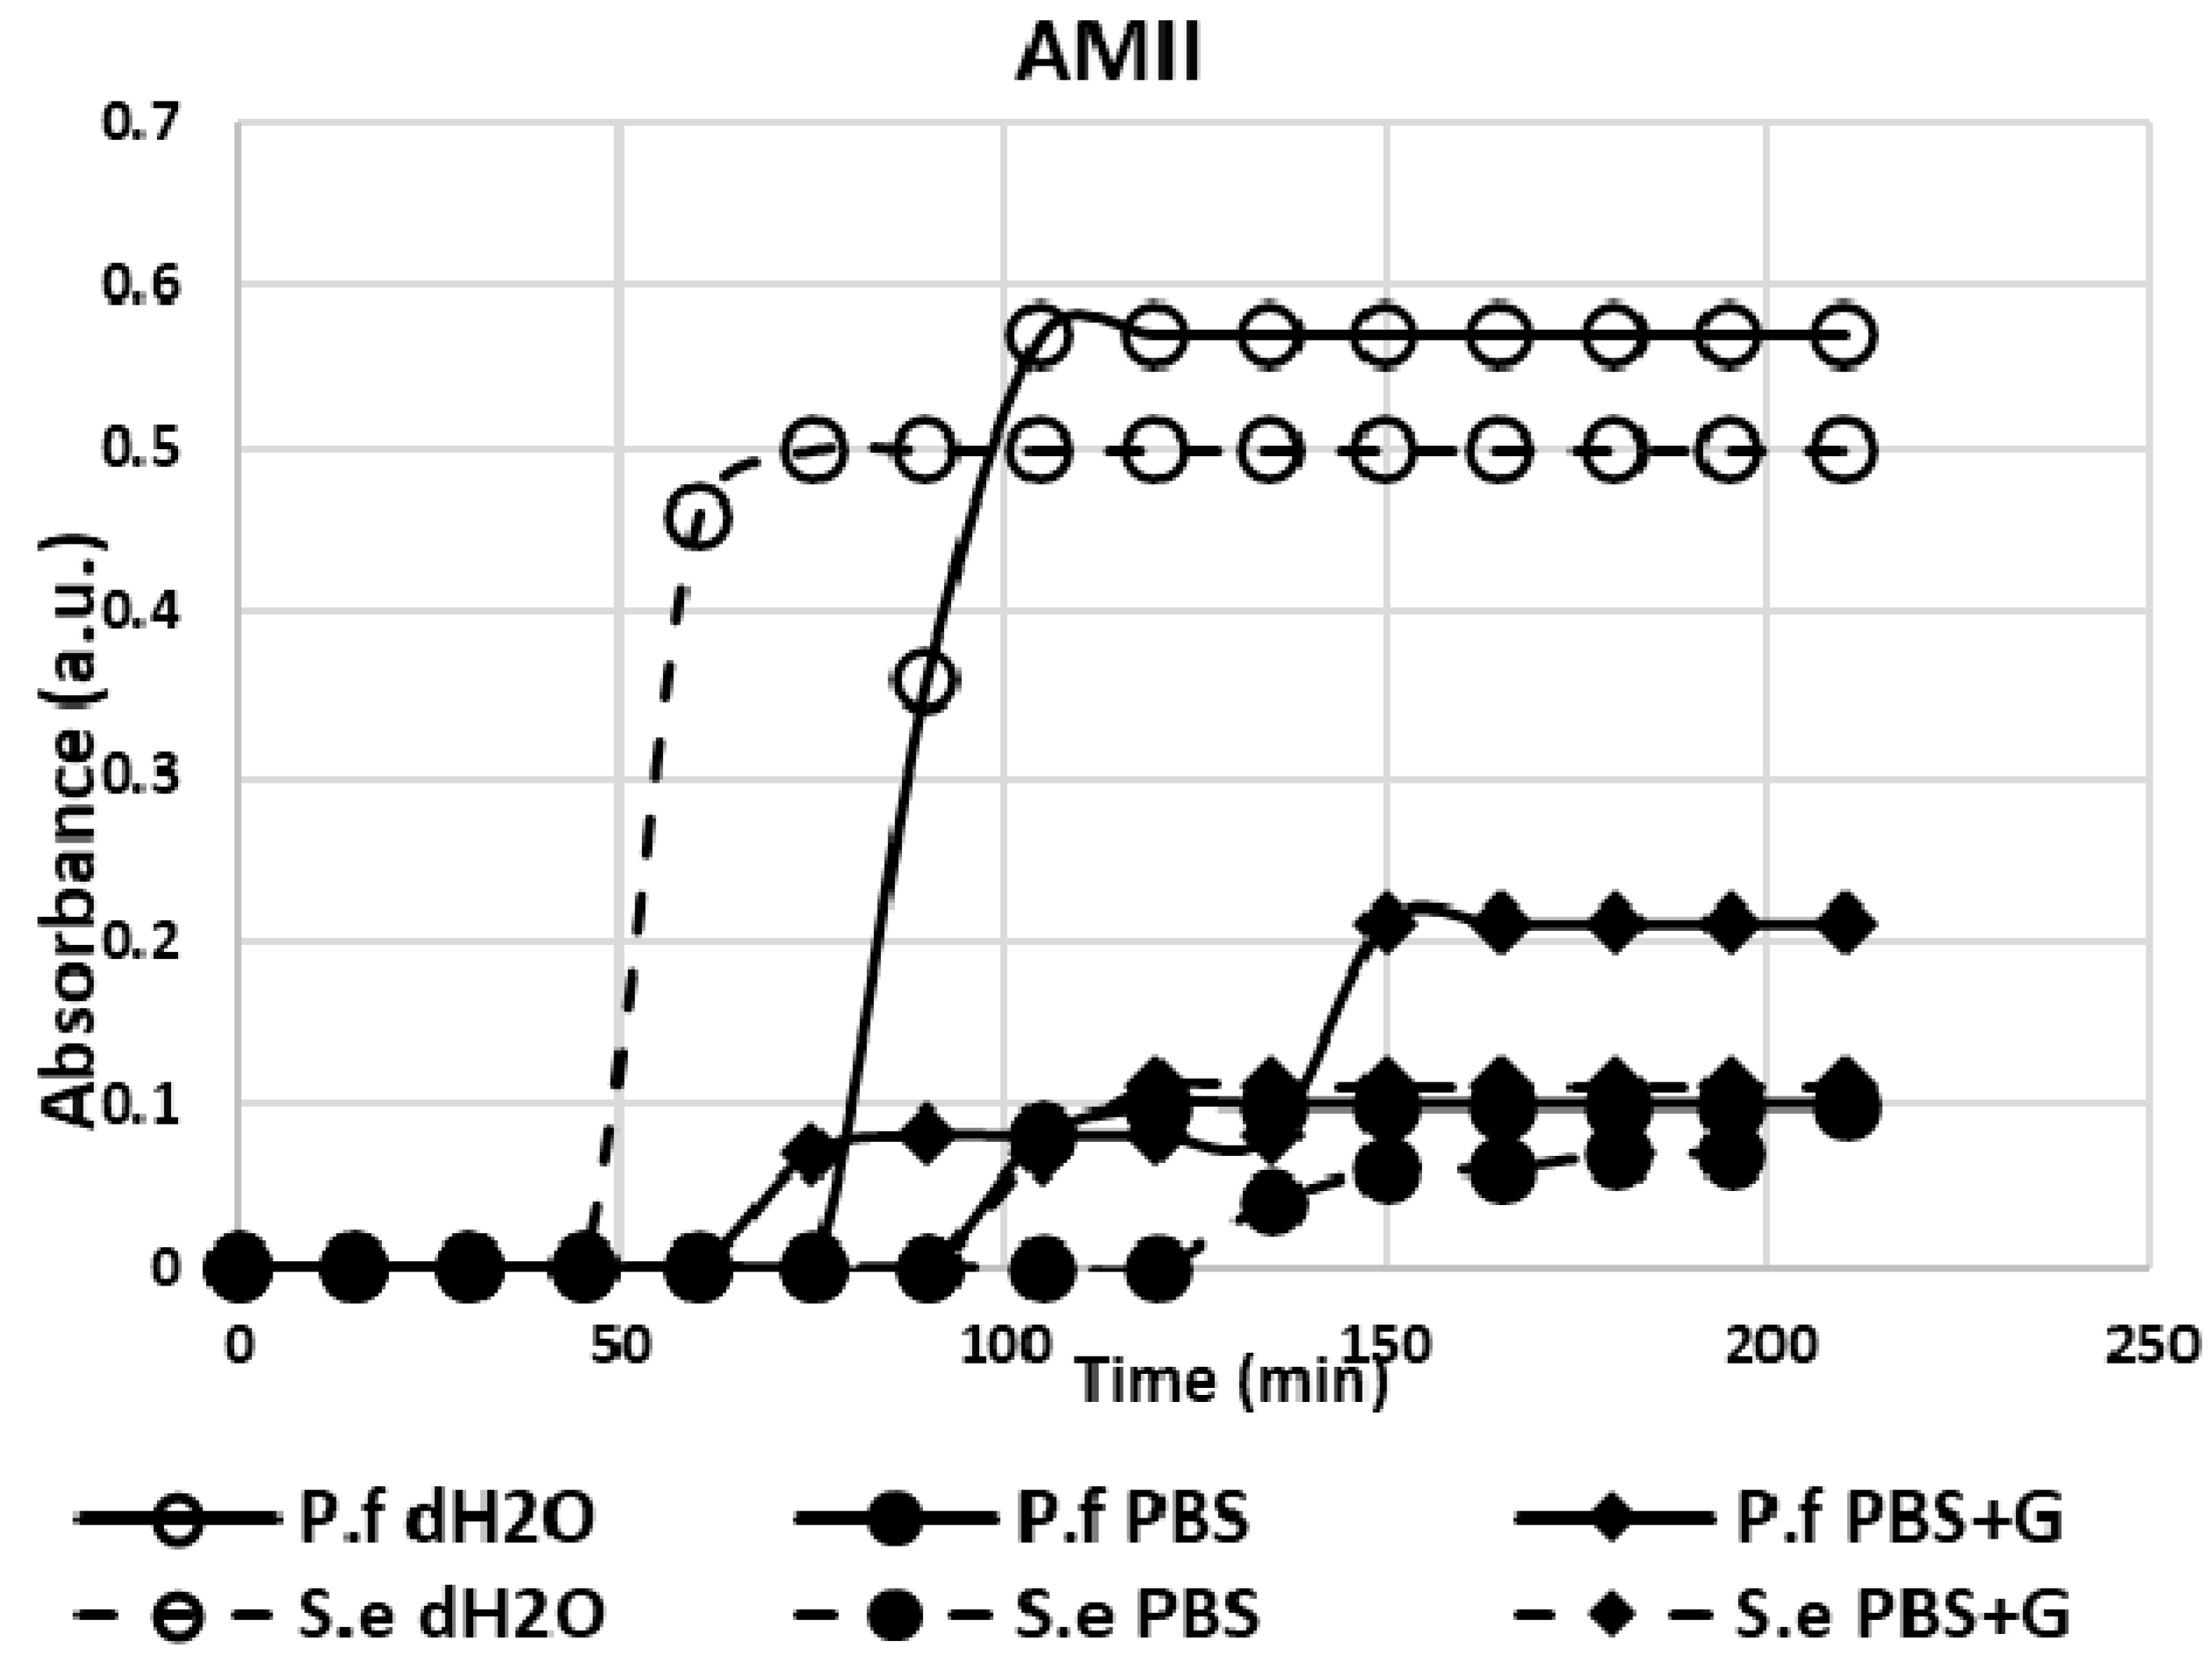
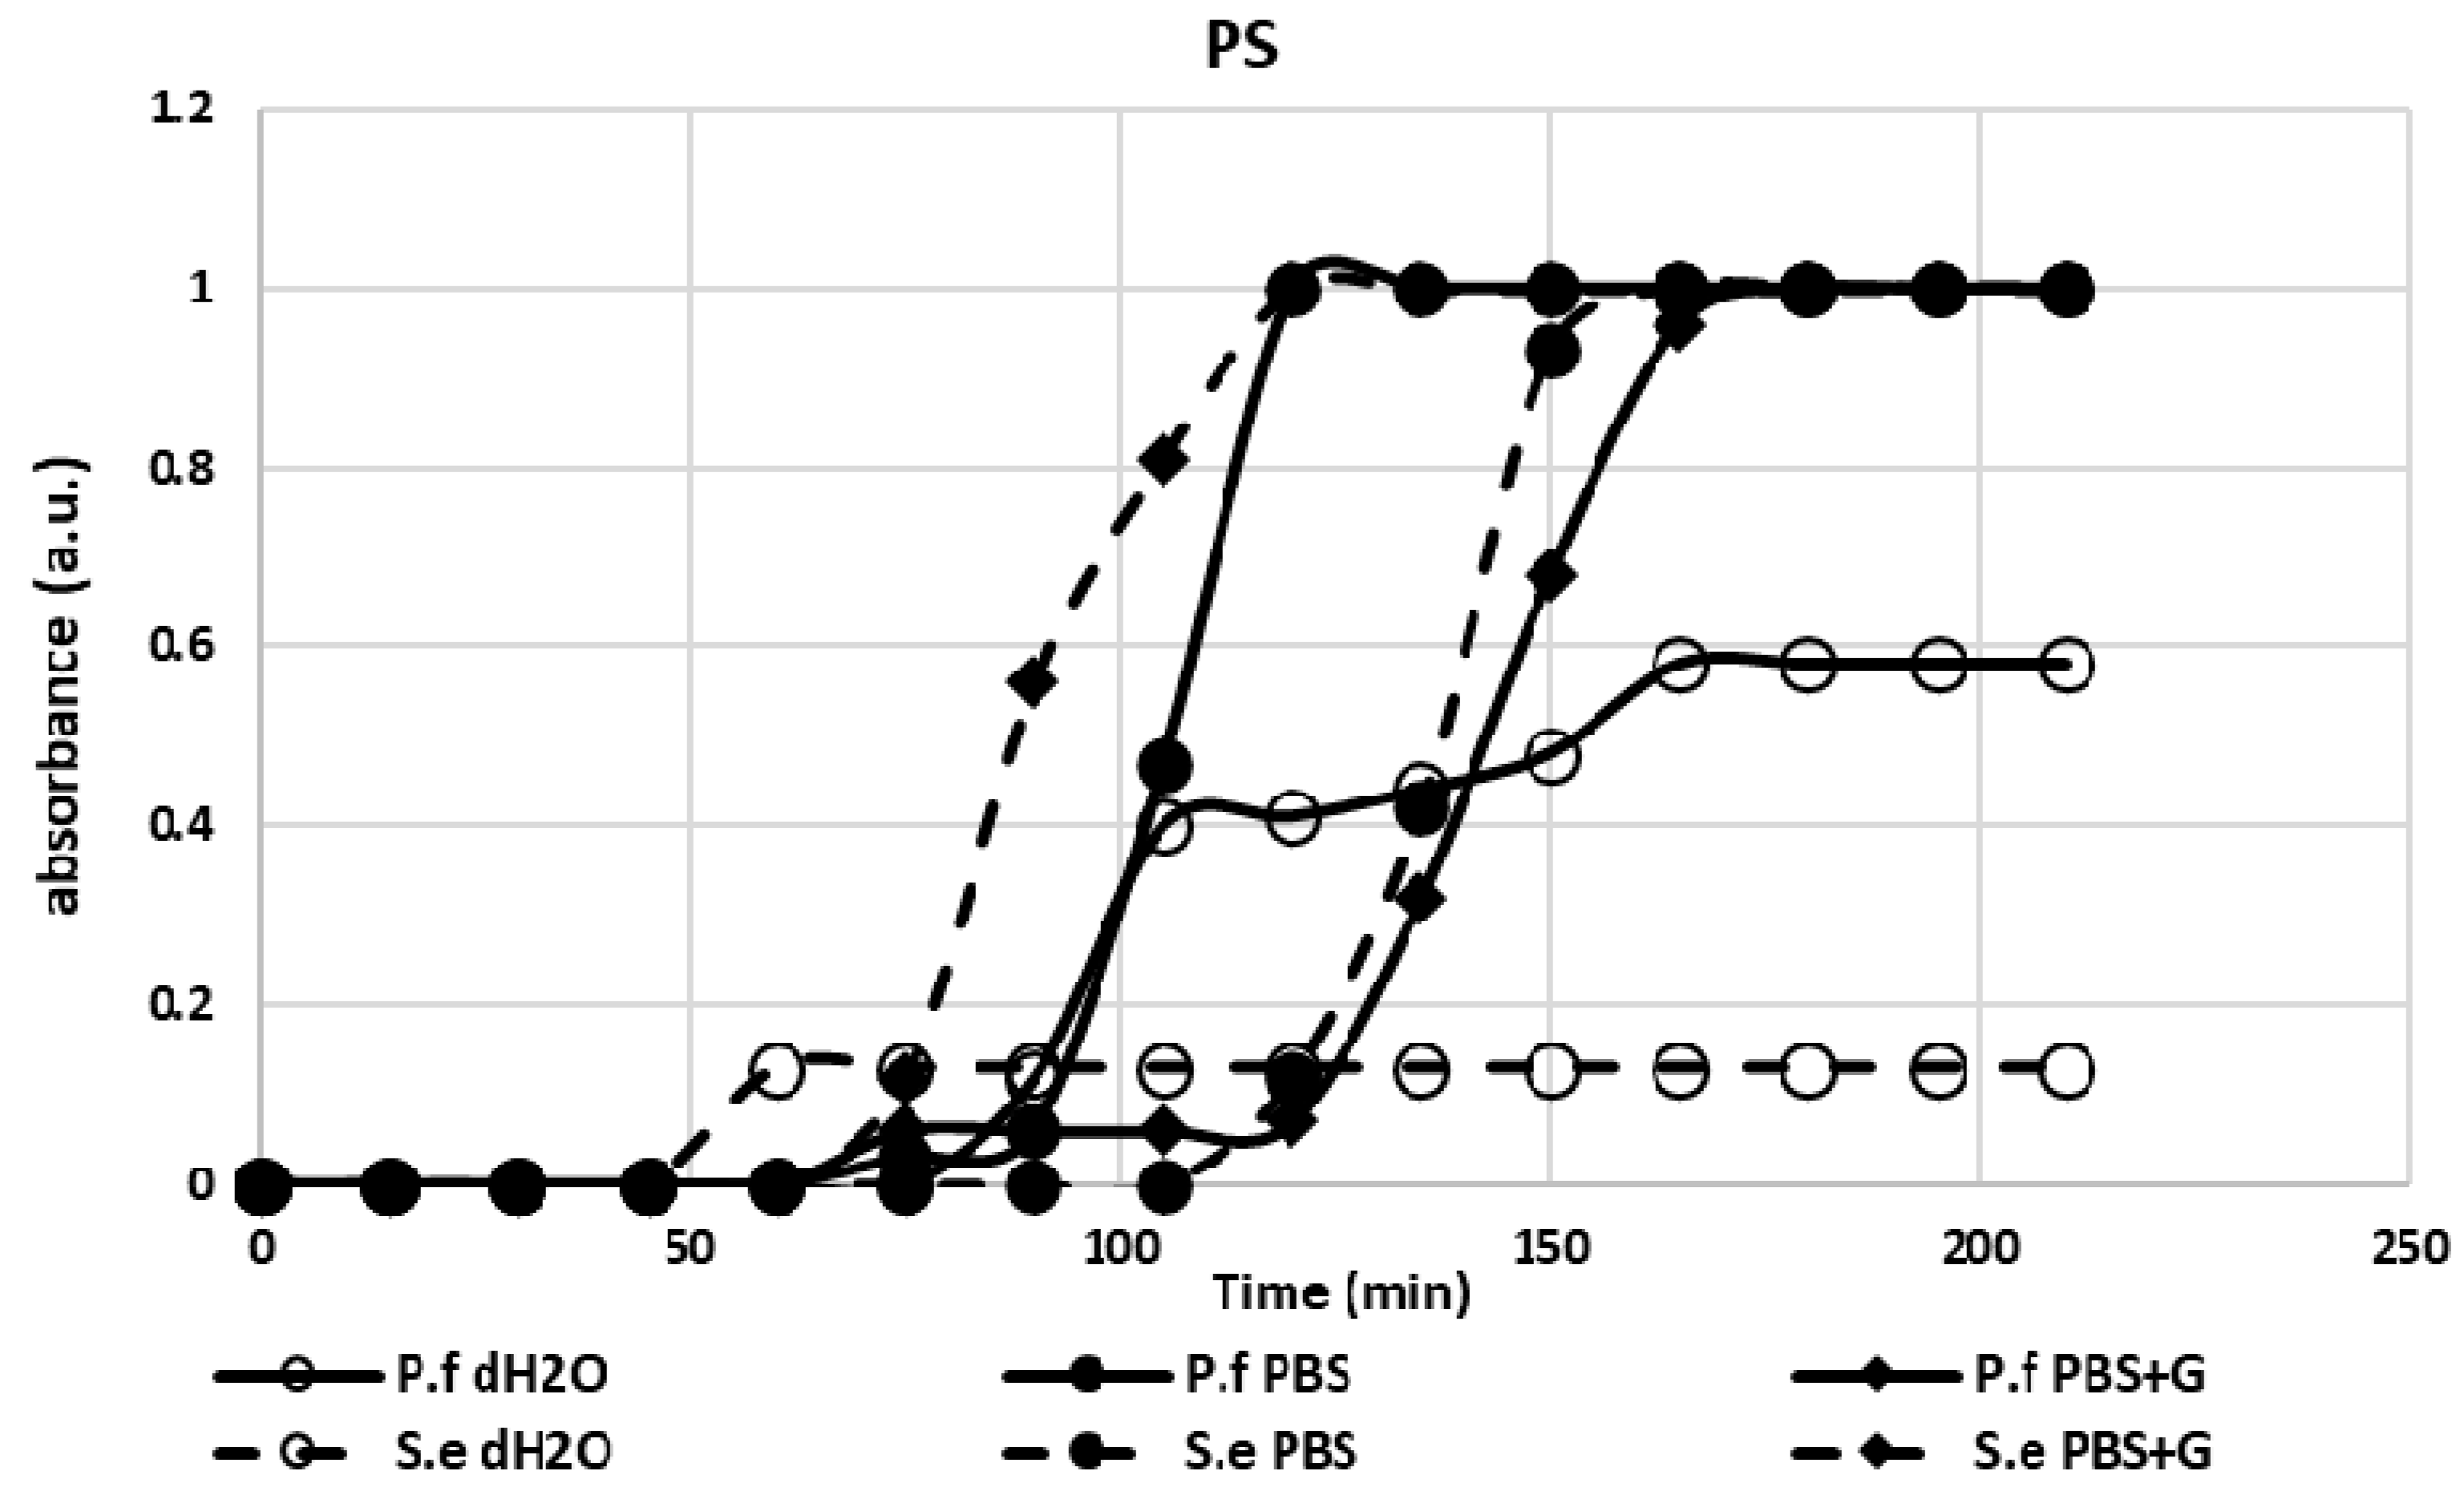
3.1. Adhesion Test

Relationship between time and adhesion of the two strains, to polystyrene micro-titer plates as a function of environmental conditions is depicted in Figure 1. Both the bacteria strains adhered to the plate surface and the amount of EPS slowly increased. Small differences in adhesion properties among the different media can be seen after 30 min of contact with the surface. The control samples grew faster than the others because of Tryptic soy broth (TSB), a complex, general purpose medium, that is routinely used as a culture broth. Indeed, it offers a high nutritional environment to bacteria stimulating their proliferation.

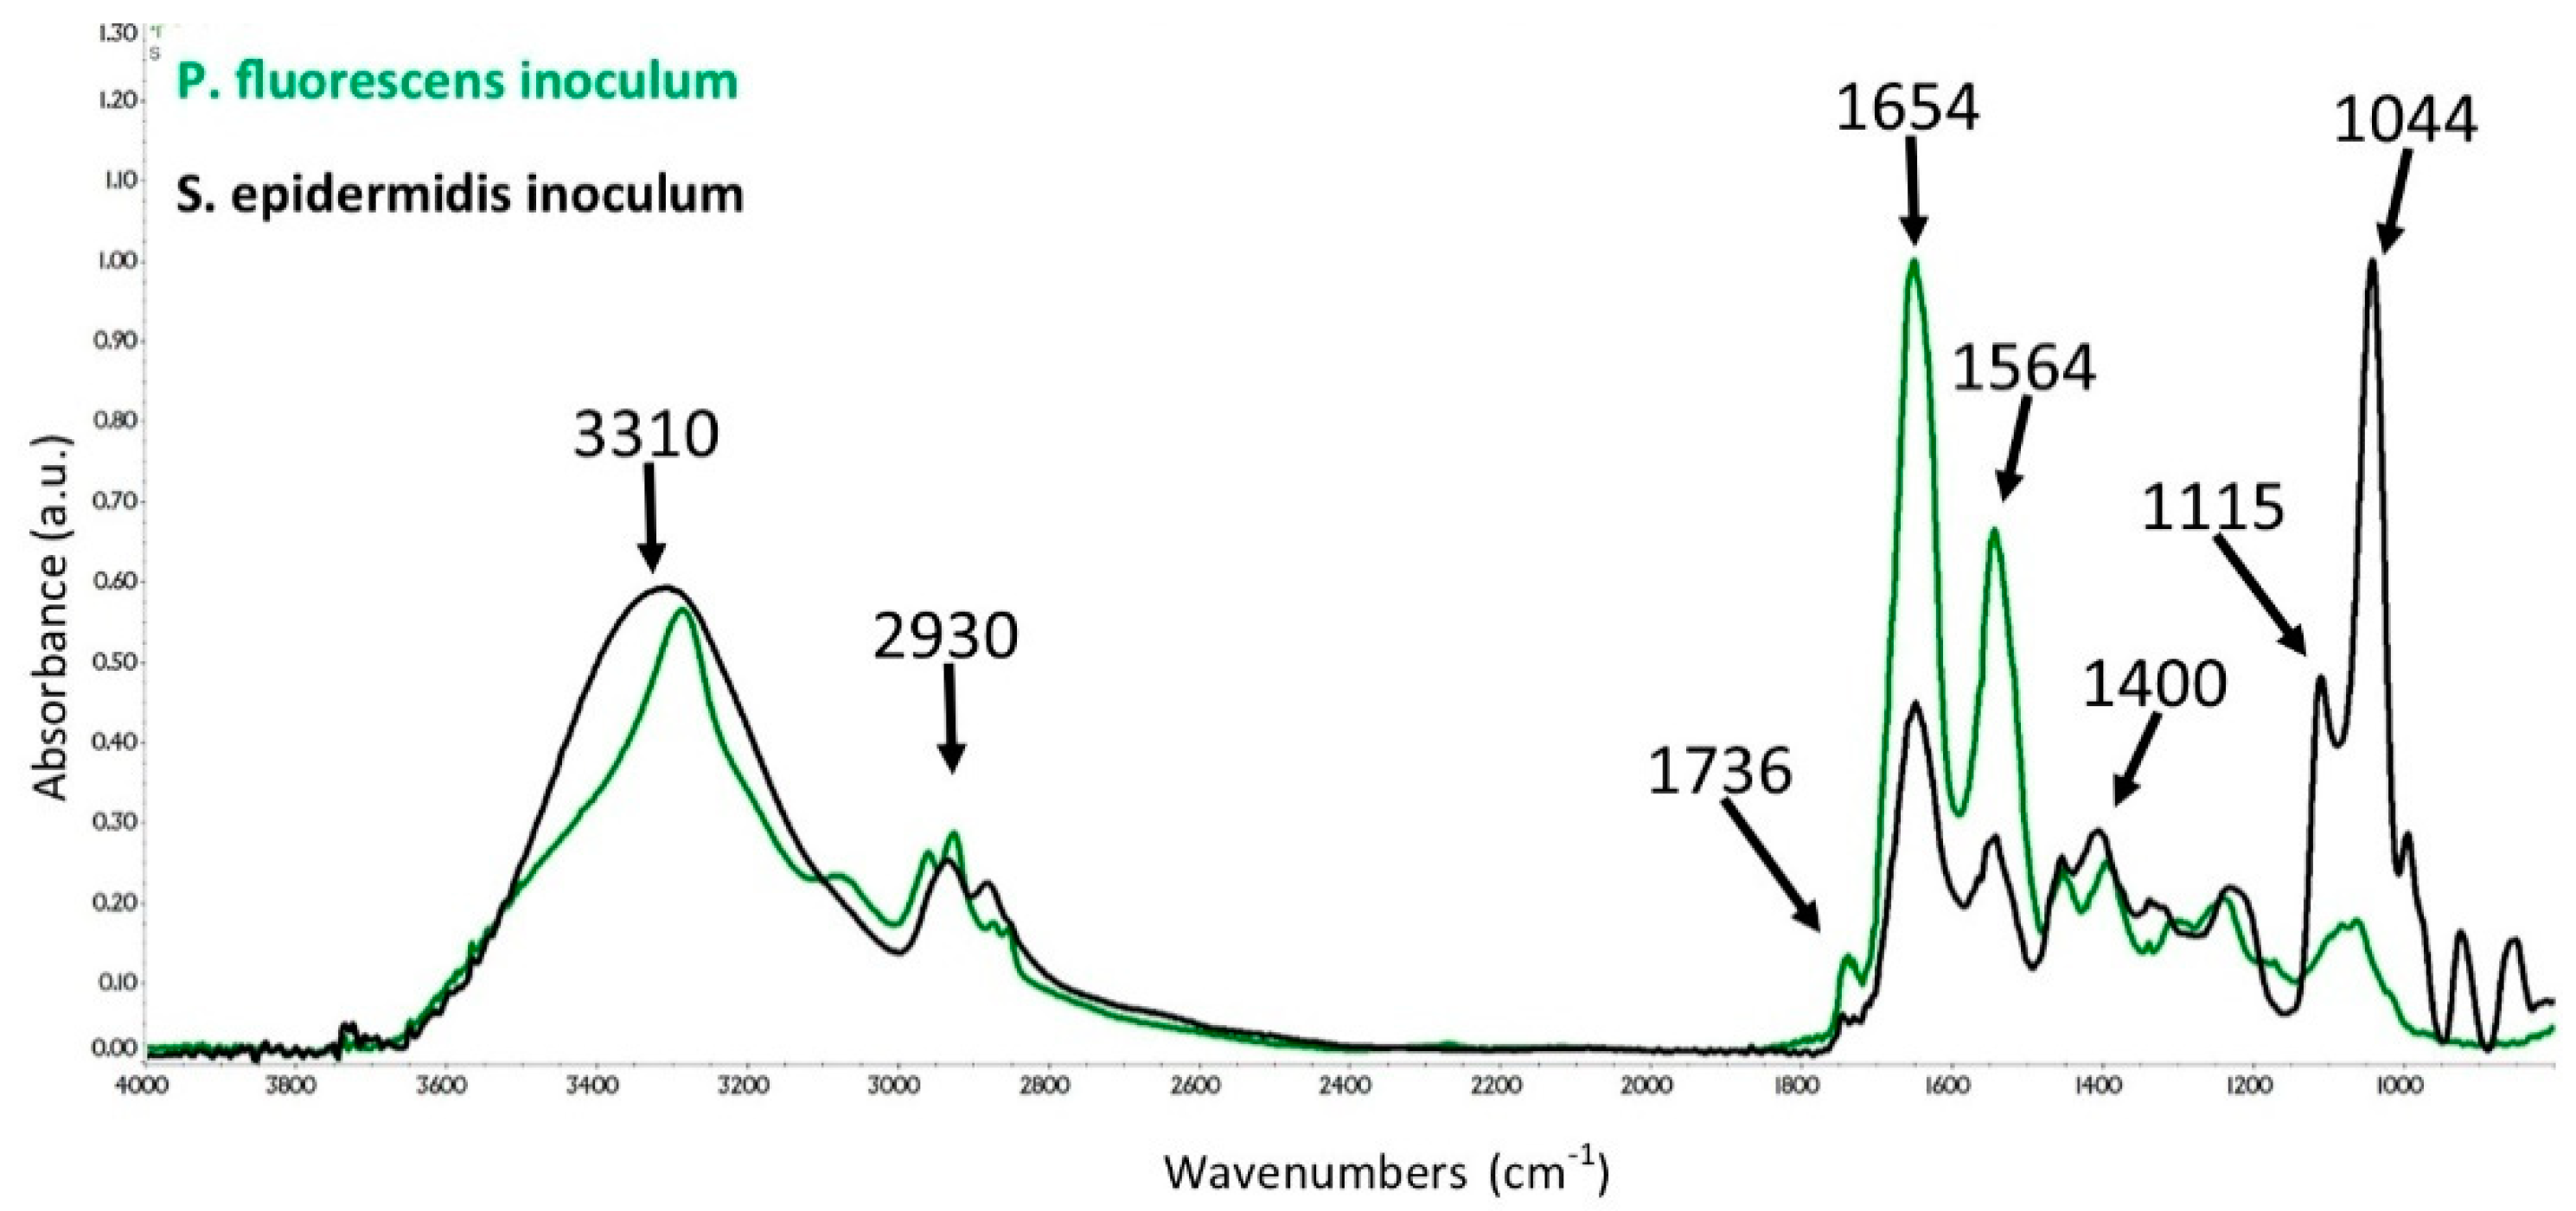
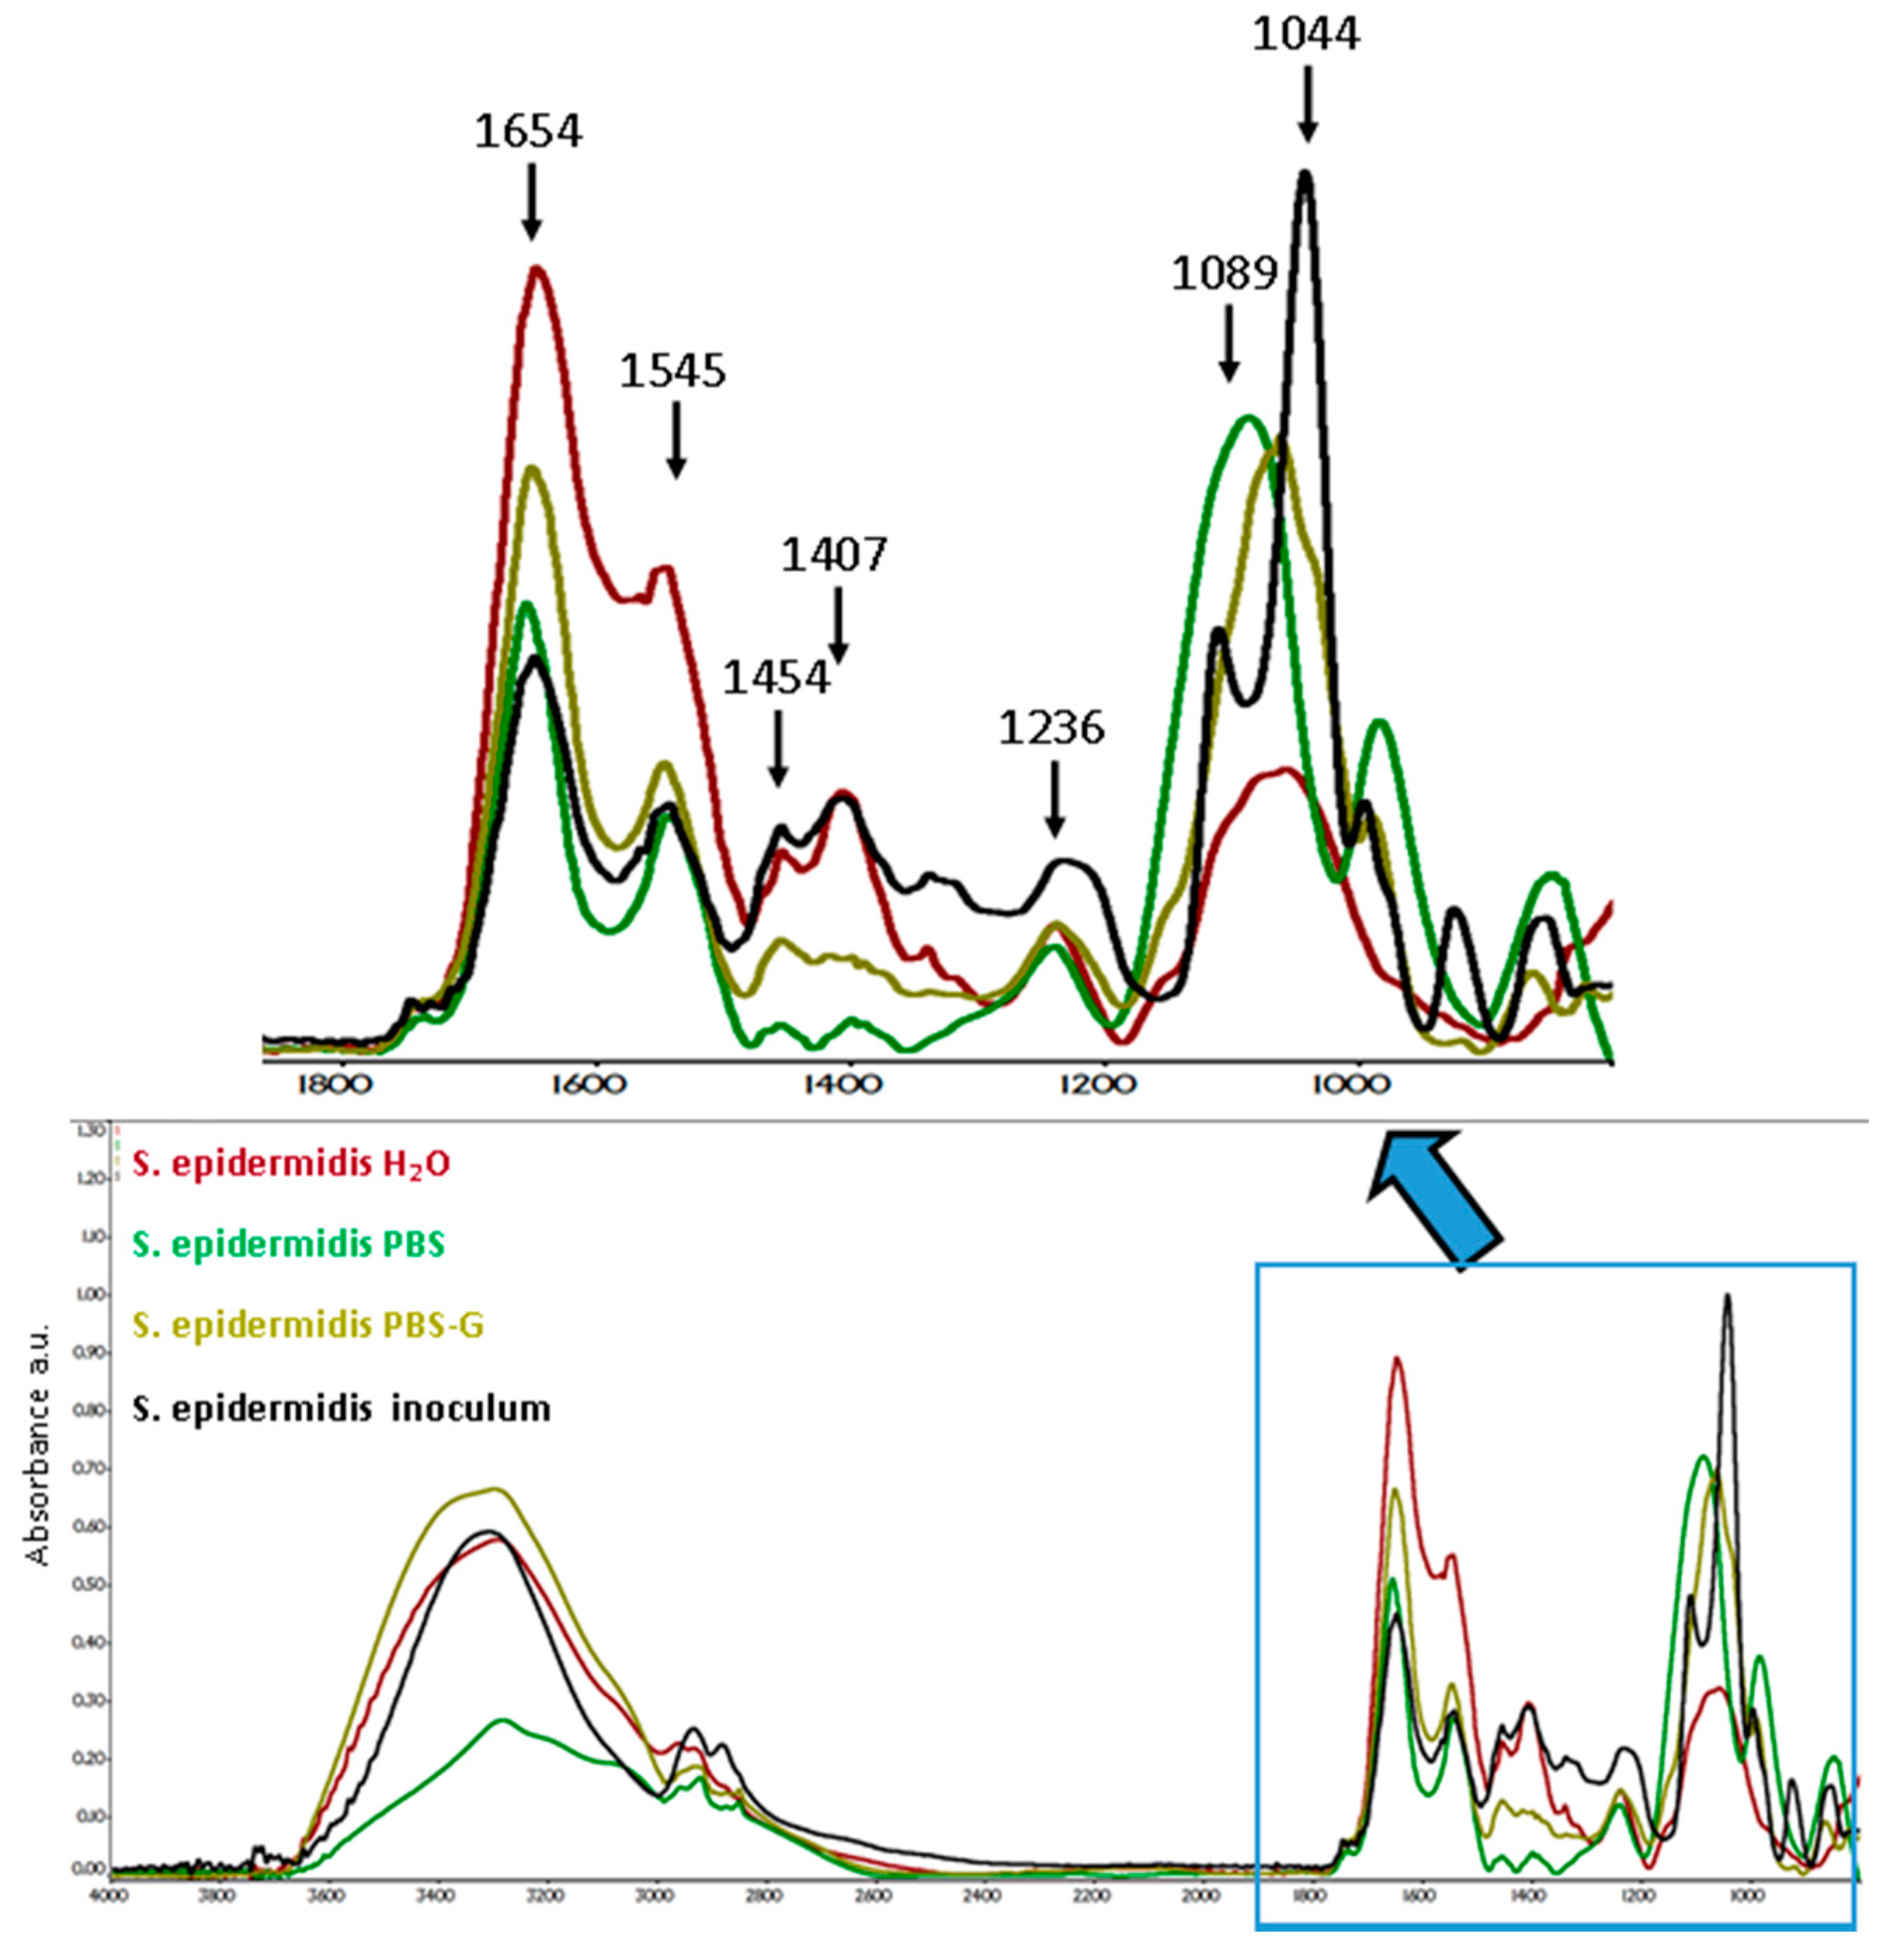
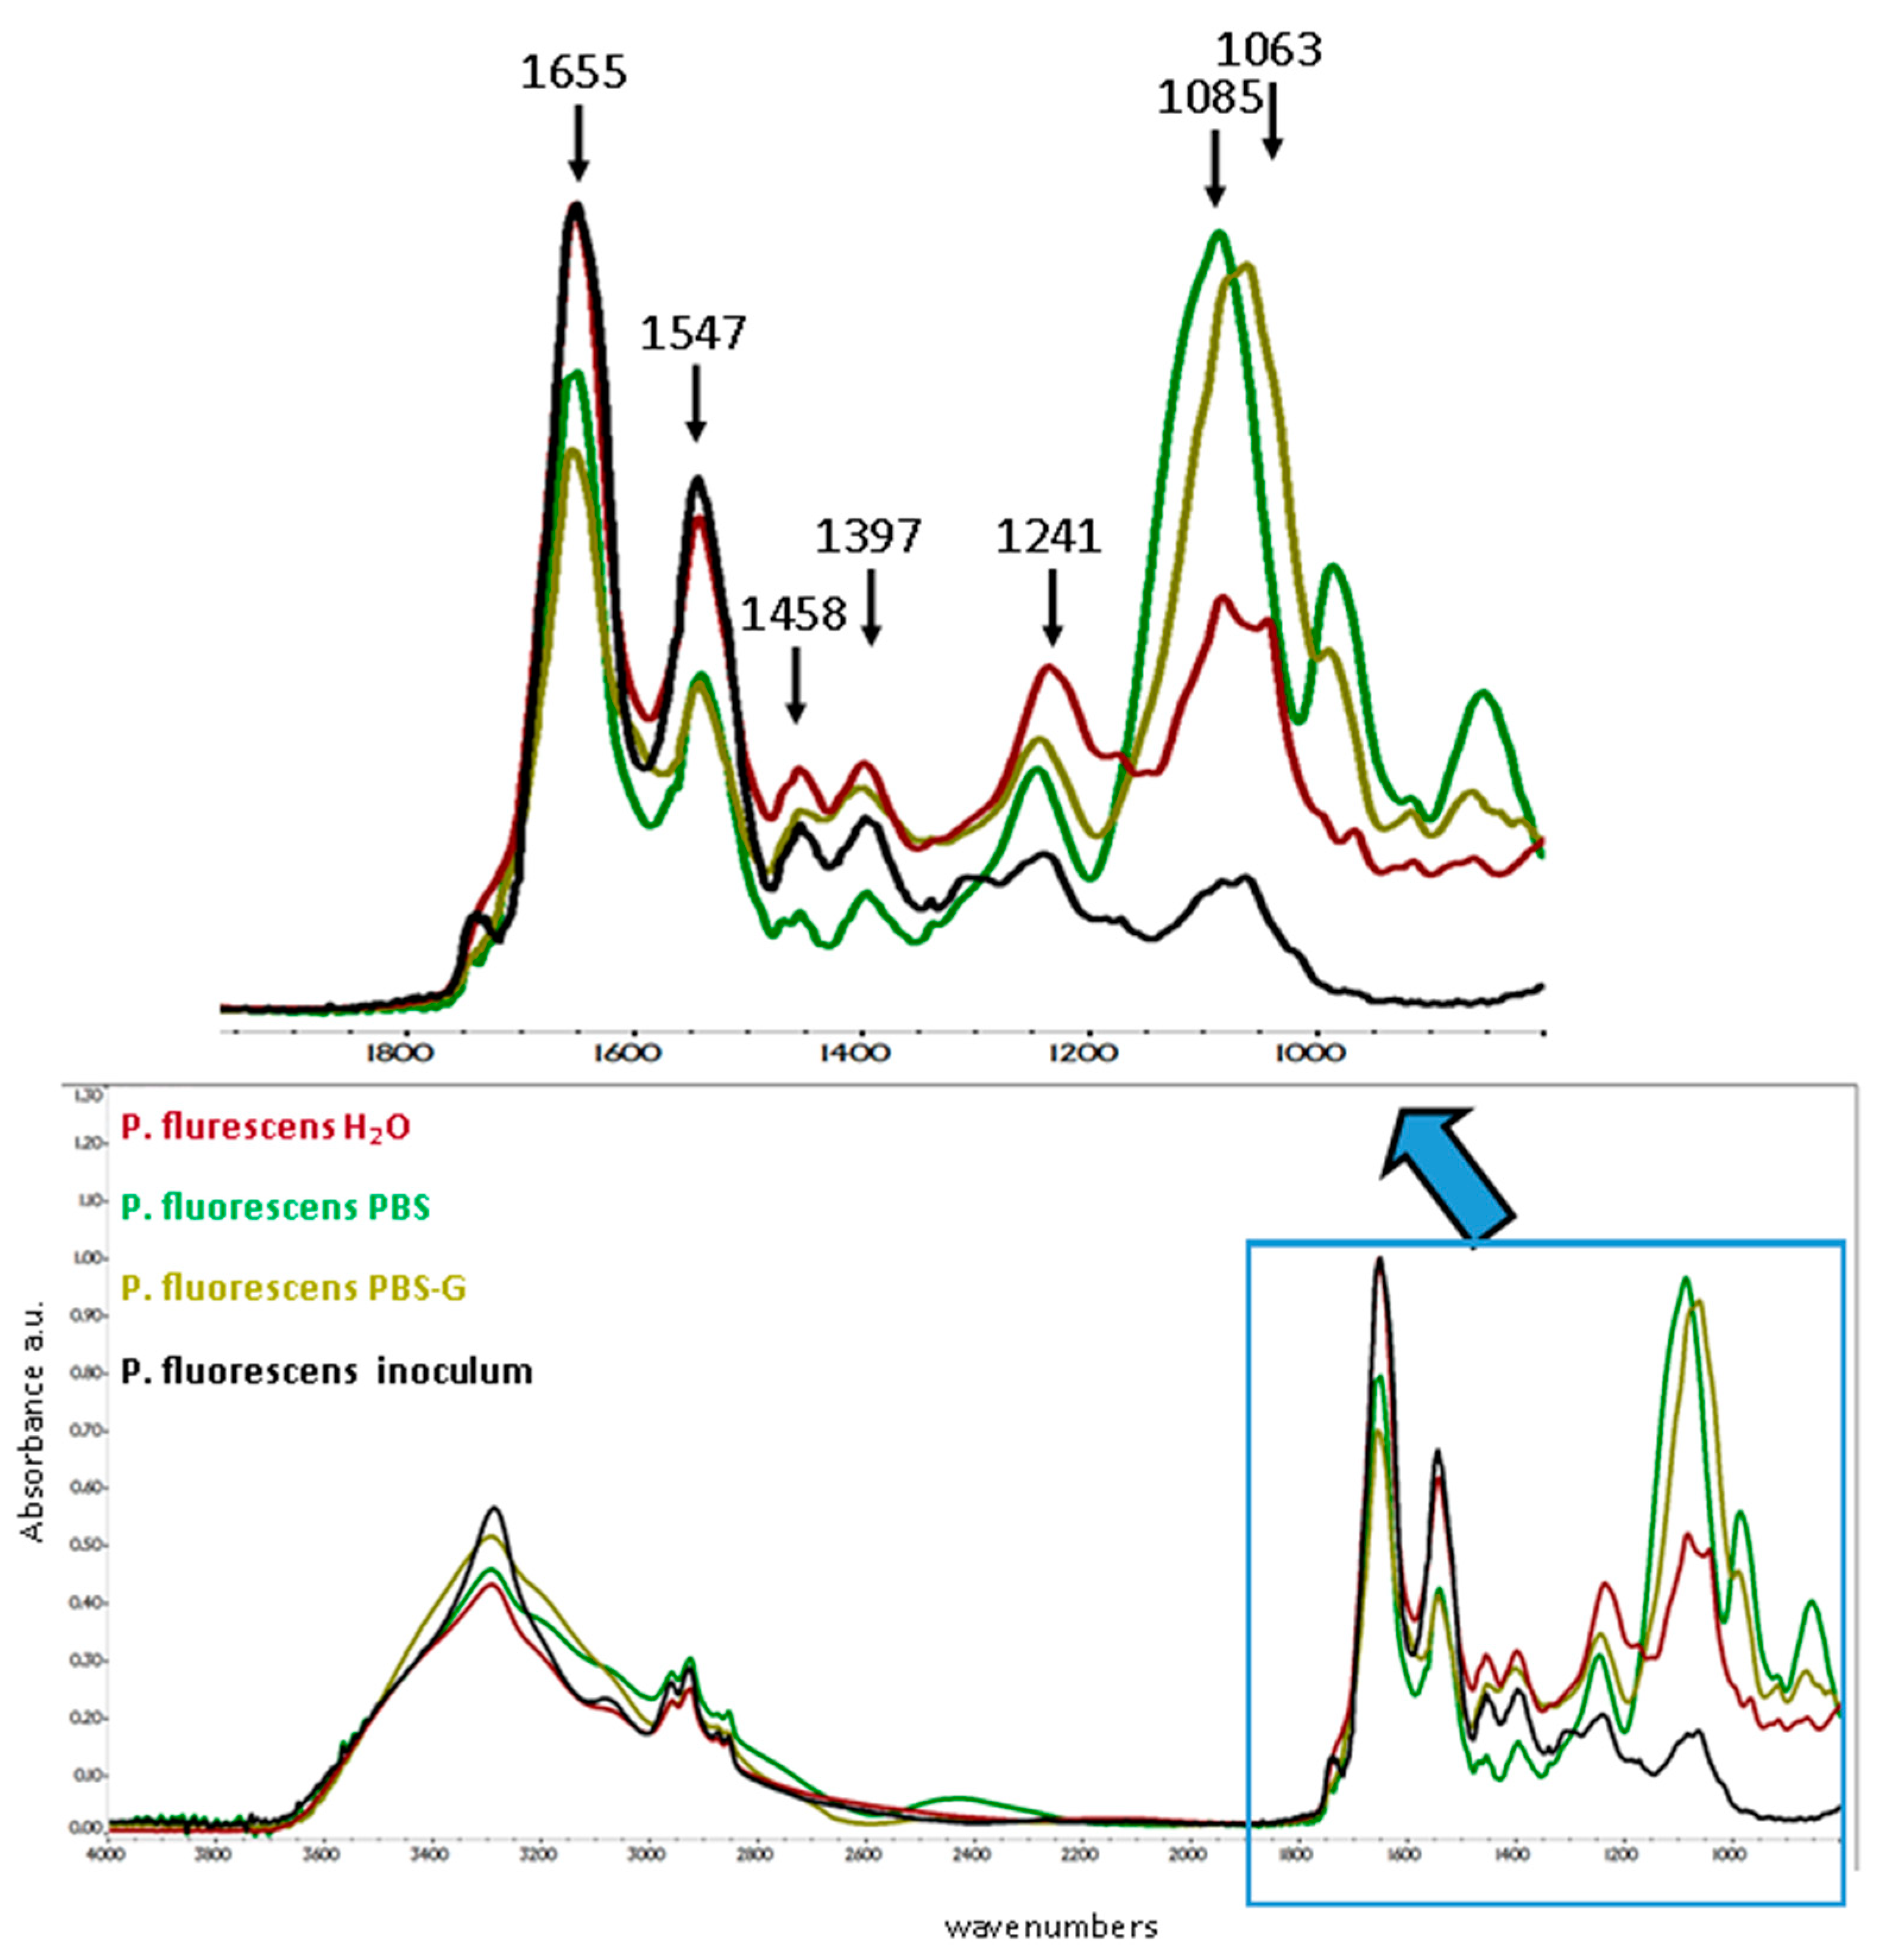
3.2. ATR-FTIR Spectra of SE and PF Bacteria

Considering the average size of bacteria, that oscillates from 0.7 to 2 µm, the very first layer of attached bacteria can be analyzed by ATR technique [26,27,28]. The infrared spectra exhibited typical bands corresponding to carboxyl, amide, ester, phosphate, and carbohydrate moieties [38,39,40,41,42,43,44,45,46,47,48] (Table 1).
The infrared spectra of SE and PF bacteria were reported in Figure 2.
Typical spectra of bacteria can be divided in 3 main zones:
Zone (I) proteins (1700–1500 cm−1) identified by the N-H stretching and the vibrations of the peptide linkage, the Amide I band arising from backbone amide C=O stretching vibrations and the amide II band arising from the out-of-phase combination of the NH in-plane bending and the CN stretching vibrations [38].
Zone (II) phospholipids and nucleic acids (1220–1260 cm−1) characterized mainly by PO2—asymmetric stretching vibrations of phosphate groups [39,40].
Zone (III) polysaccharides (1200–900 cm−1) mainly localized in the fingerprint region with broad band [41,42,43,44].
Figure 2 shows the starting spectra of the two bacterial cells biofilm formed on Ge crystal, dried under a flow of dry nitrogen. Both strains biofilm reveals all the typical bands corresponding to bacterial macrocomponents (proteins, polysaccharides, lipids). A strong difference in proteins/polysaccharide ratio is found. SE infrared spectrum is characterized by strong bands in Zone III due to polysaccharides, while, conversely, PF shows strong bands in Zone I, related to protein absorption, and a weak polysaccharides absorption. The phospholipids and nucleic acid bands are similar for both SE and PF, as expected, because we started from about equal number of bacteria cells and cell division and proliferation generally started only 6–8 h after inoculation.

3.3. Changing of Amide Bands as a Function of Time and Media

Figure 3 shows the changes of Amide bands intensities over the time, for both bacterial species under the media of interest. SE shows a rapid increase of Amide II band intensity after 45 min while PF shows the same behavior only after 75 min.
The Amide band of SE has a lower intensity than that of PF. This can be explained considering that in H2O, PF increased its protein production to favor its attachment to the surface. No difference in PF growth in PBS and PBS-G is observed for the first 60 min, but, after 135 min, additional proteins are exposed. PF in PBS media behaves as SE in PBS-G, while SE strain shows a lower sensitivity to PBS composition starting to expose proteins on surfaces after 120 min.
The collected data suggest that, under lack of nutrients and in presence of osmotic shock, both the bacteria tend to firmly anchor themselves to the support. The osmotic shock seems to be the predominant parameter affecting bacterial attachment to the surface. Indeed, in the presence of bare PBS (physiological ionic strength without nutrients) the bacteria need to produce and spread a lower amount of proteins on the surface. The addition of a nutrient, as glucose, provokes only a slight effect on protein expression from bacteria.

3.4. Changing of Polysaccharides Bands as a Function of Time and Media

Figure 4 shows the changing of intensity of the polysaccharide bands over a period of about 200 min. Polysaccharide bands intensity starts to be detectable only after 50 min. At the inoculum, SE (Gram-positive) shows polysaccharide bands more intense than those of PF (Gram-negative) because of differences in their membrane structures (see Figure 2). In fact, the Gram-positive cell wall is primarily made up of peptidoglycan (ca. 40−80% of the dry weight of the wall), a polymer of N-acetylglucosamine and N-acetylmuramic acid, whereas the cell walls of Gram-negative bacteria are more complex due to the presence of an outer membrane, that does not contain teichoic or teichuronic acids but rich of proteins [45].
SE shows a low increase of polysaccharide bands in H2O medium (osmotic shock). A different behavior is found in bare and enriched PBS. Indeed, polysaccharide bands intensity increases after 75 min in PBS with glucose, whereas without glucose it increases only after 120 min.
PF exhibits a peculiar behavior in H2O where the saccharide bands increase strongly after 100 min without reaching the plateau. In all the other conditions, the intensity of polysaccharide bands increases to the plateau probably because the layer of the biofilm exceeded the penetration capability of FTIR technique. In particular, PF shows an increase of the polysaccharide bands intensity after 90 min in PBS and only after 120 min in the presence of glucose. This behavior suggests that in all the conditions, both the bacteria species start to increase their polysaccharides content, probably because of biofilm needs to counteract the lack of nutrients.

3.5. FTIR Spectra Changes as a Function of Media Composition

3.5.1. S. epidermidis

Figure 5 shows the IR spectra of the SE bacteria after 180 min in H2O, PBS, and PBS-G. Comparing them to inoculum FTIR spectrum, a significant increase of protein band intensity in the absence of nutrients (H2O) is observed. The spectra change from a prevalence of polysaccharide absorption band to a prevalence of amide absorption bands, confirming the presence of high level of proteins in contact with the surface, under osmotic stress conditions. This finding underline how the lack of nutrients in the medium encourages bacterial attachment to a surface.
This behavior could be attributed to the needs of resources to produce proteins. The addition of glucose in the media (PBS-G) allows to bacteria to produce a higher amount of proteins in EPS whereas a smaller reduction of carboxylate group is observed than in PBS alone. This could again indicate the lack of the osmosis stimulus but in this case, glucose could also be considered as a source of material for EPS construction.
In summary, under osmotic stress and without nutrients, bacteria are stimulated to produce more proteins on the surface to firmly attach to it, probably due to the reduction in the uronic based biomolecules. The presence of ions mitigates this behavior, so that the formation of proteins and reduction of uronic based biomolecules are less evident, whereas the presence of glucose helps the synthesis of uronic base biomolecules together with the protein formation.

3.5.2. P. fluorescens

Figure 6 shows the spectra of PF in different media. The inoculum IR spectra are mainly dominated by Amide bands absorption due to proteins whereas the polysaccharides contribution to the infrared spectrum is very low. After 180 min in contact with different media, the spectra show an increase of polysaccharide bands greater in PBS and PBS-G than in H2O. Unlike the others, the spectrum of PF in PBS shows a decrease of the band at 1400 cm−1 suggesting the reduction of carboxylate group probably due to the presence of low level of uronic acid and its derivates.
The unexpected change of the band at 1235 cm−1, mainly related to the bacteria wall, can be due to the amount of cells attached to the crystal surface.

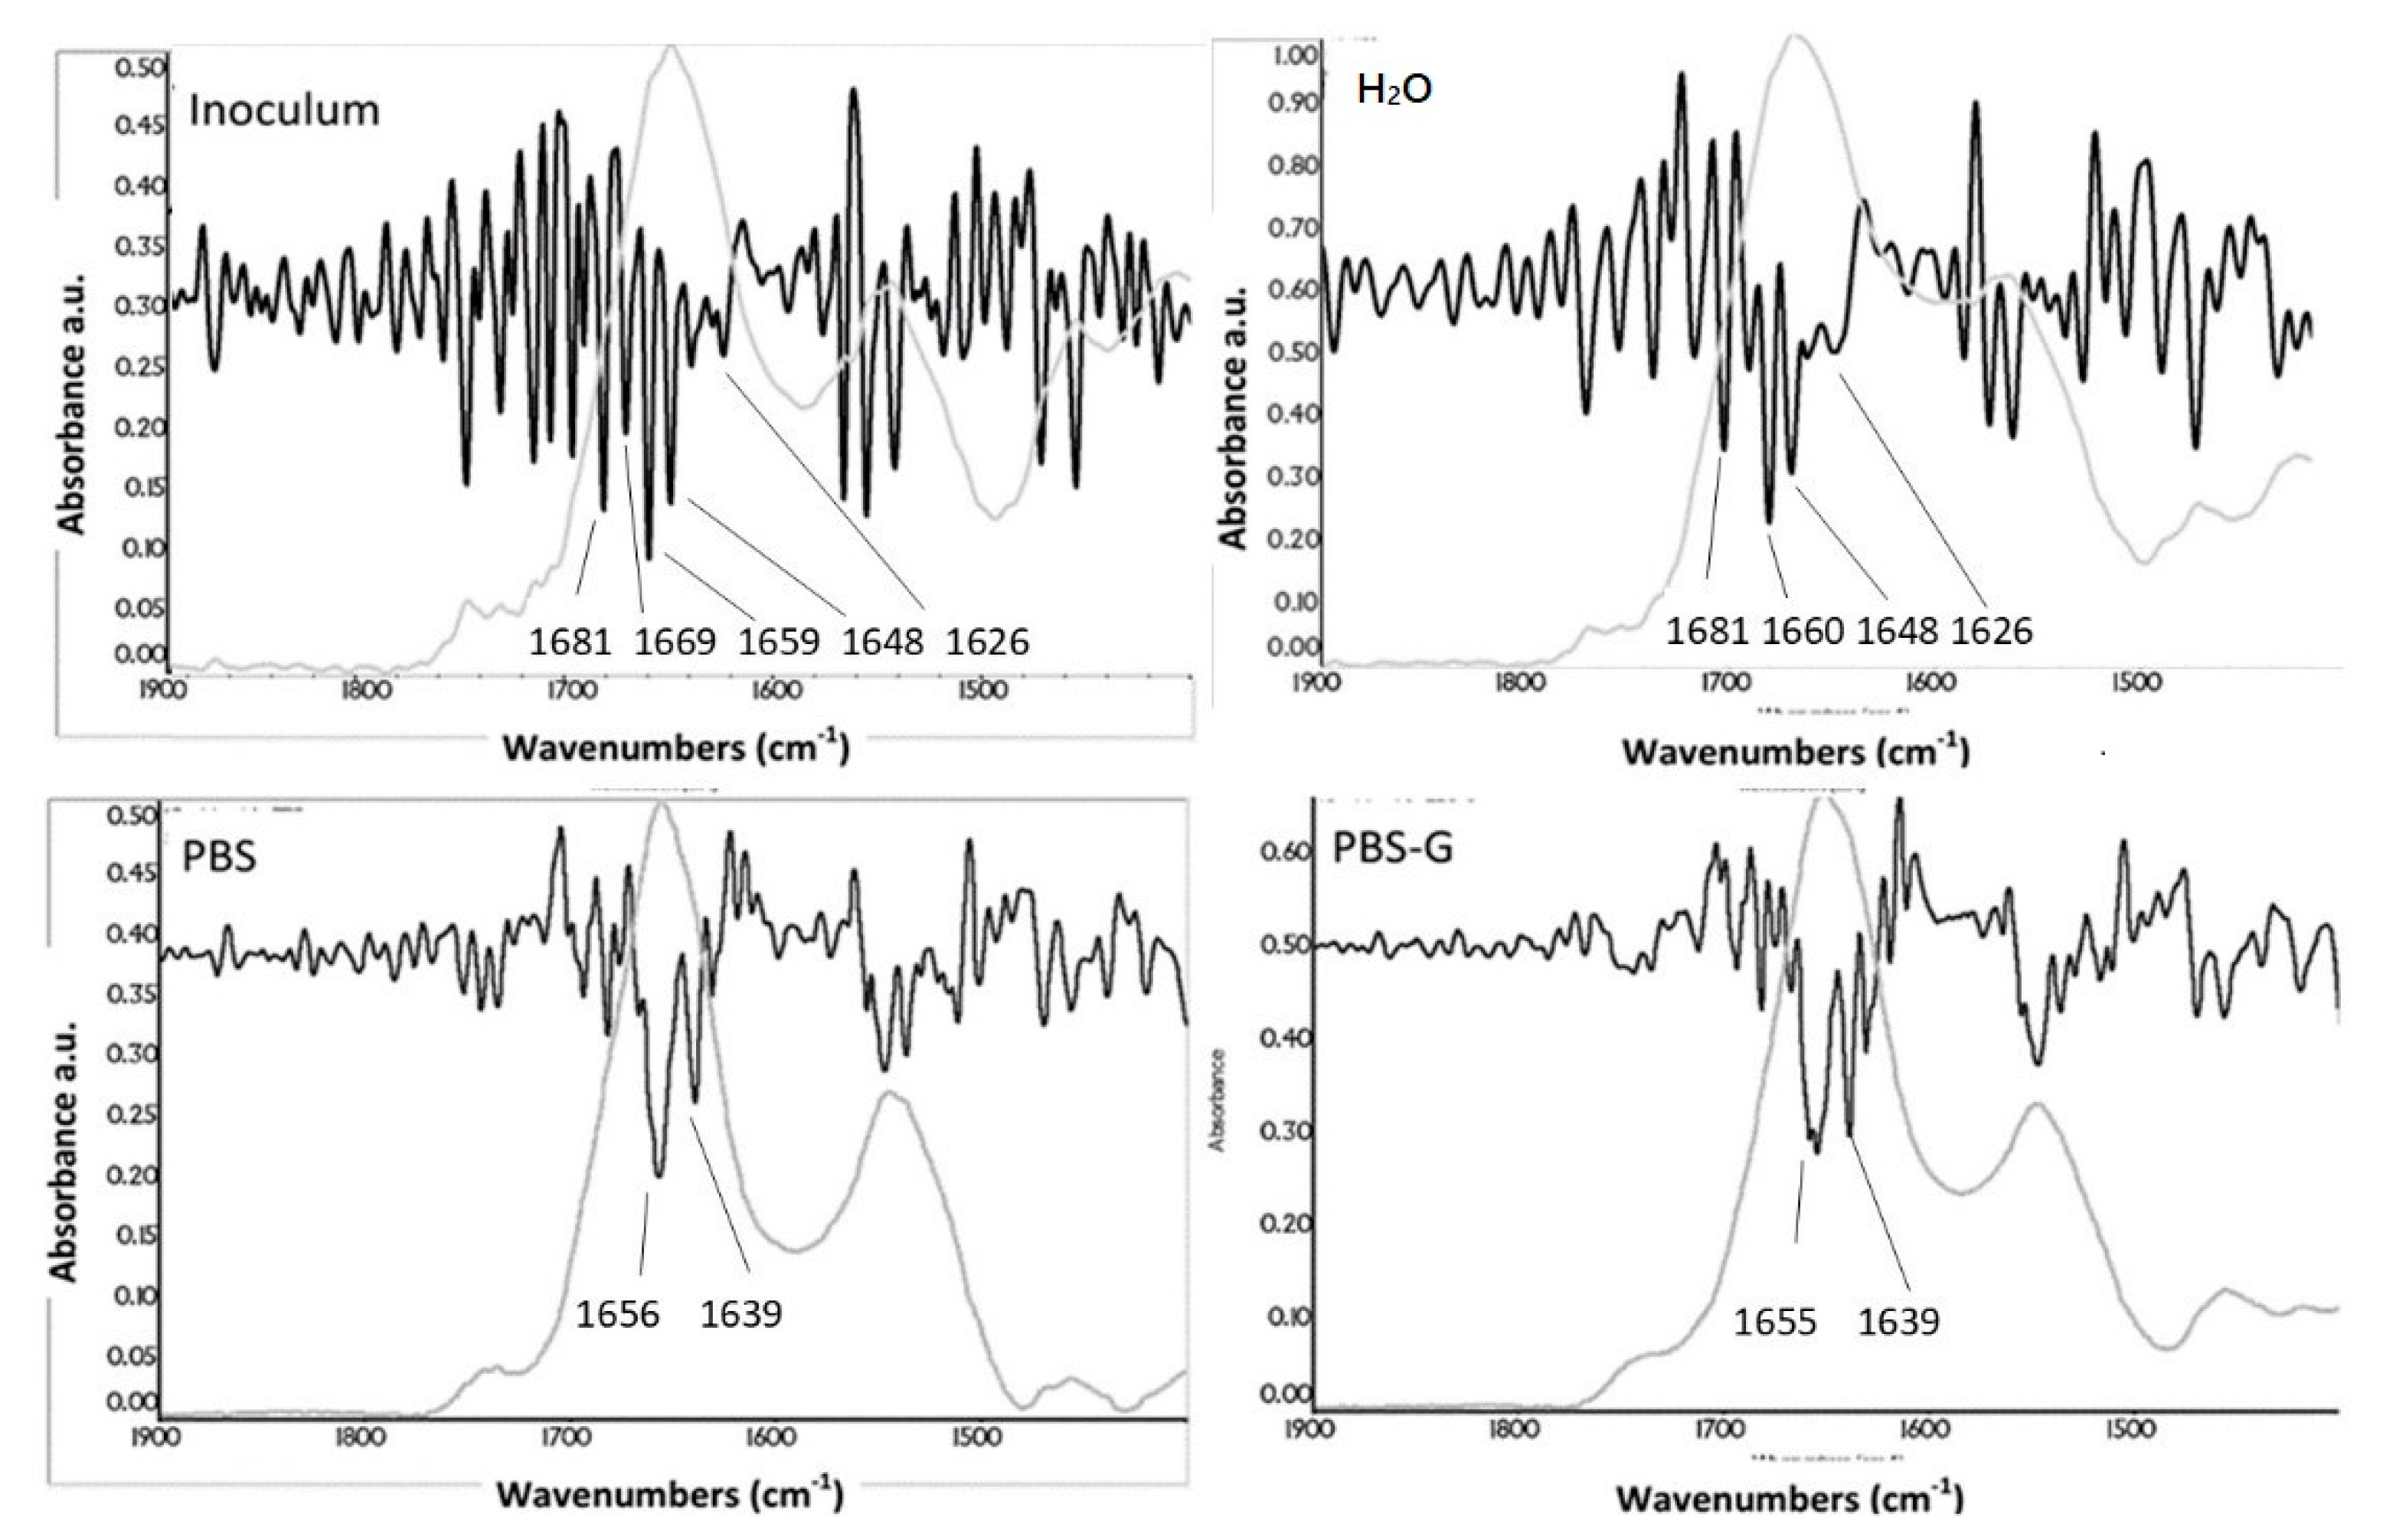
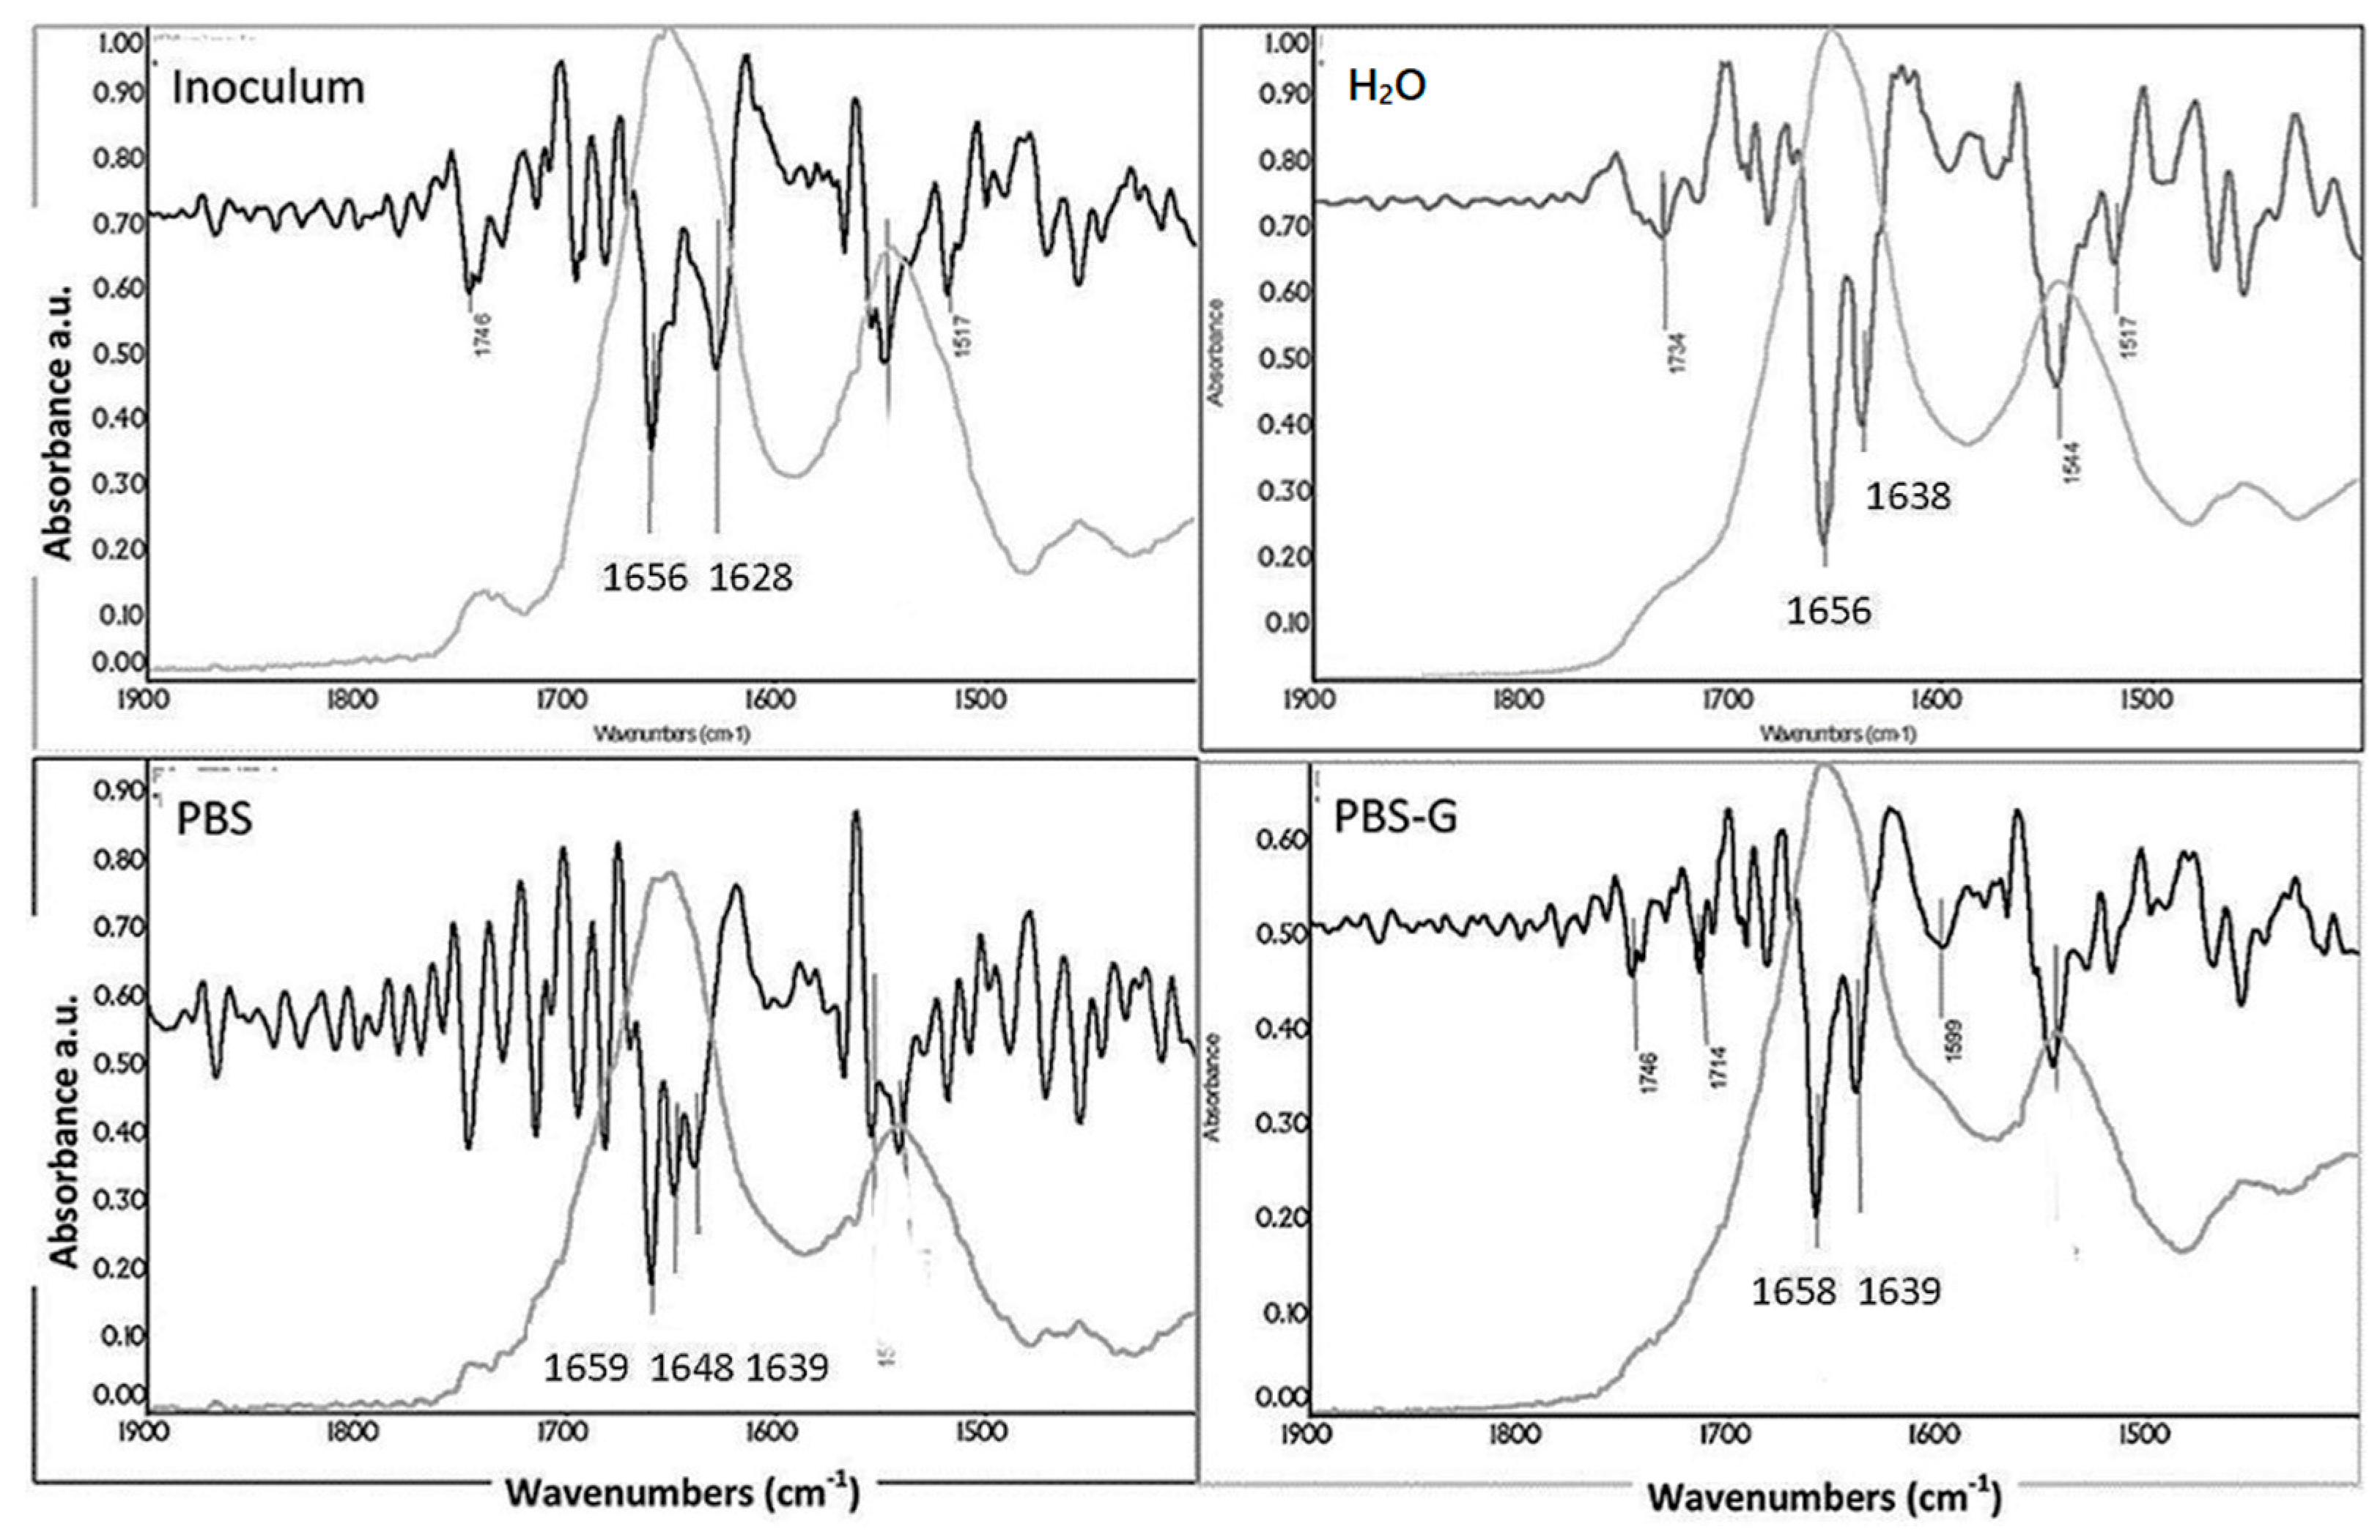
3.6. Secondary-Structure Analysis

The differences in the IR spectra of SE and PF biofilms are corroborated and more clearly illustrated by their second derivatives calculated and presented in the most informative spectroscopic region (1800–1500 cm−1) (Figure 7 and Figure 8). The second derivative of FTIR spectra was used to distinguish the secondary structure of protein under different conditions, and the results have been summarized in Table 2. To eliminate the contribution of the water bands, the spectrum of water was subtracted from each sample spectrum until the baseline in the region above 1750–2000 cm−1 (where no absorption from the sample does occur) becomes a straight line. The analysis of derivative spectra demonstrated that the proteins of both bacterial species are minimally affected by external environment.
Peaks in the second derivatives spectra, directed downwards, correspond both to peaks and to poorly resolved shoulders (i.e., spectral bands due to overlapped stronger neighboring absorptions).
Apart from differences in the carboxyl stretching regions (weak signals at 1727 and 1740 cm −1), related to C=O in phospholipids and lipopolysaccharides typical for bacteria [46,47,48,49], it is noticeable that the secondary derivative plots in the Amide I (1600–1700 cm−1) region demonstrated that proteins are predominantly in random coils and helices form as witnessed by the bands at 1659 and 1648 cm−1. Proteins containing β-sheet, characterized by peaks around 1630 and 1680–1690 cm−1, are present only in a very low amount in the inoculum and in H20 samples and disappear completely in PBS and PBS-G samples [50].
In PF (Figure 8) the proteins are mainly in α-helix and β-sheet conformation and the ratio between these two structures is constant for all the investigated media. Only in the PBS medium part of the proteins are in random coils conformation. For SE the proteins in inoculum and in H2O have quite similar conformations as α-helix, random coils and β-sheet. The random coil conformation could not be distinguished in PBS and PBS-G medium.

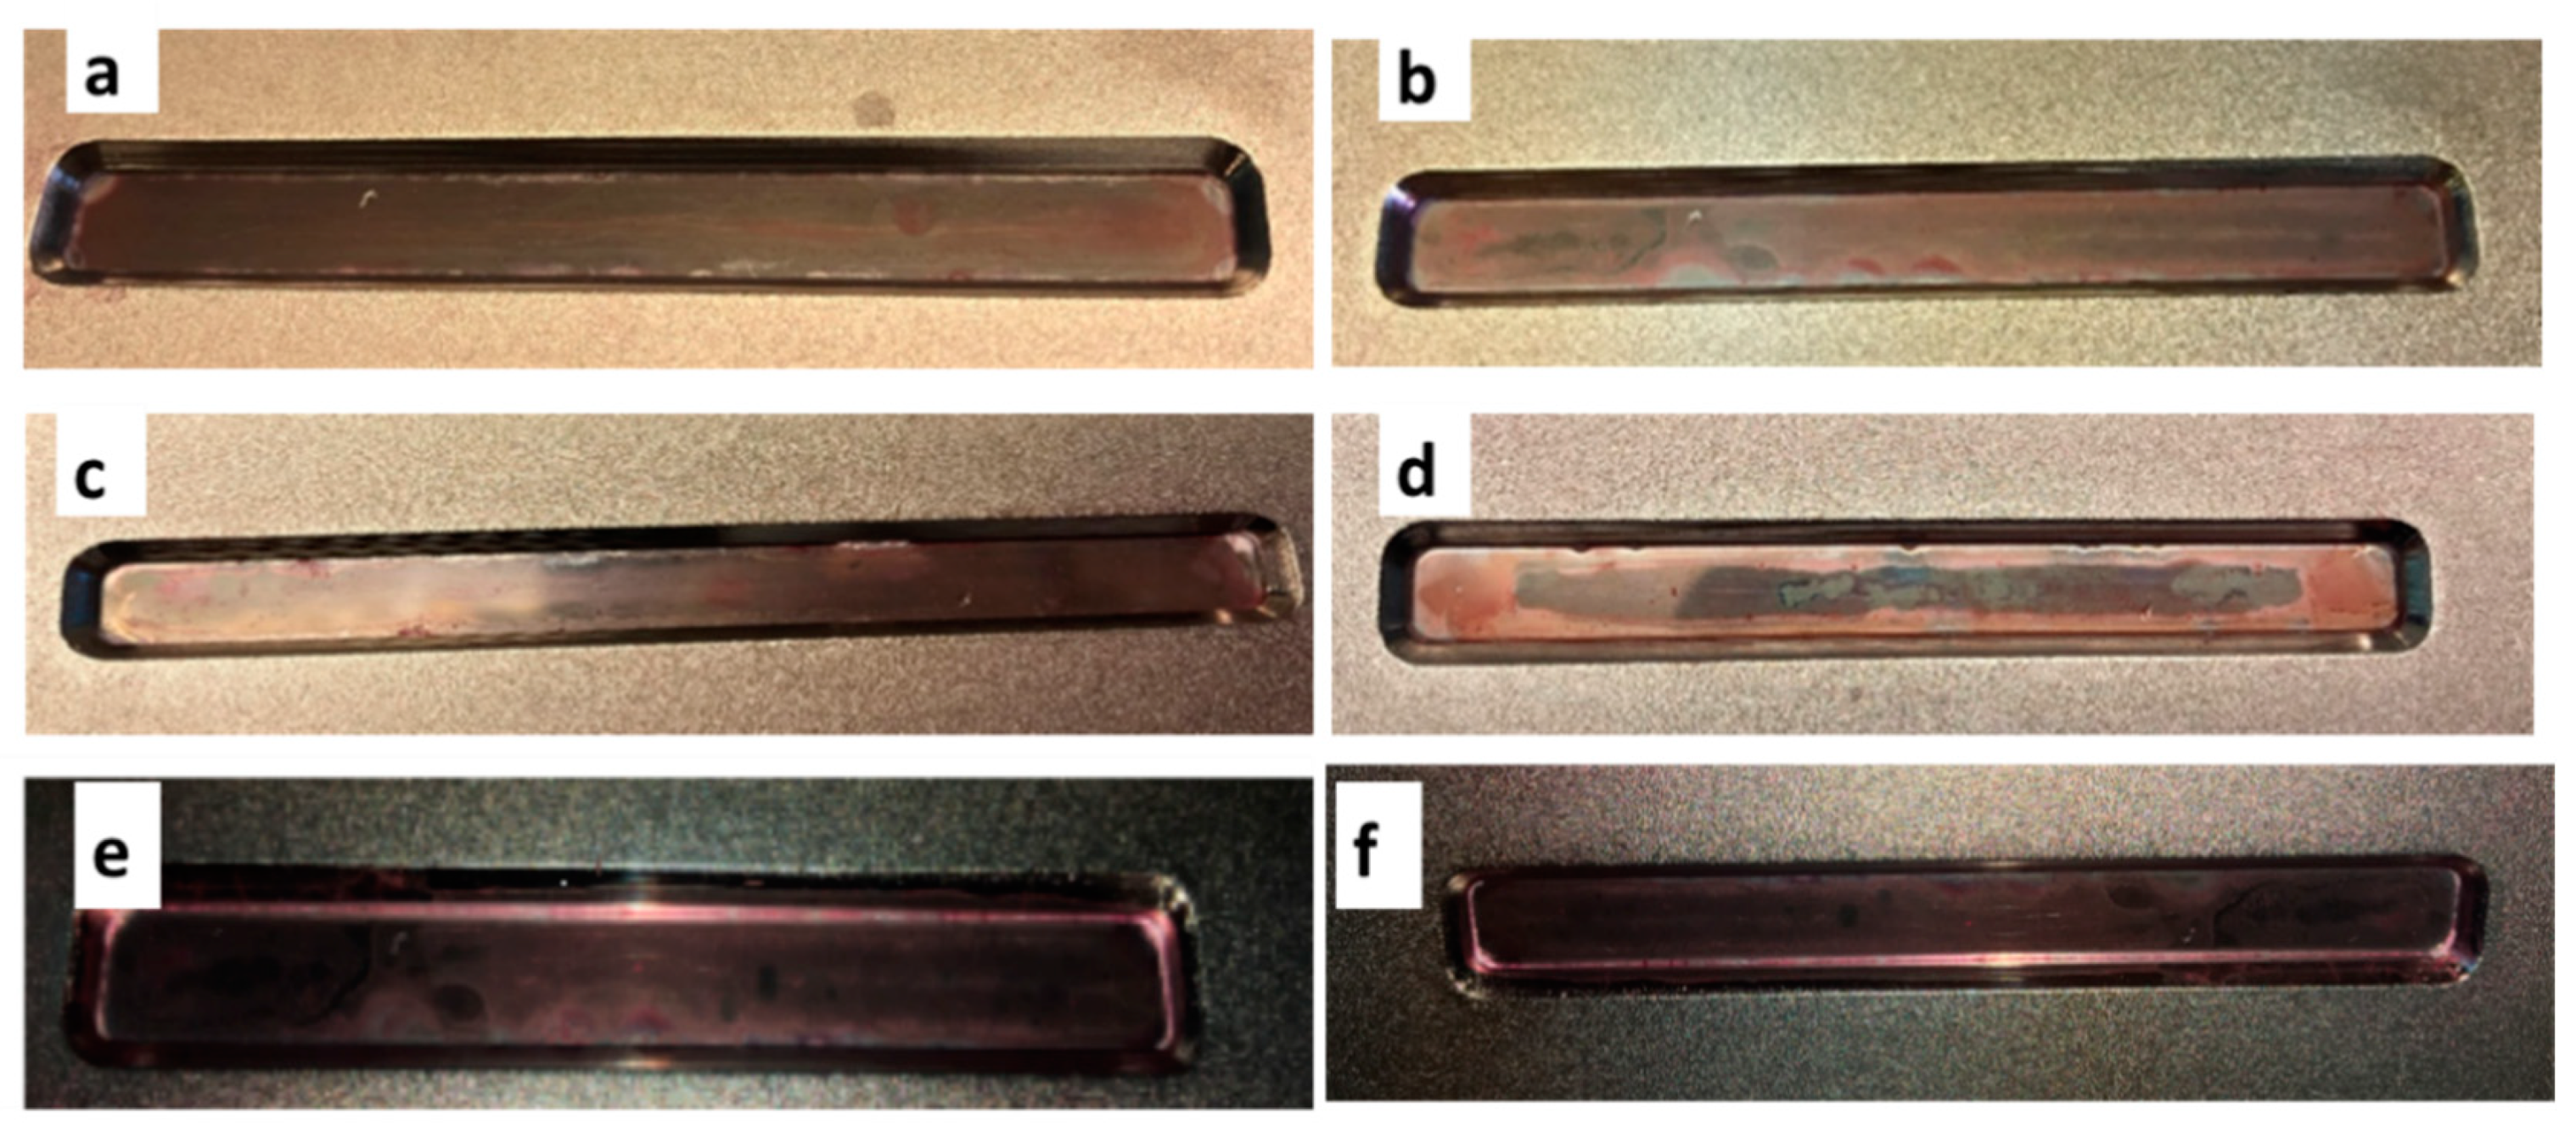
3.7. Bacteria Staining Test

Figure 9 shows the surface of the ATR crystal, after washing treatment, stained with safranin dye. In all the experiments pink colored surfaces are evident, thus highlighting the presence of bacteria attached to the surface. Both the bacteria under all the selected conditions tested positive on safranin test after 180 min of contact.

4. Conclusions

This study highlights the influence of environmental condition on the chemistry of bacteria cell surfaces and biofilm, during the early stage of bacteria attachment to the surface.
The amount of bacterial EPS in the different media was monitored by crystal violet assay for the same time interval as spectroscopy experiment. In addition, the presence of bacterial EPS on the ATR crystal was confirmed by O-safranin staining at the end of each experiment.
Dominant functional groups of bacterial EPS were, as expected, carboxyl, amide, phosphate, hydroxyl, and carbohydrate related moieties. Both the bacterial species, at planktonic phase, show all the IR bands expected, but with an evident difference in proteins/polysaccharides ratio. SE shows a strong band in Zone III due to polysaccharides vibrational absorption, while, conversely, the PF is characterized by a strong band in Zone I related to protein vibrational absorption, together with a weak polysaccharide absorption. The phospholipids and nucleic acid bands show similar intensities in both bacterial species, as expected, since the initial number of bacteria cells are almost the same and cell division and proliferation occur generally in a longer time with respect to the experiment timing.
Concerning the biofilm evolution over the time, both the bacterial species, are detectable on the surface within 45 and 75 min after the inoculation. In water both SE and PF start to produce plenty of proteins in a short time probably because they need to firmly attach to the surface, due to stressful lack of nutrients. The osmotic shock appears to be the driving force forcing the bacteria to attach to the surface. In fact, the presence of PBS (physiological ionic strength but no nutrients) and glucose mitigate this process. An exception was PF where a low amount of proteins was produced when glucose is added.
Independently on the environmental conditions (H2O, PBS, PBS-G) both SE and PF start to increase their polysaccharide content, even if with different kinetics and amounts, probably because of biofilm needs to counteract the lack of nutrients. After 180 min all spectra of SE and PF show an increase of polysaccharide bands intensity with respect to the inoculum with PBS and PBS-G samples.
The prevalent structure of the proteins has been highlighted by the second derivative study. PF proteins are mainly in α-helix and β-sheet conformation and their ratio is constant and independent on the media. Only in PBS medium the random coils component is visible. SE protein conformation at inoculum and in H2O are similar and composed of α-helix, random coils and β-sheet. The random coil conformation seems to decrease in PBS and PBS-G.

Author Contributions

Conceptualization, Validation, Formal analysis, Investigation, Writing—original draft, Writing—review and editing, M.C. and K.J.; Investigation and Validation, G.L. and A.P.; Conceptualization, Resources, Supervising, Coordination and Funding acquisition, C.R., E.R., K.W., A.B. and A.M. All authors have read and agreed to the published version of the manuscript.

Funding

This work was supported by the European Union’s Horizon 2020 research and innovation programme under grant agreement No. 722871 and CO-FUND–MANUNET III-NON-ACT-project ref. MNET17/NMAT-0061.

Conflicts of Interest

The authors declare no conflict of interest.

References

  1. Flemming, H.-C. The perfect slime. Colloids Surf. B Biointerfaces 2011, 86, 251–259. [Google Scholar] [CrossRef]
  2. Pamp, S.J.; Gjermansen, M.; Tolker-Nielsen, T. The Biofilm Matrix: A Sticky Framework. In Bacterial Biofilm Formation and Adaptation; Givskov, M.C., Ed.; Horizon BioScience: Norfolk, UK, 2007; Volume 34, pp. 37–69. [Google Scholar]
  3. Watnick, P.; Kolter, R. Biofilm, City of Microbes. J. Bacteriol. 2000, 182, 2675–2679. [Google Scholar] [CrossRef] [PubMed] [Green Version]
  4. Flemming, H.-C.; Wingender, J.; Szewzyk, U.; Steinberg, P.; Rice, S.A.; Kjelleberg, S. Biofilms: An emergent form of bacterial life. Nat. Rev. Microbiol. 2016, 14, 563–575. [Google Scholar] [CrossRef] [PubMed]
  5. Costerton, J.W. Bacterial Biofilms: A Common Cause of Persistent Infections. Science 1999, 284, 1318–1322. [Google Scholar] [CrossRef] [PubMed] [Green Version]
  6. Bahn, Y.-S.; Xue, C.; Idnurm, A.; Rutherford, J.C.; Heitman, J.; Cardenas, M.E. Sensing the environment: Lessons from fungi. Nat. Rev. Microbiol. 2007, 5, 57–69. [Google Scholar] [CrossRef] [PubMed]
  7. Yin, W.; Wang, Y.; Liu, L.; He, J. Biofilms: The Microbial “Protective Clothing” in Extreme Environments. Int. J. Mol. Sci. 2019, 20, 3423. [Google Scholar] [CrossRef] [Green Version]
  8. Harrison, J.J.; Ceri, H.; Turner, R.J. Multimetal resistance and tolerance in microbial biofilms. Nat. Rev. Microbiol. 2007, 5, 928–938. [Google Scholar] [CrossRef]
  9. Fulaz, S.; Vitale, S.; Quinn, L.; Casey, E. Nanoparticle–Biofilm Interactions: The Role of the EPS Matrix. Trends Microbiol. 2019, 27, 915–926. [Google Scholar] [CrossRef]
  10. Whitchurch, C.B. Extracellular DNA Required for Bacterial Biofilm Formation. Science 2002, 295, 1487. [Google Scholar] [CrossRef]
  11. Tolker-Nielsen, T. Biofilm Development. Microbiol. Spectr. 2015, 3. [Google Scholar] [CrossRef] [Green Version]
  12. Davies, D.G. The Involvement of Cell-to-Cell Signals in the Development of a Bacterial Biofilm. Science 1998, 280, 295–298. [Google Scholar] [CrossRef] [PubMed] [Green Version]
  13. De Kievit, T.R.; Gillis, R.; Marx, S.; Brown, C.; Iglewski, B.H. Quorum-Sensing Genes in Pseudomonas aeruginosa Biofilms: Their Role and Expression Patterns. Appl. Environ. Microbiol. 2001, 67, 1865–1873. [Google Scholar] [CrossRef] [Green Version]
  14. Carniello, V.; Peterson, B.W.; van der Mei, H.C.; Busscher, H.J. Physico-chemistry from initial bacterial adhesion to surface-programmed biofilm growth. Adv. Colloid Interface Sci. 2018, 261, 1–14. [Google Scholar] [CrossRef] [PubMed]
  15. Serra, D.O.; Richter, A.M.; Hengge, R. Cellulose as an Architectural Element in Spatially Structured Escherichia coli Biofilms. J. Bacteriol. 2013, 195, 5540–5554. [Google Scholar] [CrossRef] [PubMed] [Green Version]
  16. Rohde, H.; Frankenberger, S.; Zähringer, U.; Mack, D. Structure, function and contribution of polysaccharide intercellular adhesin (PIA) to Staphylococcus epidermidis biofilm formation and pathogenesis of biomaterial-associated infections. Eur. J. Cell Biol. 2010, 89, 103–111. [Google Scholar] [CrossRef] [PubMed]
  17. McDougald, D.; Rice, S.A.; Barraud, N.; Steinberg, P.D.; Kjelleberg, S. Should we stay or should we go: Mechanisms and ecological consequences for biofilm dispersal. Nat. Rev. Microbiol. 2012, 10, 39–50. [Google Scholar] [CrossRef]
  18. Franklin, M.J.; Nivens, D.E.; Weadge, J.T.; Howell, P.L. Biosynthesis of the Pseudomonas aeruginosa Extracellular Polysaccharides, Alginate, Pel, and Psl. Front. Microbiol. 2011, 2, 167. [Google Scholar] [CrossRef] [Green Version]
  19. Colvin, K.M.; Irie, Y.; Tart, C.S.; Urbano, R.; Whitney, J.C.; Ryder, C.; Howell, P.L.; Wozniak, D.J.; Parsek, M.R. The Pel and Psl polysaccharides provide Pseudomonas aeruginosa structural redundancy within the biofilm matrix: Polysaccharides of the P. aeruginosa biofilm matrix. Environ. Microbiol. 2012, 14, 1913–1928. [Google Scholar] [CrossRef] [Green Version]
  20. Conrad, A.; Kontro, M.; Keinänen, M.M.; Cadoret, A.; Faure, P.; Mansuy-Huault, L.; Block, J.-C. Fatty acids of lipid fractions in extracellular polymeric substances of activated sludge flocs. Lipids 2003, 38, 1093–1105. [Google Scholar] [CrossRef]
  21. Romero, D.; Vlamakis, H.; Losick, R.; Kolter, R. An accessory protein required for anchoring and assembly of amyloid fibres in B. subtilis biofilms: B. subtilis amyloid fibre accessory protein. Mol. Microbiol. 2011, 80, 1155–1168. [Google Scholar] [CrossRef] [Green Version]
  22. Grunert, T.; Monahan, A.; Lassnig, C.; Vogl, C.; Müller, M.; Ehling-Schulz, M. Deciphering Host Genotype-Specific Impacts on the Metabolic Fingerprint of Listeria monocytogenes by FTIR Spectroscopy. PLoS ONE 2014, 9, e115959. [Google Scholar] [CrossRef] [PubMed] [Green Version]
  23. Sutherland, I. The biofilm matrix—An immobilized but dynamic microbial environment. Trends Microbiol. 2001, 9, 222–227. [Google Scholar] [CrossRef]
  24. Klausen, M.; Heydorn, A.; Ragas, P.; Lambertsen, L.; Aaes-Jørgensen, A.; Molin, S.; Tolker-Nielsen, T. Biofilm formation by Pseudomonas aeruginosa wild type, flagella and type IV pili mutants: Roles of bacterial motility in the formation of the flat P. aeruginosa biofilm. Mol. Microbiol. 2003, 48, 1511–1524. [Google Scholar] [CrossRef]
  25. Chen, R.; Guo, C.; Chu, W.; Jiang, N.; Li, H. ATR-FTIR study of Bacillus sp. and Escherichia coli settlements on the bare and Al2O3 coated ZnSe internal reflection element. Chin. Chem. Lett. 2019, 30, 115–119. [Google Scholar] [CrossRef]
  26. Genkawa, T.; Ahamed, T.; Noguchi, R.; Takigawa, T.; Ozaki, Y. Simple and rapid determination of free fatty acids in brown rice by FTIR spectroscopy in conjunction with a second-derivative treatment. Food Chem. 2016, 191, 7–11. [Google Scholar] [CrossRef] [PubMed]
  27. Pink, J.; Smith-Palmer, T.; Chisholm, D.; Beveridge, T.J.; Pink, D.A. An FTIR study of Pseudomonas aeruginosa PAO1 biofilm development: Interpretation of ATR–FTIR data in the 1500–1180 cm−1 region. Biofilms 2005, 2, 165–175. [Google Scholar] [CrossRef]
  28. Pink, J.; Smith-Palmer, T.; Beveridge, T.J.; Pink, D.A. An FTIR study of Pseudomonas aeruginosa PAO1 biofilm growth and dispersion. An improved ATR method for studying biofilms: The C–H stretch spectral region. Biofilms 2004, 1, 157–163. [Google Scholar] [CrossRef]
  29. Cwalina, B.; Dec, W.; Michalska, J.K.; Jaworska-Kik, M.; Student, S. Initial stage of the biofilm formation on the NiTi and Ti6Al4V surface by the sulphur-oxidizing bacteria and sulphate-reducing bacteria. J. Mater. Sci. Mater. Med. 2017, 28, 173. [Google Scholar] [CrossRef] [Green Version]
  30. Boualam, M.; Quilès, F.; Mathieu, L.; Block, J.-C. Monitoring the Effect of Organic Matter on Biofilm Growth in Low Nutritive Waters by ATR/FT-IR Spectroscopy. Biofouling 2002, 18, 73–81. [Google Scholar] [CrossRef]
  31. Van der Kooij, D. The occurrence of Pseudomonas spp. in surface water and in tap water as determined on citrate media. Antonie Leeuwenhoek 1977, 43, 187–197. [Google Scholar] [CrossRef]
  32. Van der Kooij, D.; Visser, A.; Oranje, J.P. Multiplication of fluorescent pseudomonads at low substrate concentrations in tap water. Antonie Leeuwenhoek 1982, 48, 229–243. [Google Scholar] [CrossRef] [PubMed]
  33. Pop, C.; Apostu, S.; Rotar, A.M.; Semeniuc, C.A.; Sindic, M.; Mabon, N. FTIR spectroscopic characterization of a new biofilm obtained from kefiran. J. Agroaliment. Process. Technol. 2013, 19, 157–159. [Google Scholar]
  34. Karadenizli, A.; Kolayli, F.; Ergen, K. A novel application of Fourier-transformed infrared spectroscopy: Classification of slime from staphylococci. Biofouling 2007, 23, 63–71. [Google Scholar] [CrossRef] [PubMed]
  35. Cappelli, A.; Razzano, V.; Paolino, M.; Grisci, G.; Giuliani, G.; Donati, A.; Mendichi, R.; Samperi, F.; Battiato, S.; Boccia, A.C.; et al. Bithiophene-based polybenzofulvene derivatives with high stacking and hole mobility. Polym. Chem. 2015, 6, 7377–7388. [Google Scholar] [CrossRef]
  36. Leone, G.; Consumi, M.; Franzi, C.; Tamasi, G.; Lamponi, S.; Donati, A.; Magnani, A.; Rossi, C.; Bonechi, C. Development of liposomal formulations to potentiate natural lovastatin inhibitory activity towards 3-hydroxy-3-methyl-glutaryl coenzyme A (HMG-CoA) reductase. J. Drug Deliv. Sci. Technol. 2018, 43, 107–112. [Google Scholar] [CrossRef]
  37. Genevaux, P.; Muller, S.; Bauda, P. A rapid screening procedure to identify mini-Tn10 insertion mutants of Escherichia coli K-12 with altered adhesion properties. FEMS Microbiol. Lett. 1996, 142, 27–30. [Google Scholar] [CrossRef] [PubMed]
  38. Quilès, F.; Humbert, F.; Delille, A. Analysis of changes in attenuated total reflection FTIR fingerprints of Pseudomonas fluorescens from planktonic state to nascent biofilm state. Spectrochim. Acta Part A Mol. Biomol. Spectrosc. 2010, 75, 610–616. [Google Scholar] [CrossRef]
  39. Fasasi, Y.A.; Mirjankar, N.; Fasasi, A. Fourier Transform Infrared Spectroscopic Analysis of Protein Secondary Structures Found in Egusi. Am. J. Appl. Ind. Chem. 2015, 1, 1–4. [Google Scholar]
  40. Bonechi, C.; Donati, A.; Tamasi, G.; Pardini, A.; Rostom, H.; Leone, G.; Lamponi, S.; Consumi, M.; Magnani, A.; Rossi, C. Chemical characterization of liposomes containing nutraceutical compounds: Tyrosol, hydroxytyrosol and oleuropein. Biophys. Chem. 2019, 246, 25–34. [Google Scholar] [CrossRef]
  41. Pietralik, Z.; Mucha-Kruczynska, I.; Kozak, M. FTIR analysis of protein secondary structure in solid and solution states. Synchrotron Radiation News 2012, 11, 52. [Google Scholar]
  42. Leone, G.; Consumi, M.; Pepi, S.; Lamponi, S.; Bonechi, C.; Tamasi, G.; Donati, A.; Rossi, C.; Magnani, A. Alginate–gelatin formulation to modify lovastatin release profile from red yeast rice for hypercholesterolemia therapy. Ther. Deliv. 2017, 8, 843–854. [Google Scholar] [CrossRef]
  43. Leone, G.; Consumi, M.; Lamponi, S.; Bonechi, C.; Tamasi, G.; Donati, A.; Rossi, C.; Magnani, A. Thixotropic PVA hydrogel enclosing a hydrophilic PVP core as nucleus pulposus substitute. Mater. Sci. Eng. C 2019, 98, 696–704. [Google Scholar] [CrossRef] [PubMed]
  44. Delille, A.; Quilès, F.; Humbert, F. In Situ Monitoring of the Nascent Pseudomonas fluorescens Biofilm Response to Variations in the Dissolved Organic Carbon Level in Low-Nutrient Water by Attenuated Total Reflectance-Fourier Transform Infrared Spectroscopy. AEM 2007, 73, 5782–5788. [Google Scholar] [CrossRef] [PubMed] [Green Version]
  45. Jiang, W.; Saxena, A.; Song, B.; Ward, B.B.; Beveridge, T.J.; Myneni, S.C.B. Elucidation of Functional Groups on Gram-Positive and Gram-Negative Bacterial Surfaces Using Infrared Spectroscopy. Langmuir 2004, 20, 11433–11442. [Google Scholar] [CrossRef]
  46. Jubeen, F.; Liaqat, A.; Amjad, F.; Sultan, M.; Iqbal, S.Z.; Sajid, I.; Khan Niazi, M.B.; Sher, F. Synthesis of 5-Fluorouracil Cocrystals with Novel Organic Acids as Coformers and Anticancer Evaluation against HCT-116 Colorectal Cell Lines. Cryst. Growth Des. 2020, 20, 2406–2414. [Google Scholar] [CrossRef]
  47. Jubeen, F.; Liaqat, A.; Sultan, M.; Zafar Iqbal, S.; Sajid, I.; Sher, F. Green synthesis and biological evaluation of novel 5-fluorouracil derivatives as potent anticancer agents. Saudi Pharm. J. 2019, 27, 1164–1173. [Google Scholar] [CrossRef] [PubMed]
  48. McWhirter, M.J.; Bremer, P.J.; McQuillan, A.J. Direct Infrared Spectroscopic Evidence of pH- and Ionic Strength-Induced Changes in Distance of Attached Pseudomonas a eruginosa from ZnSe Surfaces. Langmuir 2002, 18, 1904–1907. [Google Scholar] [CrossRef]
  49. Lasch, P. Spectral pre-processing for biomedical vibrational spectroscopy and microspectroscopic imaging. Chemom. Intell. Lab. Syst. 2012, 117, 100–114. [Google Scholar] [CrossRef] [Green Version]
  50. Bunaciu, A.A.; Fleschin, Ş.; Aboul-Enein, H.Y. Evaluation of the Protein Secondary Structures Using Fourier Transform Infrared Spectroscopy. Gazi Univ. J. Sci. 2014, 27, 637–644. [Google Scholar]
Figure 1. Relationship between time and adhesion of the two strains, to polystyrene micro-titer plates as function of environmental conditions.
Coatings 10 00930 g001
Figure 2. FTIR spectra of P. fluorescens (green) and Staphylococcus epidermidis (black).
Coatings 10 00930 g002
Figure 3. The evolution of Amide II (AMII) intensity band over the time.
Coatings 10 00930 g003
Figure 4. Evolution of polysaccharide (PS) intensity band over the time.
Coatings 10 00930 g004
Figure 5. FTIR spectra of S. epidermidis after 180 min in H2O, phosphate buffered solution (PBS), and PBS with glucose (PBS-G) compared with inoculum.
Coatings 10 00930 g005
Figure 6. FTIR spectra of P. fluorescens after 180 min in H2O, PBS, and PBS-G compared with inoculum.
Coatings 10 00930 g006
Figure 7. Second derivatives of the FTIR spectra of S. epidermidis (SE) biofilms at Inoculum (upper left), in H2O (upper right), PBS (lower left) and PBS-G (lower right) (for related spectra see Figure 5).
Coatings 10 00930 g007
Figure 8. Second derivatives of the FTIR spectra of PF biofilms at Inoculum (upper left), in H2O (upper right), in PBS (lower left) and PBS-G (lower right) (for related spectra see Figure 6).
Coatings 10 00930 g008
Figure 9. Attenuated total reflectance (ATR) crystal, after the experiment, stained with safranin dye (a) P. fluorescens in H2O, (b) S. epidermidis in H2O, (c) P. fluorescens in PBS, (d) S. epidermidis in PBS, (e) P. fluorescens in PBS-G, (f) S. epidermidis in PBS-G.
Coatings 10 00930 g009
Table 1. Assignment of main infrared vibration bands in the 3000–900 cm−1 region of ATR-FTIR spectrum of Pseudomonas fluorescens pellet harvested by centrifugation. Key: ν—stretching, δ—bending, τ—twist, a-asymmetric, s—symmetric, LPS—lipopolysaccharides.
Tentative Assignment of the Main Band to the Relevant Functional GroupsRef
Wavenumber (cm−1)AssignmentPrincipal CompoundsMain Corresponding Cellular Compounds
1736νC=OEsters from lipidsMembranes[30,31,32,33,44]
1713νC=OEsters, carboxylic acidsNucleoid, ribosomes
1700–1580νC=O, νC=N, νC=C, δNHDNA, RNA basesNucleoid, ribosomes
1693–1627Amide I (νC=O coupled with δN-H), δH2OProteins, water (1640cm-1)Membranes, cytoplasm, flagella, pili, ribosomes[41]
1568-1531Amide II (δN-H coupled with νC-N)ProteinsMembranes, cytoplasm, flagella, pili, ribosomes[41]
1468,1455δCH2, δCH3LipidsMembranes[26,27,28]
1400νsCOO-Amino acids, fatty acids chainsCapsule, peptidoglycan
1317;1281τCH2; Amide III(νC-N coupled with δN-H)Fatty acids chains, proteinsMembranes, cytoplasm, flagella, pili, ribosomes
1238νa PO2-Phosphodiester, phospholipids, LPS, nucleic acids, ribosomesMembrane, nucleoids, ribosomes
1220νC-O-C-Capsule, storage inclusion[16,25,33,44]
1200–900νC-O, νC-C, δC-O-H, Polysaccharides-
-δC-O-C--
1172,1153νsC-OH, νC-OProteins, carbohydrates, esters-
1118νsCCPhosphodiester, phosphoilipidsNucleoids, ribosomes[20,28,40,41,42,43,44,45,46,47,48]
1086νsPO2-LPS, nucleic acidsMembranes, nucleoid, ribosomes[28,48]
1058νsC-O-C,PolysaccharidesCapsule, peptidoglycan[16,33,40,44]
- νsP-O-C (R-O-P-O-R’) --
1041νO-H coupled with δC-OPolysaccharidesCapsule, peptidoglycan[42,43,44,45]
1026CH2OHCarbohydratesStorage inclusion[28,40,47]
993-Ribose skelet (ARN)Ribosomes
970νC-C,νP-O-PRNA backboneRibosomes
Table 2. P. fluorescens (PF) and SE Second derivative Amide I band frequencies and assignment to proteins secondary structure in Inoculum, H20, PBS, and PBS-G media.
InoculumH2OPBSPBS-GAssignment
Frequencies (cm−1)
Pseudomonas Fluorescent
1656165616591658α-helix
--1648-Random coils
1628163816391639β-sheet
Staphylococcus Epidermidis
1681,16691681--β-sheet
1659166016561655α-helix
16481648--Random coils
1637,1626162616391639β-sheet

