Article

Effects of Inorganic ZnO Particle Doping on Crystalline Polymer Morphology and Space Charge Behavior

Mechanical and Electrical Engineering Institute, University of Electronic Science and Technology of China, Zhongshan Institute, Zhongshan 528400, China
*
Author to whom correspondence should be addressed.
Coatings 2020, 10(10), 932; https://doi.org/10.3390/coatings10100932
Submission received: 28 August 2020 / Revised: 19 September 2020 / Accepted: 23 September 2020 / Published: 29 September 2020

Abstract

:
This study further investigated the synergistic effect of micro- and nanofiller doping on matrix material space charges and breakdown characteristics. Accordingly, low-density polyethylene (LDPE) was used as the matrix material, and spherical ZnO particles with sizes of 30 nm and 1 µm were used as additives. Micro-ZnO/LDPE, nano-ZnO/LDPE, and micro-nano-ZnO/LDPE composites were prepared through melt blending. The crystalline morphologies of the composites were observed via polarized light microscopy. The composite crystallinity and melting peak temperature were measured via differential scanning calorimetry, and the micro- and nanoparticle dispersions in the matrix were observed via scanning electron microscopy. The test results showed that the particles were uniformly dispersed in the polyethylene matrix. The filler acted as a heterogeneous nucleation agent in the matrix. The crystal size decreased, thereby increasing the crystal quantity. The doping of inorganic ZnO particles improved the composite crystallinity. The ZnO/LDPE composites were subjected to DC breakdown, space charge, and dielectric spectrum tests. When the crystal arrangement of the sample was loose and its size was large, the breakdown process developed along a shorter path, and the field strength of the composite breakdown decreased. The order of AC and DC breakdown field strengths of the samples was as follows: micro-ZnO/LDPE < pure LDPE < micro-nano-ZnO/LDPE < nano-ZnO/LDPE. The DC and AC breakdown field strengths of the micro- and nano-ZnO/LDPE were 4.7% and 3.2% higher than those of the pure LDPE, respectively. Moreover, the DC and AC breakdown field strengths of the nano-ZnO/LDPE were 11.02% and 15.8% higher than those of the pure LDPE, respectively. The doping of inorganic ZnO particles restrained the space charge accumulation, and the residual charges decreased after short-circuit treatment. The dielectric constant of all nanocomposites was lower than that of LDPE, and the dielectric loss of all composites was higher than that of LDPE.

1. Introduction

The use of electric power has promoted human progress. The kinetic energy produced by electrical energy is used in our daily lives as well as in industrial production and national security. Insulation materials are key components in the acquisition, transformation, and transmission of electric power. With the increasing development of high-voltage electric equipment, there is a growing need for power supply reliability. Improved dielectric strength and prolonged service life of electrical equipment can ensure stable operation of a power system. According to experimental results, the working field strength of insulation materials is only one-tenth of the breakdown field strength. However, after a long-term operation, insulation material will suffer from electrical treeing as it ages before ultimately breaking down [1,2,3]. To improve the dielectric strength of polymers, several scholars have conducted considerable research by doping polyolefin materials with additives—first with microcomposites and more recently with nanocomposites. In 2002, Nelson et al. found that nanoparticle doping changes the dielectric properties of a pure polymer matrix [4]. Consequently, nanocomposites have received increasing attention, and numerous satisfactory effects have been achieved in many subject areas. Nanocomposites are a current research hotspot in the field of electrical insulation. The breakdown characteristics of polythene can be improved by doping with additives, such as MgO, MMT, and SiO2 [5,6,7,8]. Nanoparticle doping can reduce the number of flaws in polymers, change the crystalline morphology of polymers, and promote carrier migration. However, the electric field concentration of insulation remains limited [9,10,11]. Polymer thermal properties, such as thermal stability and glass transition temperature, have been improved [12,13]. However, inorganic additives degrade dielectric performance in other respects. For example, microcomposites can improve polymer thermal properties, but they reduce the breakdown field strength of polymers. Moreover, nanocomposites can improve the electrical properties of polymers, but they reduce the glass transition temperature [14,15,16,17,18,19].
The synergistic effect of micro- and nanofiller doping on matrix material space charges and breakdown characteristics has not been deeply explored in existing studies. ZnO is a semiconductor material whose conductivity depends on its field strength. Nonlinear composite insulation materials can be prepared with ZnO, and the conductivity and dielectric constant of these materials change with the electric field strength. The electric field distribution is homogenized in a complex insulation structure, thereby increasing the dielectric strength of the insulation structure. Accordingly, ZnO has been widely used in high-voltage cables. Additionally, ZnO particles possess excellent properties, such as quantum, surface, and volume effects. Therefore, in this study, low-density polyethylene (LDPE) was used as a matrix material. The effect of micro- and nano-ZnO doping on the microcrystalline morphology, breakdown characteristics, and space charge characteristics of LDPE was investigated using different sizes of inorganic particles. Furthermore, the microinfluence mechanism and macro-dielectric properties of micro- and nanocomposites were explored to provide a theoretical basis for research on new high-voltage insulation materials.

2. Sample Preparation and Methods

2.1. Experimental Materials and Sample Preparation

The primary equipment and raw materials used in this study are detailed in Table 1.
In order to improve the surface characteristics of inorganic particles, the ZnO particles were dealt with surface modification by a silane coupling agent. In this way, the ZnO particles dispersed uniformly in the matrix resin. Besides, the compatibility between the inorganic particles and the polymer matrix was improved. The specific process was as follows: First, the nano-ZnO powder was dried in the oven for 24 h. A certain amount of nano-ZnO powder was weighed and dissolved in the mix liquid of absolute alcohol with water. After ultrasonic vibration for 1 h, the mix liquid was poured into a three-necked flask. Then this three-necked flask was placed into an 85 °C thermostat water bath, and the mixture was dealt with electric stirring for 2 h. After stirring uniformly, the silane coupling agent was cautiously added into the mixture for dropwise. Then the mixture was filtrated and cleaned by funnel and filter flask several times. After the drying and attrition process, the nano-ZnO particles with surface modification were prepared. They were used for micro–nanocomposite preparation.
To prepare the samples, first, the LDPE and ZnO particles were blended in a rotational rheometer for 15 min. The temperature was set to 150 °C. Second, the samples were pressed using a plate vulcanizing machine for 15 min with a pressure of 14.5 MPa. Subsequently, samples of 100, 200, and 300 μm in thickness were prepared for breakdown, polarized light microscopy (PLM), differential scanning calorimetry (DSC), conductivity, and space charge testing. Further, the 200 μm thick samples were evaporated in an aluminum three-electrode system.

2.2. Experimental Methods

2.2.1. PLM Test

PLM was used to observe different samples and characterize the effect of doping inorganic ZnO particles on LDPE crystallization. Before the test, all samples were placed in a solution containing a mixture of 5% potassium permanganate and concentrated sulfuric acid. The samples were removed after 5–6 h of immersion corrosion. The sample surface was cleaned of any remaining acid with deionized water. Subsequently, the samples were placed in an ultrasonic machine for concussion cleaning and laid on a slide for crystallization observation.

2.2.2. DSC Test

In this test, the different samples’ parameter changes in crystallization were detected by a differential scanning calorimeter. This test was carried out under the protection of nitrogen. The flow of nitrogen was 150 mL/min. The heating and cooling rates were both 10 °C/min. In order to avoid the test result deviation caused by the samples’ thermal history, all the samples were heated up to 150 °C until the materials were fully melted. Then they were cooled down to room temperature at a constant rate. The enthalpy change in the cooling process was recorded. The crystallization peak temperature Tc and the width of the exothermic crystallization peak ΔTc were obtained. After that, these samples were heated up to 150 °C again. The enthalpy change in the heating process was recorded, from which the composite melting enthalpy ΔHm and melting temperature Tm were obtained. Among them, Tm was determined by melting ending temperature. The higher was the melting temperature Tm, the larger was the spherulite size. When the crystallization rate was highest, the corresponding temperature was the crystallization peak temperature Tc. In addition, the width of the exothermic crystallization peak ΔTc was the width of half peak in the exothermic peak. According to Equation (1), the different samples’ crystallinity Xc was calculated [20]:
X c = Δ H m ( 1 ω ) H 0 × 100 %
where ΔHm is the melting enthalpy (J/g); H0 is the melting enthalpy under holocrystalline, which was 293.6 J/g for LDPE; and ω is the ZnO mass fraction in the composite.

2.2.3. SEM Test

To precisely characterize the particle dispersion, all test samples were placed in liquid nitrogen for brittle failure testing. The micro- and nanocomposite morphologies were observed via scanning electron microscopy (SEM), including the particle sizes and aggregation states, from which the inorganic particle dispersion in the matrix was determined.

2.2.4. AC/DC Breakdown Test

Before the AC/DC breakdown test, the samples were pretreated and then placed in an 80 °C vacuum drying oven for 24 h. To avoid sample surface discharge and uneven heat radiation, the electrode system and samples were immersed in cable oil throughout the experiment. The system accelerated at a uniform speed of 1 kV/s until the samples broke down. The voltage values of the breakdown points U were recorded, and the breakdown point thickness d was measured. The composite breakdown strength E was calculated using the formula E = U/d. A total of 30 breakdown points per sample were tested. These experimental data were analyzed by Minitab, from which the shape parameter β of the samples under Weibull distribution and Weibull breakdown strength E0 was obtained. In the AC breakdown test, the frequency AC system was used. Meanwhile, in the DC breakdown test, the samples were tested under the action of a DC electric field.

2.2.5. Space Charge Test

The composite space charge distribution was tested using the pulsed electroacoustic technique. The sample thickness and diameter were 300 μm and 70 mm, respectively. At applied electric fields of 10, 20, and 40 kV/mm, all samples were subjected to 30 min of pressure and 30 min of short-circuit treatment, thereby testing their space charge distributions.
In this study, a nanocomposite with 3% nanoparticle mass fraction, microcomposite with 3% microparticle mass fraction, and composite with 3% nanoparticle and 2% microparticle mass fractions are marked as N3, M3, and N3M2, respectively.

3. Results and Analysis

3.1. PLM Characterization Results and Analysis

The crystalline states of the samples are shown in Figure 1.
Figure 1a shows that the crystal size of the pure LDPE was small. The nano-ZnO particle doping resulted in a large number of heterogeneous nuclei. LDPE spherulites collided with other spherulites, thereby restricting their sizes. As shown in Figure 1b, the nano-ZnO particle doping reduced the composite crystal size. The grain arrangement was dense, and the interface structure was strengthened. Moreover, the crystalline morphology of sample N3 was complicated, and its nanocrystalline area was small, because the spherical nano-ZnO particles acted as heterogeneous nucleation agents in the matrix materials. During the LDPE crystallization, several heterogeneous nuclei were introduced by the ZnO particle doping. The cell sizes of the matrix LDPE decreased, and the crystalline morphology was dense. The crystalline cores in the pure LDPE were formed by the molecular movement of the melts. The nucleation rate was slow, and the number of crystal nuclei was low, thereby increasing the cell size of the pure LDPE. As shown in Figure 1c, compared with sample M3, sample N3 had smaller but more abundant spherulites, and its grain arrangement was denser and more regular. This was because a more heterogeneous nucleus was introduced into the composites by the nano-ZnO particle doping. As shown in Figure 1d, the spherulite sizes of sample N3M2 were between those of samples M3 and N3, which was attributed to the synergistic effect of the microparticles and nanoparticles.

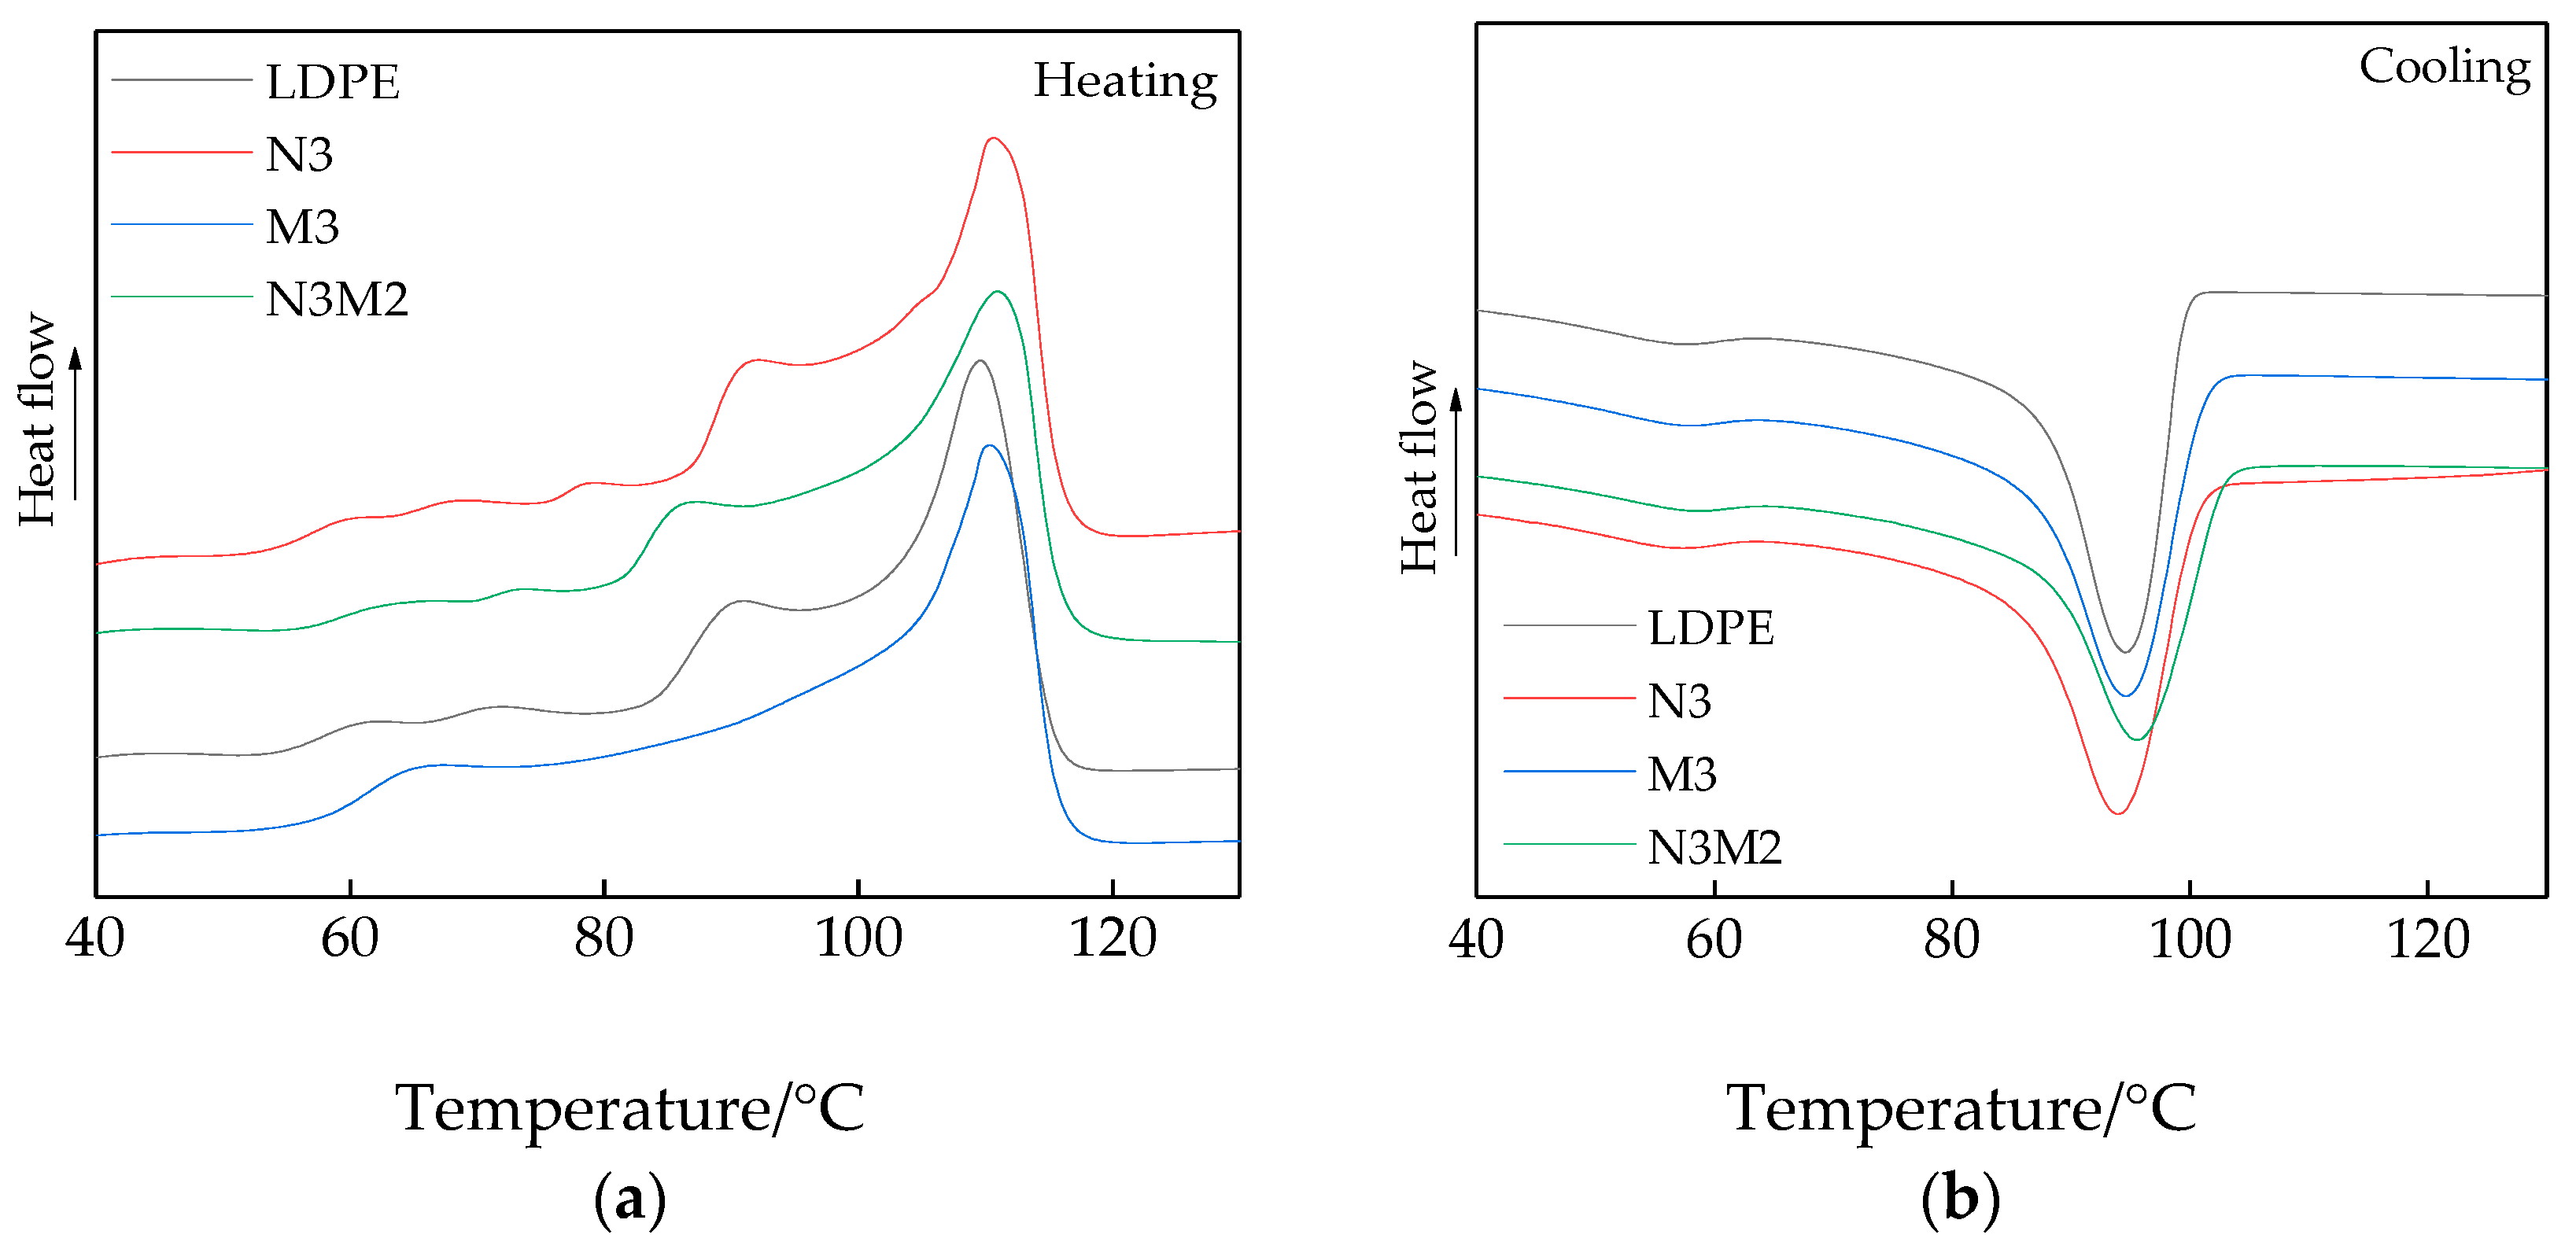
3.2. DSC Characterization Results and Analysis

In both samples M3 and N3, the mass fractions of the ZnO particles were 3 wt%. In sample N3M2, the mass fractions of the nano-ZnO particles and micro-ZnO particles were 3 and 2 wt%, respectively. The heating and cooling DSC curves of the samples are shown in Figure 2.
The isothermal crystallization and melting process parameters of the samples are shown in Table 2.
The experimental results shown in Figure 2 and Table 2 reveal that the composite crystallinity of the doped samples was higher than that of the pure LDPE. The percentage increase in composite crystallinity varied with the doping of different ZnO particles. The order of crystallinity of the samples was N3M2 > N3 > M3 > LDPE. According to the heterogeneous nucleation theory [21], the nucleation agent plays the role of a heterogeneous nucleus during the polymer crystallization, which promotes the formation of the nucleus. Nano-ZnO particle doping generated several nucleation centers in the composites and increased the density of the nucleation sites. The LDPE molecules crystallized around the ZnO particles, thereby increasing the composite crystallinity. However, the size of the microspherical ZnO particles was large. Contrary to the heterogeneous nucleation effect, the steric effect was evident. Additionally, during the DSC orientation, the lower was the temperature related to the melting peak of the samples, the lower was the polymer crystallization rate. The melting peak temperature Tm was related to the largest crystallization rate; therefore, the crystallization rate order of the samples was LDPE < N3 < M3 < N3M2. The test results showed that ZnO particle doping can increase the composite crystallization rate and simultaneously improve the thermal conductivity of the composites, thus preventing heat accumulation. Therefore, the melting peak temperatures of all the composites were higher than that of the pure LDPE. This phenomenon was consistent with the PLM test results. To summarize, doping with micro- and nano-ZnO particles can effectively increase the crystallinity and crystallization rate of LDPE. The crystalline structure of the polymers changed, which affected the macro-properties of the composite.
The micro- and nanoparticle doping made a certain influence on the polymer crystalline structure and dielectric properties. The inorganic ZnO particles possessed high surface energy and reacted with the polyethylene molecule chain strongly. So the inorganic particle doping acted as the heterogeneous nucleation, which affected the composite crystallization. The nano-ZnO particles played the role of physical cross-linking points, which adsorbed part of the polymer chains on the particle surface. After the surface modification by the coupling agent, there were some lipophilic groups on the nano-ZnO particle surface. So the nano-ZnO particles combined with the polyethylene matrix closely by covalent bond. Furthermore, the micro-ZnO particle doping introduced the steric effect. The polymer molecule chains would form the dense homogeneous cells around the microparticles. Because the nucleation site density on the inorganic particle surface was high, the spherulite nucleus growing up toward a three-dimensional space was seriously hindered. They just grew perpendicular to the particle surface, that is, along the one-dimensional space. Finally, the cylindrical crystalline structure was formed, that is, interface transcrystalline. This was an important interface bonding form, which improved the bonding condition between the inorganic particles and the polymer. The interface defects decreased. The electrical stress would be transferred from the polymer matrix to the inorganic particles, which improved the composite dielectric properties.
Combining the PLM and DSC test results, the micro- and nanoparticle doping acted as the nucleation agent, which promoted the ordered arrangement of the LDPE molecule chains. The macromolecule chains of the pure LDPE grew around the inorganic ZnO particles. The crystallinity order of the four samples was LDPE < M3 < N3 < N3M2. When the ZnO particles increased, the crystal quantity per volume in the polymers also increased. So the crystallinities of the different ZnO/LDPE composites were all higher than that of the pure LDPE. Besides, the ZnO particles possessed excellent heat resistance and thermal conductivity, which transferred heat quickly. Therefore, the melting temperature Tm of the ZnO/LDPE composites was higher. The corona-resistance breakdown characteristics and space charge distribution of the composites were improved. The micro- and nanoparticle doping introduced a close crystalline structure. The interface structure was perfect. Because of the interface trap effect, the carrier was captured, which improved the samples’ conductivity characteristics. In summary, the micro- and nano-ZnO particle doping improved the polymer crystalline structure, which affected the electrical properties of the polymer composites.

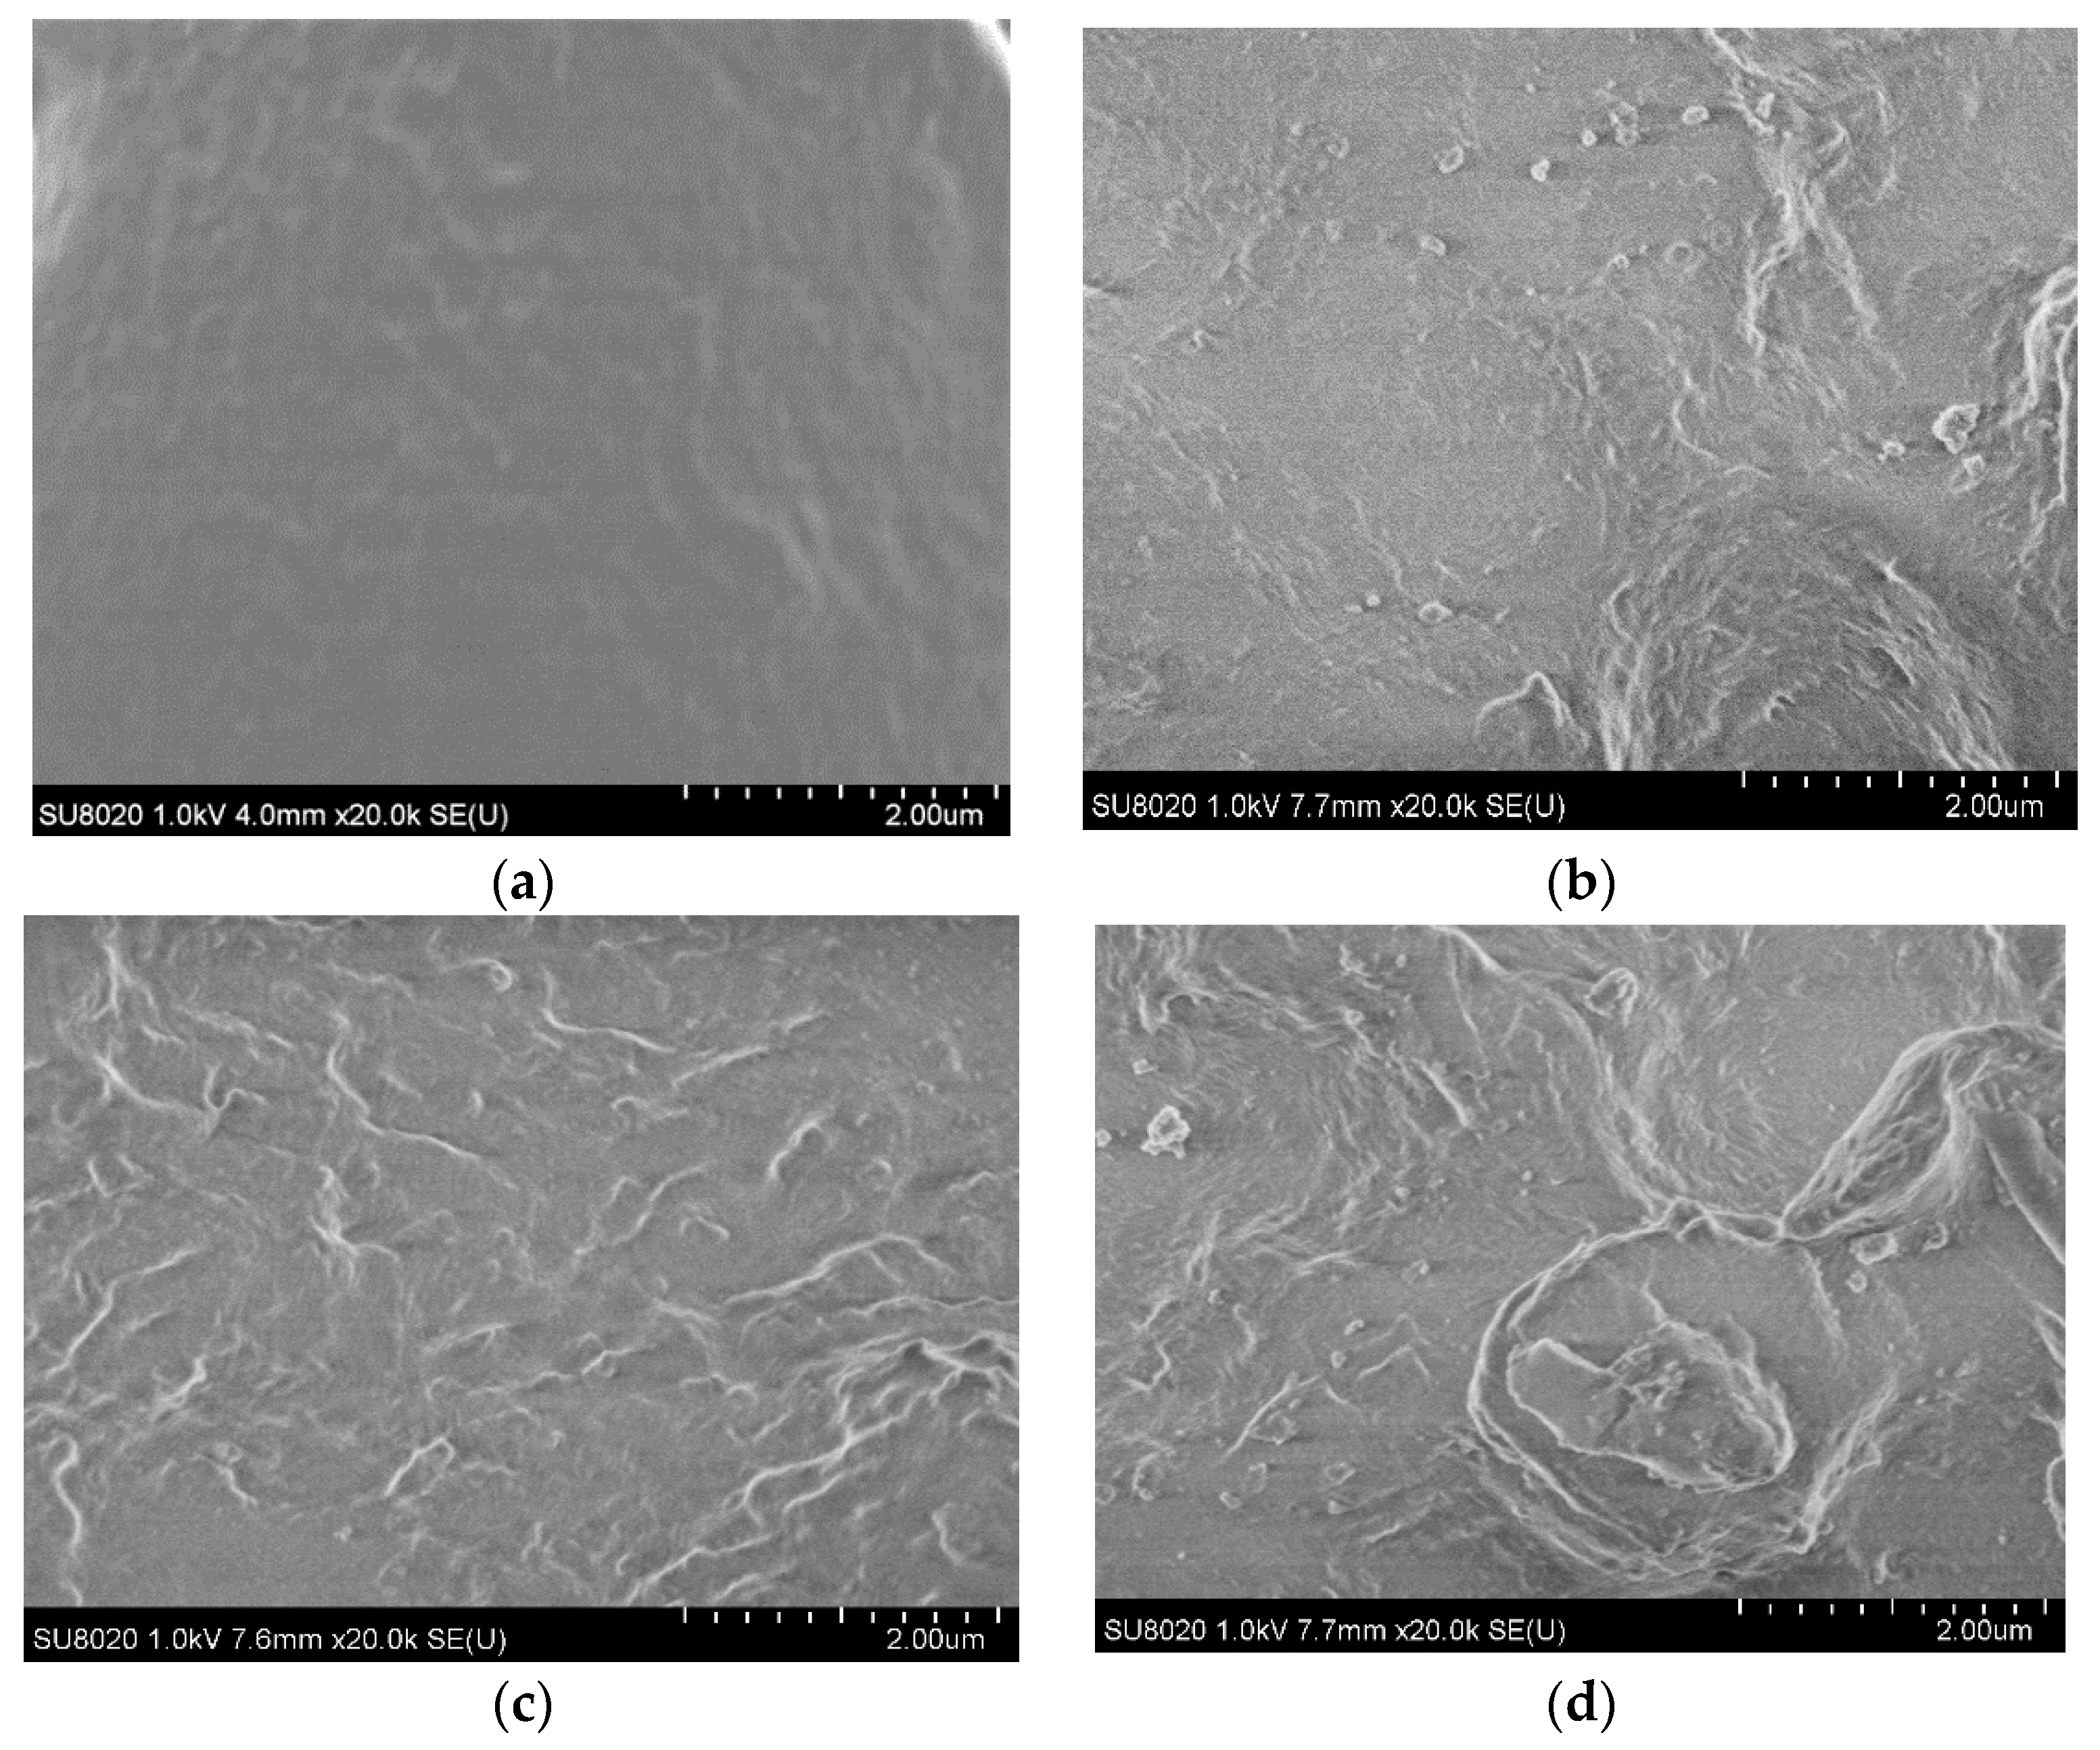
3.3. SEM Characterization Results and Analysis

The SEM characterization results of the samples are shown in Figure 3.
In Figure 3, the ZnO particles and matrix LDPE are denoted by the light and dark areas, respectively. The agglomeration of inorganic particles in the matrix resin was not evident from the test results, and the ZnO particles were uniformly dispersed. Besides, according to the test result, there was no large particle agglomeration. The inorganic phase dimension of the nanocomposites was smaller, and the interface effects were evident. However, the inorganic phase dimensions of the microcomposites were larger. Combining the PLM and DSC test results revealed that with the inorganic particles acting as nucleation centers, the crystal size of the nanocomposites was smallest, and those of the microcomposites were largest.

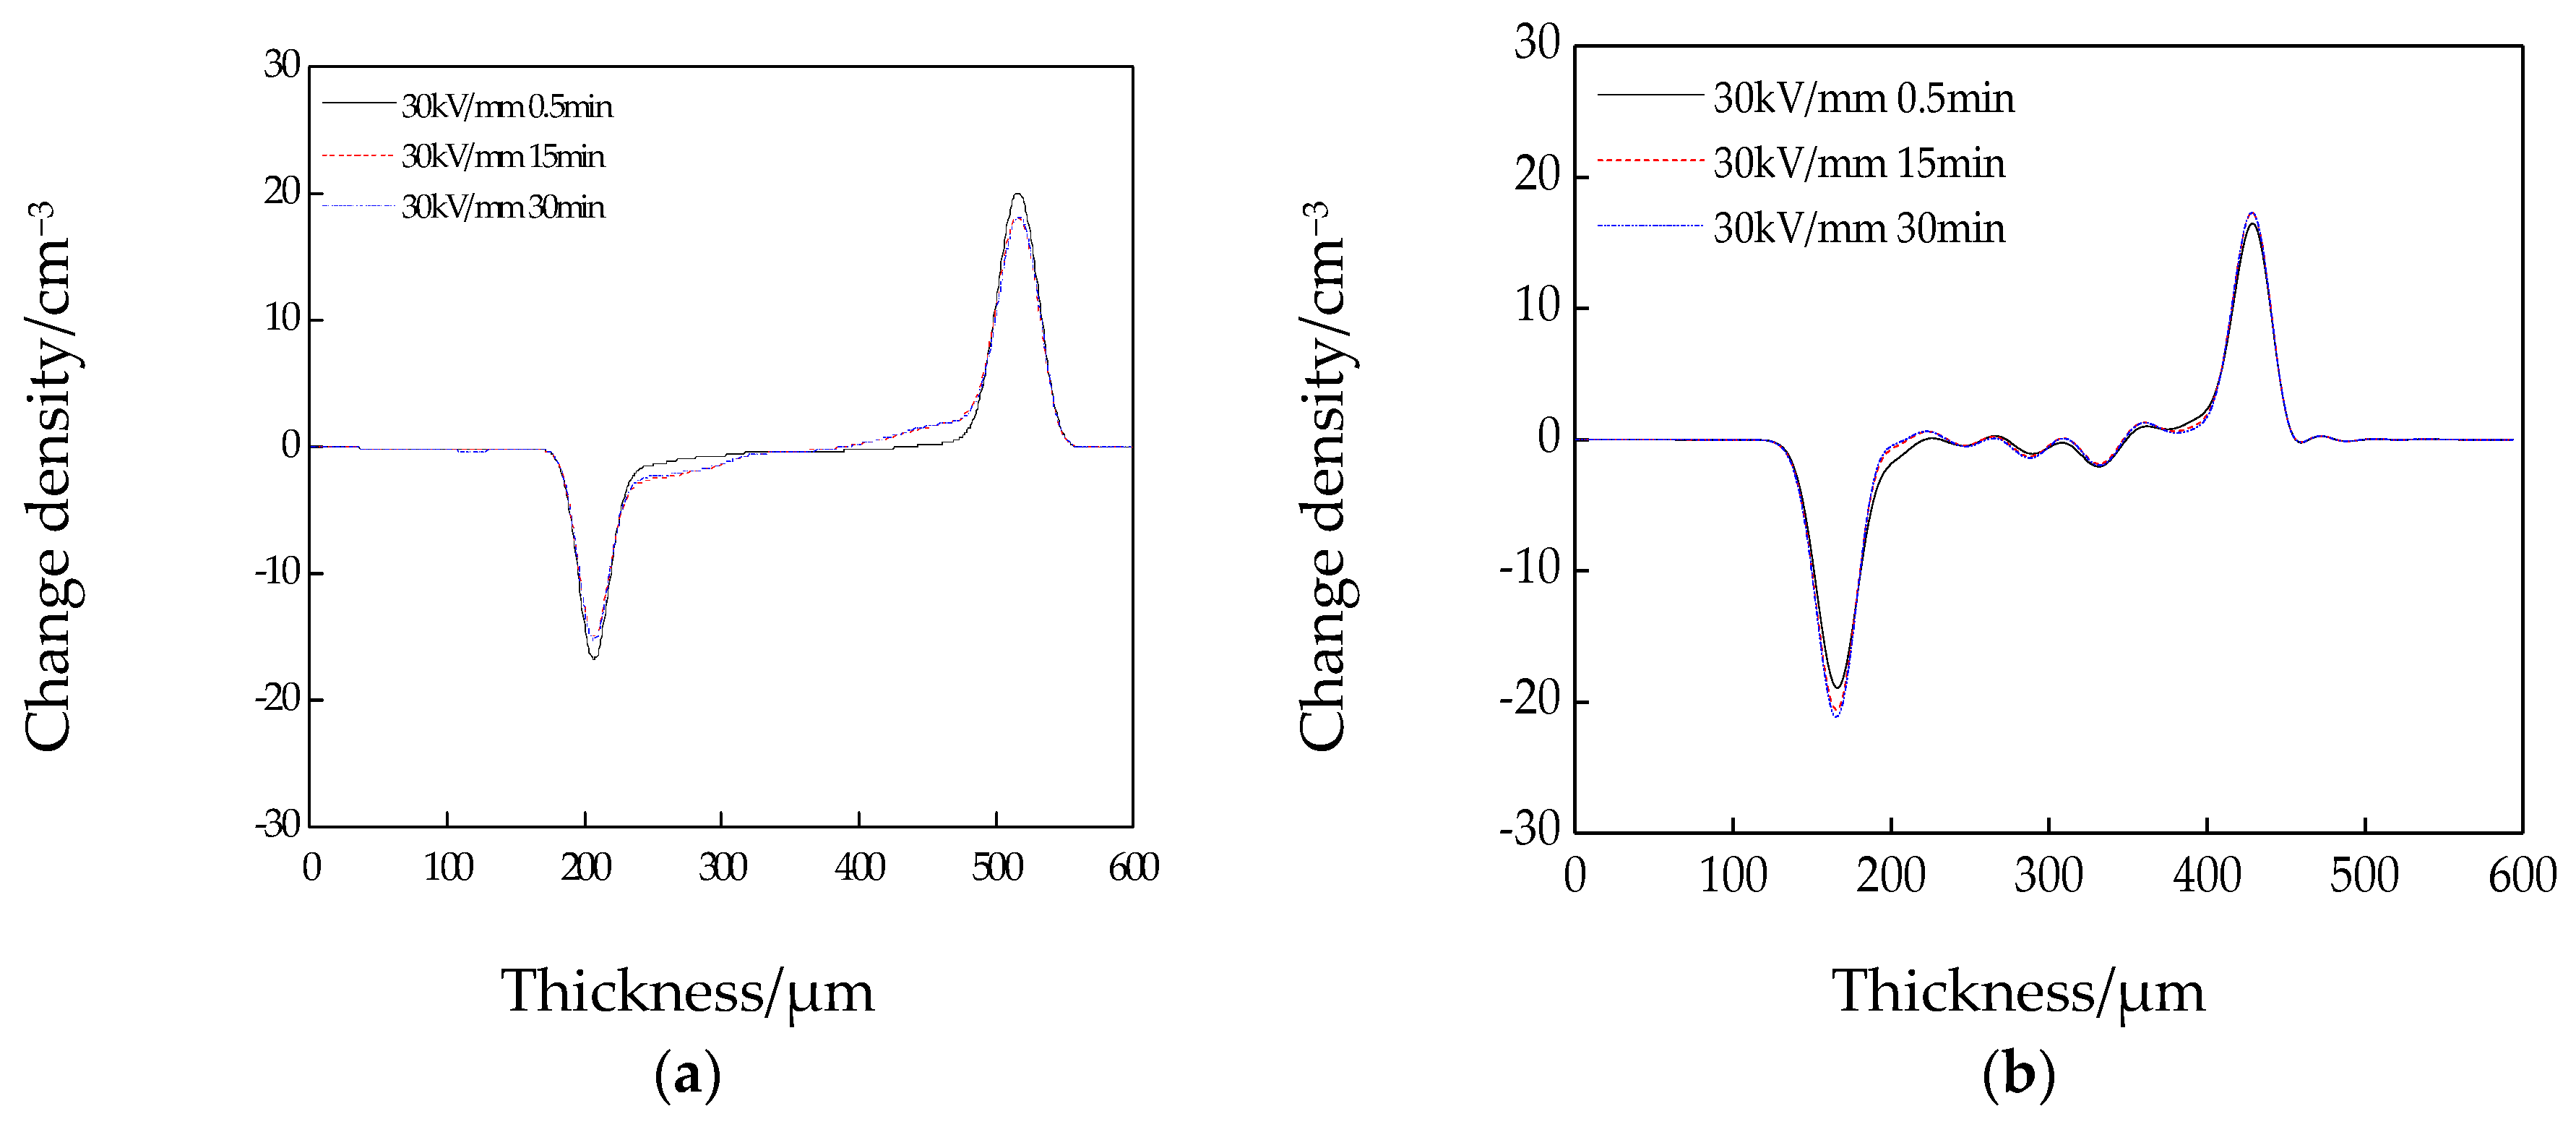
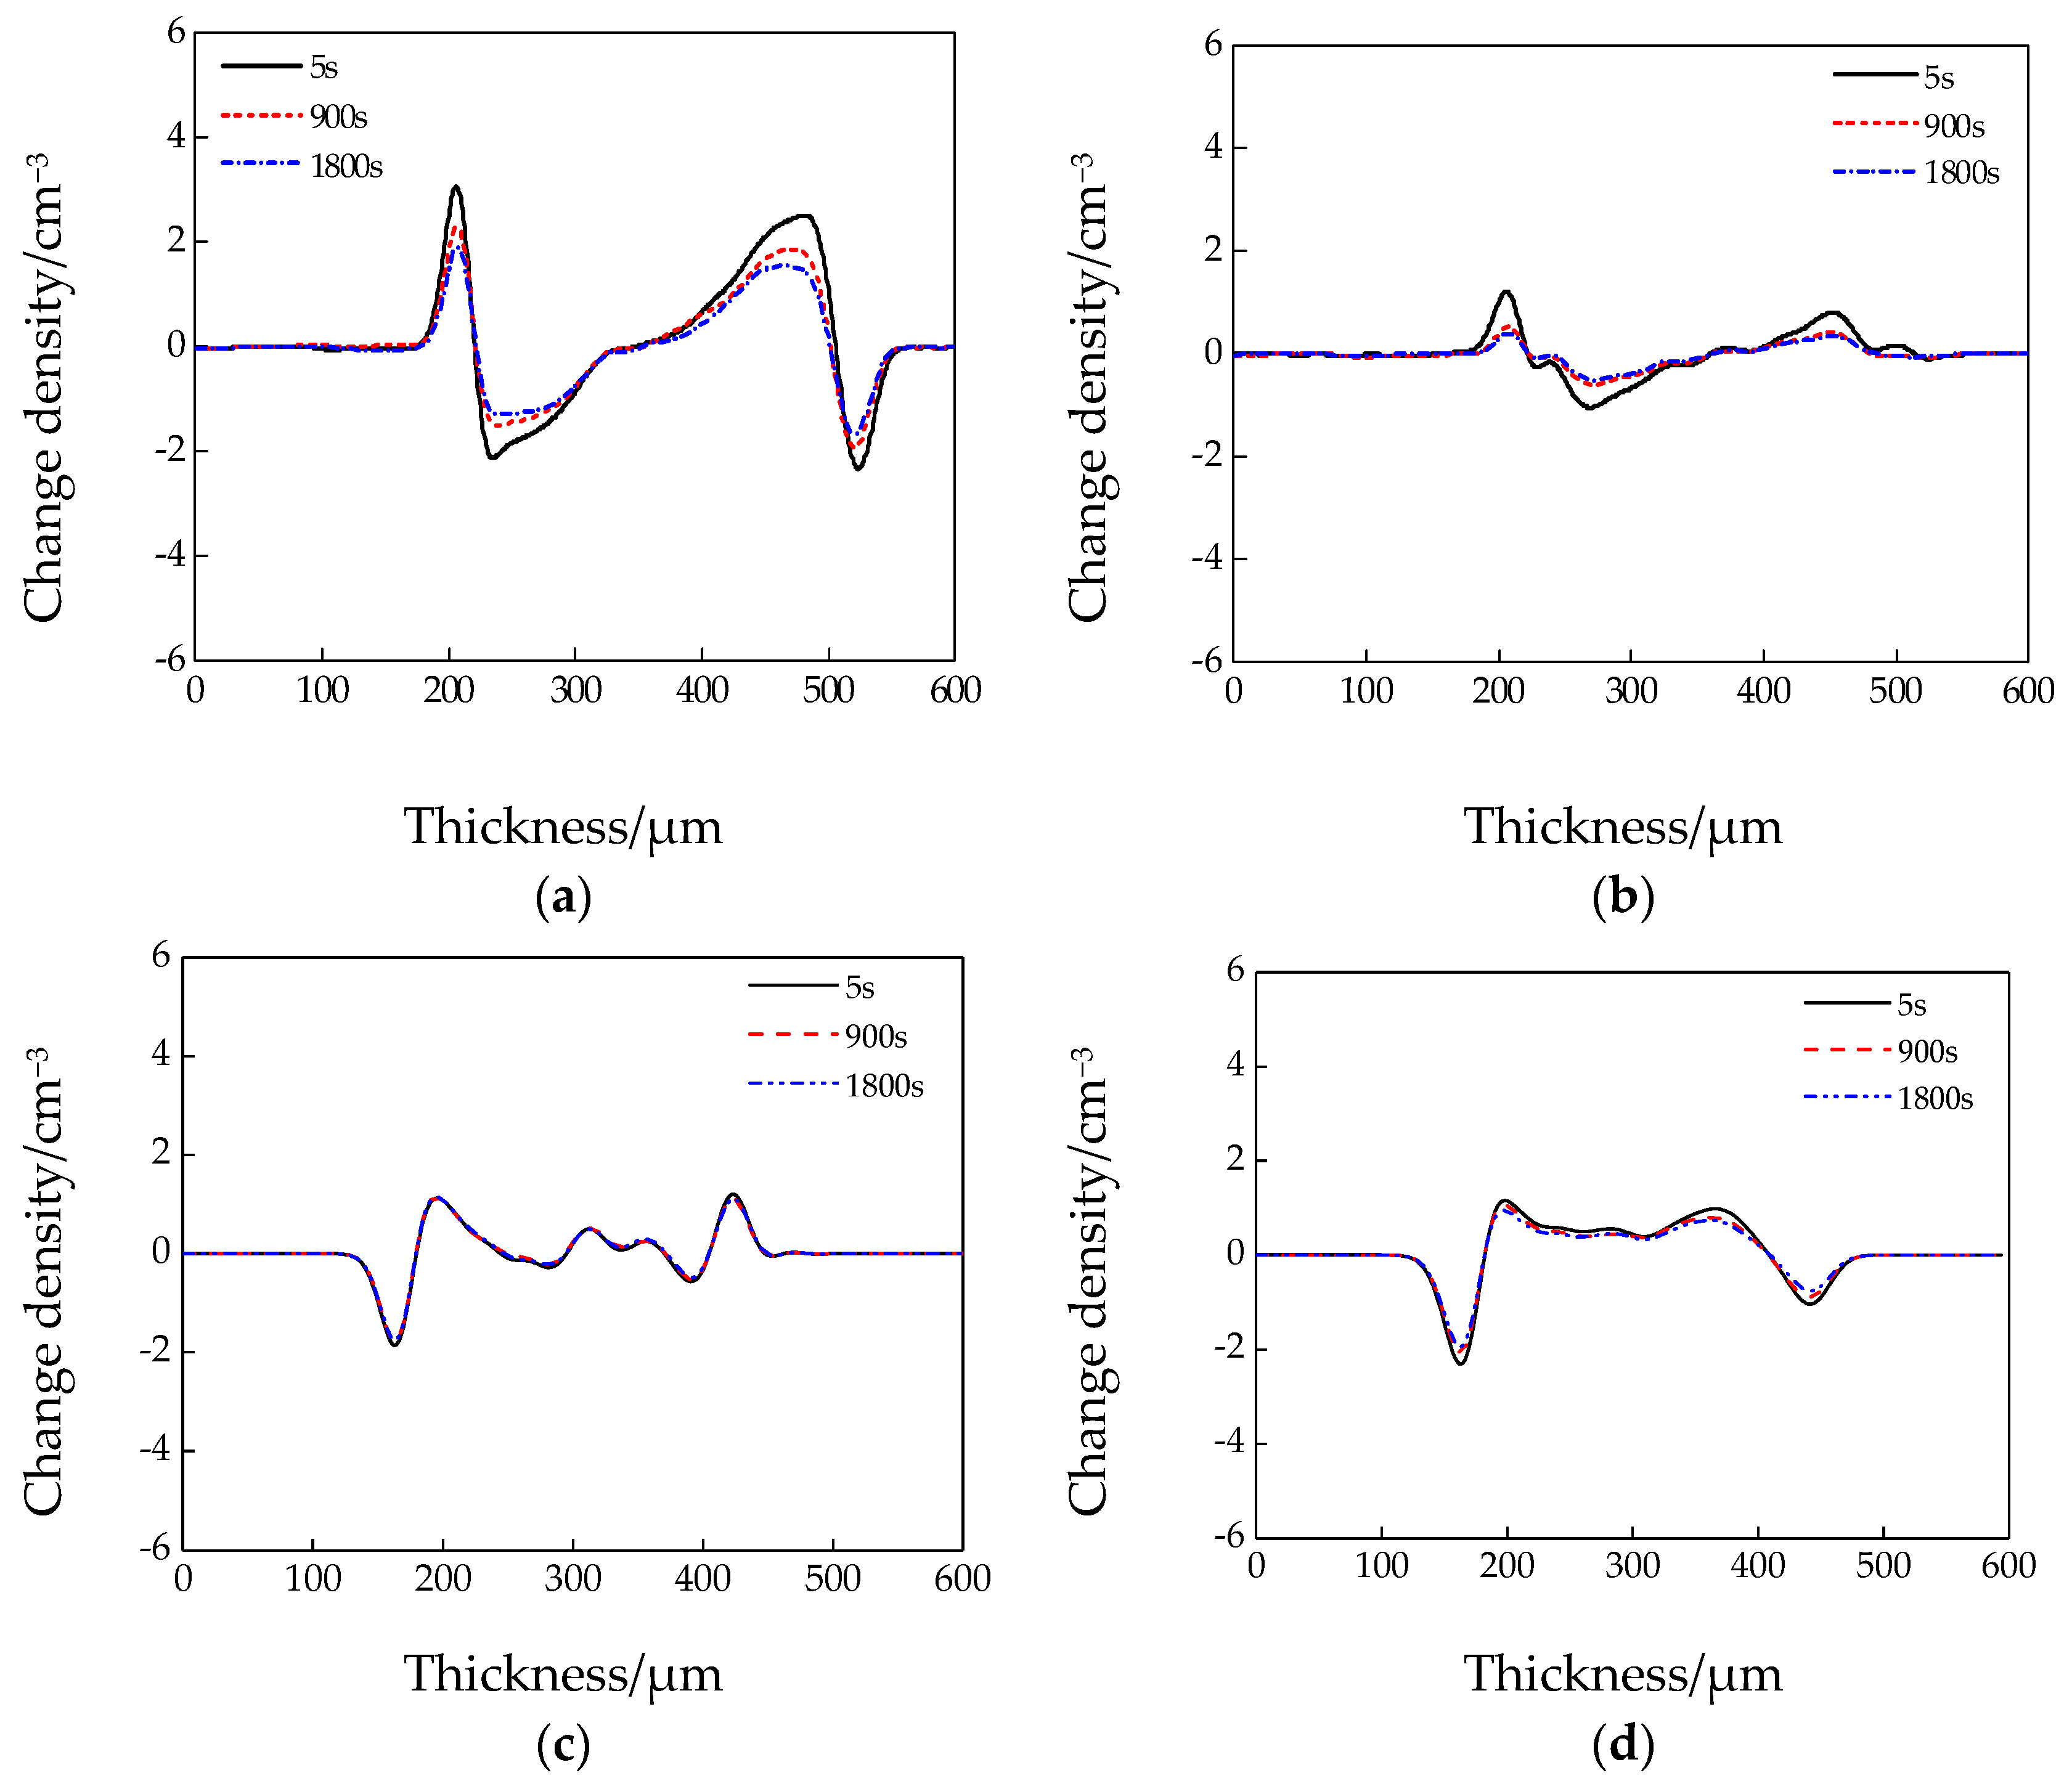
3.4. Space Charge Test Results and Analysis

The space charge distribution curves of the different samples under a breakdown field strength of 30 kV/mm are shown in Figure 4.
As shown in Figure 4, as time passed, the heteropolar space charge accumulation in the four samples increased to varying degrees. After pressure was applied, the space charge distribution of sample N3 reached a relatively stable state in a short time. However, the LDPE sample took a long time to reach the stable state. With the doping of the micro- or nanofillers into the LDPE matrix, the crystal size of the composites increased, and the free volume and carrier mobility decreased. More importantly, the fillers acted as charge capture centers, and a large part of the interface was introduced into the LDPE. The original LDPE polarization was changed, and heteropolar charges were induced around the traps [22,23] owing to the existence of a shallow trap level in the pure LDPE. Under the effect of an applied electric field, the charges were repeatedly trapped and released. Therefore, the charge distribution in the dielectric was difficult to stabilize in a short time. As shown in Figure 4, under a field strength pressure of 30 kV/mm for 30 min, heteropolar charges accumulated around the electrode, which showed that the composite interfacial polarization was completely established. Moreover, around the positive electrode, the heteropolar charge accumulation in sample N3 was clearer than those in samples M3 and N3M2. In other words, the charge capture ability of sample N3 was stronger than those of samples M3 and N3M2.
As shown in Figure 5, with the prolongation of the short-circuit time, the space charges in the dielectric gradually decreased. There were fewer space charges in the composites than in the pure LDPE after the short-circuit treatment. At the beginning of the short-circuit treatment, there were numerous heteropolar charges around the two electrodes, and the decay rate was slow. After the short-circuit treatment, there were numerous residual charges in the LDPE. However, the decay rate of the other composites was proportional to the time. After 1800 s of short-circuit treatment, the residual charges in the composites decreased and were distributed in a location where the samples contacted the electrodes. The space charges of samples N3 and N3M2 were relatively few because the contact surfaces of the inorganic particles and matrix were the two dielectric layers, which included the matrix surface layer, interface area, and filling surface area. During the short-circuit treatment, the space charges in the dielectric were easily released from the two dielectric layers.
Nonetheless, in a composite short-circuit treatment, the influence factor of the space charge decay rate still needs further exploration.

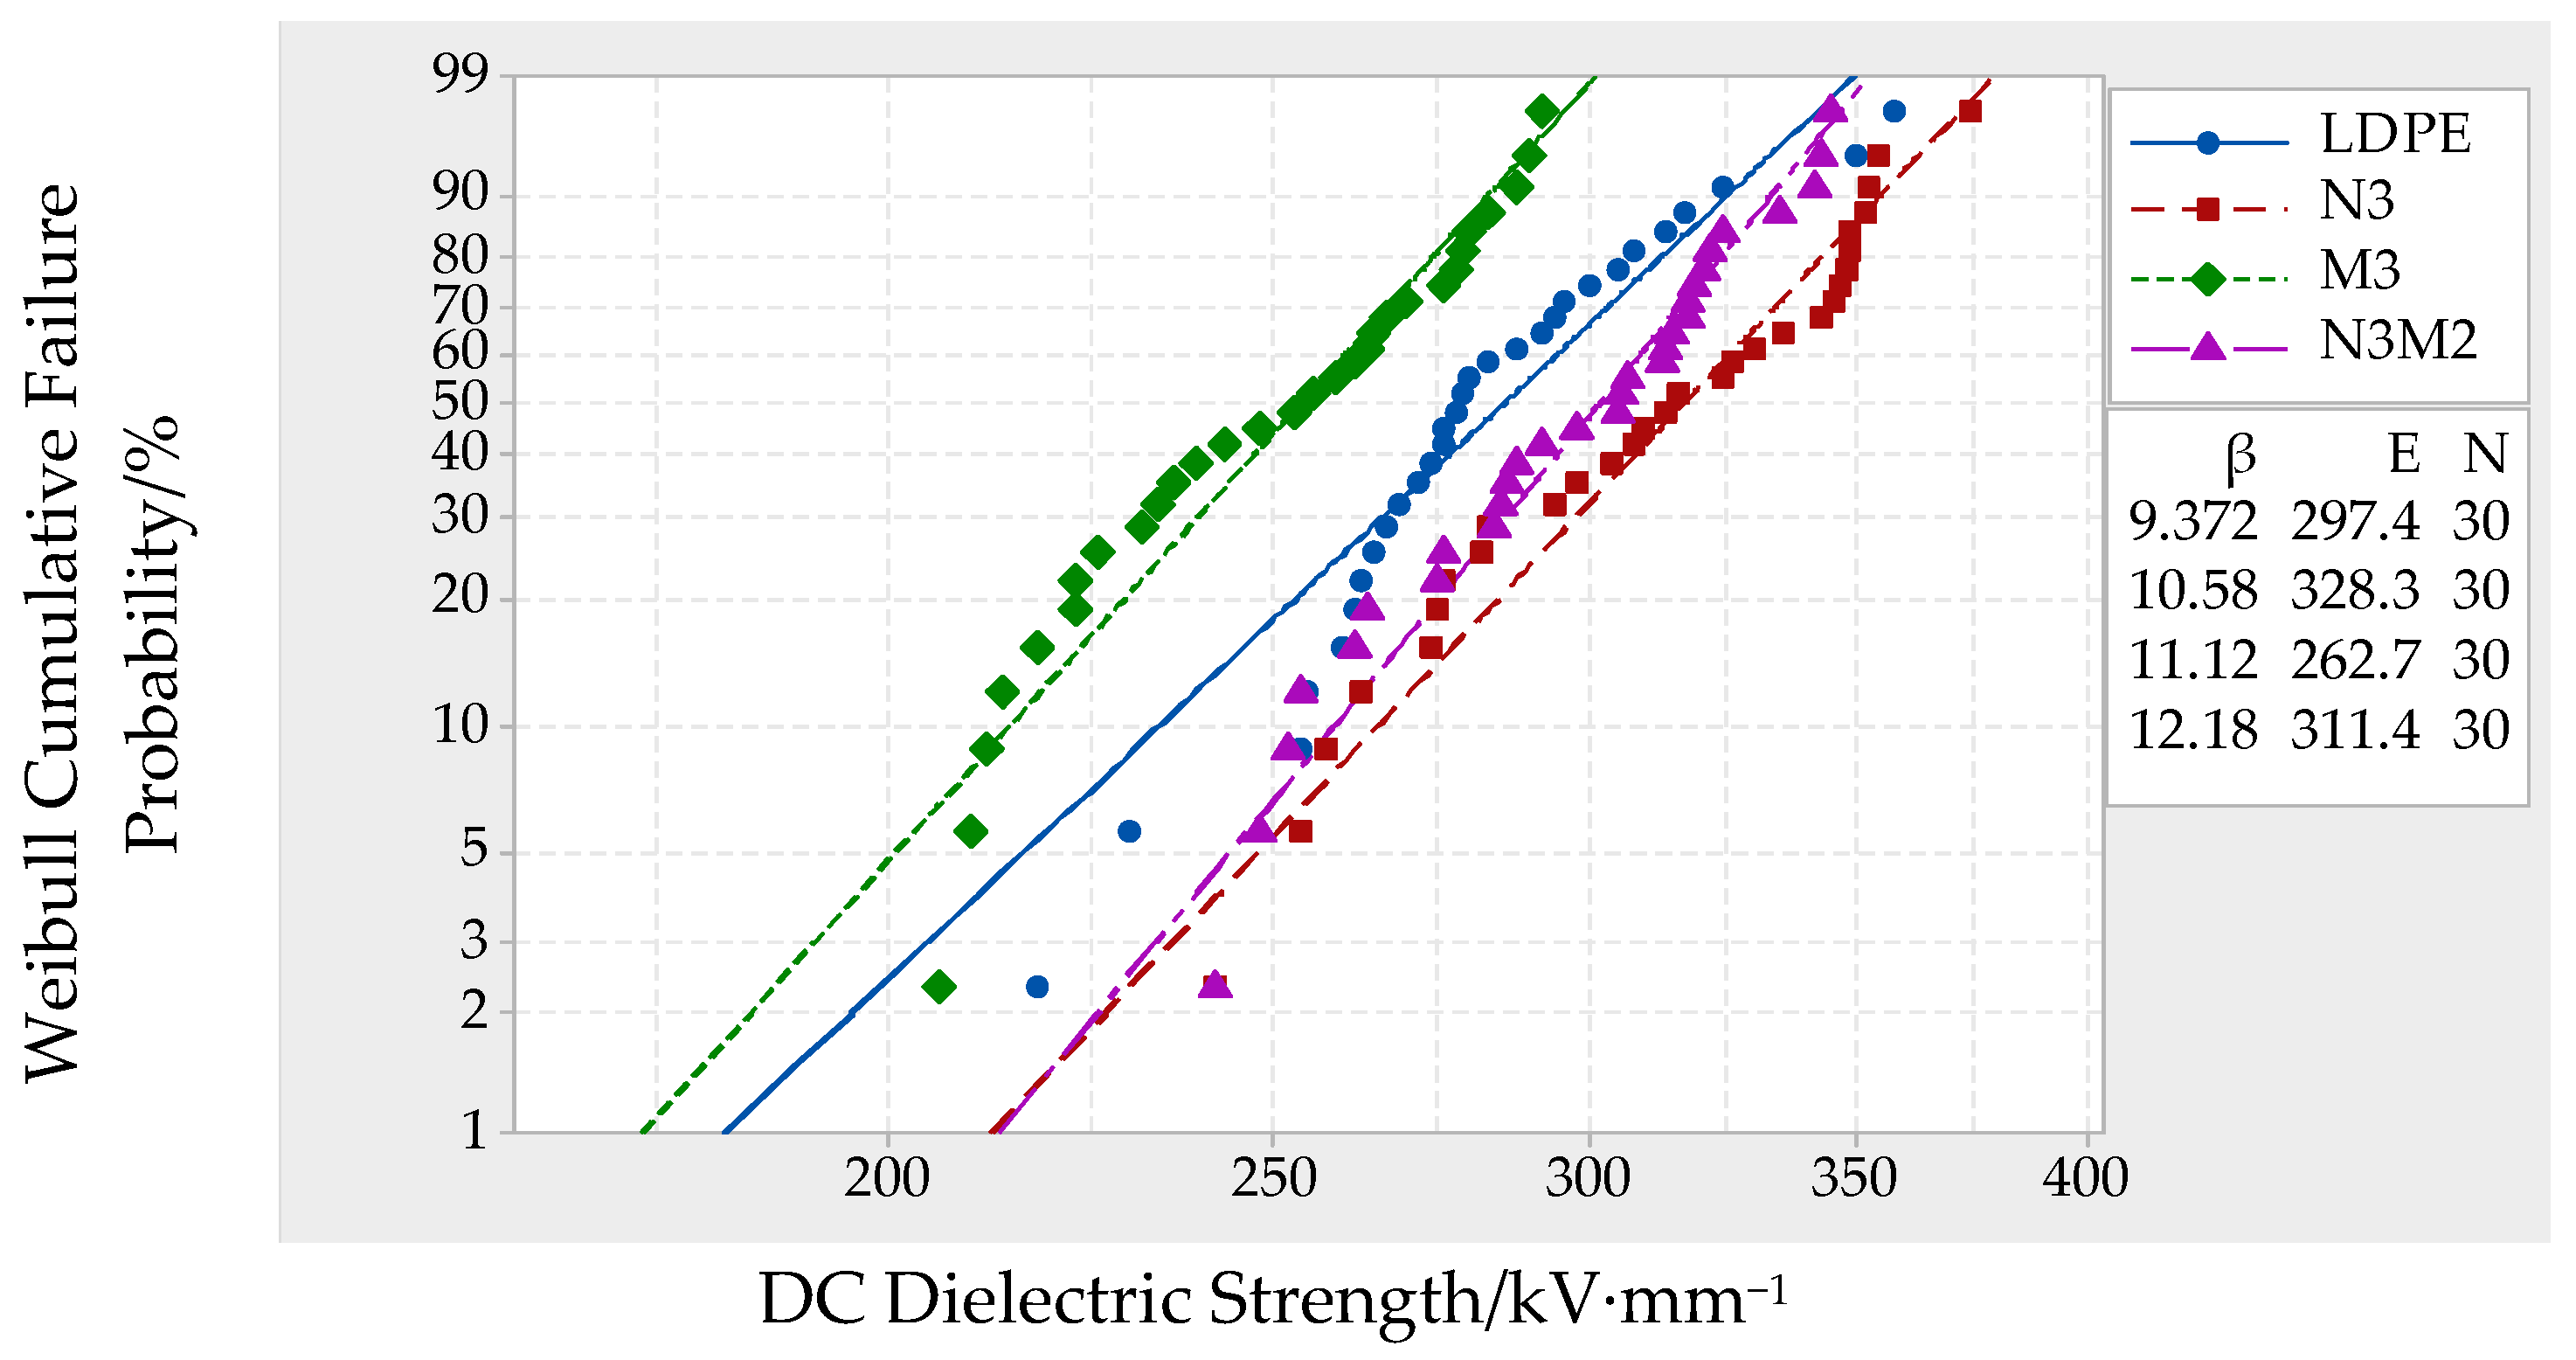
3.5. AC/DC Breakdown Test Results and Analysis

The Weibull distribution curves of the samples in the AC field are shown in Figure 6, and the AC breakdown characteristic parameters are listed in Table 3.
From the experimental results shown in Figure 6 and Table 3, the breakdown field strengths of samples N3 and N3M2 were 15.82% and 3.23% higher than that of the pure LDPE. Meanwhile, the breakdown field strength of sample M3 was 19.94% lower than that of the pure LDPE because the nano-ZnO particle doping introduced several heterogeneous nuclei into the composites, thereby improving the crystallinity of the composites. The interface area formed between the crystallization phase and amorphous phase increased, which increased the trap density and levels in the composites. The carriers were easily captured when they moved to the electrode. This process restricted the electron orientation to a certain degree. The electronic path became more circuitous, thereby increasing the breakdown field strength of sample N3. Doping with the micro-ZnO particles introduced shallow traps into the composites, and the trap density was low. In addition, the composites were doped with micro-ZnO as a type of impurity. Therefore, the AC breakdown field strength of sample M3 was lower than that of the pure LDPE. For sample N3M2, the nanoparticle effect was weakened by the microparticle doping. Therefore, the breakdown field strength of sample N3M2 was lower than that of sample N3 but higher than that of sample M3.
All samples were subjected to a DC breakdown test under a DC electric field. The experimental procedure and electrode were the same as those of the AC breakdown test. The Weibull distribution curves of the samples in the DC field are shown in Figure 7, and the DC breakdown characteristic parameters are listed in Table 4.
From the experimental results shown in Figure 7 and Table 4, the DC breakdown field strength order of the samples was as follows: M3 < LDPE < N3M2 < N3. The DC breakdown field strength of sample N3 was highest at 330.2 kV/mm, which was 11.02% higher than that of the pure LDPE, because the nanoparticle doping introduced an interface structure. Deeper traps existed, and the composite breakdown field strength was positively correlated with the density of deep traps. In addition, the increasing density of deep traps strengthened the capture effect, which restricted carrier migration. The carrier mean free path, mobility, and energies decreased, reducing the conductivity. Under a high field strength, the capture effect restricted the carrier multiplication process. Impact ionization was difficult until the DC breakdown field strength increased [24].
Based on the AC/DC breakdown test results, all the samples in the DC field had higher breakdown field strengths than in the AC field owing to the periodical variation of the AC voltage value and direction. The carrier induced a periodic reciprocating motion between the two electrodes. However, the DC voltage direction did not change with time but was always directed from the positive to the negative electrodes. Therefore, the carrier moved from only one direction, and effective impact ionization was not possible.
Combining the heterogeneous nucleation theory with the PLM test results revealed that the inorganic particle doping acted as a heterogeneous nucleation agent, which increased the ratio of the interface area between the crystalline and noncrystalline areas [25,26]. There were several cavity traps in the interface region. The nanoparticles possessed some excellent characteristics, such as small size and high surface energy. Therefore, the acting force between the nanoparticles and matrix resin was strong. Numerous deep traps were introduced, and the carrier was not easily released from the traps. An interface localized state was formed in the samples. The carrier transport model of the nanocomposites is shown in Figure 8.
The captured charges reduced the carrier migration rate. Simultaneously, the Coulomb field produced by these homopolar charges offset part of the applied electric field, which reduced the local field strength in the samples. The charge mobility and the charges injected by the electrodes decreased. Under the combined effects of these factors, the nanocomposite carrier quantity and mobility dramatically decreased, which effectively restricted the accumulation of composite space charges.

3.6. Dielectric Spectrum Test Results and Analysis

In the dielectric constant test, the frequency range was 1–105 Hz. The sample thickness was 100 μm, and the diameter was 40 mm. The aluminum electrode system was evaporated on the upper and lower surfaces of the samples using a vacuum coater. At room temperature, the samples were subjected to relative dielectric constant and loss factor tests. The test results are shown in Figure 9.
As shown in Figure 9a, the dielectric constants of the microcomposites and micro–nanocomposites were higher than those of the pure LDPE. The dielectric constant of the nanocomposites decreased with increasing frequency, which was majorly attributed to the ZnO particles acting as polar materials. Adding them to the polymer matrix increased the dielectric constant of the composites. However, the nano-ZnO particles interacted particularly with the polythene molecular chains. Cross-linking points were formed. The interaction between the molecular chains was reinforced, which tightened the internal structure of the polymer. The movement of the molecular chains was constrained, and the orientation polarization of the material was difficult. Due to the formation mechanism of the nanocomposite interface, the two phases of the nanocomposite interface could not achieve intrinsic polarization. In this two-phase interface, the centers of unlike charges correlated through electrostatic force. The adsorption intensity was significantly higher than the electric moment at which the electric field was applied to the dipole. Therefore, intrinsic relaxation polarization was difficult to achieve, and the dielectric constant of the nanocomposites decreased. As shown in Figure 9b, the dielectric loss factor of the pure LDPE was lowest, but those of the other composites increased to different degrees. The dielectric loss factors of the nanocomposites and micro–nanocomposites were higher, because a deeper energy level was formed at the interface between the nanoparticles and matrix. Under the effect of an electric field, interfacial polarization occurred in the nanocomposites, thereby forming dipoles, which increased the dielectric loss factor. However, a weak bonding existed between the microparticles and polymers. The test results of the microcomposites and LDPE were similar.

4. Conclusions

In this study, the pure LDPE was used as the matrix material. Spherical ZnO particles with sizes between 30 nm and 1 µm were used as additives. Different ZnO/LDPE composites were prepared by melt blending. All samples were characterized by DSC and PLM tests. In addition, the AC/DC breakdown field strength and space charge distribution of the samples were tested. The effects of micro- and nanoparticle synergism on the microstructure and macroscopic properties of the composites were explored. The conclusions are as follows:
(1)
Based on the SEM test results, the inorganic ZnO particles were uniformly dispersed in the matrix. Based on the results of DSC and PLM crystallization characterization, the doping of the inorganic ZnO particles improved the crystallinity and crystallization rate of the polymers. In addition, the inorganic particles possessed appropriate thermal conductivity. Therefore, the melting temperatures of the polymer composites were high. The nanocomposite particle size was small, and the grain arrangement was dense and regular. The crystallinity of the micro–nanocomposites was highest.
(2)
Based on the AC/DC breakdown test results, the doping of the ZnO particles with different sizes generated varying effects on the composite breakdown field strength. The nano-ZnO particle doping substantially improved the AC/DC breakdown field strength. The breakdown field strength of the microcomposites was slightly lower than that of the pure LDPE. Moreover, the DC breakdown field strengths of all the samples were higher than their AC breakdown field strengths. Based on the dielectric spectrum, the dielectric constants of the nanocomposites were lower than that of the pure LDPE. However, the dielectric constants of other test composites were higher than that of the pure LDPE. Moreover, the dielectric loss of all the composites was lower than that of LDPE.
(3)
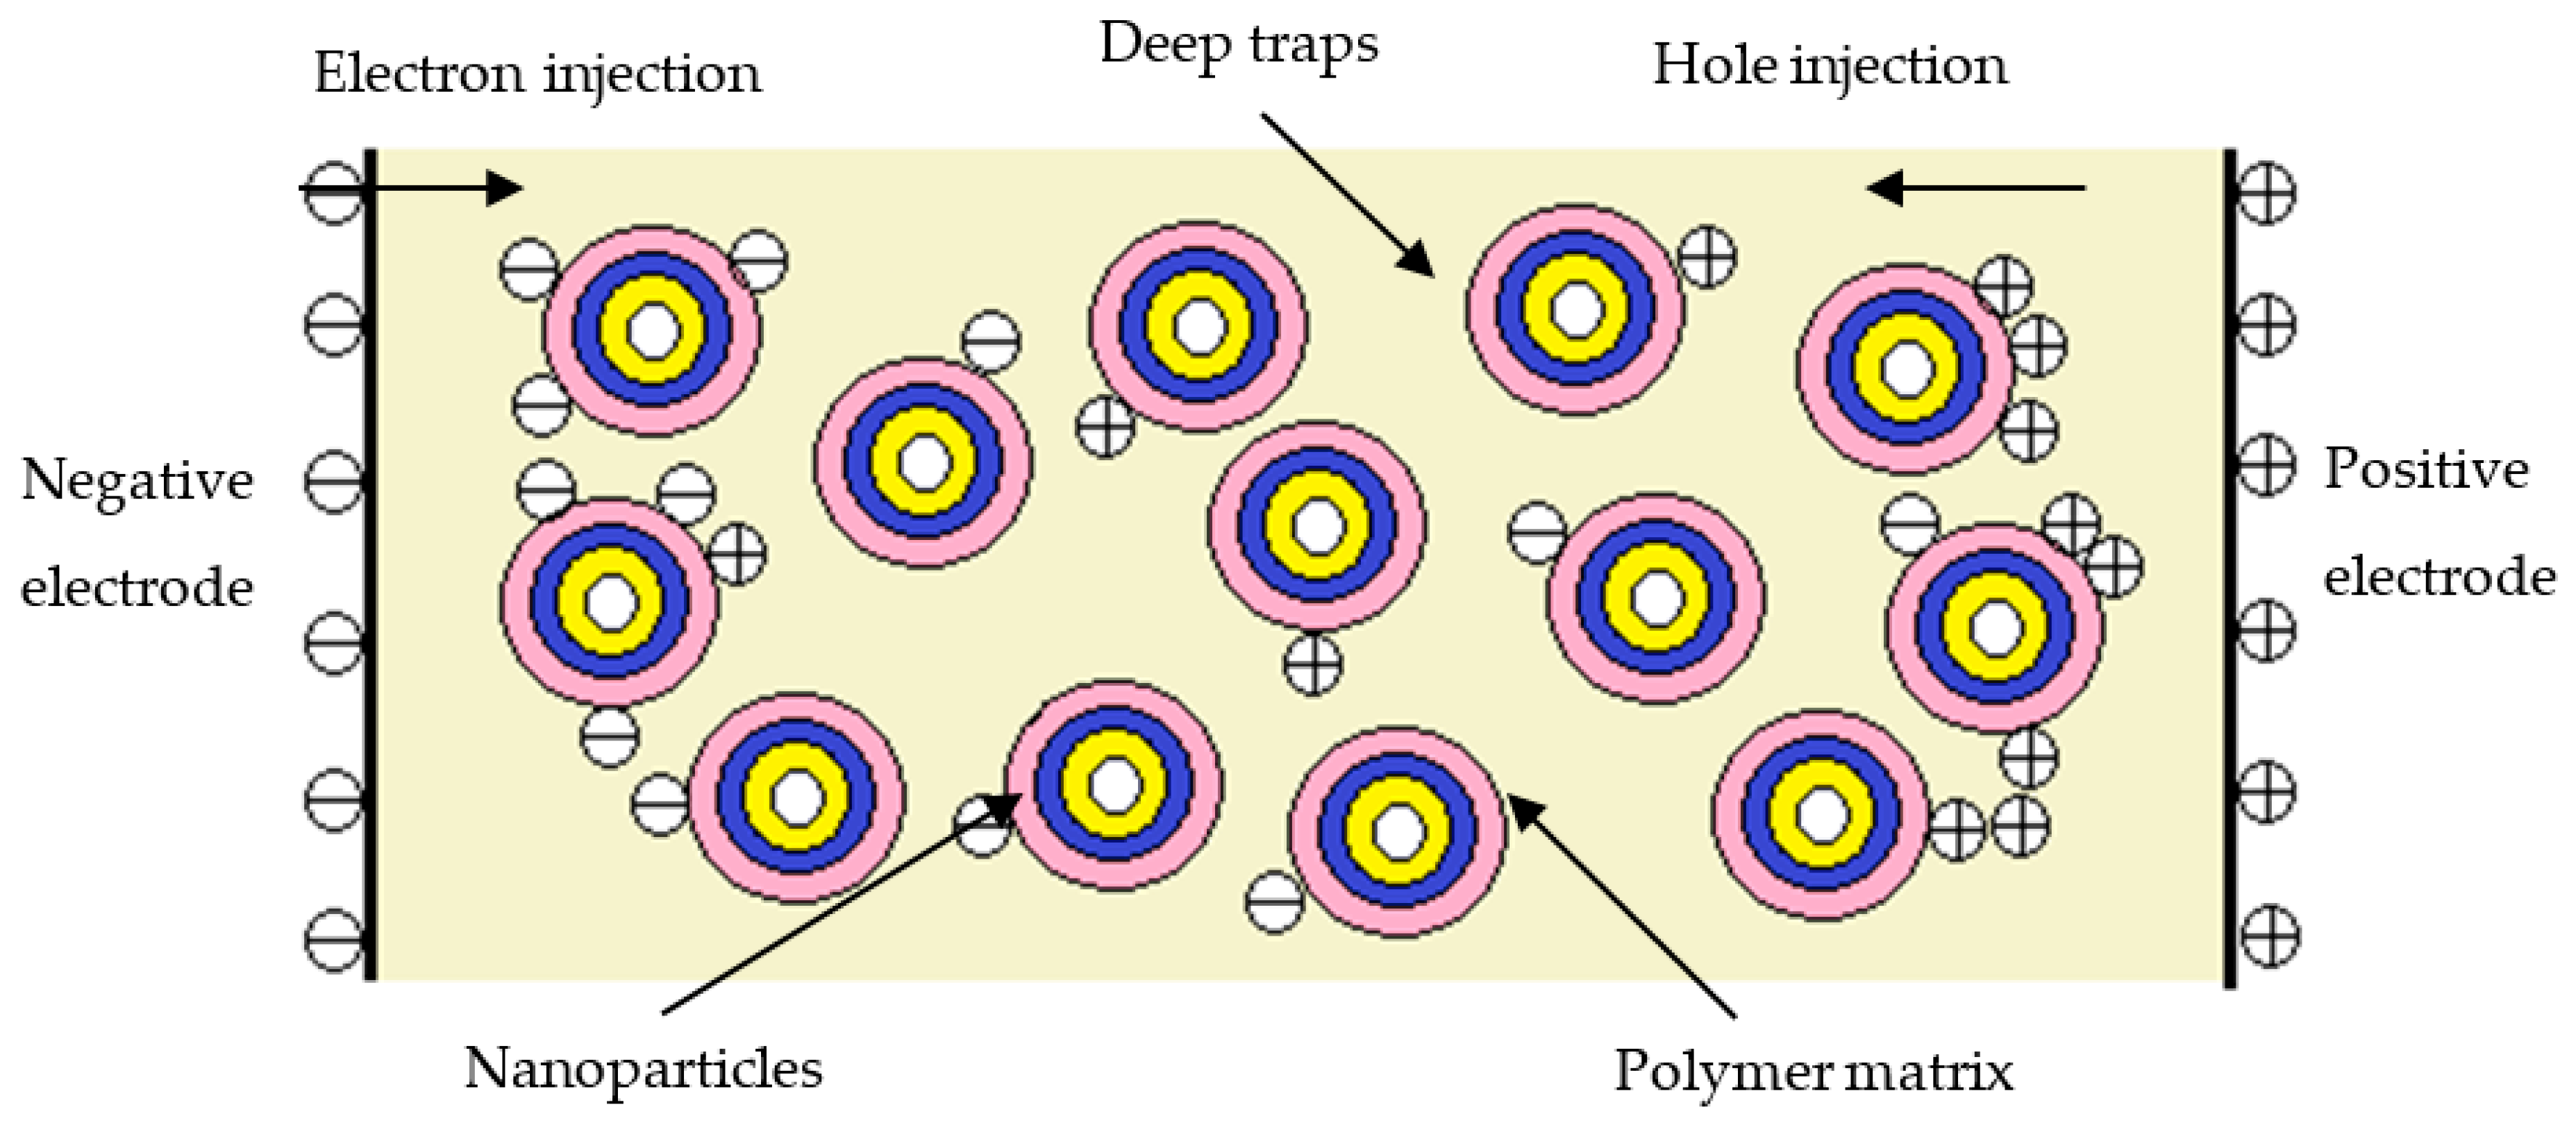
Based on the results of the space charge test, considerable time was required to stabilize the pure LDPE. By contrast, the steady state of the composites was reached in the first few seconds of voltage application. After 1800 s of short-circuit treatment, there were fewer residual space charges in the three composites than in the pure LDPE. The residual space charges of the nanocomposites were fewest, followed by those of the micro–nanocomposites. Thus, inorganic ZnO particle doping can restrain the accumulation of space charges, and the space charges can be released by the dielectric double-layer effect.

Author Contributions

Conceptualization, G.Y. and Y.C.; methodology, G.Y.; software, G.Y.; validation, Y.C.; formal analysis, Y.C.; investigation, G.Y.; resources, Y.C.; data curation, Y.C.; writing—original draft preparation, Y.C.; writing—review and editing, G.Y.; visualization, G.Y.; supervision, Y.C.; project administration, Y.C.; funding acquisition, G.Y. All authors have read and agreed to the published version of the manuscript.

Funding

This research was funded by the initial Scientific Research Fund of high-level talents, Grant No. 419YKQN05.

Acknowledgments

Thanks for the Colleges Young Creative Talents Project in Guangdong Province: The performance testing and optimized design of cables serving and armor layer in Pearl River. Besides, this research was also supported by the Social Welfare and Basic Research Project in Zhongshan City: The corrosion rule research and optimized design of cables armor layer steel in Pearl River.

Conflicts of Interest

The authors declare no conflict of interest.

References

  1. Sethi, G.; Furman, E.; Koch, B.; Lanagan, M. Influence of impedance contrast on field distribution and tree growth in laminate dielectrics. Model. Simul. Mater. Sci. Eng. 2014, 22, 025024. [Google Scholar] [CrossRef]
  2. Zhang, H.; Shang, Y.; Zhao, H.; Han, B.; Li, Z.-S. Mechanisms on inhibition of polyethylene electrical tree aging: A theoretical study. J. Mol. Modeling 2013, 19, 3035–3044. [Google Scholar] [CrossRef] [PubMed]
  3. Li, C.M.; Zhang, G.X.; Li, C.Y.; Han, B.Z. Inhibition of electrical tree initiation inside high-voltage cross-linked polyethylene cable with nonlinear shielding layer. Adv. Mater. Res. 2014, 873, 406–410. [Google Scholar] [CrossRef]
  4. Nelson, J.K.; Fothergill, J.C.; Dissado, L.A.; Peasgood, W. Towards an understanding of nanometric dielectrics. In Proceedings of the Annual Report Conference on Electrical Insulation and Dielectric Phenomena, Cancun, Quintana Roo, Mexico, 20–24 October 2002; pp. 295–298. [Google Scholar]
  5. Cheng, Y.; Zhang, X.; Zhou, X.; Ning, G.; Ru, C.; Tian, Z. Effects of Cooling Methods on Dielectric Properties of MMT/LDPE. J. Inorg. Mater. 2015, 30, 1295–1302. [Google Scholar]
  6. Hajibeygi, M.; Mousavi, M.; Shabanian, M.; Vahabi, H. The effect of phosphorus based melamine-terephthaldehyde resin and Mg-Al layered double hydroxide on the thermal stability, flame retardancy and mechanical properties of polypropylene MgO composites. Mater. Today Commun. 2020, 23, 100880. [Google Scholar] [CrossRef]
  7. Yan, H.D.; Zhang, C.; Li, W.K.; Zha, J.W. Effect of trap level density on breakdown strength and space charge distribution of polypropylene/low-density polyethylene composites. Polym. Compos. 2020, 41, 780–787. [Google Scholar] [CrossRef]
  8. Liao, R.; Li, X.; Bai, G.; Yang, L.; Gu, J. Influence of montmorillonite on electrical treeing and breakdown characteristics of low-density polyethylene. J. Reinf. Plast. Compos. 2014, 33, 2117–2128. [Google Scholar] [CrossRef]
  9. Du, B.X.; Han, T.; Su, J.G. Tree characteristics in silicone rubber/SiO2 nanocomposites under low temperature. IEEE Trans. Dielectr. Electr. Insul. 2014, 21, 503–510. [Google Scholar] [CrossRef]
  10. Chen, X.; Wang, X.; Wu, K.; Peng, Z.; Cheng, Y.; Tu, D. Space charge measurement in LPDE films under temperature gradient and DC stress. IEEE Trans. Dielectr. Electr. Insul. 2010, 1, 1796–1805. [Google Scholar] [CrossRef]
  11. Takada, T.; Hayase, Y.; Tanaka, Y.; Okamoto, T. Space charge trapping in electrical potential well caused by permanent and induced dipoles for LDPE/MgO nanocomposite. IEEE Trans. Dielectr. Electr. Insul. 2008, 15, 152–160. [Google Scholar] [CrossRef]
  12. Lei, Q.Q.; Wang, X.; He, L.J.; Zhang, D.; Han, B.; Song, W.; Sun, Z. Review, Thinking and Countermeasure About Engineering Dielectric Theory. High Volt. Eng. 2007, 33, 1–4. [Google Scholar]
  13. Zha, J.-W.; Zhu, Y.-H.; Li, W.-K.; Bai, J.; Dang, Z.-M. Low dielectric permittivity and high thermal conductivity silicone rubber composites with micro-nano-sized particles. Appl. Phys. Lett. 2012, 101, 062905. [Google Scholar] [CrossRef]
  14. Khaled, U.; Alzahrani, S.; Khan, Y. Dielectric properties improvement of LDPE based on nano fillers. In Proceedings of the 2016 IEEE International Conference on High Voltage Engineering and Application, Chengdu, China, 19–22 September 2016; pp. 1–4. [Google Scholar]
  15. Virtanen, S.; Vaughan, A.S.; Yang, L.; Saiz, F.; Quirke, N. Dielectric Breakdown Strength and Electrical Conductivity of Low Density Polyethylene Octylnanosilica Composite. In Proceedings of the 2016 IEEE Conference on Electrical Insulation and Dielectric Phenomena (CEIDP), Toronto, ON, Canada, 16–19 October 2016; pp. 58–61. [Google Scholar]
  16. Zhang, L.; Zhou, Y.; Cui, X.; Sha, Y.; Le, T.H.; Ye, Q.; Tian, J. Effect of nanparticle surface modificantion on breakdown and space charge behavior of XLPE/SiO2 nanocomposites. IEEE Trans. Dielectr. Electr. Insul. 2014, 21, 1554–1564. [Google Scholar] [CrossRef]
  17. Yan, H.; Song, S.; Zhao, H.; Yao, Z. Dielectric Properties of Polystyrene Graft Copolymer/Low Density Polyethylene. High Volt. Eng. 2018, 44, 3840–3847. [Google Scholar]
  18. Chen, P.; Wang, S.; Chen, Z.; Li, J. Effect of nano-TiO2 on Dielectric Properties of XLPE for HVDC Cable. High Volt. Eng. 2018, 44, 3848–3856. [Google Scholar]
  19. Zhang, J.; Zuo, J.; Ai, W.; Liu, S.; Zhu, D.; Zhang, J.; Wei, C. Preparation of a new high-efficiency resin deodorant from coal gasification fine slag and its application in the removal of volatile organic compounds in polypropylene composites. J. Hazard. Mater. 2020, 384, 121347. [Google Scholar] [CrossRef] [PubMed]
  20. Zhu, C. Polymer Structure Analysis; Science Press: Beijing, China, 2010; pp. 157–169. [Google Scholar]
  21. Zheng, J.; Zhou, X.; Xie, X. Non-isothermal crystallization kinetics of polypropylene containing silica hybrid particles as fillers. Acta Mater. Compos. Sin. 2013, 30, 18–23. [Google Scholar]
  22. He, J.; Peng, S.; Zhou, Y.; Yang, Y.; Hu, J. Interface properties of polymer nanocomposites. Proc. CSEE 2016, 36, 6596–6605. [Google Scholar]
  23. Peng, S.; He, J.; Hu, J.; Huang, X.; Jiang, P. Influence of functionalized MgO nanoparticles on electrical properties of polyethylene nanocomposites. IEEE Trans. Dielectr. Electr. Insul. 2015, 22, 1512–1519. [Google Scholar] [CrossRef]
  24. Tu, D.M.; Wang, X.; Lü, Z.P.; Wu, K.; Peng, Z.R. Formation and inhibition mechanisms of space charges in direct current polyethylene insulation explained by energy band theory. Acta Phys. Sin. 2012, 61, 017104. [Google Scholar] [CrossRef]
  25. Dang, B.; He, J.; Hu, J.; Zhou, Y. Large improvement in trap level and space charge distribution of polypropylene by enhancing the crystalline amorphous interface effect in blends. Polym. Int. 2016, 65, 371–379. [Google Scholar] [CrossRef]
  26. Xie, D.; Min, D.; Liu, W.; Li, S.; Min, C. Correlation between dielectric breakdown and interface traps characteristics. High Volt. Eng. 2018, 44, 432–439. [Google Scholar]
Figure 1. PLM patterns of the samples: (a) LDPE, (b) N3, (c) M3, (d) N3M2.
Coatings 10 00932 g001
Figure 2. DSC curves of the samples: (a) heating curve of different samples, (b) cooling curves of different samples.
Coatings 10 00932 g002
Figure 3. SEM patterns of the samples: (a) LDPE, (b) N3, (c) M3, (d) N3M2.
Coatings 10 00932 g003
Figure 4. Space charge distribution in the four samples under the electric field: (a) LDPE, (b) N3, (c) M3, (d) N3M2.
Coatings 10 00932 g004aCoatings 10 00932 g004b
Figure 5. Space charge decay in the four samples under the short-circuit treatment: (a) LDPE, (b) N3, (c) M3, (d) N3M2.
Coatings 10 00932 g005
Figure 6. Weibull distribution curve of the samples in the AC field.
Coatings 10 00932 g006
Figure 7. Weibull distribution curve of the samples in the DC field.
Coatings 10 00932 g007
Figure 8. Transport model of carrier in the nanocomposites.
Coatings 10 00932 g008
Figure 9. Variation in the dielectric constant and dissipation factors of different samples versus frequency: (a) variation in the dielectric constant of different samples versus frequency, (b) variation in the dissipation factors of different samples versus frequency.
Coatings 10 00932 g009
Table 1. Experimental materials and equipment.
NameParameter/ModelManufacturer
LDPEDensity: 0.910–0.925 mg/cm3Daqing Petrochemical (Daqing, China)
ZnOParticle sizes: 30 nm, 1 µmBeijing Deke Daojin Science and Technology Co., Ltd. (Beijing, China)
Electronic balanceYP202NShanghai Precision & Scientific Instrument Corporation (Shanghai, China)
Vacuum drying ovenDZF-6020MBEShanghai Boxun Industry & Commerce Co., Ltd. (Shanghai, China)
Ultrasonic cleanerKQ5200DEKunshan Ultrasonic Instruments Co., Ltd. (Kunshan, China)
Torque rheometerRheocord 300Thermo Scientific Co., Ltd. (Harbin, China)
Scanning electron microscopeJSM-F100JEOL Co., Ltd. (Tokyo, Japan)
Dielectric spectrum analyzerDMS-2000Partulan Co., Ltd. (Wuhan, China)
Plate vulcanizing machineXLB25-DHaimenJinma Rubber & Plastics Machinery Technology Co., Ltd. (Haimen, China)
Differential scanning calorimeterDSC-1Mettler Toledo (Zurich, Switzerland)
Table 2. Isothermal crystallization and melting process parameters of the samples.
SampleTc (°C)Tcon (°C)ΔTc (°C)Tm (°C)Xc (%)
LDPE93.67102.318.64109.7534.90
N394.40102.548.16110.2537.23
M395.12101.146.02110.6035.64
N3M295.89102.977.08110.4637.79
Note: Tm, melting peak temperature; Tc, crystallization peak temperature; Tcon, initial crystallization temperature; ΔTc, width of exothermic crystallization peak; Xc, crystallinity.
Table 3. AC breakdown characteristics of different samples.
SampleBreakdown Field Strength Eb/(kV·mm−1)NumbersShape Parameter β
LDPE120.73010.40
N3139.83011.74
M396.633010.86
N3M2124.63013.84
Table 4. DC breakdown characteristics of different samples.
SampleBreakdown Field Strength Eb/(kV·mm−1)NumbersShape Parameter β
LDPE297.4309.372
N3330.23010.35
M3262.73011.12
N3M2311.43012.18

