Article

Surface Properties of Beech Wood after CO2 Laser Engraving

Faculty of Wood Sciences and Technology, Technical University in Zvolen, T.G. Masaryka 24, 960 01 Zvolen, Slovakia
*
Author to whom correspondence should be addressed.
Coatings 2020, 10(1), 77; https://doi.org/10.3390/coatings10010077
Submission received: 18 December 2019 / Revised: 10 January 2020 / Accepted: 13 January 2020 / Published: 16 January 2020
(This article belongs to the Section Surface Characterization, Deposition and Modification)

Abstract

:
The paper deals with the properties of a beech wood surface treated by CO2 laser engraving. The studied concerns were the discoloration, changes to morphology assessed through roughness and waviness parameters, and surface wetting with standard liquids (water and diiodomethane), with the aim of determining the wood surface free energy. The results have confirmed that the studied properties of the beech wood surface varied significantly, which were affected by the laser beam power P and raster density n. With increasing P and n, the lightness L* (expressed in CIE L*a*b* color space) decreased significantly. We also observed significant variation in the color coordinates a* and b*. At 8% laser power, the roughness and waviness parameters measured parallel as well as perpendicular to the grain increased proportionally with the increasing raster density. However, 4% laser power was not associated with distinct changes. Increasing the raster density reduced beech wood surface wetting equally with water and with diiodomethane. This was reflected in the higher contact angle values. The wood surface exhibited higher hydrophobicity at 4% laser power. At this power, the increasing raster density was reflected in the decreasing surface free energy, due to its polar component decrease. At 8% laser power, the changes in surface free energy were very minor from the practical viewpoint. The results suggest a potential good adhesion between film-forming materials and wood. However, the gluing performance may be negatively affected by the high roughness attained at 8% laser power and at higher raster densities.

1. Introduction

Each type of wood surface treatment (mechanic, heat-hydro-mechanic, CO2 laser, and other) induces changes to the wood chemical and anatomical structure and consequently causes changes in these material properties. The absorbed energy-induced chemical changes to the main wood constituents are responded by the changes in the wood surface color, morphology, and also to its hydrophilic/hydrophobic performance [1,2,3,4,5,6,7,8,9,10,11,12,13].
In this context, the substantial factors are the form of the energy supplied, the intensity of this energy, and the wood species used [14,15,16,17]. Thus, it is necessary to specify and quantify the changes to the wood structure and surface properties resulting from specific surface pretreatment. These changes exert considerable impacts on wood wetting with film-forming materials and on the adhesion of these materials to wood, and as such, they also have important consequences for wood gluing and/or surface treatment [13,18,19,20,21,22,23]. Targeted wood surface discoloration as well as the modification of other wood surface properties are mostly performed based on empirical experience only. Therefore, quantification of the dependence of the discoloration extent on the supplied energy amount seems a promising tool for this problem solving.
One way to supply energy onto the wood surface is irradiation with a CO2 laser performing within the infrared spectral range (wavelength 10.6 μm). This progressive treatment technology uses a laser beam acting as a classic cutting tool. The method is frequently used for cutting, boring, labeling, and engraving surfaces in varied metallic and non-metallic materials [11,24,25,26]. The profit of this treatment is that the known absorption coefficients enables determining the energy amount supplied onto the wood surface by the laser beam. In this way, the wood structure and properties can be modified according to the purpose intended [27]. The amount of energy supplied onto the wood surface with the aid of a laser beam can be controlled by adjusting the laser beam power, laser head movement speed, focal distance, and raster density (number of laser beam paths per one millimeter across the width) [11,12,28,29].
During wood surface engraving, the energy concentrated in the laser beam and supplied to the specified spot is converted to heat. The high temperature induces sublimation of a thin wood surface layer. Apart from the amount and concentration of the energy supplied, the sublimed-layer thickness also depends on the wood species, as there is a considerable species-specific variability in the structure and hardness, and moisture content. The type of the laser used also may cause variability (number of laser beam paths per one millimeter across the width) [4,9,28,30,31,32,33].
During wood irradiation with a CO2 laser, more energy supplied means a greater decrease in the amount in polysaccharides contained in wood (primarily the degradation of hemicelluloses and a part of the amorphous component of cellulose) [4]. There were also detected changes to the lignin structure. Wust et al. [32] observed changes in the distribution of cellulose, hemicelluloses, and lignin through the cell walls. These authors specified the ranges for irradiation parameters guaranteeing wood melting without pyrolysis. The results of X-ray photo-electron spectroscopy (XPS) demonstrated raised amounts of unipolar bonds C–C and C–H, while the C–O bonds remained unchanged [33]. If the values of absorption coefficient and radiation intensity reaching the wood surface are known, the dependence of the discoloration intensity on the irradiation dose can be derived out [4,11,34]. The chemical changes are closely connected with the wood surface color variation. More energy supplied means more shifting the wood surface color to dark [35]. This is especially typical for the light-colored wood species.
Microscopic observations suggest that the wood surface treatment with a laser beam may smooth the wood roughness—due to melting wood cells down to a depth of several micrometers, still, without carbonization [9,33]. Kúdela et al. [13] report that significant morphological changes manifested through increased roughness had not occurred but at the highest irradiation dose (75 J∙cm−2), which was primarily as the result of the carbonized wood surface layer. Contrarily, engraving wood surface with a laser can have an opposite effect [10]. Gurau and Petru [29] observed that the surface roughness in maple wood was significantly influenced by the laser power and by the speed of the laser head displacement. With increasing the laser power, the values of all the studied roughness parameters were increasing linearly; with increasing the speed of the laser head displacement, these parameters were diminishing, without, however, following linear patterns. Different energy forms influencing wood also affect wood surface wetting with specific liquids [9,13]. The liquid’s capacity for wetting a solid material surface is assessed based on the contact angle value. The contact angle is an important indicator allowing predicting the adhesion strength for gluing and coating materials and to predict the effectiveness of wood thermal and chemical modification. Contact angles measured at the phase boundary with liquid standards provide a base for determining the thermodynamic characteristics of wood—the surface free energy and its components [36,37,38,39,40,41].
The contact angle values measured after the wood surface modification can serve for the prediction of variation trends in this material’s hydrophilicity or hydrophobicity. Haller et al. [9] observed that the pine wood surface melts under the effects of a CO2 laser without carbonization (expected temperature not beyond 200 °C), exhibiting poorer wetting with water in comparison with the original, non-modified surface. The melt layer, reaching several millimeters downwards, significantly enhanced the surface hydrophobicity. This was subsequently reflected in the contact angle values more than 90° and in the slower soaking of the applied drop into the wood substrate.
The results obtained by Dolan [33] hint that the irradiated surfaces did not exhibit poorer wetting, but the opposite seemed true. The last cited work suggests that the wood laser treatment does not induce essential changes in the wood surface energy. The total surface energy was low, with a dominant dispersive component. The polar (acid–base) component displayed a significant reduction in comparison with the control samples. The Lewis base parameter of the acid–base component remained relatively high. The Lewis acidic parameter was lowered significantly: close to zero. In this case, the laser irradiation parameters were not the same as those used by [9]. Neither Kúdela et al. [13] could confirm the unequivocal influence of increasing irradiation dose on beech wood wetting with standard liquids. The last cited authors report that the surface free energy of beech wood expressed as the sum of the polar component determined from wetting with water and the disperse component determined from the wetting with diiodomethane decreased with increasing the irradiation dose, primarily due to the decreasing polar component.
Surveying the references, we can see that the results display differences between the authors. This is due to the different technical parameters of the laser used and also due to some differences between the irradiation methods. However, the results analyzed suggest that during irradiation with a CO2 laser, it is possible to attain the required surface properties by an appropriate choice of the irradiation parameters.
The aim of this work was an experimental study of beech wood surface treated with CO2 laser engraving. We evaluated the extent of change in color and morphology dependent on the laser power and the raster density. The surface morphology evaluation criteria were the roughness and waviness parameters. Another study issue was the impact of these changes on beech wood wetting with standard liquids and on surface free energy.

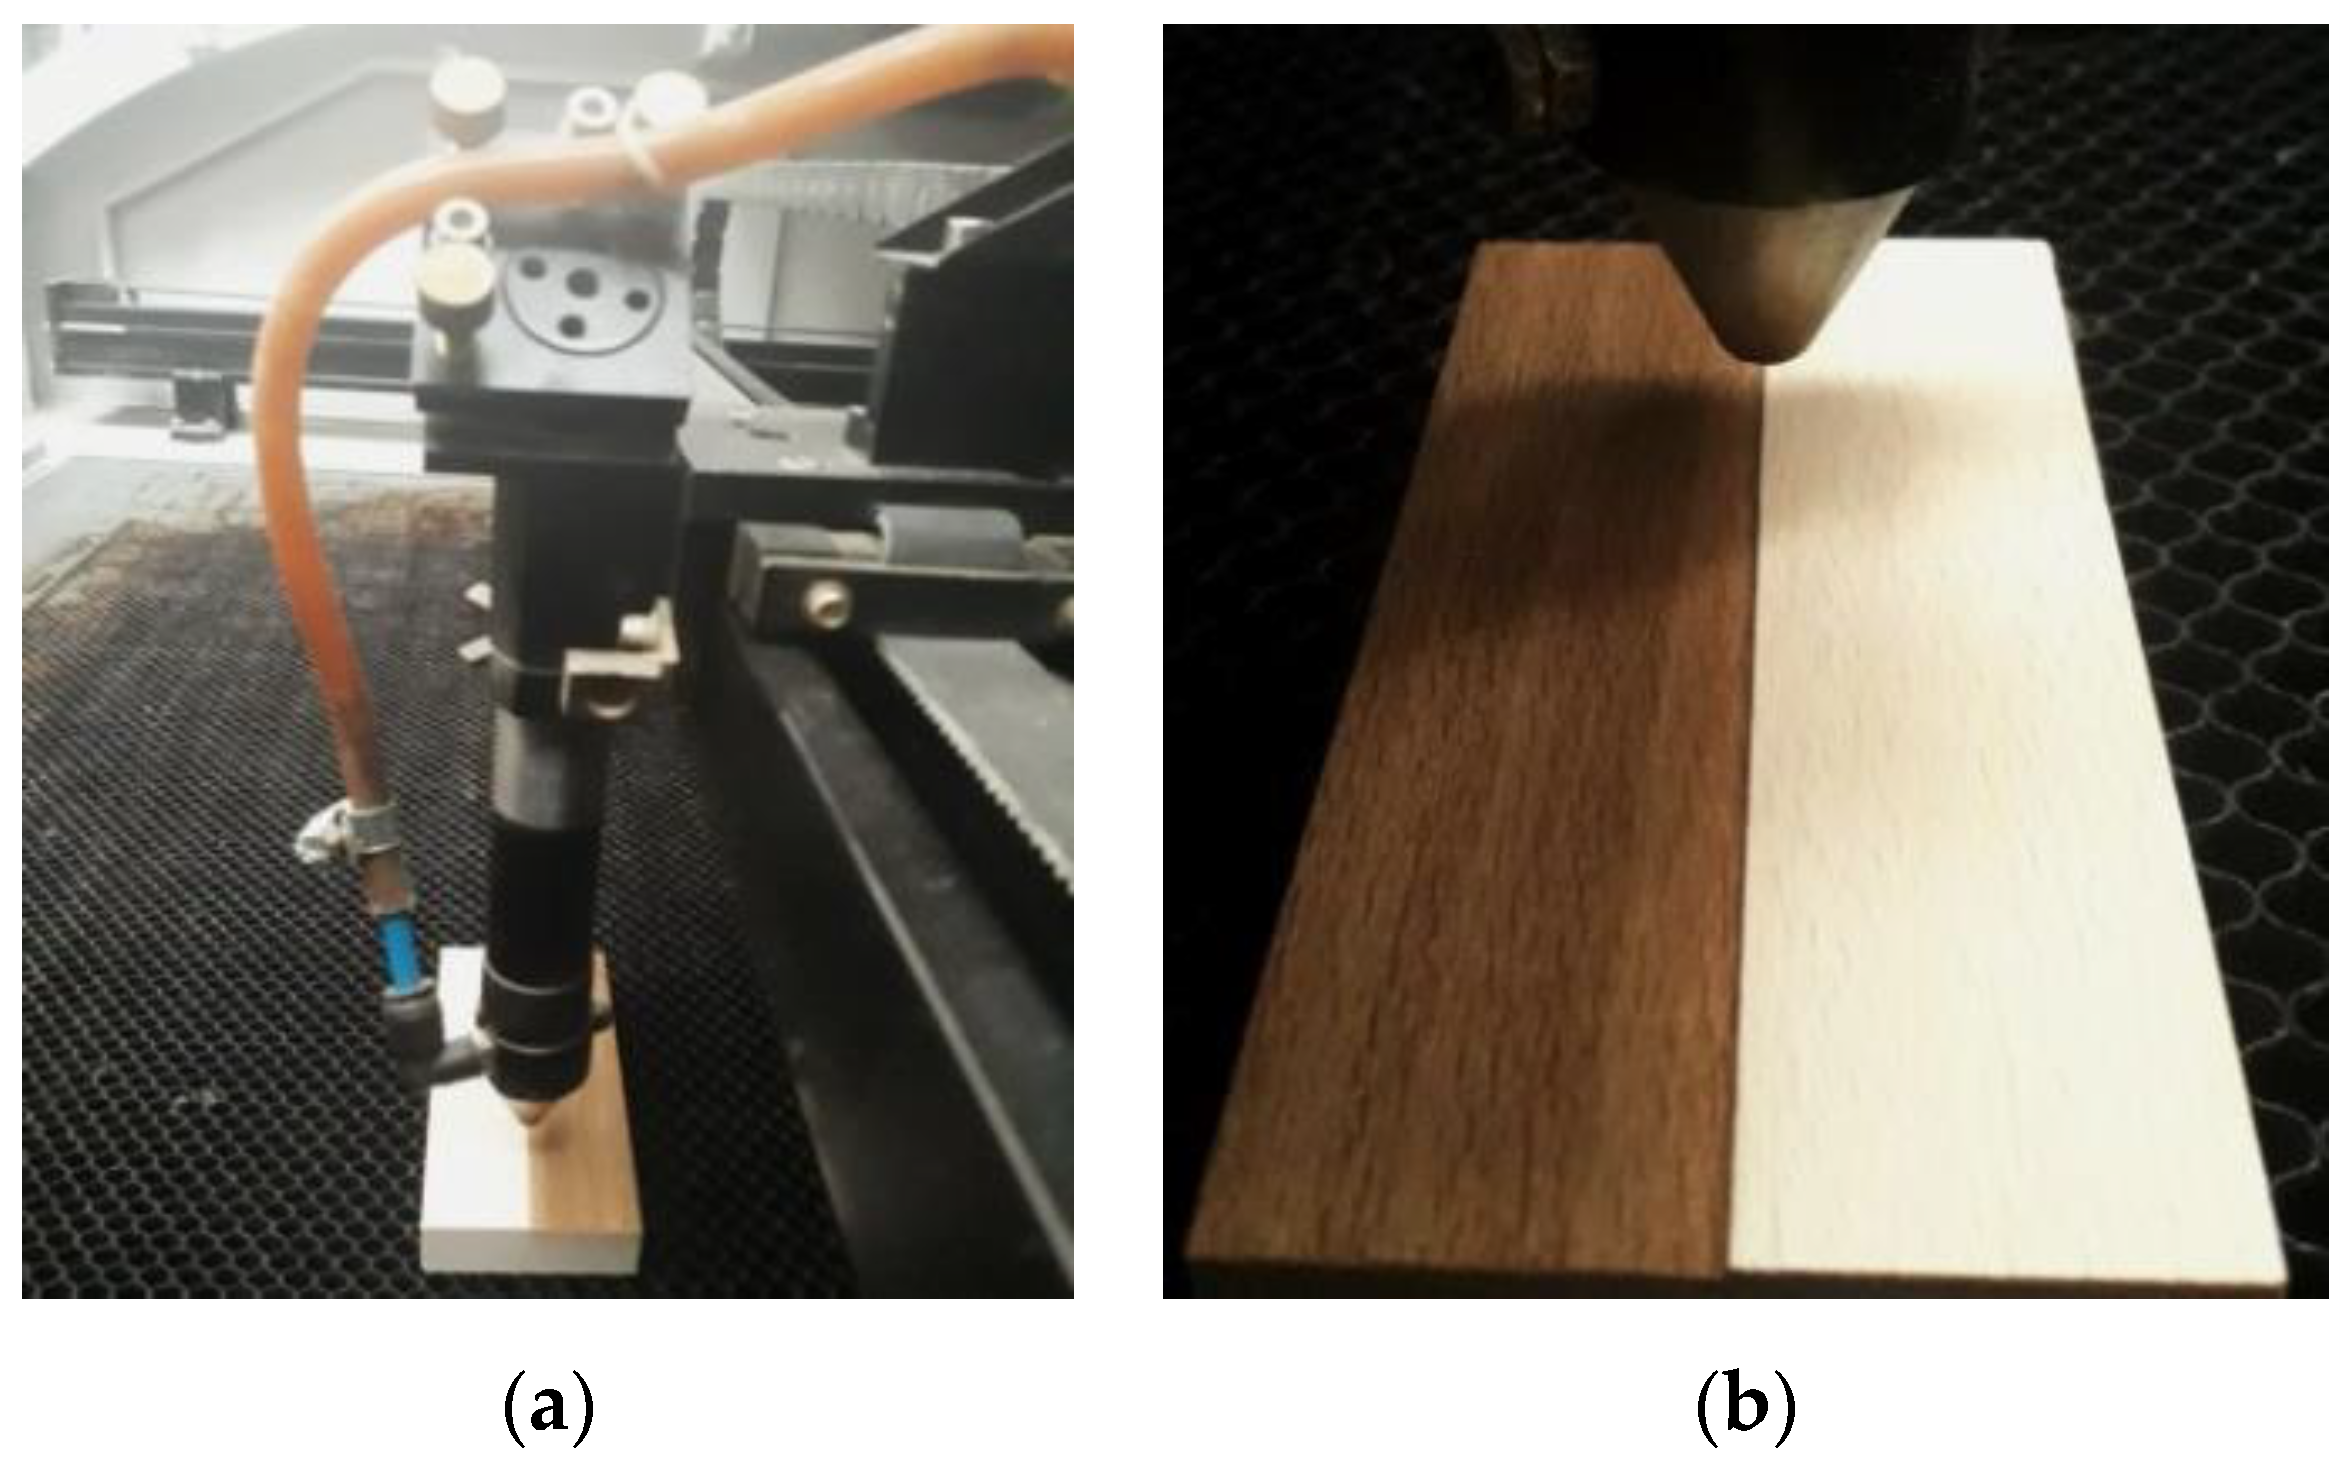
2. Materials and Methods

The wood engraving was performed with a CO2 laser CM-1309 (Shenzhen Reliable Laser Tech, Shenzhen, China) equipped with a 150 W glass laser tube (Figure 1). The dimensions of the irradiated beech wood (Fagus sylvatica L) specimens were 100 mm × 50 mm × 15 mm (Figure 2). The specimens were located under the focus of the focusing lens, at a distance of 17 mm. The laser head was moving over the specimen’s surface, along the fiber direction, with a constant speed (350 mm·s−1). The radiation intensity varied with varying laser power and raster density n. One specimen series (30 pcs) was engraved at 4%, the other (30 pcs) was engraved at 8% of the maximum laser power (chosen from the equipment menu). The engraving was executed perpendicular to the grain, with raster densities of 1, 2, 5, 10, and 20 paths per one millimeter across the specimen width. So, the total specimens number was 30 plus 30 plus six referential ones. Under the relevant conditions, each specimen series was irradiated uniformly along the specimen length.
The irradiation dose H (J·cm−2) corresponding to one beam path was calculated according to the equation:
H = P e · τ A = P e · x A · v
where Pe (W) is the power of the laser beam bundle on the specimen surface, τ (s) is the irradiation time corresponding to one beam path (ratio between the specimen dimension x (cm) and velocity v (cm·s−1), and A (cm2) is the area irradiated during one beam path.
The working power of the laser, which is necessary for calculation of the irradiation dose, was measured with a power measuring equipment FieldMaxII-TOP (Coherent, Santa Clara, CA, USA), with a sensor PM150-50C located parallel to the specimen surface. The equipment measured the power of the laser beam bundle reaching the wood in the perpendicular direction. We also measured the width of the footprint imprinted on the beech wood surface by the laser beam bund generated under the relevant performance power.

2.1. Color Measurement

The color coordination values in the colorimetric space CIE L*a*b* before and after irradiation and the differences in the color coordinates ΔL*, Δa*, Δb* related to the control specimens were measured with a spectrophotometer Spectro-guide 45/0 gloss (BYK-GARDNER GmbH, Geretsried, Germany). The discoloration extent was determined through the total color difference ΔE* calculated according to Equations (2)–(5):
Δ E * = Δ L * 2 + Δ a * 2 + Δ b * 2
Δ L * = L T L R
Δ a * = a T a R
Δ b * = b T b R .
Note that the index “T” is used for the color value after wood surface irradiation, and “R” means the so-called referential (control) value obtained for the surface of original, untreated wood.

2.2. Roughness and Waviness Measurement

The morphological changes on a wood surface irradiated with a CO2 laser performing under different radiation modes were assessed through roughness and waviness parameters as well as based on the changes in the wood surface structure explored with the aid of light microscopy.
The roughness and waviness were measured with a profilometer Surfcom 130A (Carl Zeiss, Oberkochen, Germany). The measurements were carried out on the irradiated radial faces of beech specimens, parallel and perpendicular to the grain. There were measured the following roughness parameters: Ra—arithmetic mean deviation, Rq—root mean square deviation, Rz—maximum height of the assessed profile within a sampling length, Rt—maximum height of the assessed profile within the total length, RSm—mean distance between the valleys. The waviness was evaluated through the parameters Wa—arithmetic mean deviation and Wt—maximum height of the assessed profile. The sampling length values, ranging from 0.025 to 8 mm, were determined based on the preliminary measured values of roughness parameters Ra and Rz. The total measured length consisted of five sampling lengths.

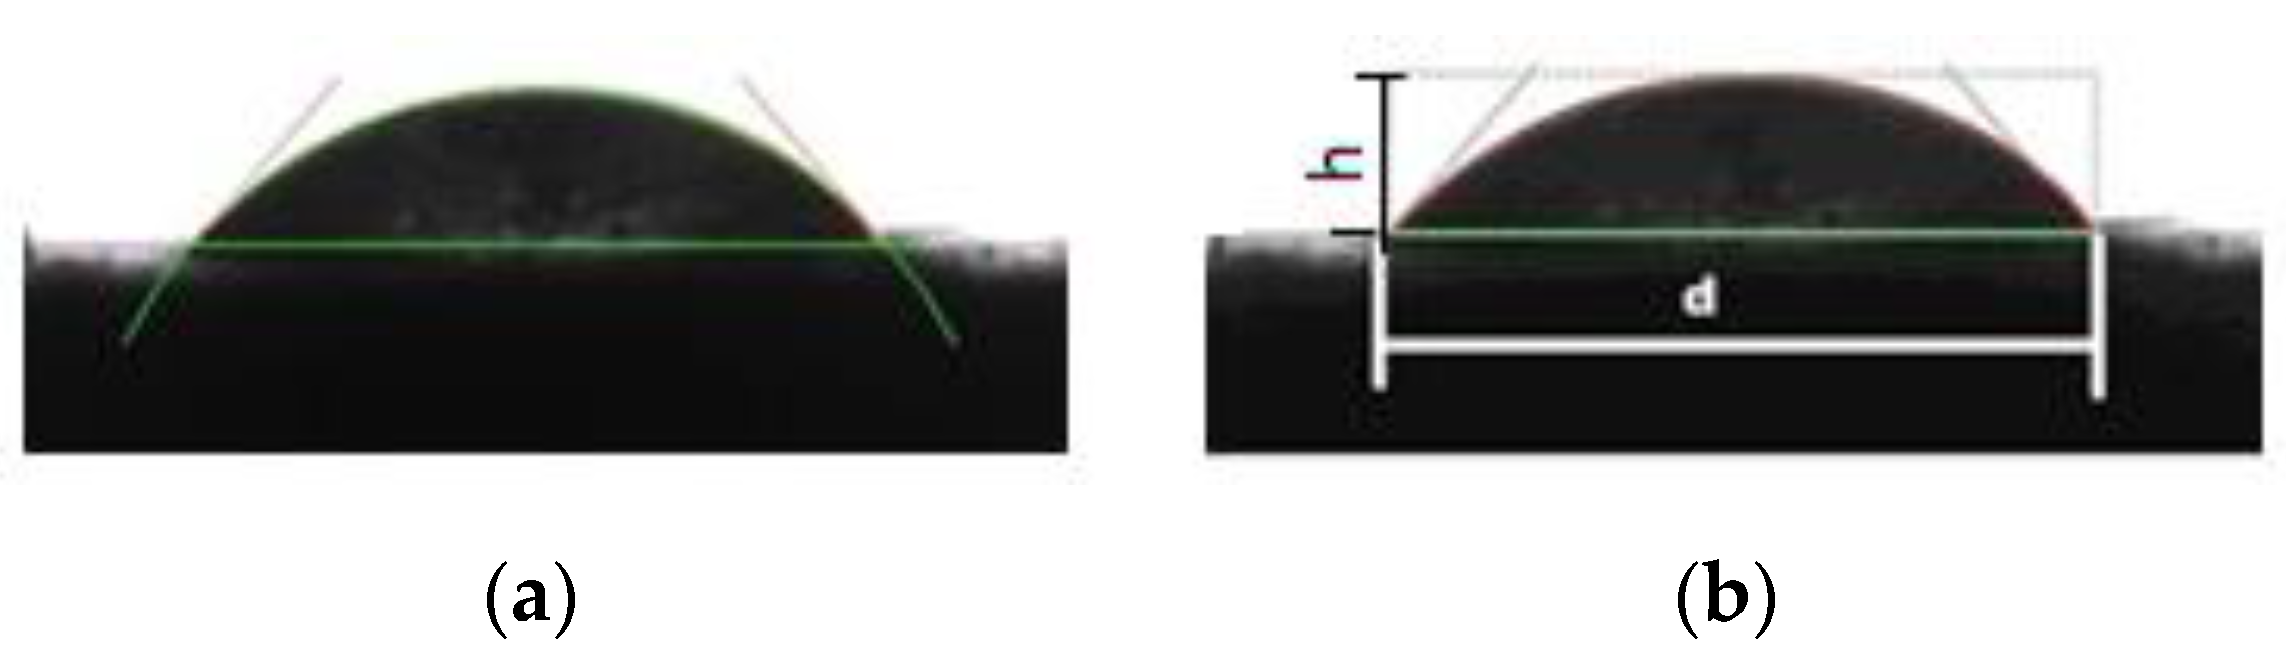
2.3. Wood Wetting with Liquids and Assessment of its Surface Free Energy

The wood wetting process was accompanied with contact angle measurements up to the complete soaking of the testing-liquid drop into the substrate. The measuring equipment was a goniometer Krüss DSA30 Standard (Krüss, Hamburg, Germany). There were two applied testing liquids, differing in their polarity: redistilled water and diiodomethane. The reasons for using namely these liquids can be found in [42]. Diiodomethane is a non-polar liquid with its non-polar component of surface free energy higher than the disperse component of this energy in wood. Redistilled water represents polar–non-polar liquid with their polar component of surface free energy higher than the polar component of wood. The parameters of these two liquids are outlined in Table 1.
From the moment of the contact of the testing drop (volume 0.0018 mL) with the wood surface, the wood wetting and drop spreading along the fiber direction were inspected. The history of the drop shape, from the first contact up to the complete soaking, was recorded with a camera. The scanning frequency (number of scans per one second) was adjusted according to the wetting duration.
The drop shape was analyzed, and the contact angle was determined based on two methods: drop perimeter (circle) method and drop height and diameter (height–width) method (Figure 3).
The contact angle value θ0 was measured at the beginning of the wetting process, immediately after the drop applying onto the wood surface. The moment of reversing the advancing angle to the receding one was determined based on the parameter d (drop width) values. The contact angle measured at this moment was considered as an “equilibrium” contact angle—θe. Then, the contact angle values θ0 and θe were used for calculating the contact angle θw for an ideally smooth surface, following the method proposed by Liptáková and Kúdela [43]. This angle was subsequently applied for the calculation of surface free energy and its components. The contact angle measurements were carried out on each rest specimen at six points.
As the wood was wetted with two different liquids, the wood surface free energy was determined separately for wetting with water and with diiodomethane, according to the adjusted equation originally proposed by Neumann et al. [44]:
cos θ = ( 0.0137 · γ s 2.00 ) · γ s · γ L + γ L γ L · ( 0.0137 · γ s · γ L 1 )
with the disperse and polar components γ S d and γ S p calculated in the following way, as suggested by Kloubek [45].
γ S d = γ L d · ( 1 + cos θ 2 ) ± γ L p · γ S γ L ( 1 + cos θ 2 ) 2
γ S p = γ L p · ( 1 + cos θ 2 ) μ γ L d · γ S γ L ( 1 + cos θ 2 ) 2
The resulting surface free energy of beech specimens irradiated with varied irradiation doses was determined as the sum of this energy polar component quantified with water and the disperse component obtained with diiodomethane.

3. Results and Discussion
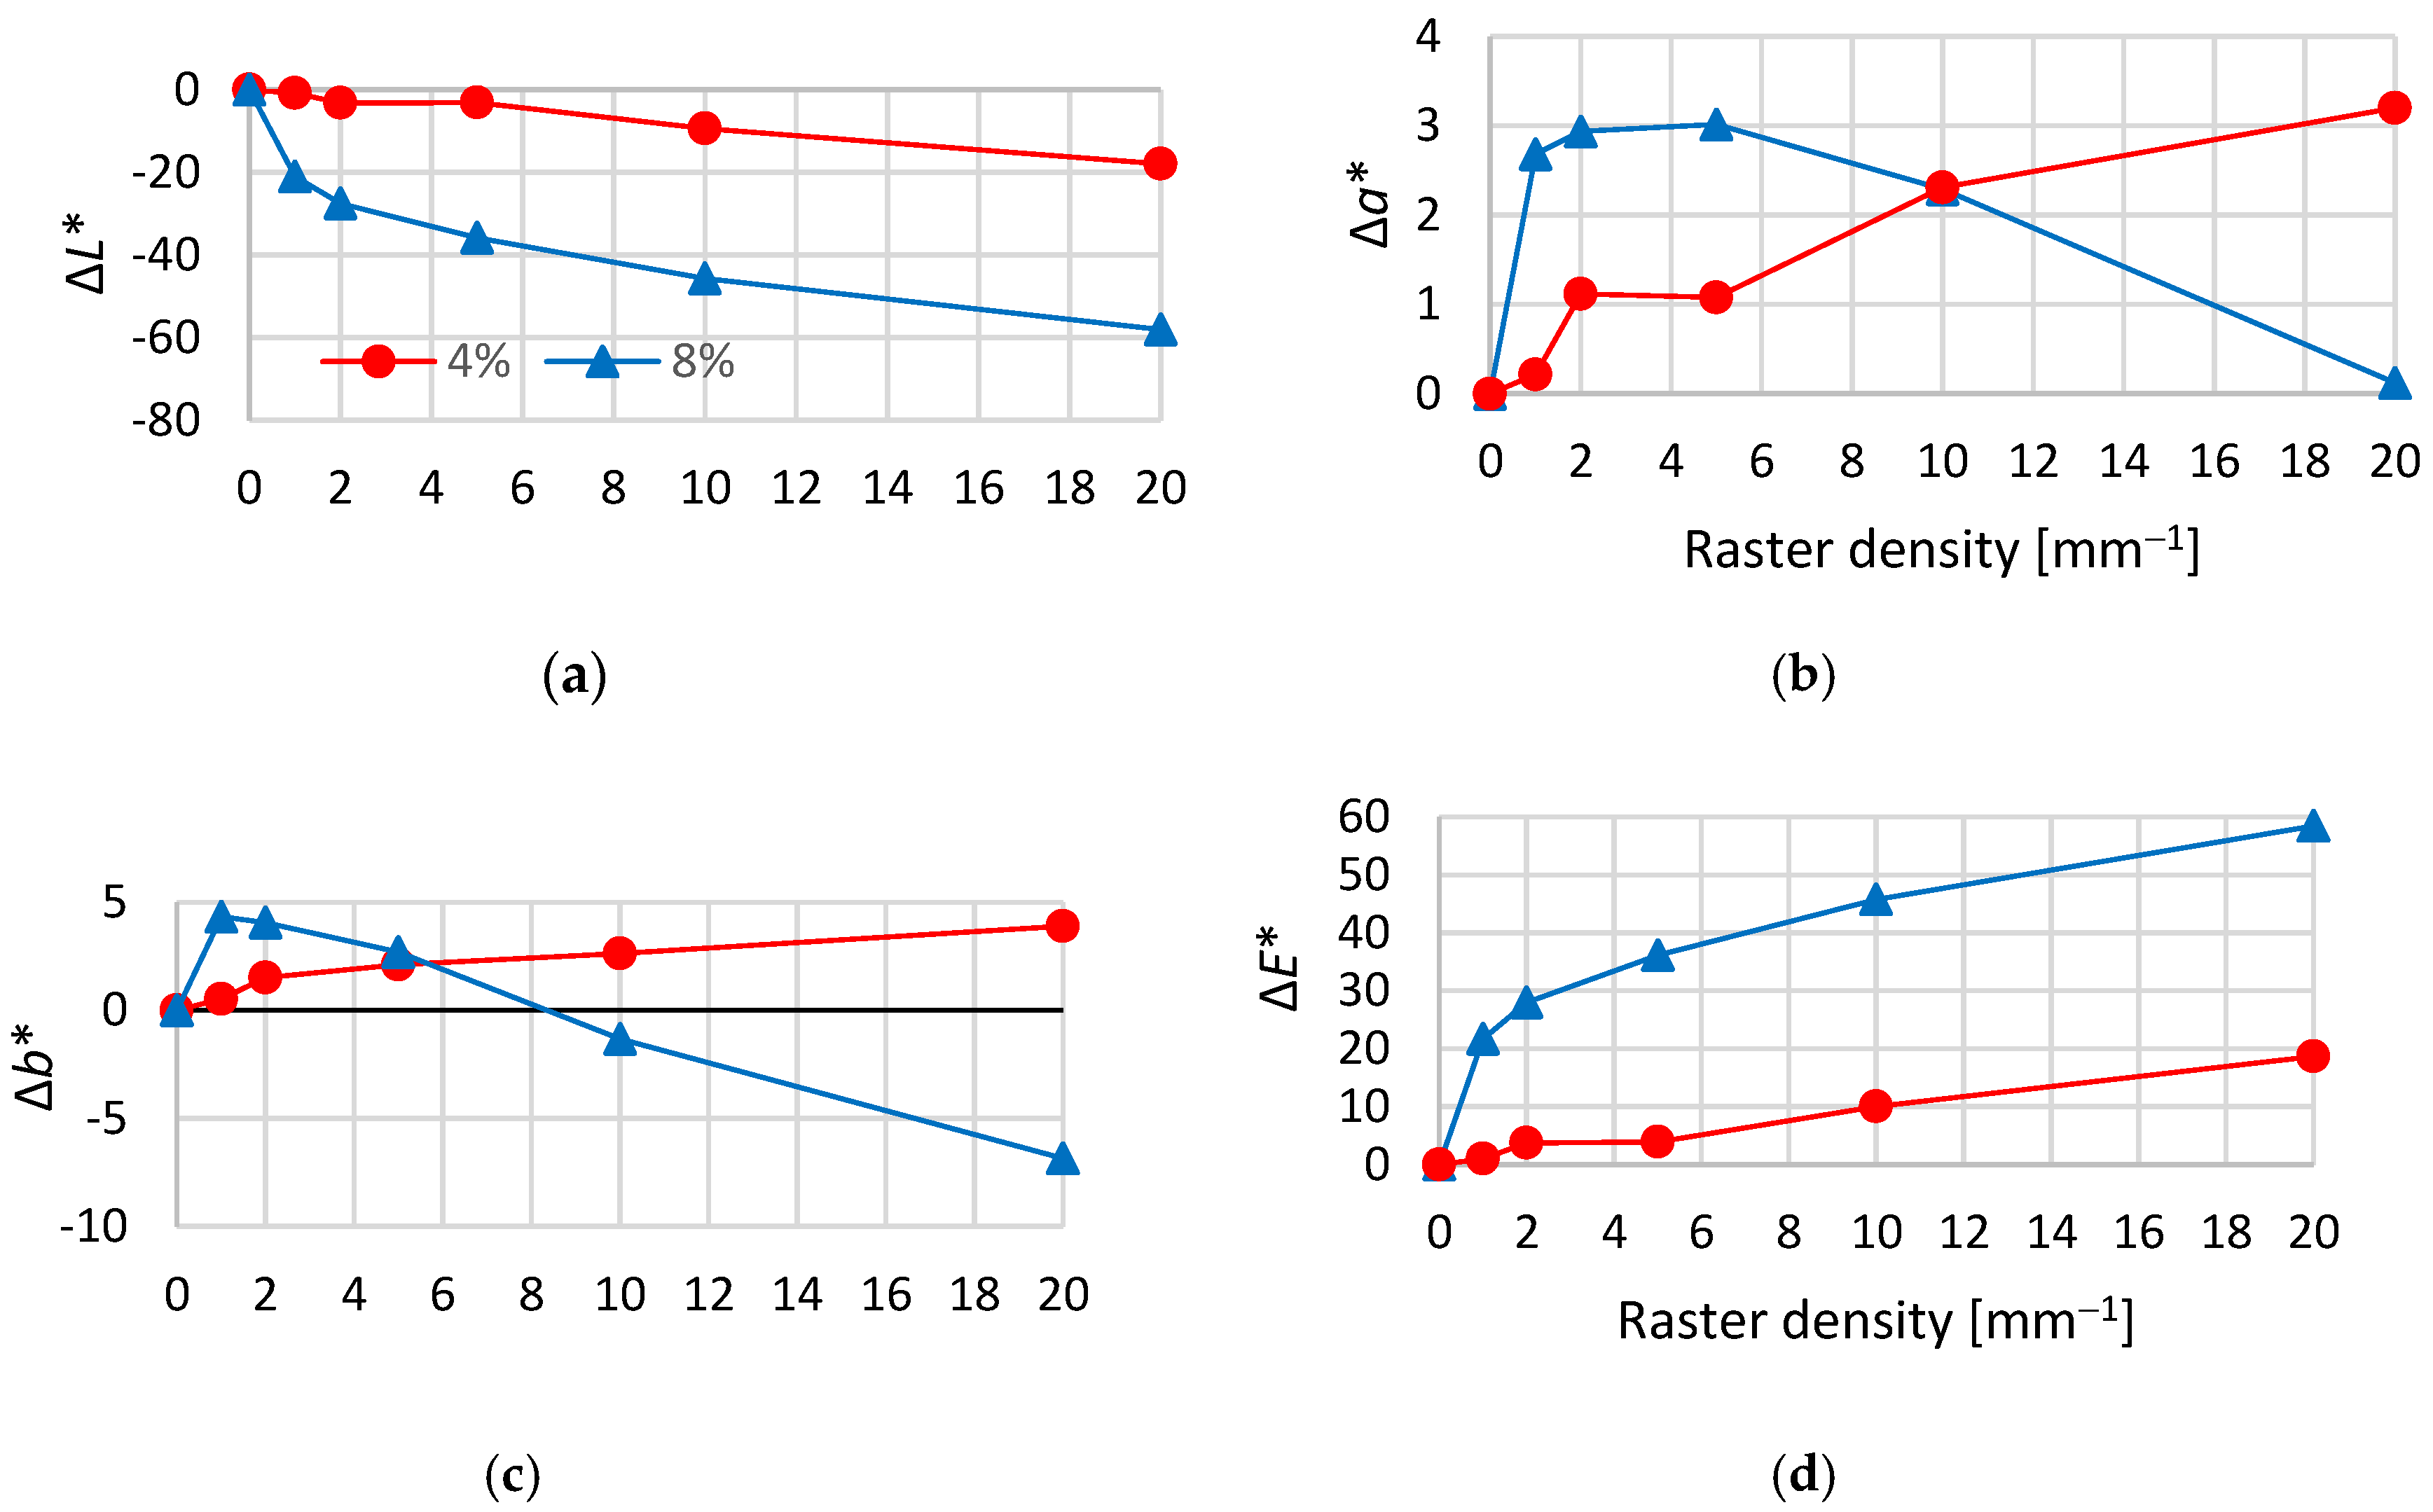
The effective power Pe values delivered by the laser beam onto the specimen surface were 5.5 W and 11 W for the laser power values 4% and 8%, respectively. The obtained effective power values were used for calculating the irradiation doses according to Equation (1). The corresponding irradiation doses related to one beam path along the specimen were 11.2 J cm−2 and 22.4 J cm−2, respectively.
As the focal distance between the specimen and the equipment focus was small, the engraving process was accompanied by the material degradation on the beech specimen surface. This mentions that the specimen surface temperature at the irradiation doses related was surely higher than 220 °C, which is in accord with the temperature values measured experimentally, with the aid of a thermal camera. Already at 4% laser power, the wood surface temperature at the contact spot between the laser beam and wood surface was approximately 500–550 °C, and at 8% laser power even over 800 °C. The width of the engraved track (0.14 mm) was controlled only by the width of the beam at the incidence spot, independent of the laser power. The degraded layer thickness increased proportionally with the radiation dose and with the raster density, representing from several micrometers to several tenths of a millimeter. This was also associated with significant changes in the wood surface color and morphology.

3.1. Color Change

The surface discoloration was the earliest change observed visually on the beech wood surface during the engraving process. The two-way variance analysis had a confirmed significant impact of the laser power, raster density, and their mutual interactions on the beech wood surface discoloration. The basic statistic characteristics for these two variables are shown in Table 2.
The color coordinates of the original beech wood before irradiation were within the interval reported for this wood species by Babiak et al. [46] and Kurjatko et al. [47]. With scaling up the raster density; at 4% power, the lightness L* values exhibited a decrease, while the color coordinates a* and b* values increased, shifting toward red and yellow. In this way, the specimen surface was getting more and more brown saturated (Table 2). The changes in the color coordinates ΔL*, Δa*, and Δb* related to the referential (control) specimens and the total color difference ΔE* are illustrated in Figure 4. At the six-degree measurement scale referred by Allegretti et al. [48], the total color difference ΔE* values ranged from degree 2 to degree 6. The discoloration varied from just visually detectable changes up to a completely new color hue.
At 8% laser power, the decrease in the lightness parameter L* with increasing raster density was more conspicuous. The changes in the color coordinates Δa* and Δb* were different in quality and quantity (Table 3, Figure 4). The total color difference ΔE* was much higher than 12, representing a completely new color, just at the raster density n = 1 mm−1. This color difference was similar to the difference obtained at 4% power only for the highest raster density n = 20 mm−1. With increasing raster density, the ΔE* increased up to the maximum value of 60 (Figure 4).

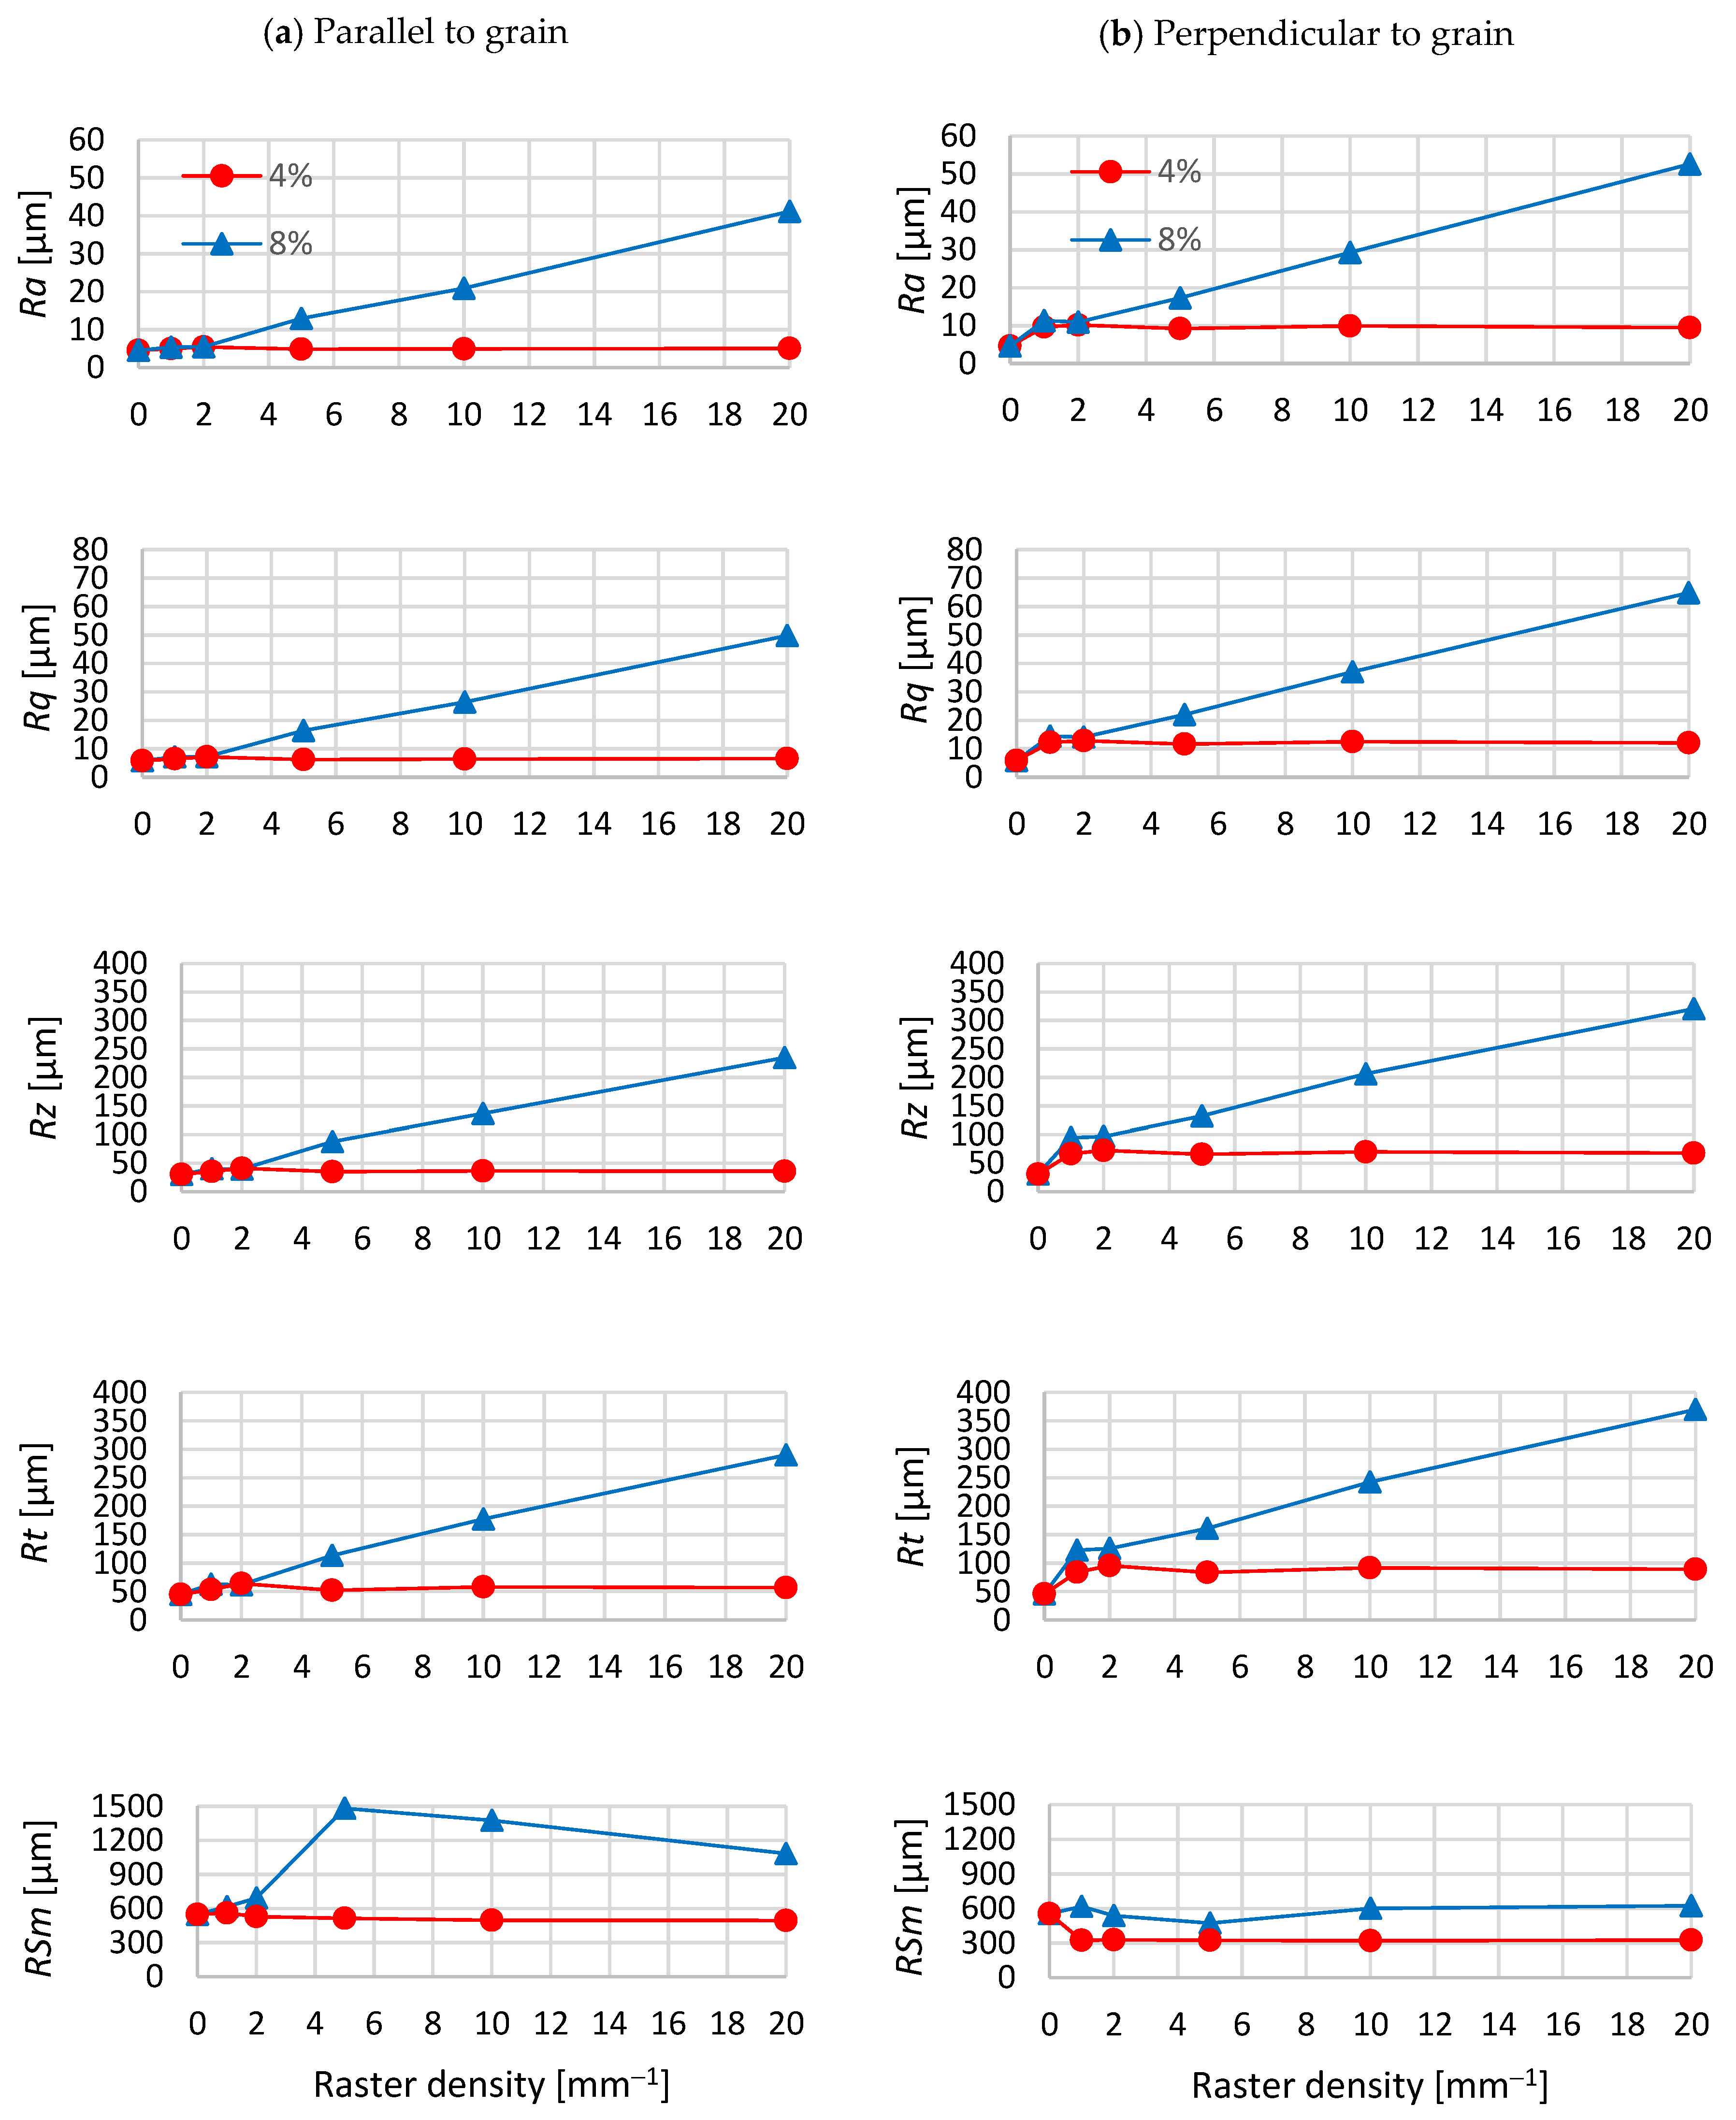
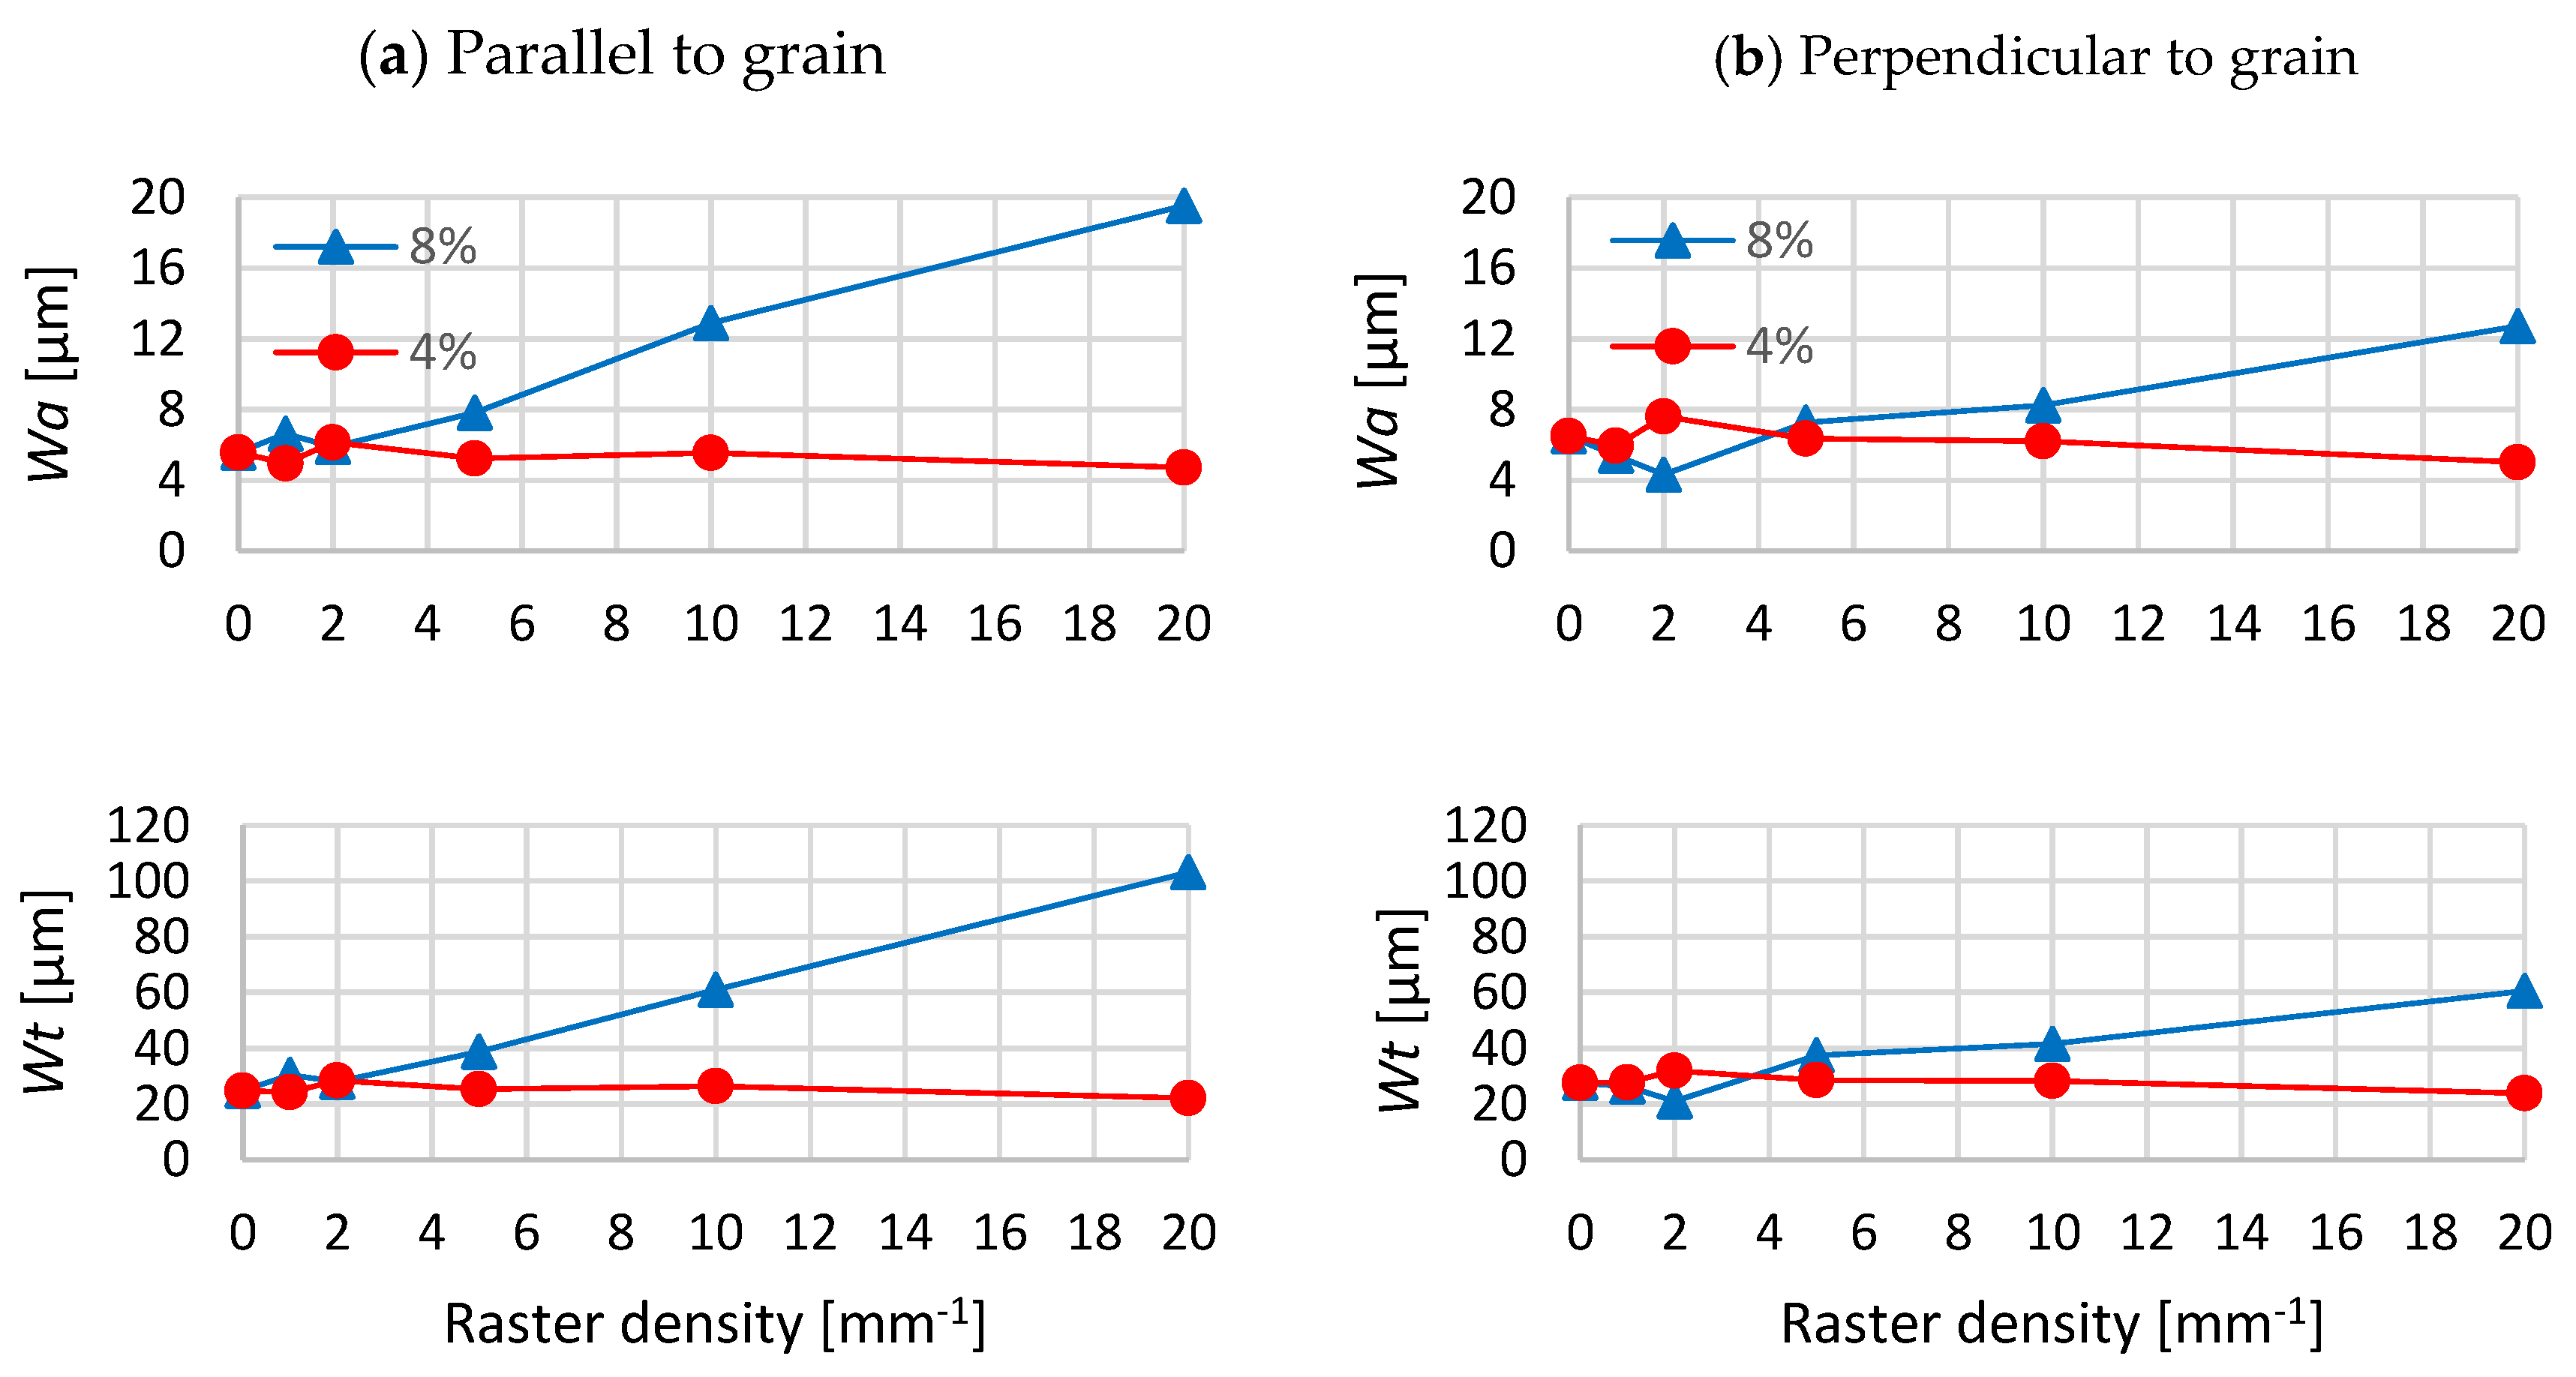
3.2. Surface Morphology

Engraving-induced impacts on the wood surface were also evident on beech wood surface morphology evaluated through specified roughness parameters. The values of the basic statistic roughness characteristics Ra, Rq, Rz, Rt, and RSm, measured parallel and perpendicular to the grain for all the engraving modes, are summarized in Table 4. The effects of the irradiation parameters (laser power and raster density) and the effects of the anatomical direction exerted on the roughness parameters were assessed with the aid of three-way variance analysis. The analysis resulted in finding that all the three factors tested had significant effects on all the roughness parameters.
The results show that parallel to the grain, the effects of the treatment at 4% laser power on the roughness parameters were found to be significant, causing a moderate increase in surface roughness; however, they were not dependent on the chosen raster density. Contrarily, Haller et al. [9] report a roughness decrease induced by laser treatment. No significant changes in roughness were observed by Kúdela et al. [13]. However, it is necessary to note that the above reported studies were not performed under the same laser irradiation as our study. Under the same conditions, the roughness perpendicular to the grain was higher than parallel to the grain. Nevertheless, even in this case, no dependence of roughness on raster density was observed (Figure 5).
Raising the laser power to 8% was significantly reflected in the roughness increase. The values of roughness parameters Ra, Rq, Rz, and Rt measured parallel to the grain increased linearly with the increasing raster density (Figure 5). At the peak raster density, all the tested roughness parameters were even by one order higher. The Ra, Rq, Rz, and Rt measured perpendicular to the grain exhibited raster density-dependent courses similar to those measured parallel to the grain. However, in all cases, the corresponding values measured perpendicular to grain were higher. Contrarily, the mean distance between the valleys RSm initially increased and then moderately decreased with the increasing raster density. Perpendicular to the grain, an opposite course was observed (Figure 5). Roughness dependence on laser power has also been confirmed by Gurau and Petru [29].
To represent the wood surface geometry in more detail, the roughness evaluation was complemented with waviness evaluation through the parameters Wa and Wt. The results are shown in Table 4. At 4% laser power, the changes in waviness parameters were small, without an evident increase with increasing raster density. Contrarily, there was observed a moderate decrease; however, it was irrelevant from the practical point of view (Figure 6). Nor was the impact of anatomical direction identified as significant.
On the other hand, 8% laser power induced a threefold increase of the irradiation dose per unit area, with enhancing not only roughness but also the waviness of the wood surface. The waviness parameters linearly increased also with increasing raster density. Waviness is considered resulting from the interactions between the heterogeneous wood structure and the laser beam; at lower raster densities (1–5), the impact of the cutting tool is also present. These three factors causing the waviness indicate that there are regularly repeated unevenness components with the wavelength longer than the length of the segment, the roughness of which is investigated.

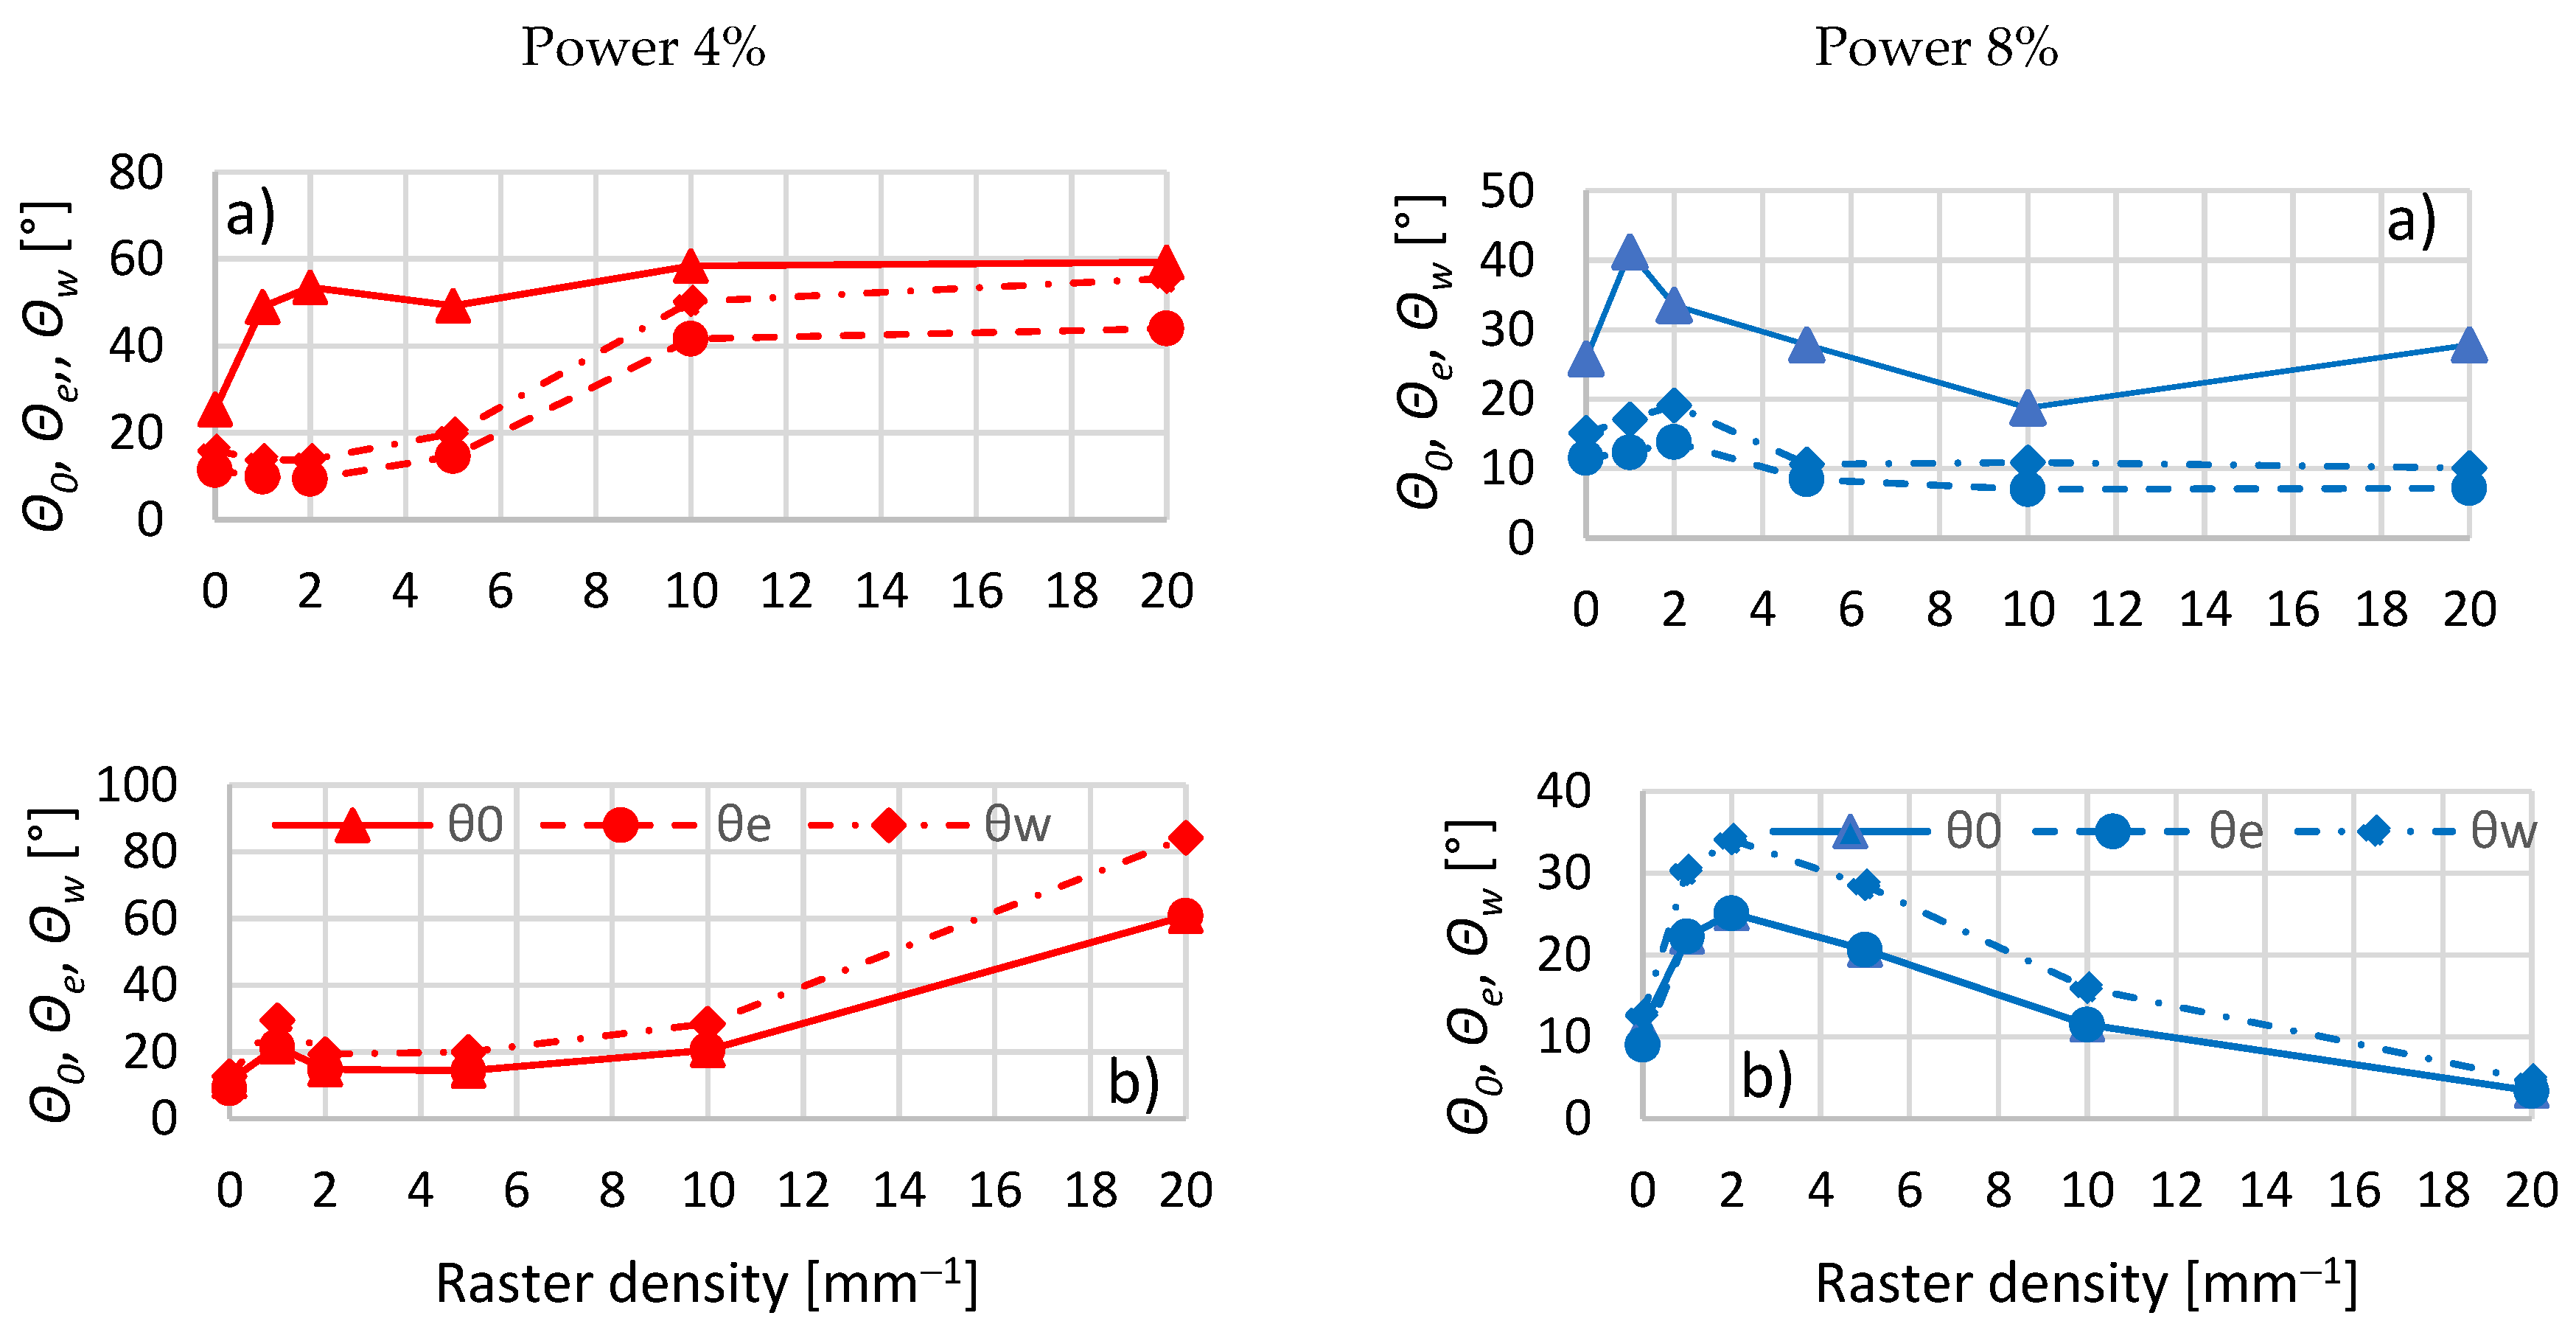
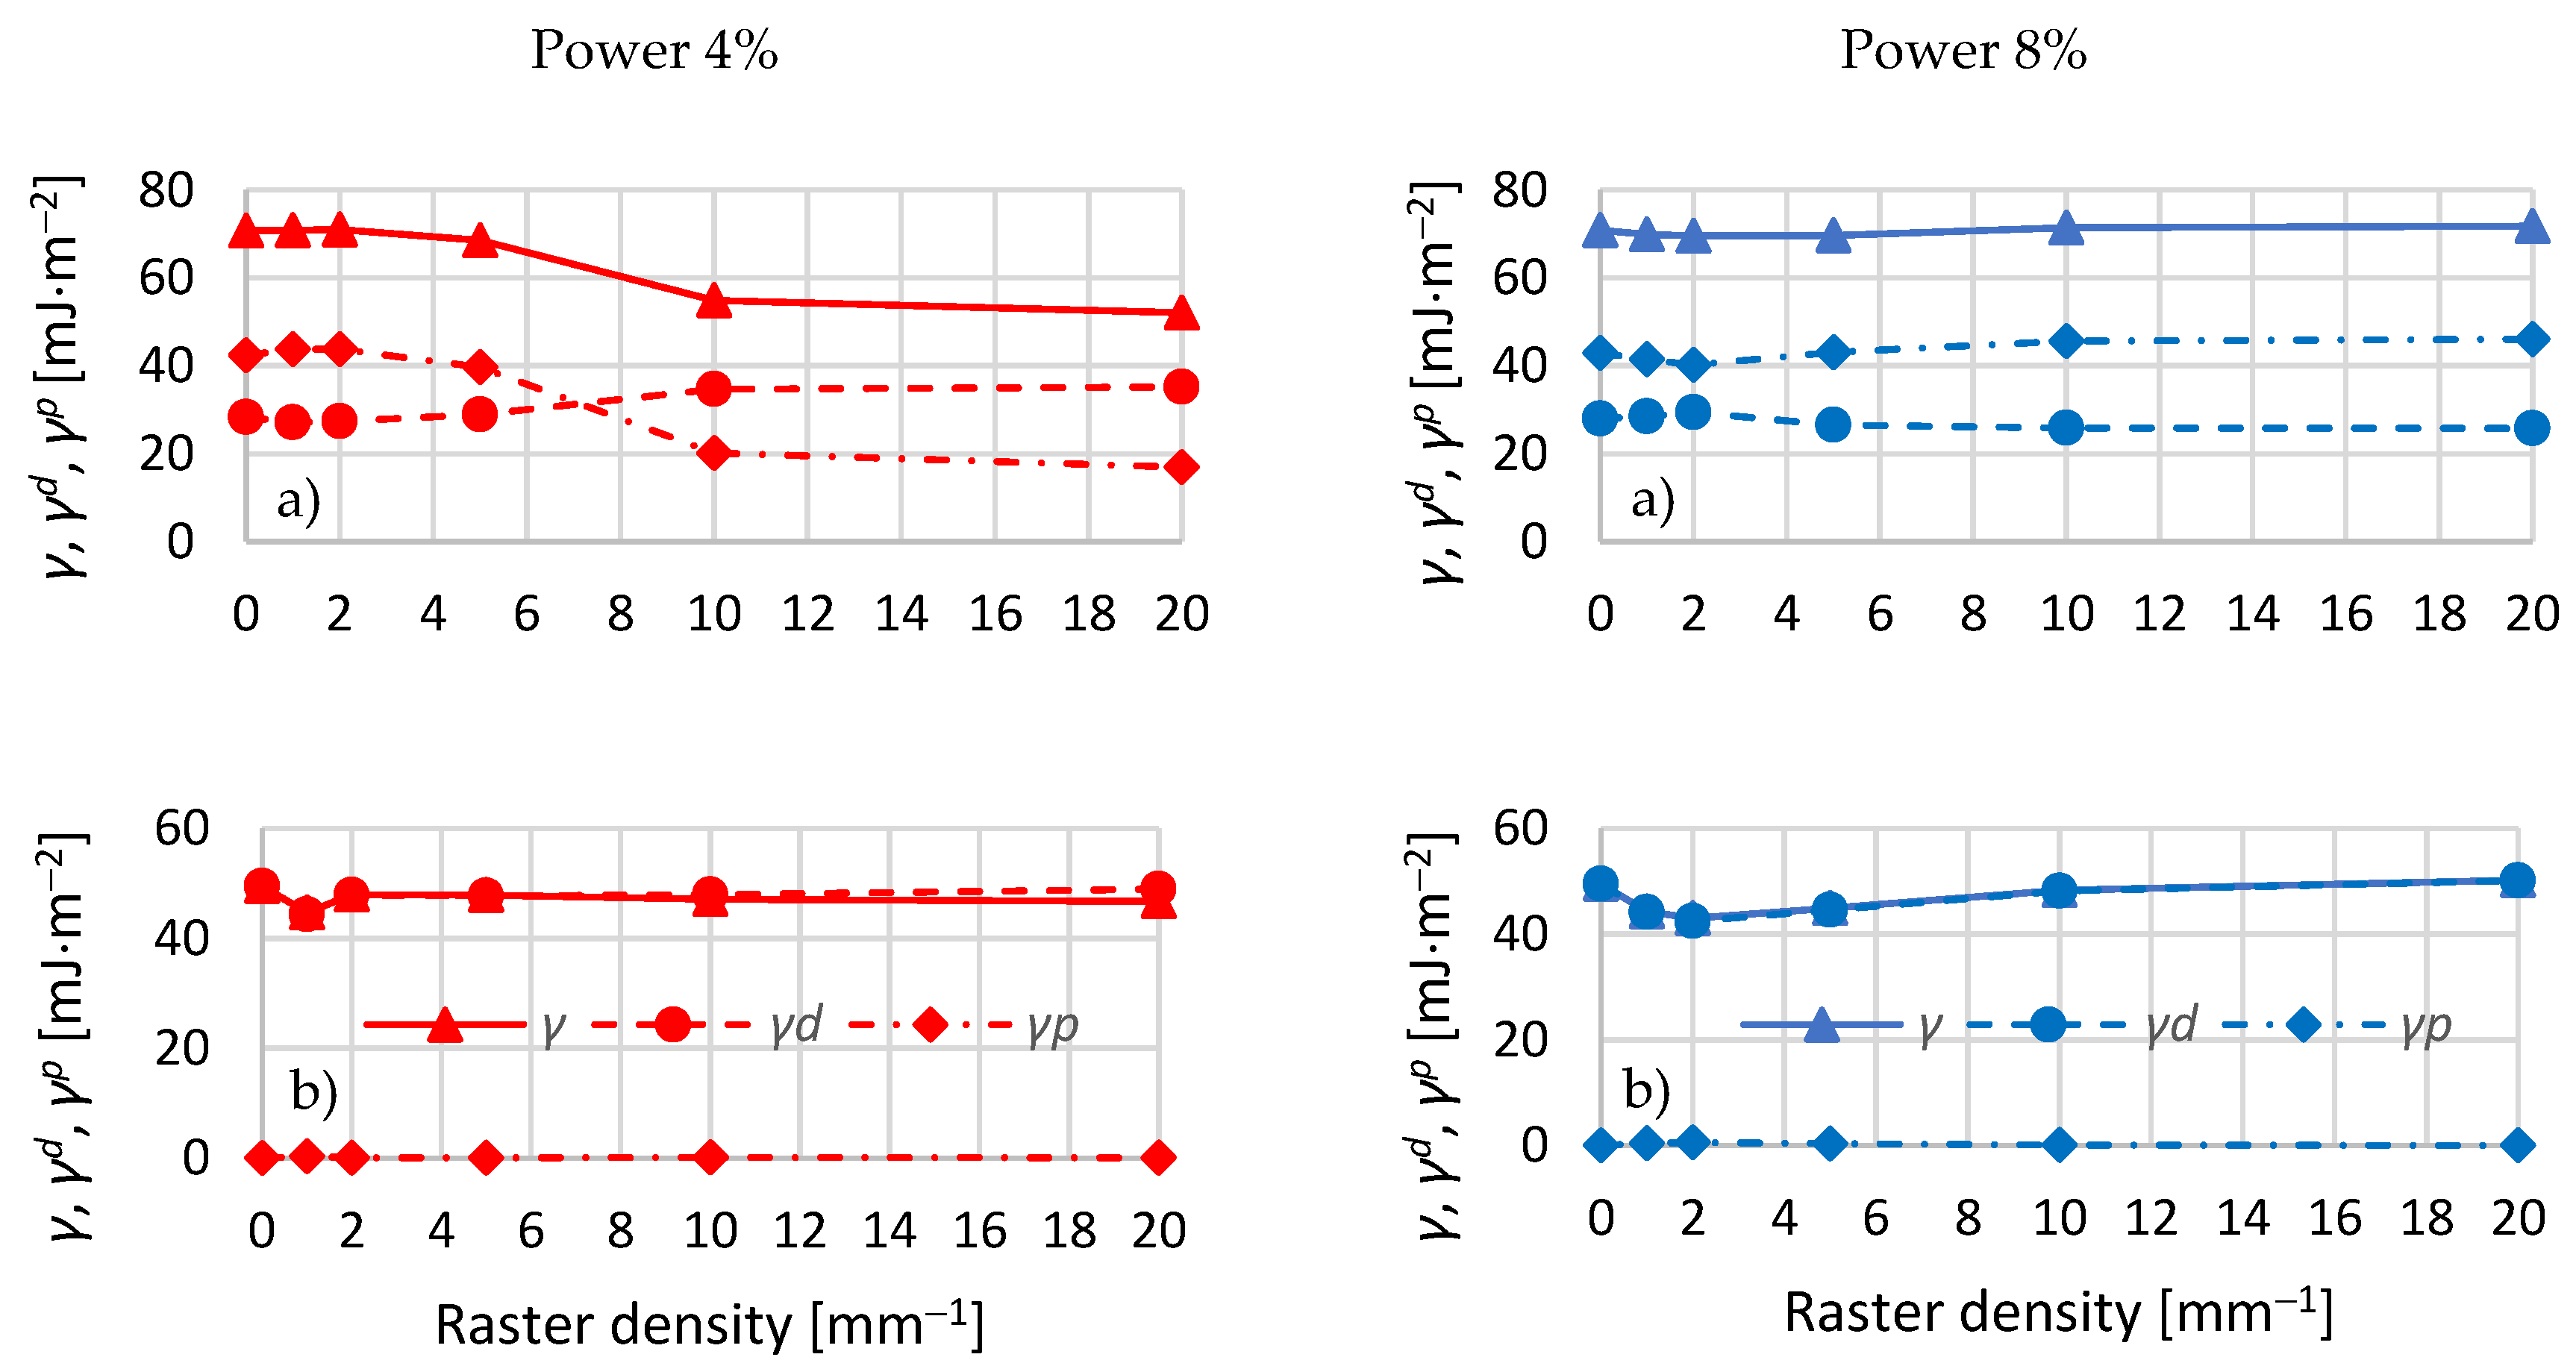
3.3. Surface Wetting and Surface Free Energy

The wetting of a beech wood surface engraved with a CO2 laser was evaluated based on the contact angle values θ0, θe, and θw. The results demonstrate that the CO2 laser-induced changes in the beech wood surface morphology and chemical structure caused also changes in wetting of this surface with standard liquids. The testing liquid drop applied on the wood surface was continually spreading over the surface and, at the same time, soaking into the substrate.
The most wetted wood surface was obtained in the case of the referential specimens with a sanded surface (Figure 7). Some works have demonstrated that sanded beech wood surfaces, independent of the grain size, were more hygrophilous and better wetted than surfaces treated in another way, such as milling and heating [49,50].
The wood surface treatment with a CO2 laser performing at 4% power enhanced the contact angle values θ0, θe, and θw, showing significant differences in comparison with the referential specimens. With increasing raster density, the beech wood surface wetting was getting lower, which was evident from the higher contact angle values. A similar trend in contact angle change with an increasing CO2 laser irradiation dose was also obtained by Kúdela et al. [13]; however, this observation was made with another laser type without beech wood surface engraving. An increase in contact angle values was also observed during wetting with diiodomethane. Poorer wetting was also responded by longer time periods, which were necessary for the complete drop spreading over and soaking into the substrate. In this case, the average time necessary for the complete soaking of drops applied on the beech wood surface irradiated with the CO2 laser ranged from 20 to 100 s. The average duration of the wood wetting process with diiodomethane was from 17 to 50 s. The surface modified in this way displayed higher hydrophobicity, which is in accord with Haller et al. [9]. In contradiction with the last cited authors, in our case, all the contact angle values were lower than 90°.
At the laser power of 8%, the increasing raster density resulted in the contact angle values first increasing and then decreasing down to the values obtained for the referential specimens or even lower. This suggests more probably increased wood hydrophilicity (Figure 7). In addition, the time necessary for the complete drop soaking into the substrate was shorter for this treatment way. The measured contact angle values displayed a considerable variability (with the variation coefficient ranging from 7% to 40%). This variability was on the background of the heterogeneity of the chemical wood surface structure as well as the heterogeneity of wood surface morphology.
The contact angle θw values were used for the calculation of wood surface free energy Υ and the disperse and polar components of this energy, γd and γp, respectively (Figure 8). In the control specimens, the surface free energy calculated based on contact angle θw values determined with the aid of water was 70.7 mJ m−2, with the polar component higher (42.4 mJ m−2) than the disperse component (28.3 mJ m−2). These results are in a good accordance with [50].
After laser irradiation at 4% power, the increasing raster density caused the surface free energy to decrease, which was mainly due to the decrease in the polar component (Figure 8). On the other hand, the disperse component was rising moderately. The result was that the dispersive component outweighed the polar at raster densities 10 and 20. The surface free energy determined with the aid of diiodomethane was evidently lower, consisting almost only of the polar component and without essential changes depending on the raster density (Figure 8).
After laser irradiation at 8% power, the surface free energy did not show essential changes depending on the increasing raster density. The polar component was increasing moderately, and the disperse component, contrarily, was moderately decreasing. The surface free energy determined with diiodomethane was again distinctly lower, in this case consisting almost of the disperse component alone. With increasing raster density, the surface free energy displayed a moderate increase (Figure 8). Variation coefficients for the surface free energy ranged from 1.5% to 6%.
In addition in this case, the results confirmed the different performance of different liquid standards at their interface with wood. This was due to the differences in the surface free energy and in the disperse and polar components of this energy between the liquids. Following Kúdela [42], the surface free energy was obtained as the sum of the polar component for wood determined with water and the disperse component determined with diiodomethane. The surface free energy values determined in this way are shown in Table 5. Table 5 shows that at 4% laser power, the surface free energy values decreased with increasing raster density; however, the wood surface free energy was rather high. At the laser power of 8%, the surface free energy values at high raster densities of 10 and 20 mm−1 were even higher than the corresponding values obtained in the referential specimens.
Thus, the surface free energy values represented in Table 5 are fairly high, suggesting a good prerequisite for attaining a strong adhesion of film-forming materials to wood. The negative factor affecting the gluing quality may be the high roughness observed at the laser power of 8% and at high raster density.

4. Conclusions

The results indicate that the laser power and raster density had significant impacts on the beech wood surface properties investigated in this study.
At 4% laser power, the discoloration ranged from changes just identifiable with the unaided eye up to a completely new color hue. The lightness coordinate L* values were decreasing, with increasing coordinates a* and b* shifting toward red and yellow. As the results show, the wood surface was getting progressively more brown and saturated. At 8% laser power, the observed decrease in lightness L* was much more conspicuous, while the changes in the coordinates a* and b* were different equally in quality and quantity.
Increases in roughness and waviness were significant only at 8% laser power. The values of roughness parameters Ra, Rq Rz, Rt, Wa, and Wt measured equally parallel and perpendicular to the grain were increasing with the increasing raster density.
At 4% laser power, the increasing raster density lowered the beech surface wetting with water and with diiodomethane, which was evident from the higher contact angle values measured. The surface modified in this way appeared more hydrophobic. However, in all the cases, the contact angle values were lower than 90°. At 8% laser power, the increasing raster density was firstly responded by a moderate increase in contact angle values, followed by a decrease, down to the values equal to the referential ones or even lower. This suggests that in this case, enhanced wood hydrophilicity was more probable.
At 4% laser power, the calculated final values of surface free energy decreased with the increasing raster density, which was caused by the decrease in the polar component of this energy. At 8% laser power, the changes in surface free energy were very minor from the practical viewpoint. Evidently, there is a potential good adhesion between film-forming materials and wood.

Author Contributions

J.K. and I.K. conceived and designed the experiments; I.K. and M.A. measured and analyzed the laser power data; J.K. and M.A. measured the color, roughness, and contact angle; J.K. calculated the surface free energy; M.A. analyzed the color data; J.K., I.K., and M.A. wrote the paper. All authors have read and agreed to the published version of the manuscript.

Funding

This research was funded by the Slovak Research and Development Agency under the contract No. APVV-16-0177 (50%) and by the Scientific Grant Agency of the Ministry of Education SR and the Slovak Academy of Sciences Grant No. 1/0822/17 (50%).

Conflicts of Interest

The authors declare no conflict of interest. The funders had no role in the design of the study; in the collection, analyses, or interpretation of data; in the writing of the manuscript, and in the decision to publish the results.

References

  1. Aligizaki, E.M.; Melessanaki, K.; Pournou, A. The use of lasers for the removal of shellac from wood. e-Preserv. Sci. 2008, 5, 36–40. Available online: https://www.researchgate.net/publication/26538802 (accessed on 28 May 2018).
  2. Varga, D.; van der Zee, M.E. Influence of steaming on selected wood properties of four hardwood species. Holz Roh-Und Werkst. 2008, 66, 11–18. [Google Scholar] [CrossRef]
  3. Čermák, P.; Dejmal, A. The effect of heat and ammonia treatment on colour response of oak wood (Quercus robur) and comparison of some physical and mechanical properties. Maderas. Ciencia y Tecnología 2013, 15, 375–389. [Google Scholar] [CrossRef]
  4. Kačík, F.; Kubovský, I. Chemical changes of beech wood due to CO2 laser irradiation. J. Photochem. Photobiol. A 2011, 222, 105–110. [Google Scholar] [CrossRef]
  5. Kubovský, I.; Kačík, F. Changes of the wood surface colour induced by CO2 laser and its durability after the xenon lamp exposure. Wood Res. 2013, 58, 581–590. Available online: http://www.woodresearch.sk/wr/201304/07.pdf (accessed on 21 January 2014).
  6. Dzurenda, L. Colouring of beech wood during thermal treatment using saturated water steam. Acta Fac. Xylologiae Zvolen 2014, 56, 13–22. [Google Scholar]
  7. Kúdela, J.; Andor, T. Beech wood discoloration induced with specific modes of thermal treatment. Ann. WULS-SGGW For. Wood Technol. 2018, 103, 64–69. [Google Scholar]
  8. Kučerová, V.; Lagaňa, R.; Hýrošová, T. Changes in chemical and optical properties of silver fir (Abies alba L.) wood due to thermal treatment. J. Wood Sci. 2019, 65, 21. [Google Scholar] [CrossRef]
  9. Haller, P.; Beyer, E.; Wiedemann, G.; Panzner, M.; Wust, H. Experimental study of the effect of a laser beam on the morphology of wood surfaces. In Proceedings of the First International Conference of the European Society for Wood Mechanics, Lausanne, Switzerland, 19–21 April 2001; Available online: https://www.researchgate.net/publication/237543545 (accessed on 9 January 2002).
  10. Gurau, L.; Petru, A.; Varodi, A.; Timar, M.C. The influence of CO2 laser beam power output and scanning speed on surface roughness and colour changes of beech (Fagus sylvatica). BioResources 2017, 12, 7395–7412. [Google Scholar] [CrossRef]
  11. Li, R.; Xu, W.; Wang, X.A.; Wang, C. Modeling and predicting of the color changes of wood surface during CO2 laser modification. J. Clean. Prod. 2018, 183, 818–823. [Google Scholar] [CrossRef]
  12. Kúdela, J.; Kubovský, I.; Andrejko, M. Impact of different radiation forms on beech wood discolouration. Wood Res. 2018, 63, 923–934. Available online: http://www.woodresearch.sk/wr/201806/01.pdf (accessed on 9 January 2019).
  13. Kúdela, J.; Reinprecht, L.; Vidholdová, Z.; Andrejko, M. Surface properties of beech wood modified by CO2 laser. Acta Fac. Xylologiae Zvolen 2019, 61, 5–18. [Google Scholar] [CrossRef]
  14. Pandey, K.K.; Vuorinen, T. Comparative study of photo degradation of wood by a UV laser and a xenon light source. Polym. Degrad. Stab. 2008, 93, 2138–2146. [Google Scholar] [CrossRef]
  15. Kubovský, I.; Oberhofnerová, E.; Kačík, F.; Pánek, M. Surface Changes of Selected Hardwoods Due to Weather Conditions. Forests 2018, 9, 557. [Google Scholar] [CrossRef] [Green Version]
  16. Chernykh, M.; Kargashina, E.; Stollmann, V. The use of wood veneer for laser engraving production. Acta Fac. Xylologiae Zvolen 2018, 60, 121–127. [Google Scholar] [CrossRef]
  17. Laskowska, A. The influence of ultraviolet radiation on the colour of thermo-mechanically modified beech and oak wood. Maderas. Ciencia y Tecnología 2020, 22, 1–26. [Google Scholar] [CrossRef]
  18. Ayrilmis, N.; Candan, Z.; Akbulut, T.; Balkiz, O.D. Effect of Sanding on Surface Properties of Medium Density Fiberboard. Drvna Ind. 2010, 61, 175–181. [Google Scholar]
  19. Vázquez, G.; Galinanes, C.; Freire, M.S.; Antorrena, G.; Gonzáles-Álvarez, J. Wettability study and surface characterization by confocal laser scanning microscopy of rotary-peeled wood veneers. Maderas. Ciencia y Tecnología 2011, 13, 183–192. [Google Scholar] [CrossRef] [Green Version]
  20. Santoni, I.; Pizzo, B. Effect of surface conditions related to machining and air exposure on wettability of different Mediterranean wood species. Int. J. Adhes. Adhes. 2011, 31, 743–753. [Google Scholar] [CrossRef]
  21. Huang, X.; Kocaefe, D.; Kocaefe, Y.; Boluk, Y.; Pichette, A. A spectrocolorimetric and chemical study on color modification of heat-treated wood during artificial weathering. Appl. Surf. Sci. 2012, 258, 5360–5369. [Google Scholar] [CrossRef]
  22. Qin, Z.; Zhang, Q.; Gao, Q.; Zhang, S.; LI, J. Wettability of Sanded and Aged Fast-growing Poplar Wood Surfaces: II. Dynamic Wetting Models. BioResources 2014, 9, 7176–7188. [Google Scholar] [CrossRef] [Green Version]
  23. Bekhta, P.; Krystofiak, T. The influence of short-term thermo-mechanical densification on the surface wettability of wood veneers. Maderas. Ciencia y Tecnología 2016, 18, 79–90. [Google Scholar] [CrossRef] [Green Version]
  24. Zhou, B.H.; Mahdavian, S.M. Experimental and theoretical analyses of cutting nonmetallic materials by low power CO2 laser. J. Mater. Process. Tech. 2004, 146, 188–192. [Google Scholar] [CrossRef]
  25. Patel, C.; Patel, A.J.; Patel, R.C. A Review on Laser Marking Process for Different Materials. Int. J. Sci. Res. Dev. 2017, 5, 147–150. Available online: https://pdfs.semanticscholar.org/6191/fa9441c2c822b1801d3ea750d6b9c5767cd3.pdf (accessed on 12 April 2017).
  26. Yang, C.; Jiang, T.; Yu, Y.; Bai, Y.; Song, M.; Miao, Q.; Ma, Y.; Liu, J. Water-jet Assisted Nanosecond Laser Microcutting of Northeast China Ash Wood: Experimental Study. BioResources 2019, 14, 128–138. [Google Scholar] [CrossRef]
  27. Kubovský, I.; Babiak, M. Color changes induced by CO2 laser irradiation of wood surface. Wood Res. 2009, 54, 61–66. [Google Scholar]
  28. Lin, C.J.; Wang, Y.C.; Lin, L.D.; Chiou, C.R.; Wang, Y.N.; Tsai, M.J. Effects of feed speed ratio and laser power on engraved depth and color difference of Moso bamboo lamina. J. Mater. Process. Technol. 2008, 198, 419–425. [Google Scholar] [CrossRef]
  29. Gurau, L.; Petru, A. The influence of CO2 laser beam power output and scanning speed on surface quality of Norway maple (Acer platanoides). BioResources 2018, 13, 8168–8183. [Google Scholar] [CrossRef]
  30. Arai, I.; Kawasumi, H. Thermal analysis of laser machining in wood III. Mokuzai Gakkaishi 1980, 26, 773–782. [Google Scholar]
  31. Barcikowski, S.; Koch, G.; Odermatt, J. Characterisation and modification of the heat affected zone during laser material processing of wood and wood composites. Holz Roh-Und Werkst. 2006, 64, 94–103. [Google Scholar] [CrossRef]
  32. Wust, H.; Haller, P.; Wiedemann, G. Experimental study of the effect of a laser beam on the morphology of wood surfaces. In Proceedings of the Second European Conference on Wood Modification, Göttingen, Germany, 6–7 October 2005. [Google Scholar]
  33. Dolan, J.A. Characterization of Laser Modified Surfaces for Wood Adhesion. Master’s Thesis, The Faculty of Virginia Polytechnic Institute, Blacksburg, VA, USA, 2014; p. 100. [Google Scholar]
  34. Kubovský, I.; Kačík, F. Colour and chemical changes of the lime wood surface due to CO2 laser thermal modification. Appl. Surf. Sci. 2014, 321, 261–267. [Google Scholar] [CrossRef]
  35. Petutschnigg, A.; Stöckler, M.; Steinwendner, F.; Schnepps, J.; Gütler, H.; Blinzer, J.; Holzer, H.; Schnabel, T. Laser treatment of wood surfaces for ski cores: An experimental parameter study. Adv. Mater. Sci. Eng. 2013, 1–7. [Google Scholar] [CrossRef] [Green Version]
  36. Blanchard, V.; Blanchet, P.; Riedl, B. Surface energy modification by radiofrequency inductive and capacitive plasmas at low pressures on sugar maple: An exploratory study. Wood Fiber Sci. 2009, 41, 245–254. [Google Scholar]
  37. Wang, C.; Piao, C. From Hydrophilicity to Hydrophobicity: A Critical Review–Part II. Hydrophobic Conversion. Wood Fiber Sci. 2011, 43, 1–16. [Google Scholar]
  38. Petrič, M.; Oven, P. Determination of wettability of wood and its significance in wood science and technology: A Critical Review. Rev. Adhes. Adhes. 2015, 3, 121–187. [Google Scholar]
  39. Hubbe, M.A.; Gardner, D.J.; Shen, W. Contact Angles and Wettability of Cellulosic Surfaces: A Review of Proposed Mechanisms and Test Strategies. BioResouces 2015, 10, 8657–8749. [Google Scholar] [CrossRef] [Green Version]
  40. Laskowska, A.; Sobczak, J.W. Surface chemical composition and roughness as factors affecting the wettability of thermo-mechanically modified oak (Quercus robur L.). Holzforschung 2018, 72, 993–1000. [Google Scholar] [CrossRef]
  41. Jankowska, A.; Boruszewski, P.; Drożdżek, M.; Rębkowski, B.; Kaczmarczyk, A.; Skowrońska, A. The role of extractives and wood anatomy in the wettability and free surface energy of hardwoods. BioResources 2018, 13, 3082–3097. [Google Scholar] [CrossRef] [Green Version]
  42. Kúdela, J. Wetting of wood surface by liquids of a different polarity. Wood Res. 2014, 59, 11–24. [Google Scholar]
  43. Liptáková, E.; Kúdela, J. Analysis of the wood–wetting process. Holzforschung 1994, 48, 139–144. [Google Scholar] [CrossRef]
  44. Neumann, A.W.; Good, R.J.; Hoppe, C.J.; Sejpal, M. An equation of state approach to determine surface tensions of low-energy solids from contact angles. J. Colloid Interface Sci. 1974, 49, 291–303. [Google Scholar]
  45. Kloubek, J. Calculation of Surface Free Energy Components of ice according to its wettability by water, chlorbenzene and carbon disulfide. J. Colloid Interface Sci. 1974, 46, 185–190. [Google Scholar]
  46. Babiak, M.; Kubovský, I.; Mamoňová, M. Farebný priestor vybraných domácich drevín. (Colour space of the selected domestic species). In Interaction of Wood with Various Form of Energy; Kurjatko, S., Kúdela, J., Eds.; Technical University in Zvolen: Zvolen, Slovakia, 2004; pp. 113–117. [Google Scholar]
  47. Kurjatko, S.; Čunderlík, I.; Dananajová, J.; Dibdiaková, J.; Dudas, J.; Gáborík, J.; Gaff, M.; Hrčka, R.; Hudec, J.; Kačík, F.; et al. Parametre Kvality Dreva Určujúce Jeho Finálne Použitie (Parameters of Wood Quality Determining Its Final Use), 1st ed.; Technical University in Zvolen: Zvolen, Slovakia, 2010; p. 352. ISBN 978-80-228-2095-0. [Google Scholar]
  48. Allegretti, O.; Travan, L.; Cividini, R. Drying techniques to obtain white Beech. In Proceedings of the Wood EDG Conference, Bled, Slovenia, 23 April 2009; Available online: http://timberdry.net/downloads/EDG-SeminarBled/Presentation/EDG (accessed on 12 May 2009).
  49. Liptáková, E.; Kúdela, J.; Bastl, Z.; Spirovová, I. Influence of mechanical surface treatment of wood the wetting process. Holzforschung 1995, 49, 369–375. [Google Scholar]
  50. Kúdela, J.; Javorek, Ľ.; Mrenica, L. Influence of milling and sanding on beech wood surface properties. Part II. Wetting and thermo-dynamical characteristics of wood surface. Ann. WULS SGGW, For. Wood Technol. 2016, 95, 154–158. Available online: https://docplayer.net/55970581-Warsaw-university-of-life-sciences.html (accessed on 18 December 2016).
Figure 1. Beech wood surface engraving with a Laser CM-1309: (a) general view, (b) detail.
Coatings 10 00077 g001
Figure 2. Test specimen: shape and dimensions.
Coatings 10 00077 g002
Figure 3. Determining the contact angle value by the circle method (a) and by the height–width method (b).
Coatings 10 00077 g003
Figure 4. Changes in color coordinates ΔL* (a), Δa* (b) and Δb* (c) and in the total color difference ΔE* (d) depending on changing raster density, for laser power values of 4% and 8%.
Coatings 10 00077 g004
Figure 5. Effects of raster density on roughness parameters parallel (a) and perpendicular (b) to grain on beech wood surface engraved at a laser power of 4% and 8%.
Coatings 10 00077 g005
Figure 6. Effects of raster density on waviness parameters parallel (a) and perpendicular (b) to the grain on the beech wood surface engraved at a laser power of 4% and 8%.
Coatings 10 00077 g006
Figure 7. Effects of raster density on the wetting of an engraved beech wood surface, with a laser power 4% and 8%. (a) Wetting with water, (b) wetting with diiodomethane.
Coatings 10 00077 g007
Figure 8. Effects of raster density on the wetting of an engraved beech wood surface; laser power 4% and 8%. (a) Surface free energy determined based on wetting with water, (b) surface free energy determined based on wetting with diiodomethane.
Coatings 10 00077 g008
Table 1. Surface free energy and its components for the testing liquids.
Testing LiquidLiquid Character γ γ d γ p γ + γ
(mJ·m−2)
waterpolar72.821.851.025.525.5
diiodomethanenon-polar50.850.80.00.00.0
Table 2. Surface discoloration of beech wood specimens irradiated with a CO2 laser performing at scaled raster densities (power 4%). Values in parentheses are the standard deviation values.
Raster Density n (mm−1)
0
(Control)
1251020
Color coordinatesL*80.0979.2476.8676.9870.7262.14
(1.59)(1.07)(1.38)(0.77)(1.34)(1.86)
a*5.335.546.456.417.648.53
(0.32)(0.26)(0.31)(0.24)(0.22)(0.39)
b*16.5917.1218.1018.7119.2220.48
(0.43)(0.39)(0.24)(0.32)(0.31)(0.24)
Specimen discoloration Coatings 10 00077 i001
Number of measurements N = 60, for each test series.
Table 3. Surface discoloration of beech wood specimens irradiated with a CO2 laser performing at scaled raster densities (power 8%). Values in parentheses are standard deviation values.
Raster Density n (mm−1)
0
(Control)
1251020
Color coordinatesL*80.0959.0452.5844.2034.4122.04
(1.59)(1.32)(2.18)(1.88)(1.52)(1.83)
a*5.338.018.278.357.625.45
(0.32)(0.25)(0.23)(0.12)(0.35)(0.63)
b*16.5920.9220.6419.2915.269.74
(0.43)(0.42)(0.60)(1.02)(0.99)(1.39)
Specimen discoloration Coatings 10 00077 i002
Number of measurements N = 60, for each test series.
Table 4. Basic statistic characteristics of roughness and waviness parameters for beech wood surface treated with a CO2 laser under varied irradiation conditions.
Raster Density
(mm−1)
Basic
Statistic
Character
Roughness and Waviness Parameters at a Laser Power 4% (5.5 W)
Parallel to GrainPerpendicular to Grain
RaRqRzRtRSmWaWtRaRqRzRtRSmWaWt
Control samplesX (μm)4.54965.797830.419745.2636545.60595.551224.71014.60335.880630.839345.9151552.53026.499427.6245
s (μm)1.31201.63818.600914.0625140.64262.39289.39701.31391.64288.574413.9824140.12042.26658.5590
1X (μm)4.97966.437335.502353.6440559.53904.708622.13679.673912.209466.562583.9737323.22485.008823.8685
s (μm)1.25071.57259.197817.8482131.70091.97408.70101.69812.02128.804213.380952.80501.42386.0312
2X (μm)5.42777.109640.911864.2352526.98895.532326.437110.136512.871872.614395.4637326.16136.208128.3190
s (μm)1.44871.918211.595821.4571138.60412.20049.34731.44881.762610.016018.596244.30503.548314.0707
5X (μm)4.83306.235235.177552.4585513.45885.230325.30279.229811.666865.506083.6540321.95556.356528.5832
s (μm)0.91381.22177.568814.8651125.87082.430910.07820.85001.05956.224211.894039.48252.986511.3487
10X (μm)4.93596.401036.453158.3366495.70706.145128.44479.888912.536270.109491.8687318.63307.593131.9064
s (μm)1.13951.42936.882815.6650173.22433.472313.73701.21461.51597.709216.401339.36862.92828.7937
20X (μm)5.07476.551336.069157.0143493.47164.943724.21959.457512.050968.003289.1305323.94375.951727.6879
s (μm)0.93861.26847.607517.5253104.84472.320311.34010.99971.25086.640613.686359.94892.967213.2296
Roughness and Waviness Parameters at a Laser Power 8% (11 W)
Parallel to GrainPerpendicular to Grain
Control samplesX (μm)4.54965.797830.419745.2636545.60595.551224.71014.60335.880630.839345.9151552.53026.499427.6245
s (μm)1.31201.63818.600914.0625140.64262.39289.39701.31391.64288.574413.9824140.12042.26658.5590
1X (μm)5.39287.157640.103063.1345613.996719.5397103.103511.287814.463294.5979122.8864615.135112.715760.6490
s (μm)1.31321.76579.291217.5746153.27117.664638.56860.62570.68715.446111.207963.06804.913121.8079
2X (μm)5.47477.226439.703461.9388691.741212.898161.017910.905314.088596.8490125.9660537.15378.231941.6503
s (μm)1.31901.65288.541317.8350162.04222.857115.35370.61880.78377.986019.788271.27853.596518.0584
5X (μm)12.971916.392087.8005113.44441480.47907.802538.789317.278821.9749132.2750160.9634470.90237.265437.4707
s (μm)2.81083.488016.914022.0761312.20462.942813.51921.35581.72849.351416.174853.03411.96889.7301
10X (μm)20.931226.4281136.8417177.79061373.95385.872028.067329.245437.0261206.4389242.6351599.61464.310620.9916
s (μm)4.17985.108526.215533.4356309.75692.15849.06501.37161.619310.700720.048858.10021.64016.2576
20X (μm)41.142549.8178234.6079290.35041082.21146.625730.457652.613964.8661320.3636370.2030622.10555.386526.2205
s (μm)5.54786.753037.922056.2926184.95192.530510.09836.88498.408635.056841.7977107.99722.16419.3673
Table 5. The final values of surface free energy and the disperse and polar components of this energy for beech wood treated under specified CO2 laser irradiation modes.
Surface Free Energy, Disperse and Polar ComponentRaster Density (mm−1)
01251020
Power 4%
Υ (mJ m−2)91.988.0791.5987.4267.265.58
Υd (mJ m−2)49.4744.3347.8647.7447.0348.67
Υp (mJ m−2) 42.4343.7443.7339.6820.1716.91
Power 8%
Υ (mJ m−2)92.2985.5382.6187.6293.7696.2
Υd (mJ m−2)49.444.0442.444.5148.1550.12
Υp (mJ m−2)42.8941.4940.2143.1145.6146.08

