
Predictive Modeling of Phenotypic Antimicrobial Susceptibility of Selected Beta-Lactam Antimicrobials from Beta-Lactamase Resistance Genes

 , , ,
, , ,
Abstract
1. Introduction
2. Results
2.1. Prediction of MIC: Human Dataset from ATLAS
2.1.1. Cefepime
2.1.2. Ceftazidime
2.1.3. Ceftaroline
2.1.4. Imipenem
2.1.5. Meropenem
2.2. Prediction of MIC: Retail Meat Dataset from NARMS
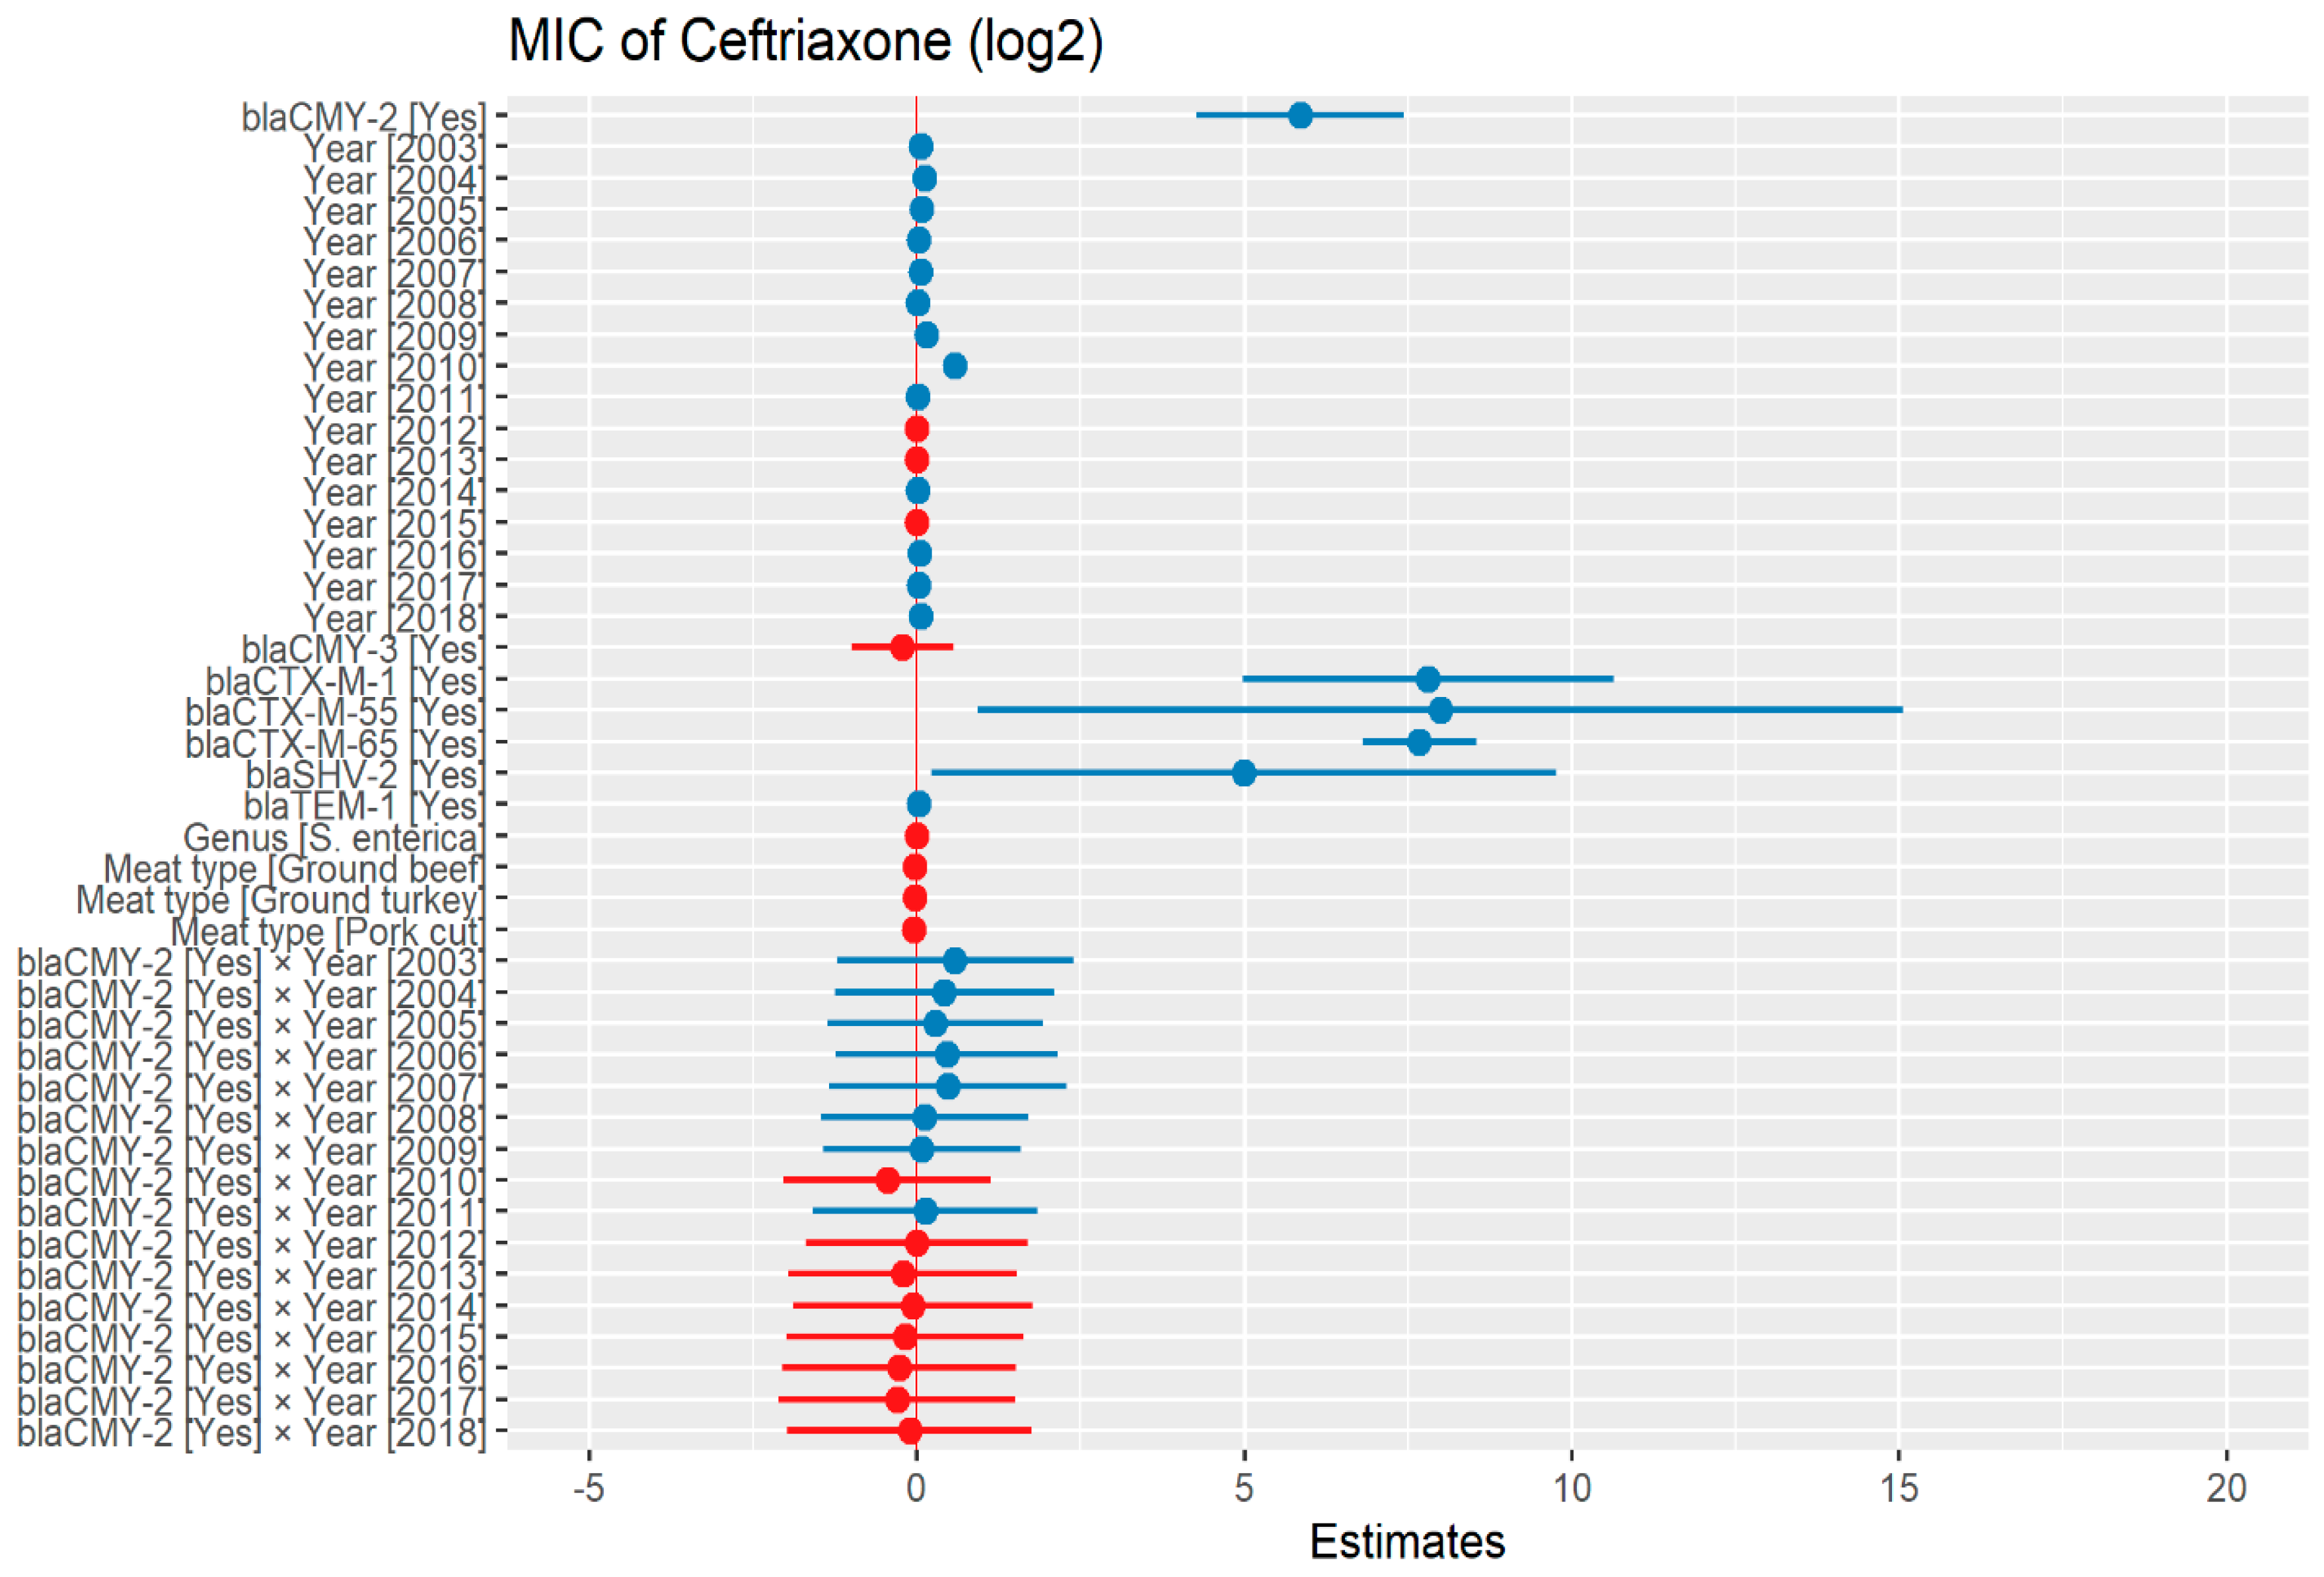
2.2.1. Ceftriaxone
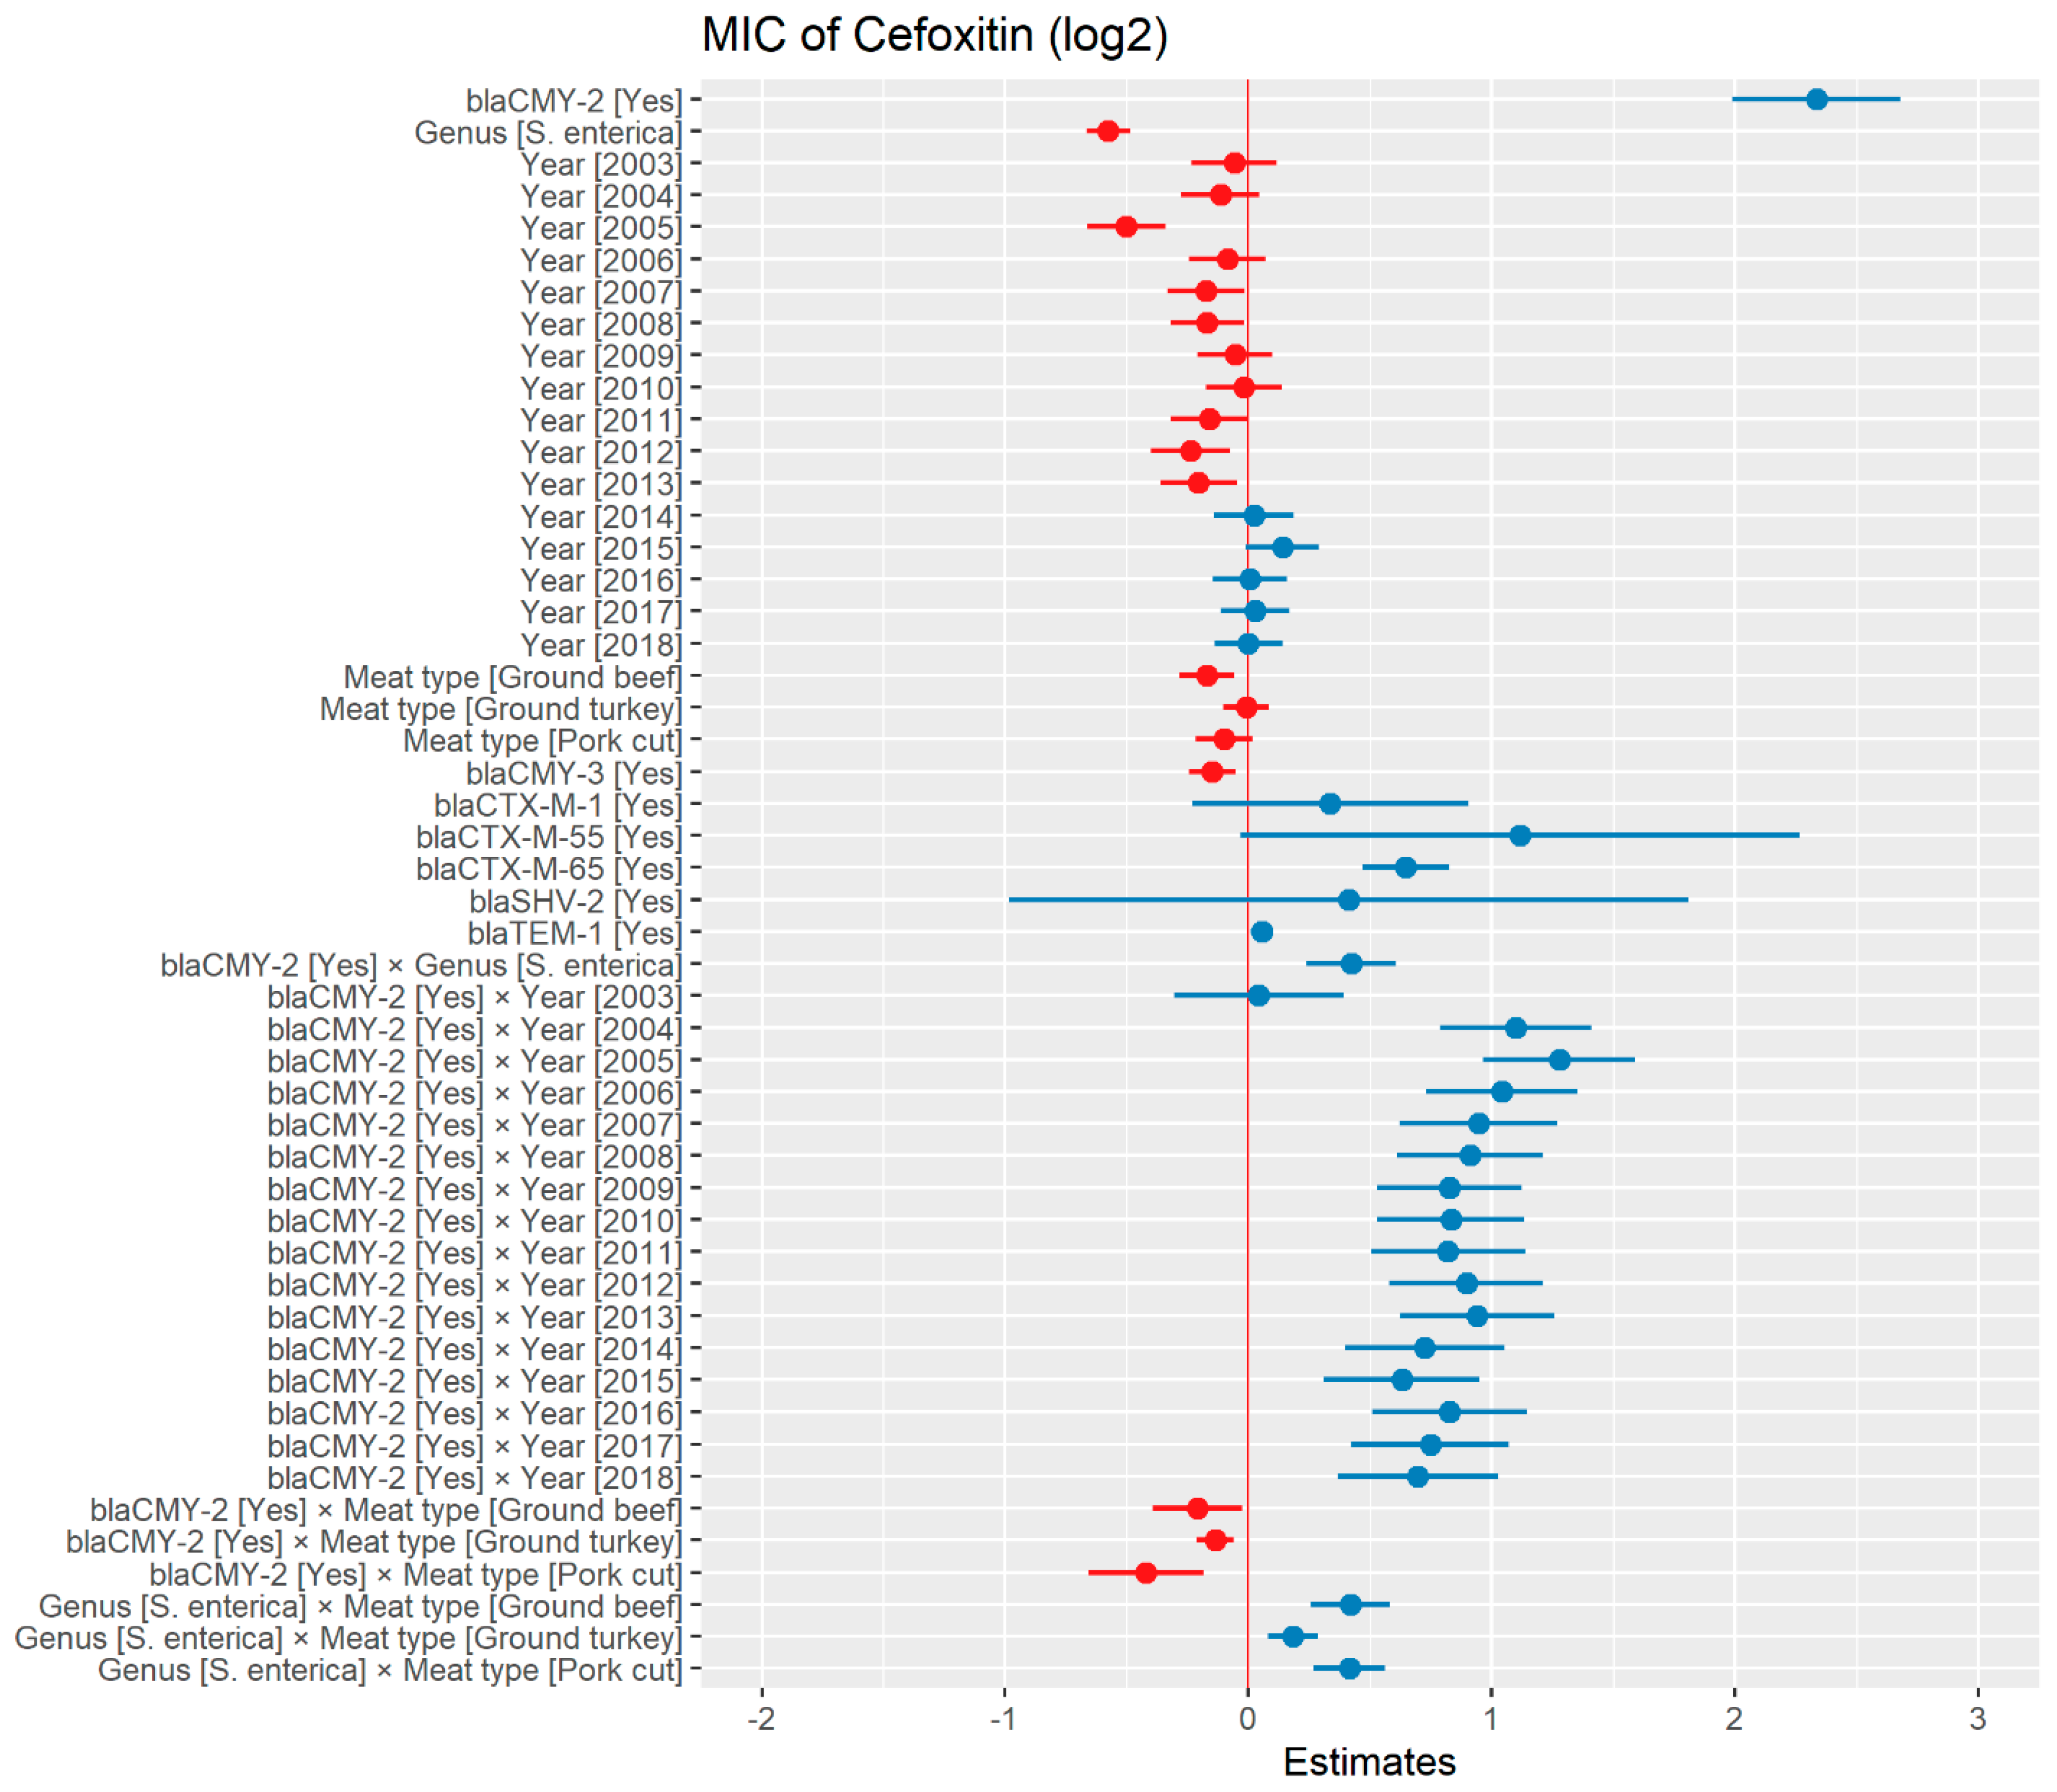
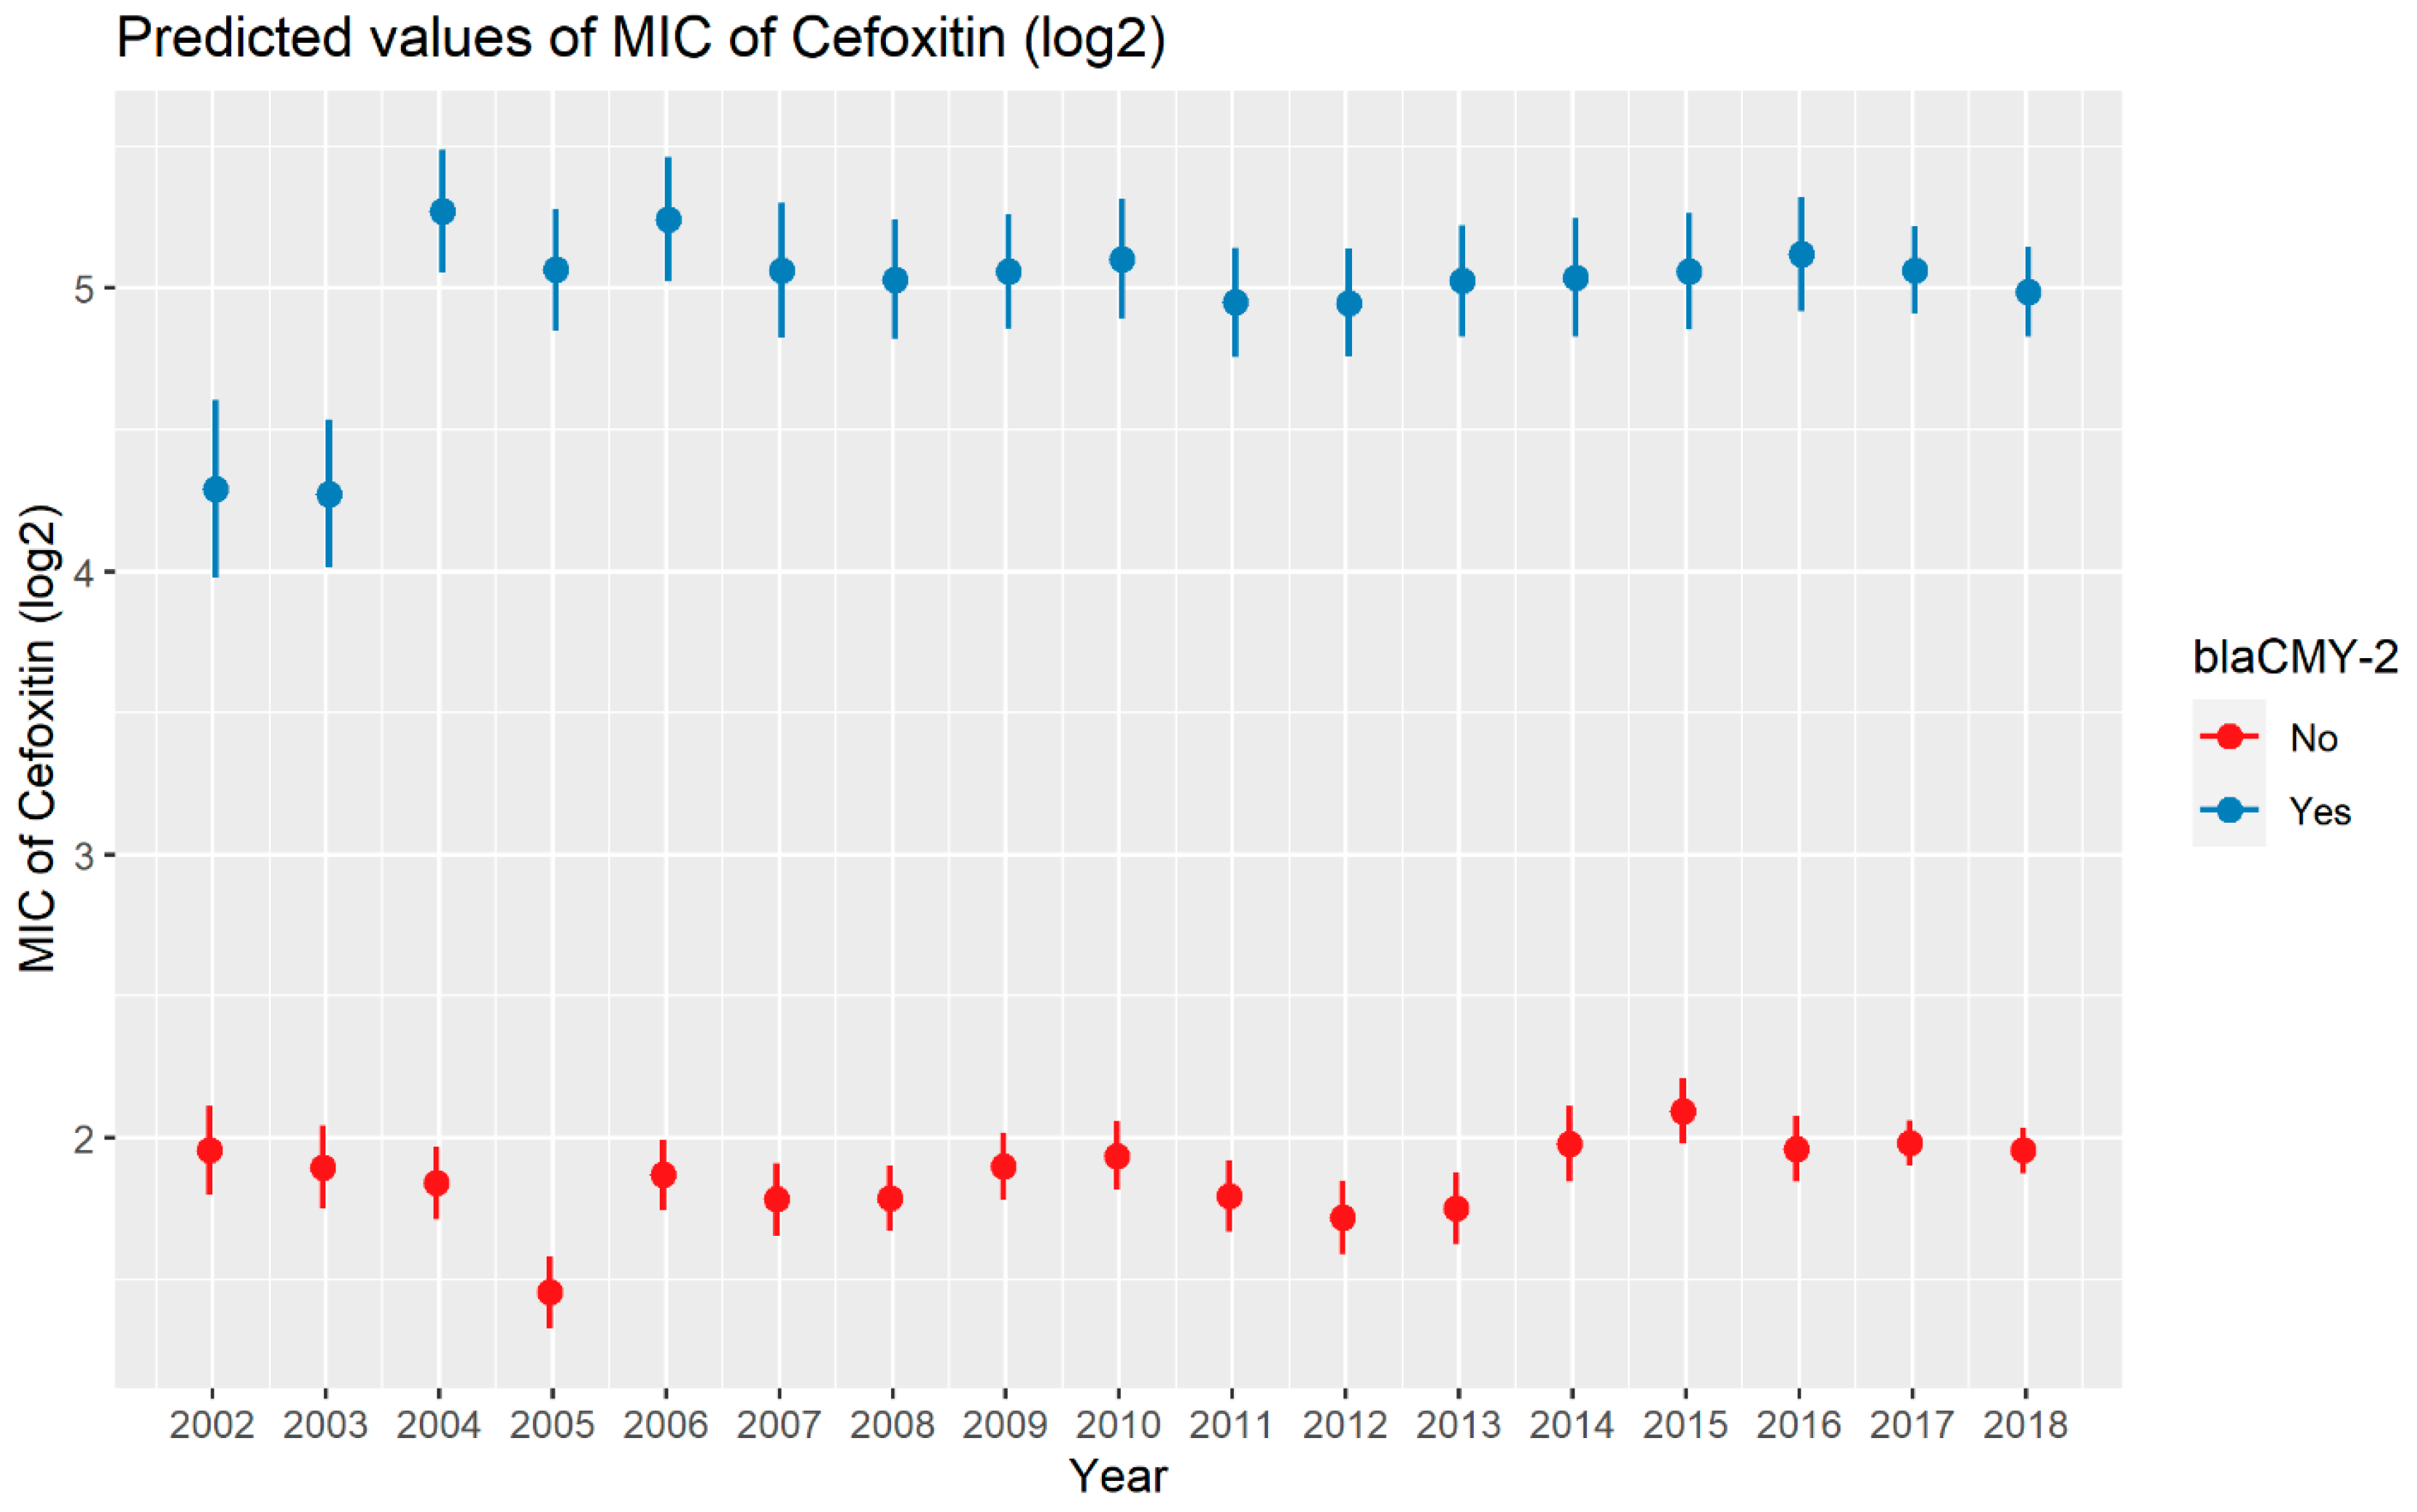
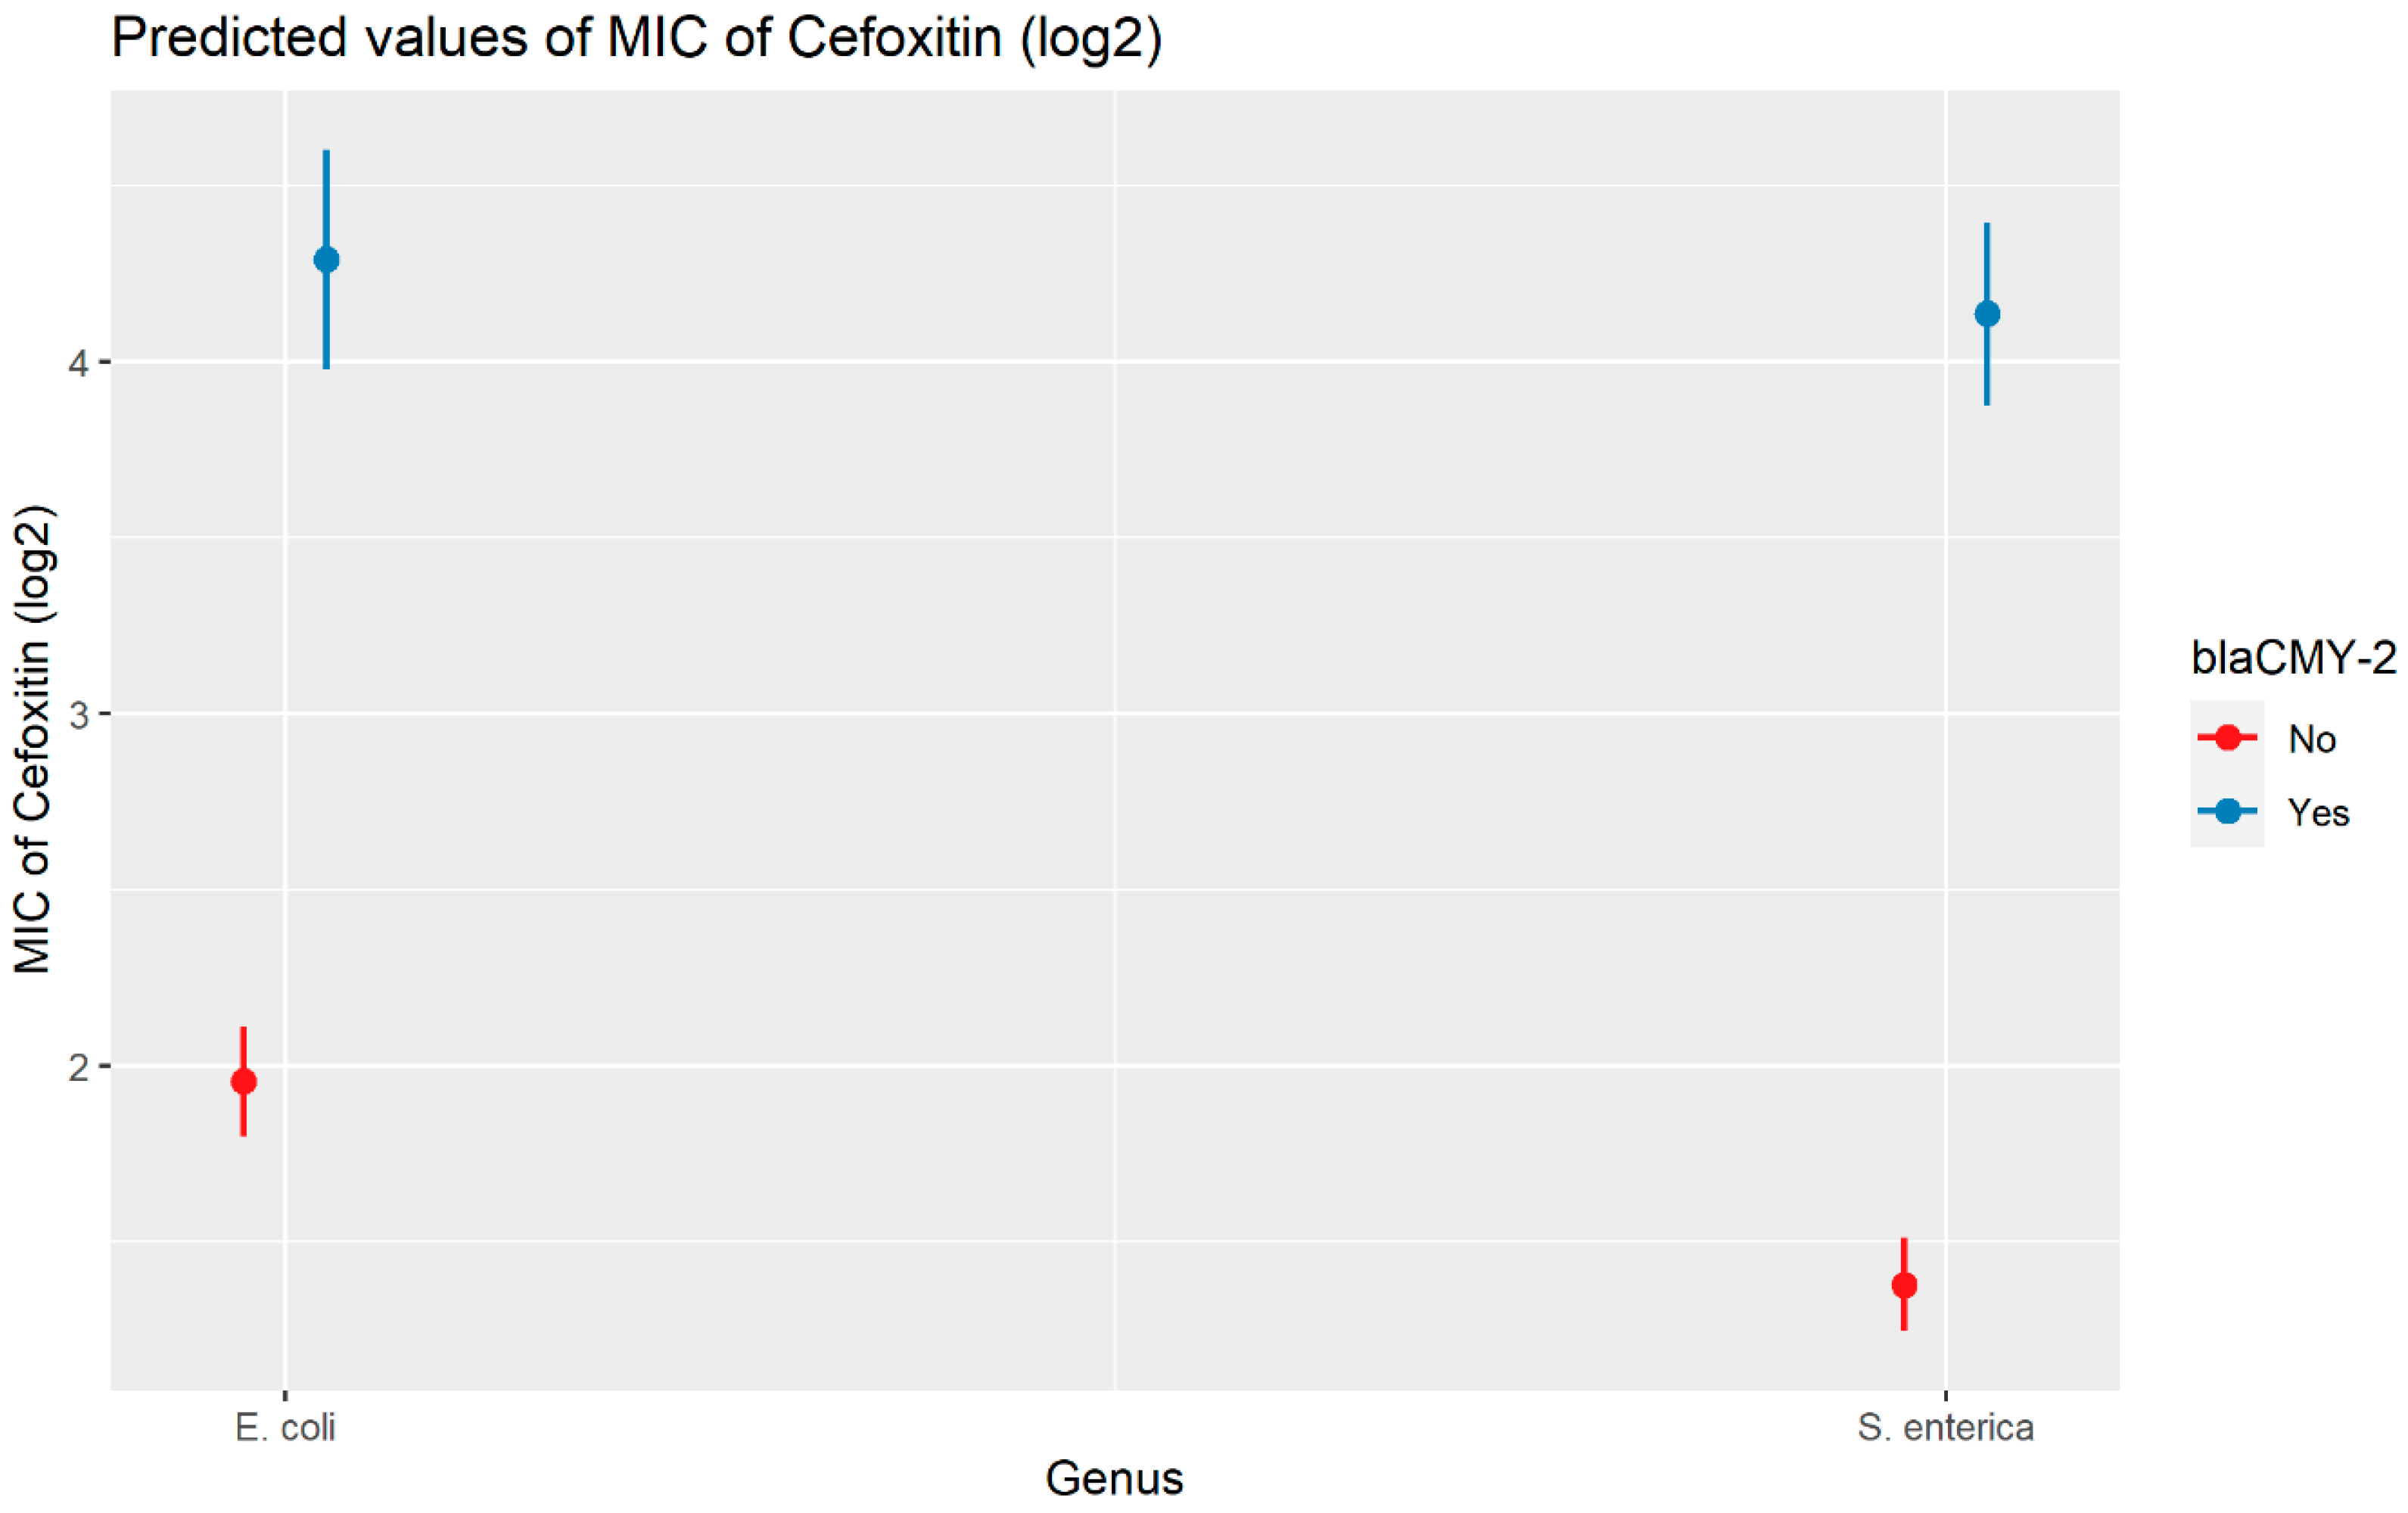
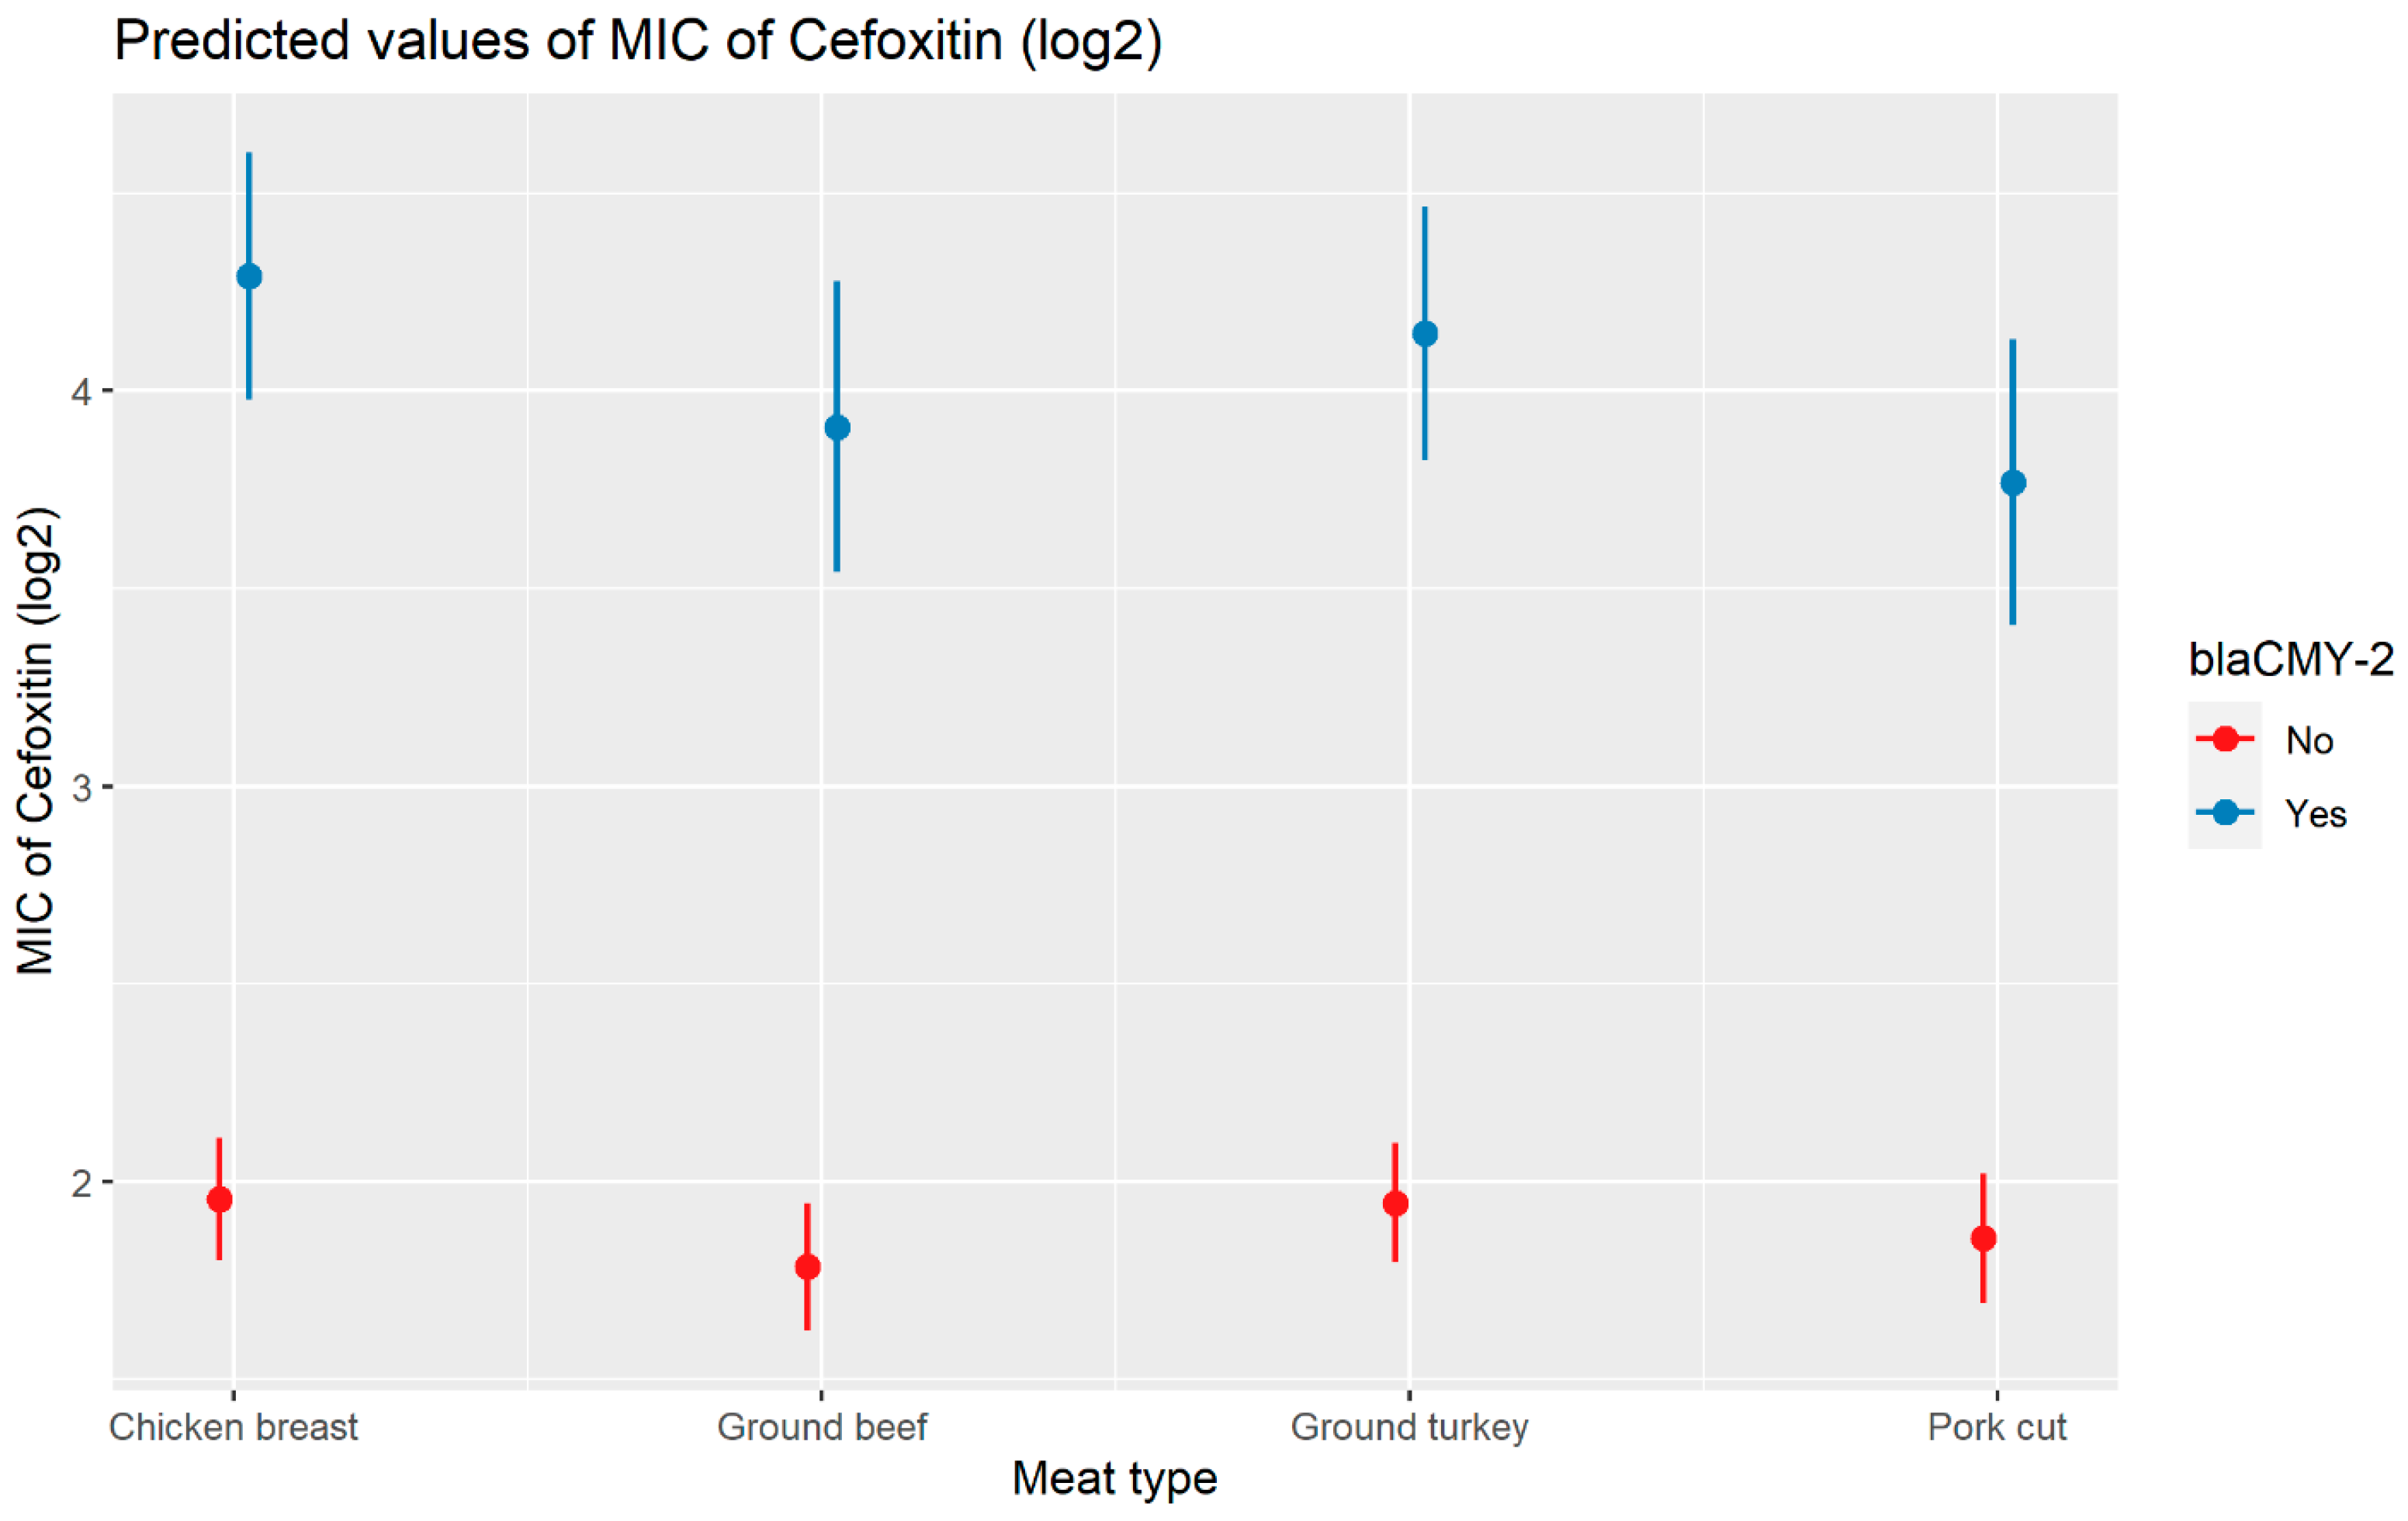
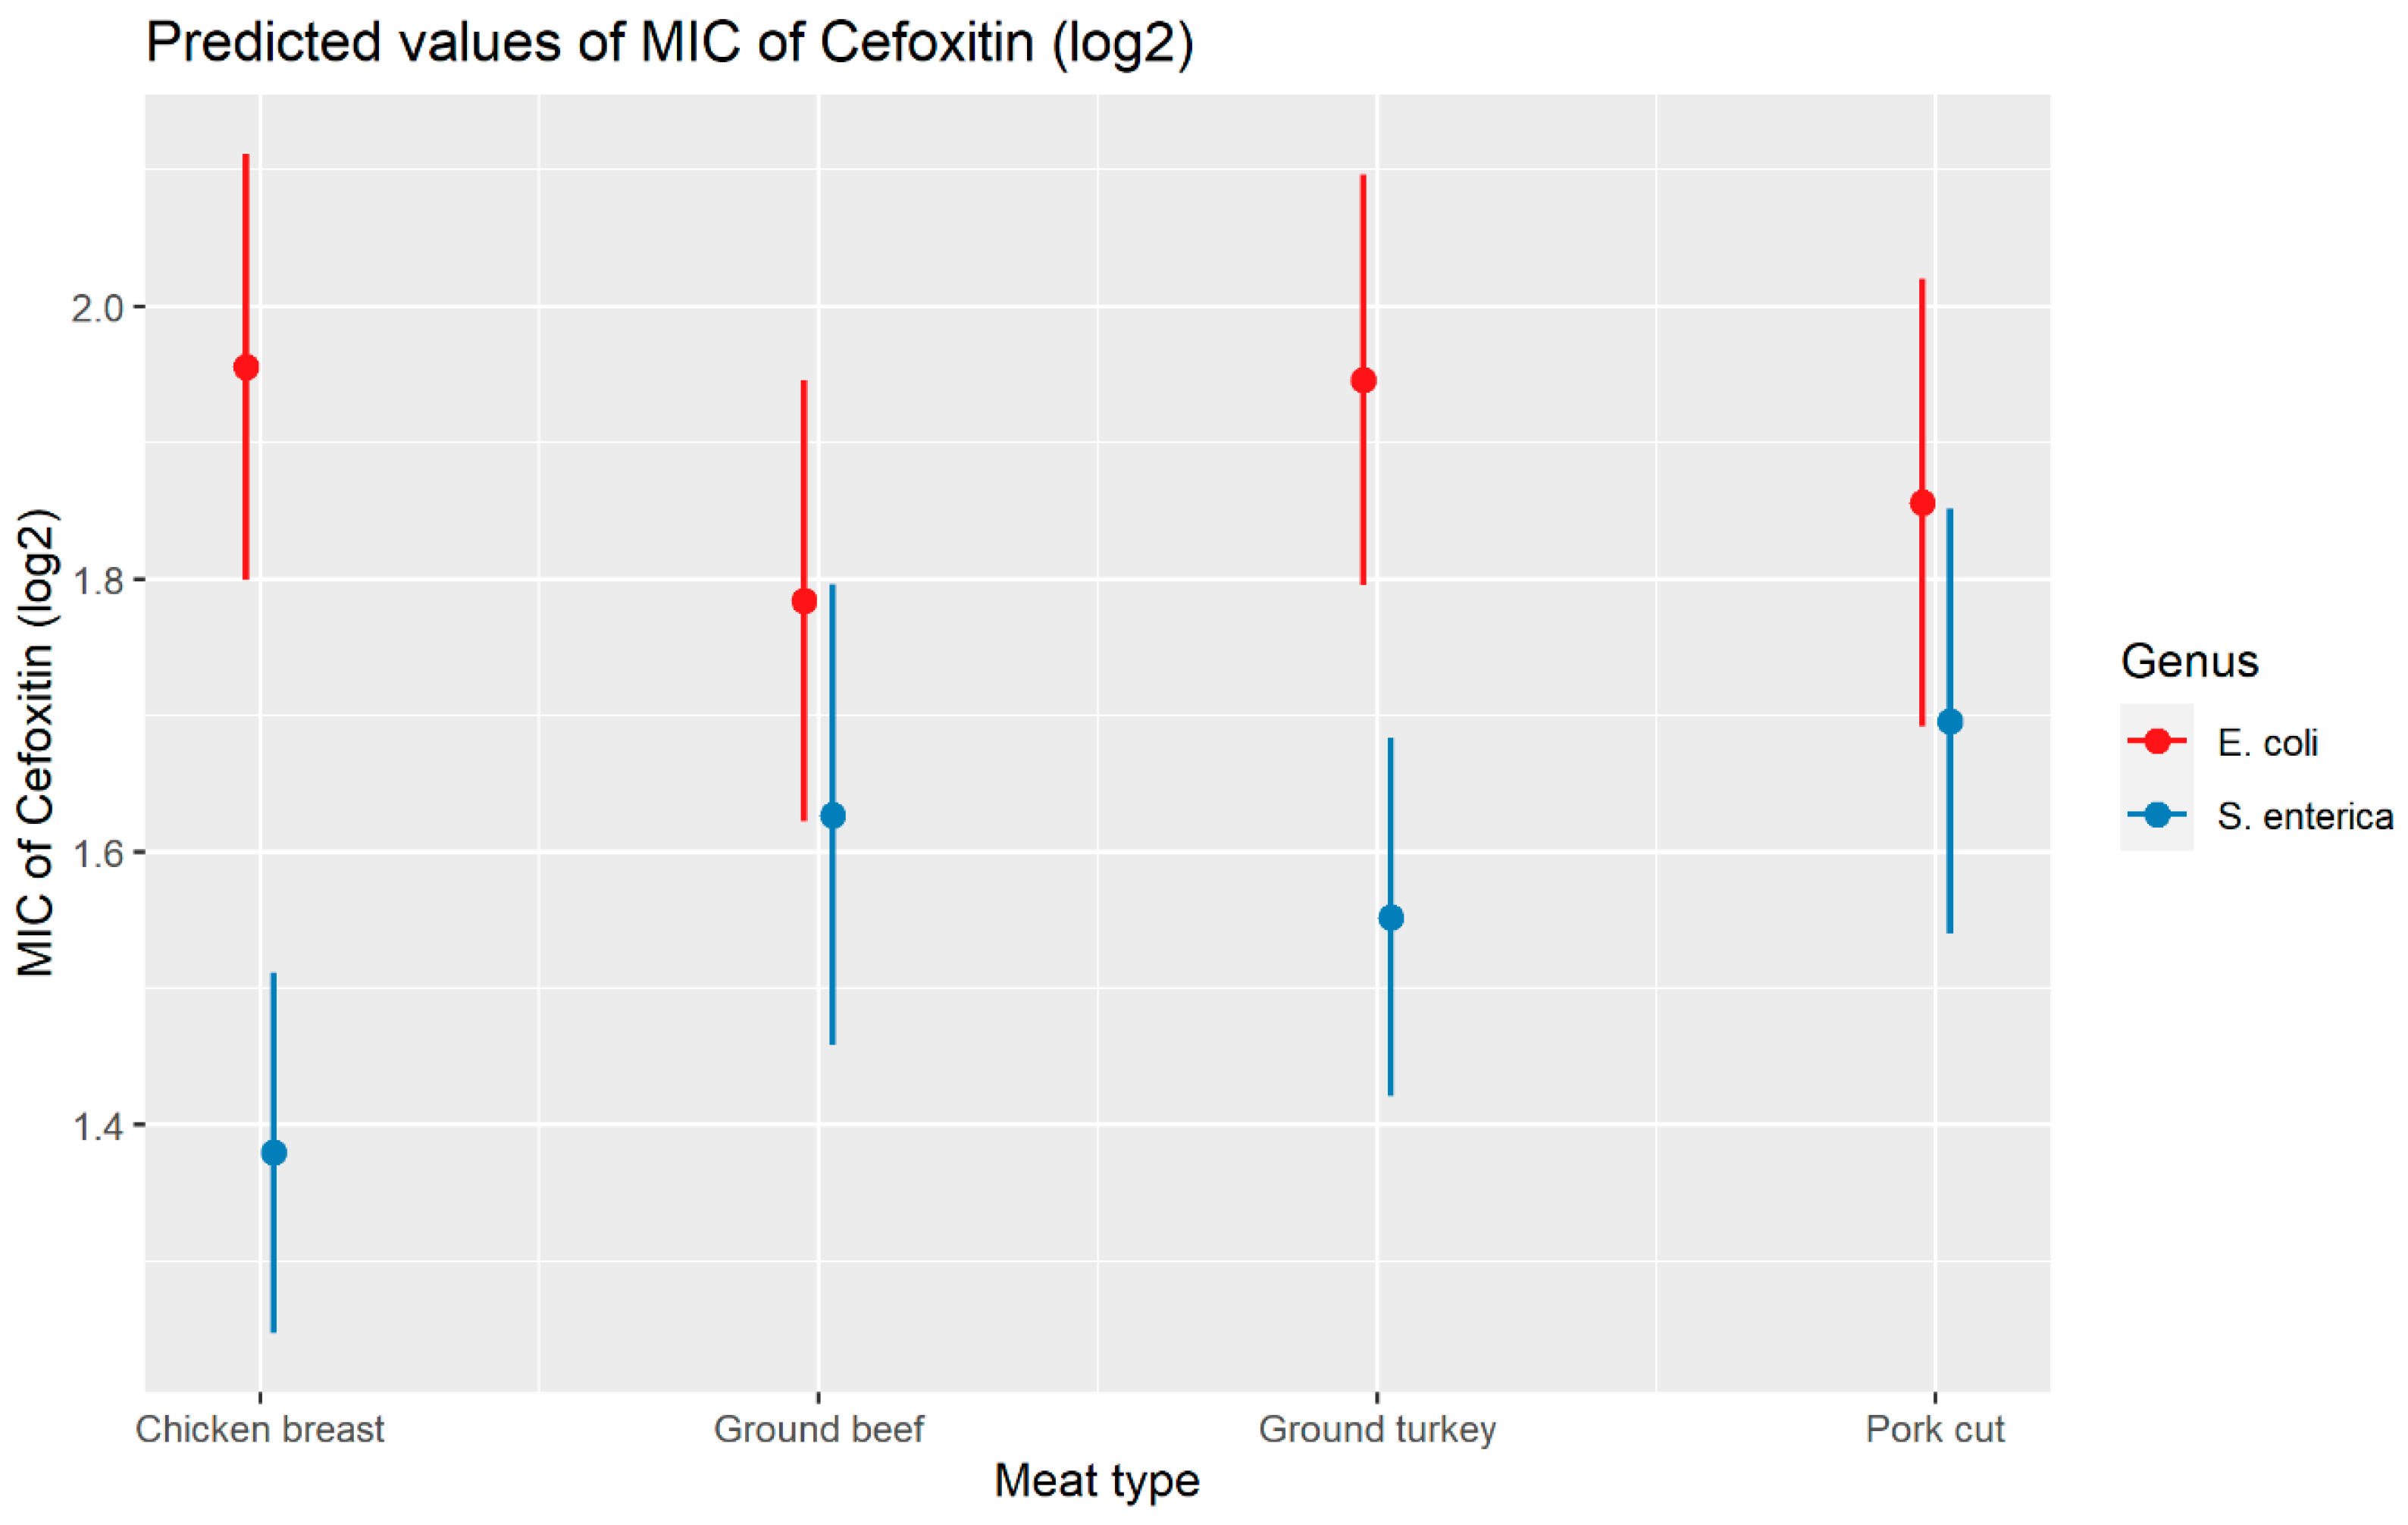
2.2.2. Cefoxitin
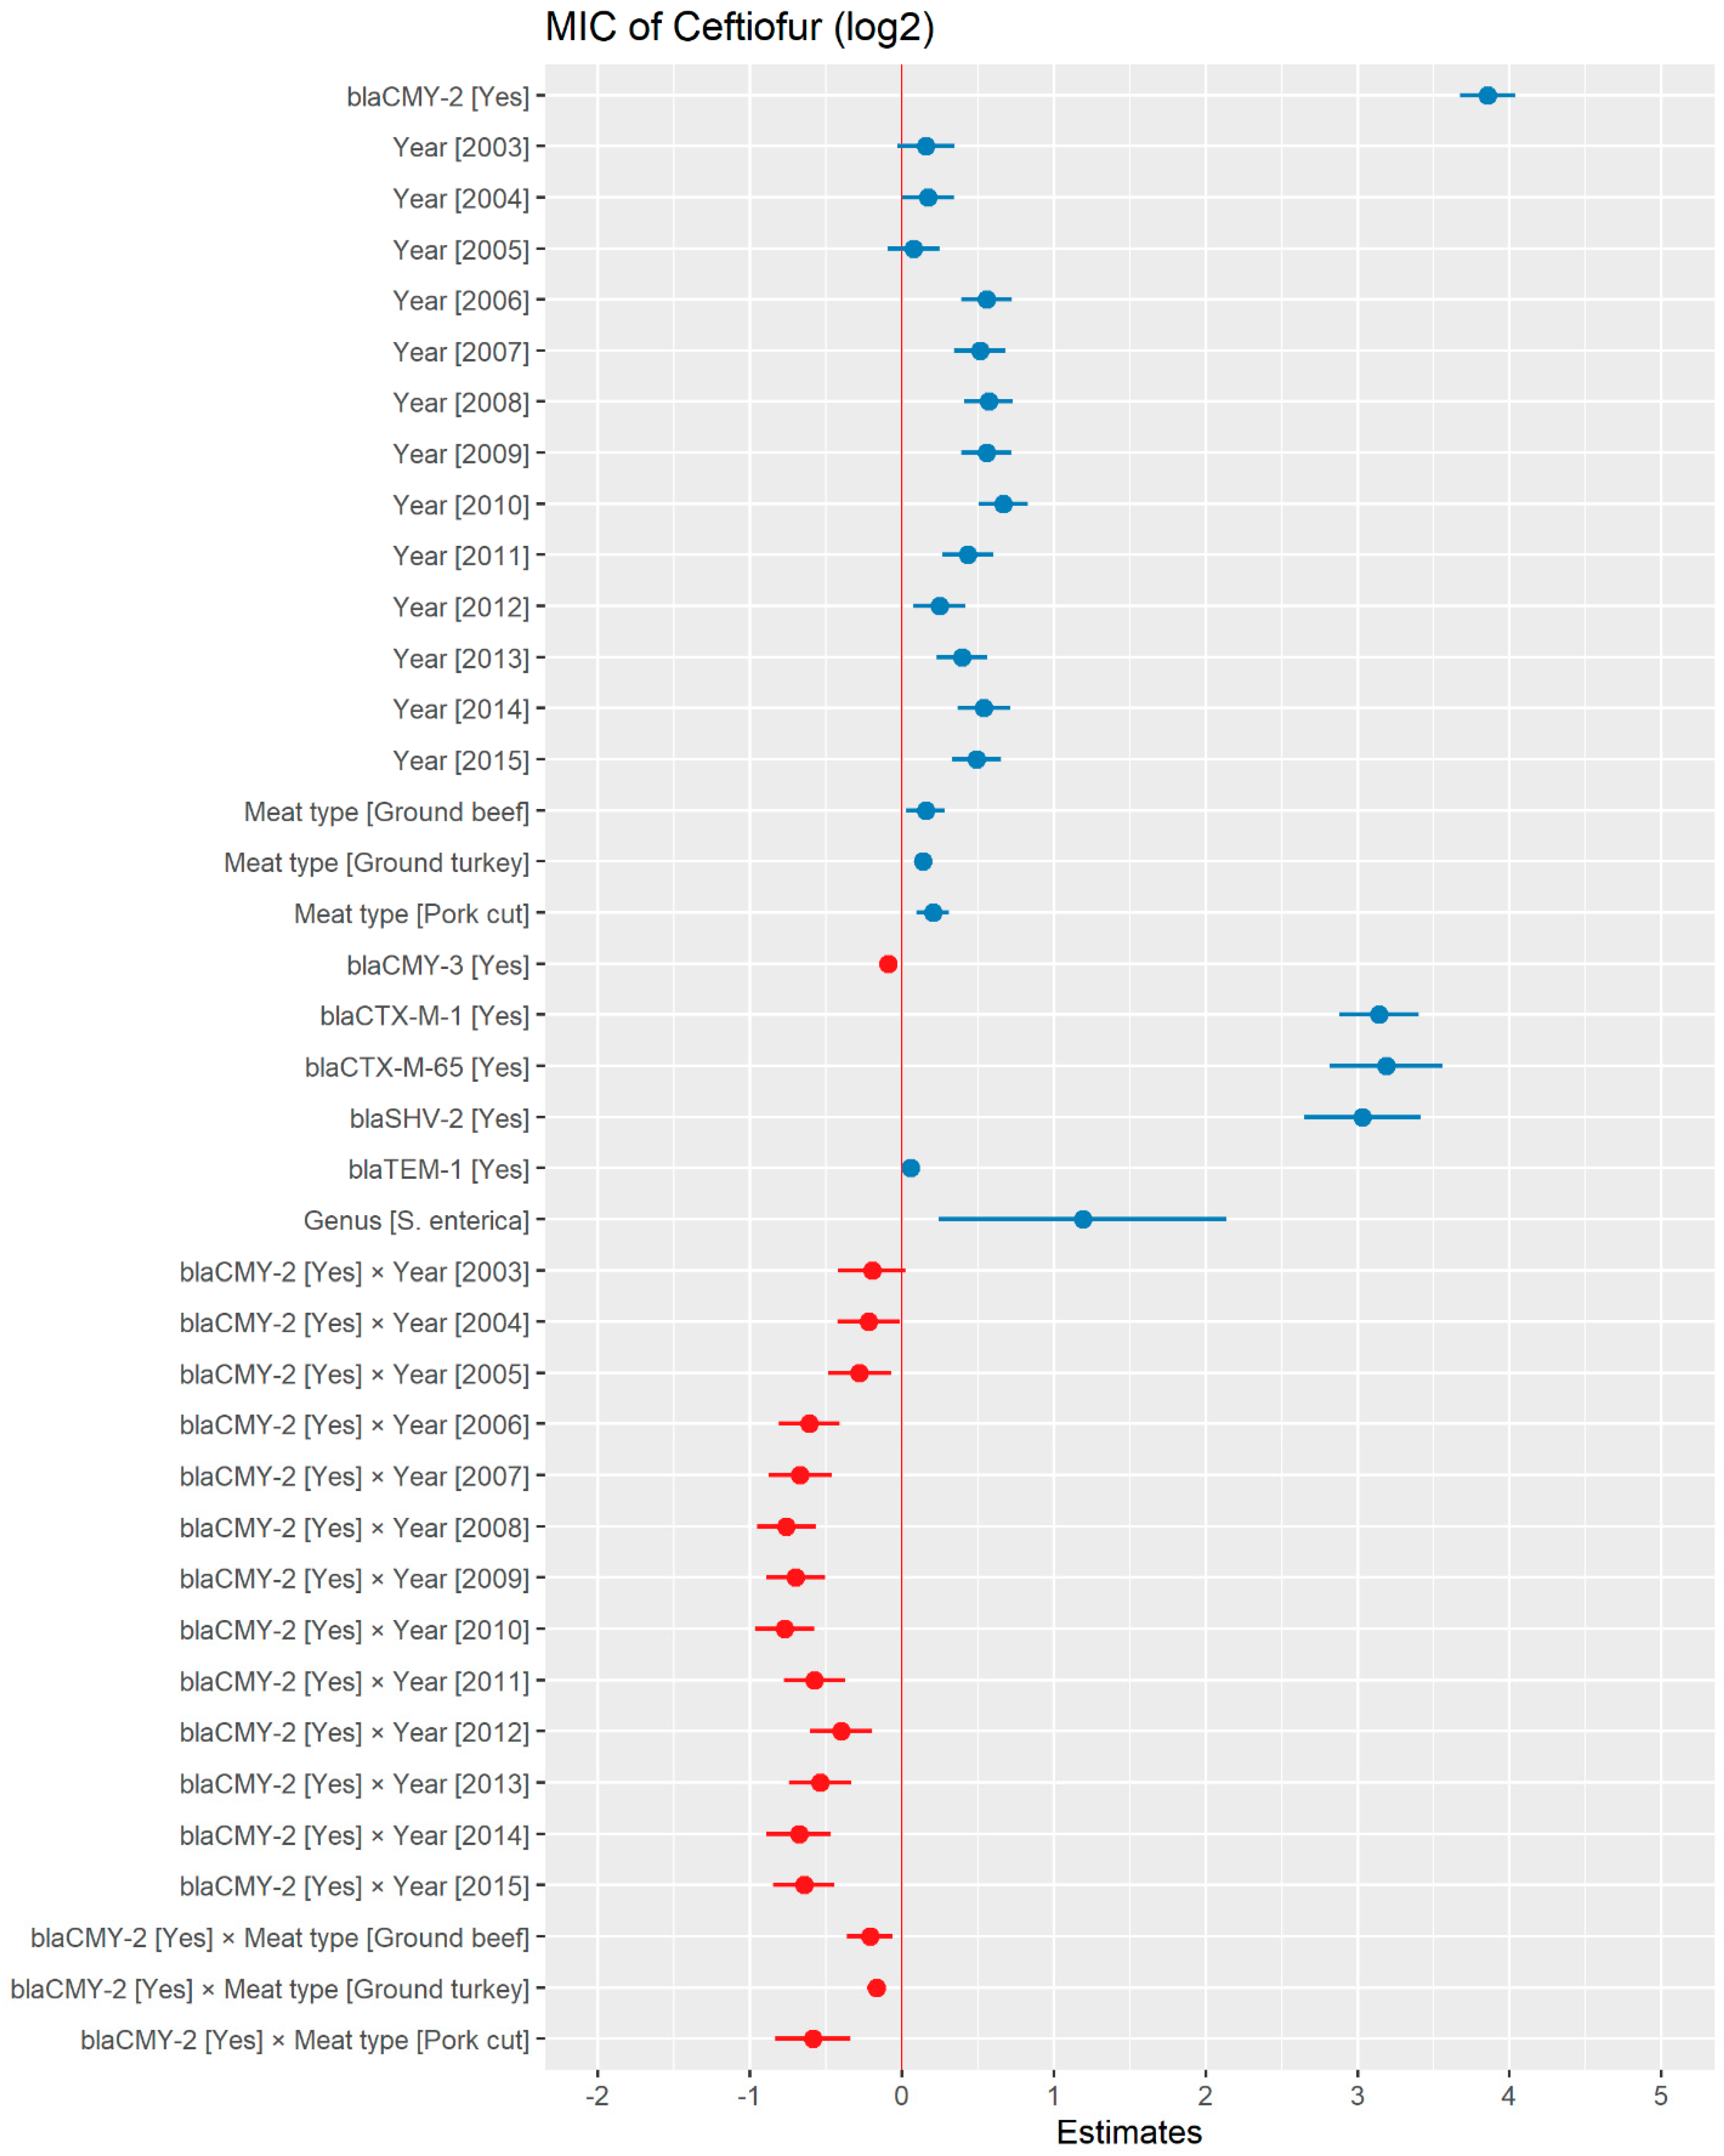
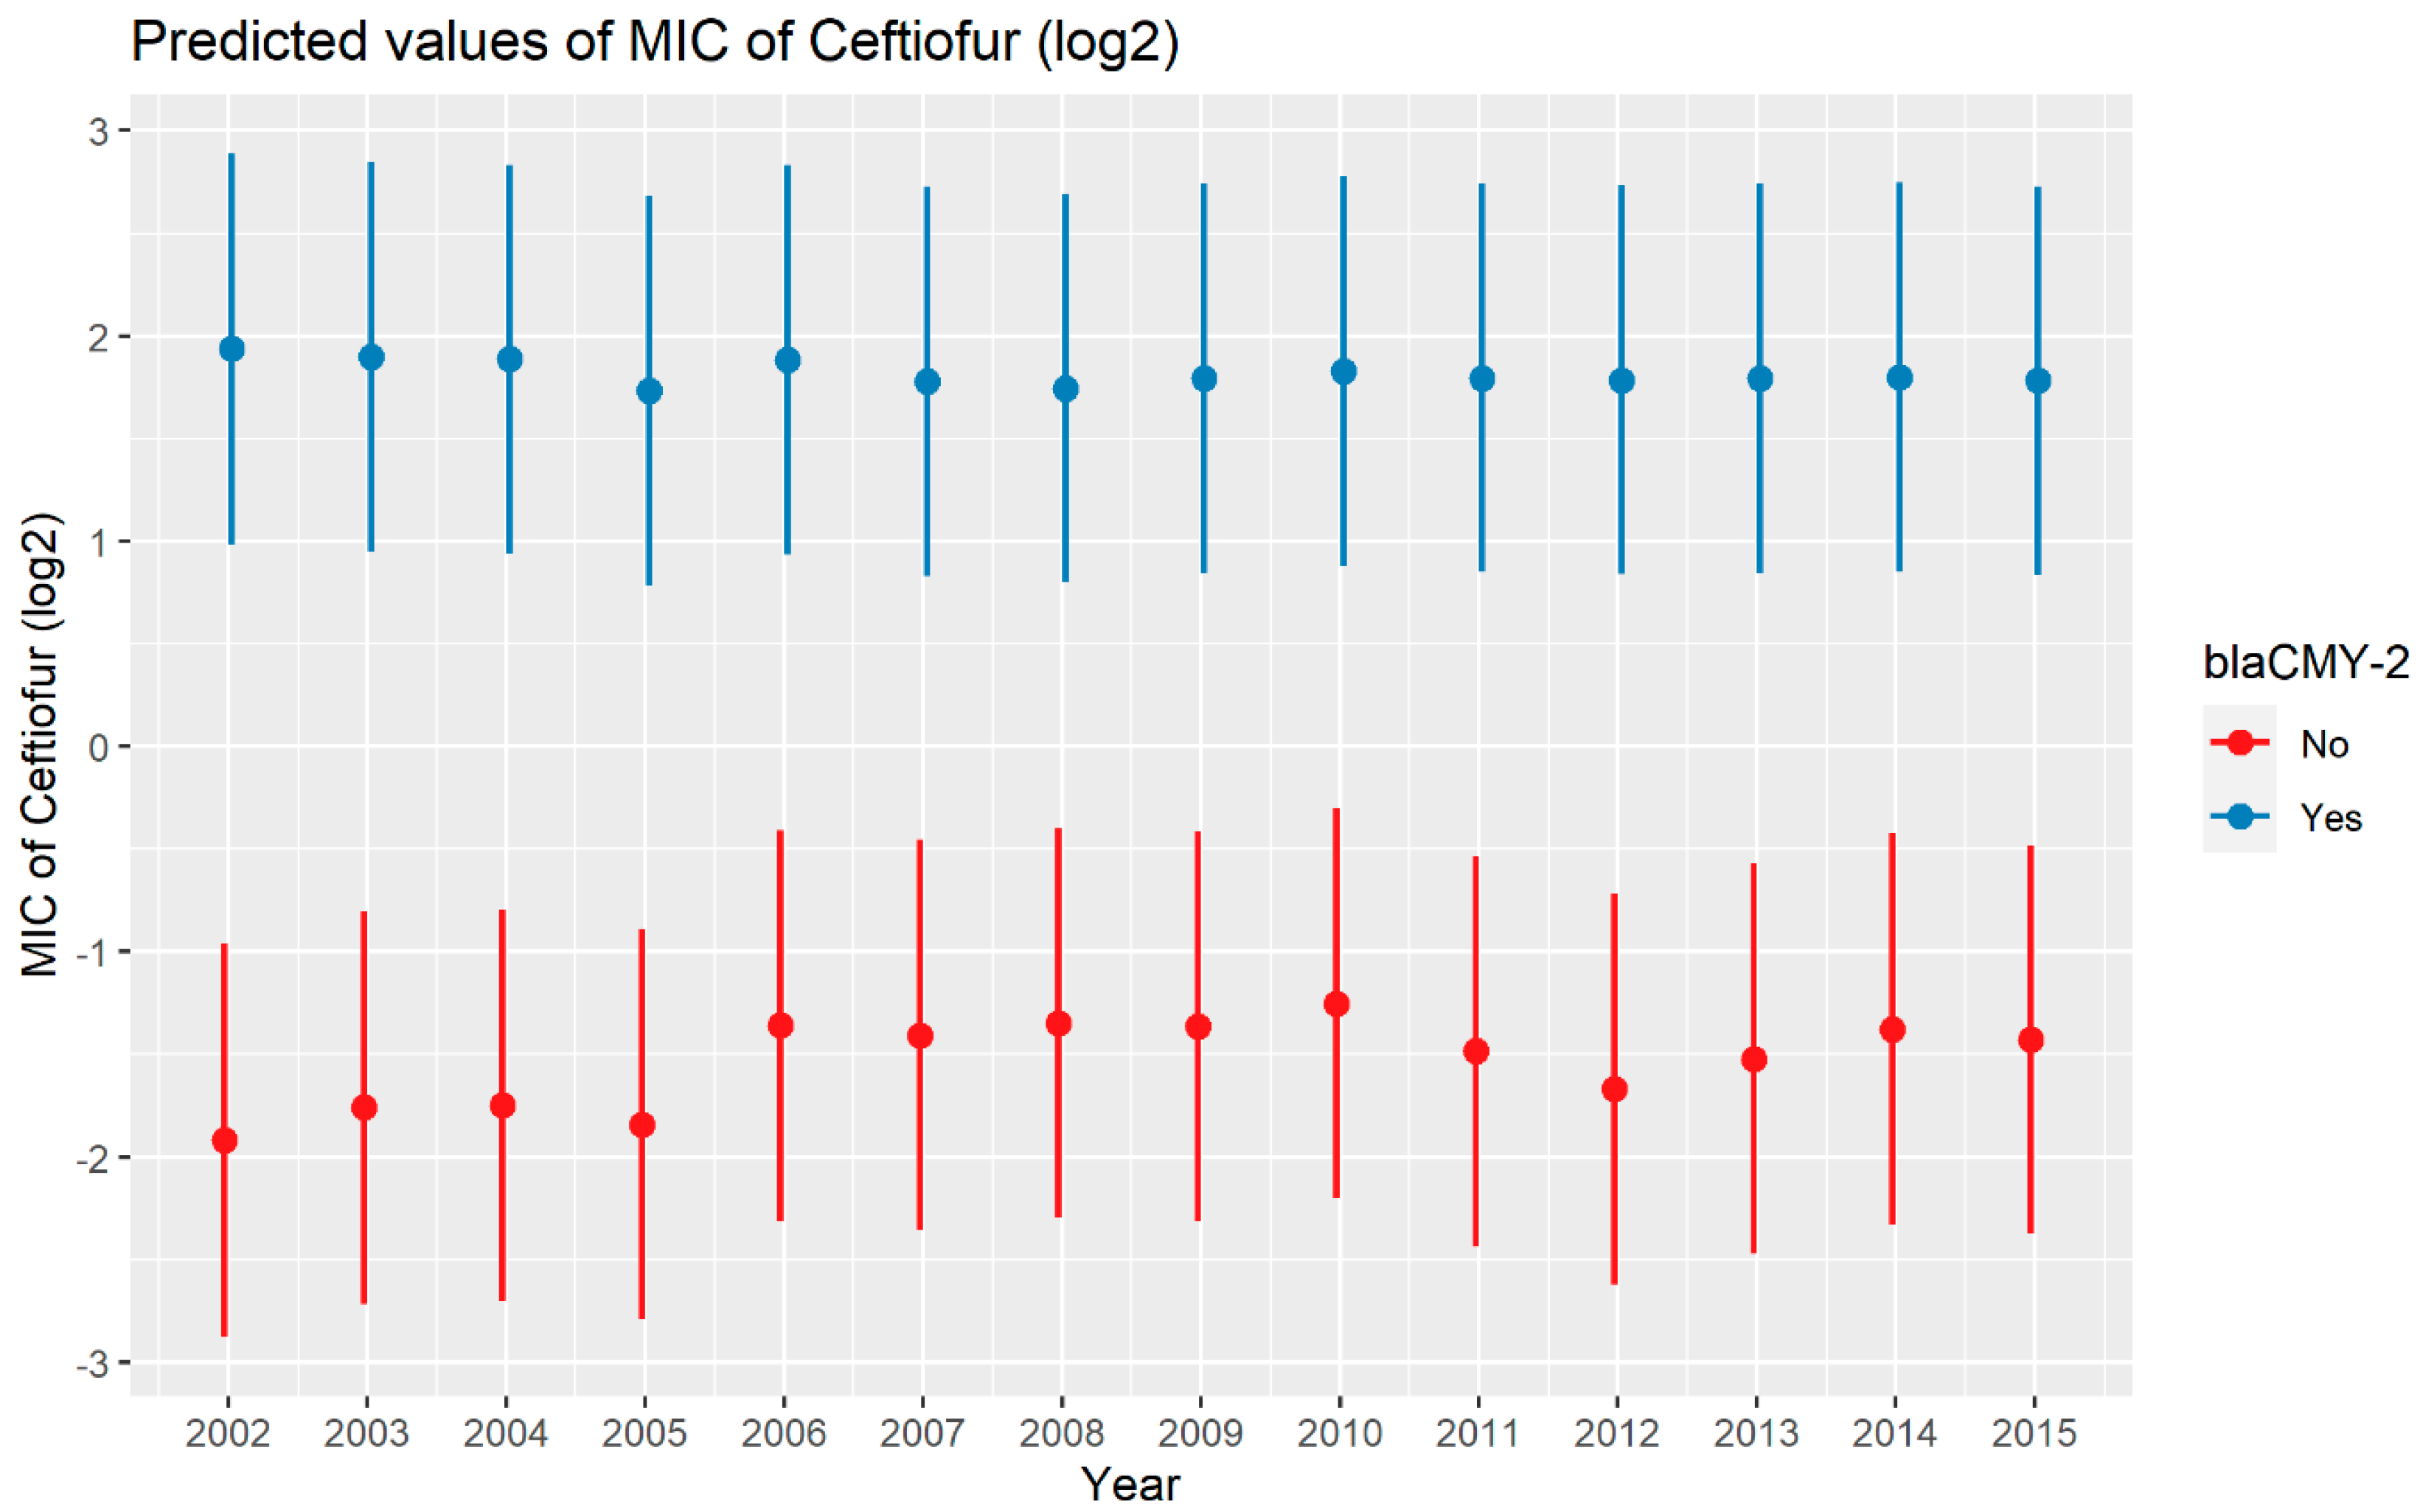
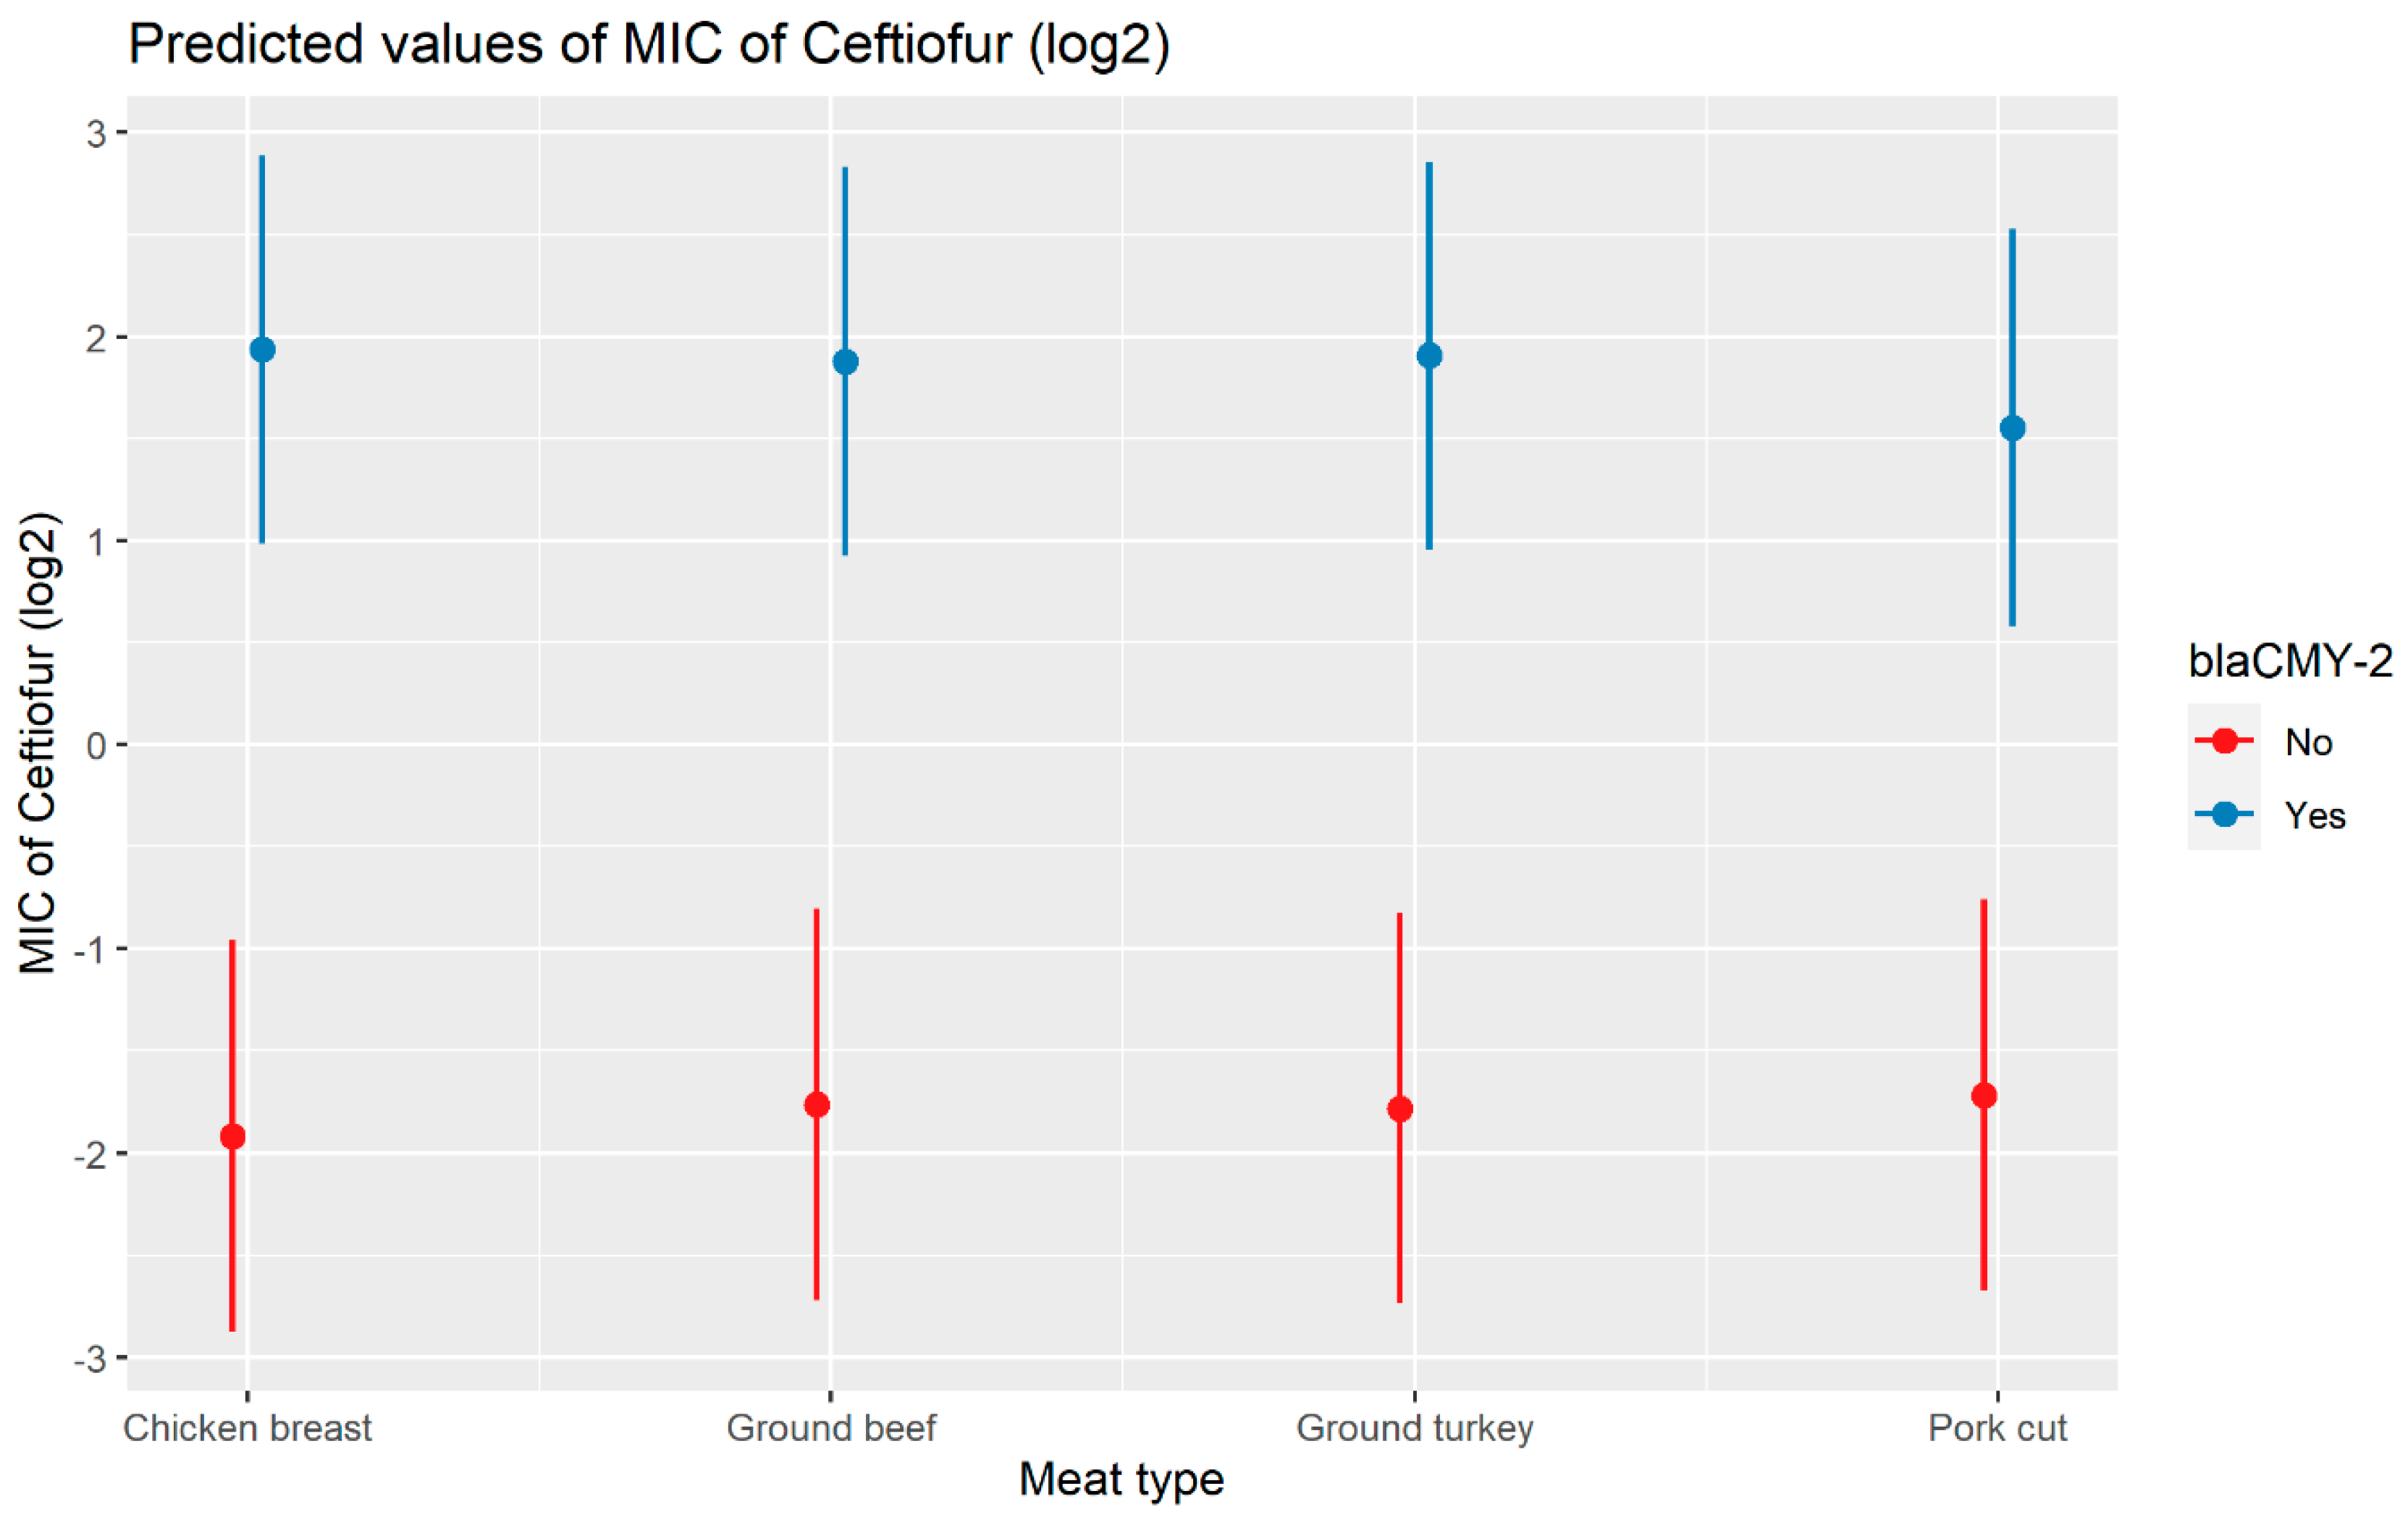
2.2.3. Ceftiofur
3. Discussion
4. Materials and Methods
4.1. Data Collection
4.2. Data Analysis
5. Conclusions
Supplementary Materials
Author Contributions
Funding
Institutional Review Board Statement
Informed Consent Statement
Data Availability Statement
Acknowledgments
Conflicts of Interest
References
- Murray, C.J.; Ikuta, K.S.; Sharara, F.; Swetschinski, L.; Aguilar, G.R.; Gray, A.; Han, C.; Bisignano, C.; Rao, P.; Wool, E. Global burden of bacterial antimicrobial resistance in 2019: A systematic analysis. Lancet 2022, 399, 629–655. [Google Scholar] [CrossRef]
- Kolář, M.; Urbanek, K.; Látal, T. Antibiotic selective pressure and development of bacterial resistance. Int. J. Antimicrob. Agents 2001, 17, 357–363. [Google Scholar] [CrossRef]
- Hughes, D.; Andersson, D.I. Evolutionary trajectories to antibiotic resistance. Annu. Rev. Microbiol. 2017, 71, 579–596. [Google Scholar] [CrossRef]
- CDC. Antibiotic Resistance Threats in the United States. Available online: www.cdc.gov/DrugResistance/Biggest-Threats.html (accessed on 26 December 2022).
- Dadgostar, P. Antimicrobial Resistance: Implications and Costs. Infect. Drug Resist. 2019, 12, 3903–3910. [Google Scholar] [CrossRef]
- Tang, K.W.K.; Millar, B.C.; Moore, J.E. Antimicrobial Resistance (AMR). Br. J. Biomed. Sci. 2023, 80, 11387. [Google Scholar] [CrossRef]
- Chatterjee, A.; Modarai, M.; Naylor, N.R.; Boyd, S.E.; Atun, R.; Barlow, J.; Holmes, A.H.; Johnson, A.; Robotham, J.V. Quantifying drivers of antibiotic resistance in humans: A systematic review. Lancet Infect. Dis. 2018, 18, e368–e378. [Google Scholar] [CrossRef]
- Holmes, A.H.; Moore, L.S.; Sundsfjord, A.; Steinbakk, M.; Regmi, S.; Karkey, A.; Guerin, P.J.; Piddock, L.J. Understanding the mechanisms and drivers of antimicrobial resistance. Lancet 2016, 387, 176–187. [Google Scholar] [CrossRef]
- Collignon, P.C.; Conly, J.M.; Andremont, A.; McEwen, S.A.; Aidara-Kane, A.; Agerso, Y.; Andremont, A.; Collignon, P.; Conly, J.; Ninh, T.D.; et al. World Health Organization Ranking of Antimicrobials According to Their Importance in Human Medicine: A Critical Step for Developing Risk Management Strategies to Control Antimicrobial Resistance From Food Animal Production. Clin. Infect. Dis. 2016, 63, 1087–1093. [Google Scholar] [CrossRef]
- World Health Organization (WHO). Critically Important Antimicrobials for Human Medicine: 6th Revision. Available online: https://www.who.int/publications/i/item/9789241515528 (accessed on 14 January 2023).
- World Health Organization (WHO). Global Action Plan on Antimicrobial Resistance. Available online: https://iris.who.int/bitstream/handle/10665/193736/9789241509763_eng.pdf (accessed on 14 January 2023).
- Ferrer, R.; Martin-Loeches, I.; Phillips, G.; Osborn, T.M.; Townsend, S.; Dellinger, R.P.; Artigas, A.; Schorr, C.; Levy, M.M. Empiric antibiotic treatment reduces mortality in severe sepsis and septic shock from the first hour: Results from a guideline-based performance improvement program. Crit. Care Med. 2014, 42, 1749–1755. [Google Scholar] [CrossRef] [PubMed]
- Suaifan, G.A.; Alhogail, S.; Zourob, M. Rapid and low-cost biosensor for the detection of Staphylococcus aureus. Biosens. Bioelectron. 2017, 90, 230–237. [Google Scholar] [CrossRef] [PubMed]
- Dubourg, G.; Lamy, B.; Ruimy, R. Rapid phenotypic methods to improve the diagnosis of bacterial bloodstream infections: Meeting the challenge to reduce the time to result. Clin. Microbiol. Infect. 2018, 24, 935–943. [Google Scholar] [CrossRef]
- Ziyaina, M.; Rasco, B.; Sablani, S.S. Rapid methods of microbial detection in dairy products. Food Control. 2020, 110, 107008. [Google Scholar] [CrossRef]
- Goto, M.; Al-Hasan, M. Overall burden of bloodstream infection and nosocomial bloodstream infection in North America and Europe. Clin. Microbiol. Infect. 2013, 19, 501–509. [Google Scholar] [CrossRef]
- Laxminarayan, R.; Matsoso, P.; Pant, S.; Brower, C.; Røttingen, J.-A.; Klugman, K.; Davies, S. Access to effective antimicrobials: A worldwide challenge. Lancet 2016, 387, 168–175. [Google Scholar] [CrossRef]
- Banerjee, R.; Patel, R. Molecular diagnostics for genotypic detection of antibiotic resistance: Current landscape and future directions. JAC Antimicrob. Resist. 2023, 5, dlad018. [Google Scholar] [CrossRef]
- Davis, J.J.; Boisvert, S.; Brettin, T.; Kenyon, R.W.; Mao, C.; Olson, R.; Overbeek, R.; Santerre, J.; Shukla, M.; Wattam, A.R. Antimicrobial resistance prediction in PATRIC and RAST. Sci. Rep. 2016, 6, 27930. [Google Scholar] [CrossRef]
- Bortolaia, V.; Kaas, R.S.; Ruppe, E.; Roberts, M.C.; Schwarz, S.; Cattoir, V.; Philippon, A.; Allesoe, R.L.; Rebelo, A.R.; Florensa, A.F.; et al. ResFinder 4.0 for predictions of phenotypes from genotypes. J. Antimicrob. Chemother. 2020, 75, 3491–3500. [Google Scholar] [CrossRef] [PubMed]
- Macesic, N.; Bear Don’t Walk IV, O.J.; Pe’er, I.; Tatonetti, N.P.; Peleg, A.Y.; Uhlemann, A.-C. Predicting phenotypic polymyxin resistance in Klebsiella pneumoniae through machine learning analysis of genomic data. Msystems 2020, 5, 10–1128. [Google Scholar] [CrossRef]
- Avershina, E.; Sharma, P.; Taxt, A.M.; Singh, H.; Frye, S.A.; Paul, K.; Kapil, A.; Naseer, U.; Kaur, P.; Ahmad, R. AMR-Diag: Neural network based genotype-to-phenotype prediction of resistance towards β-lactams in Escherichia coli and Klebsiella pneumoniae. Comput. Struct. Biotechnol. J. 2021, 19, 1896–1906. [Google Scholar] [CrossRef] [PubMed]
- Kowalska-Krochmal, B.; Dudek-Wicher, R. The minimum inhibitory concentration of antibiotics: Methods, interpretation, clinical relevance. Pathogens 2021, 10, 165. [Google Scholar] [CrossRef] [PubMed]
- Kaprou, G.D.; Bergšpica, I.; Alexa, E.A.; Alvarez-Ordóñez, A.; Prieto, M. Rapid methods for antimicrobial resistance diagnostics. Antibiotics 2021, 10, 209. [Google Scholar] [CrossRef] [PubMed]
- Khaledi, A.; Weimann, A.; Schniederjans, M.; Asgari, E.; Kuo, T.H.; Oliver, A.; Cabot, G.; Kola, A.; Gastmeier, P.; Hogardt, M.; et al. Predicting antimicrobial resistance in Pseudomonas aeruginosa with machine learning-enabled molecular diagnostics. EMBO Mol. Med. 2020, 12, e10264. [Google Scholar] [CrossRef]
- Pataki, B.; Matamoros, S.; van der Putten, B.C.L.; Remondini, D.; Giampieri, E.; Aytan-Aktug, D.; Hendriksen, R.S.; Lund, O.; Csabai, I.; Schultsz, C. Understanding and predicting ciprofloxacin minimum inhibitory concentration in Escherichia coli with machine learning. Sci. Rep. 2020, 10, 15026. [Google Scholar] [CrossRef] [PubMed]
- Novembre, J.; Johnson, T.; Bryc, K.; Kutalik, Z.; Boyko, A.R.; Auton, A.; Indap, A.; King, K.S.; Bergmann, S.; Nelson, M.R. Genes mirror geography within Europe. Nature 2008, 456, 98–101. [Google Scholar] [CrossRef]
- Demczuk, W.; Martin, I.; Griffith, A.; Lefebvre, B.; McGeer, A.; Tyrrell, G.J.; Zhanel, G.G.; Kus, J.V.; Hoang, L.; Minion, J. Linear regression equations to predict β-lactam, macrolide, lincosamide, and fluoroquinolone MICs from molecular antimicrobial resistance determinants in Streptococcus pneumoniae. Antimicrob. Agents Chemother. 2022, 66, e01370-21. [Google Scholar] [CrossRef]
- Yu, C.; Yao, W. Robust linear regression: A review and comparison. Commun. Stat. Simul. Comput. 2017, 46, 6261–6282. [Google Scholar] [CrossRef]
- Filzmoser, P.; Nordhausen, K. Robust linear regression for high-dimensional data: An overview. Wiley Interdiscip. Rev. Comput. Stat. 2021, 13, e1524. [Google Scholar] [CrossRef]
- Hernandez, B.; Herrero-Viñas, P.; Rawson, T.M.; Moore, L.S.P.; Holmes, A.H.; Georgiou, P. Resistance Trend Estimation Using Regression Analysis to Enhance Antimicrobial Surveillance: A Multi-Centre Study in London 2009–2016. Antibiotics 2021, 10, 1267. [Google Scholar] [CrossRef] [PubMed]
- Balouiri, M.; Sadiki, M.; Ibnsouda, S.K. Methods for in vitro evaluating antimicrobial activity: A review. J. Pharm. Anal. 2016, 6, 71–79. [Google Scholar] [CrossRef]
- Klein, E.Y.; Van Boeckel, T.P.; Martinez, E.M.; Pant, S.; Gandra, S.; Levin, S.A.; Goossens, H.; Laxminarayan, R. Global increase and geographic convergence in antibiotic consumption between 2000 and 2015. Proc. Natl. Acad. Sci. USA 2018, 115, e3463–e3470. [Google Scholar] [CrossRef]
- Sulis, G.; Sayood, S.; Gandra, S. Antimicrobial resistance in low- and middle-income countries: Current status and future directions. Expert. Rev. Anti Infect. Ther. 2022, 20, 147–160. [Google Scholar] [CrossRef]
- Schröder, W.; Sommer, H.; Gladstone, B.P.; Foschi, F.; Hellman, J.; Evengard, B.; Tacconelli, E. Gender differences in antibiotic prescribing in the community: A systematic review and meta-analysis. J. Antimicrob. Chemother. 2016, 71, 1800–1806. [Google Scholar] [CrossRef]
- Brusselaers, N.; Vogelaers, D.; Blot, S. The rising problem of antimicrobial resistance in the intensive care unit. Ann. Intensive Care 2011, 1, 47. [Google Scholar] [CrossRef]
- Hussain, H.I.; Aqib, A.I.; Seleem, M.N.; Shabbir, M.A.; Hao, H.; Iqbal, Z.; Kulyar, M.F.; Zaheer, T.; Li, K. Genetic basis of molecular mechanisms in β-lactam resistant gram-negative bacteria. Microb. Pathog. 2021, 158, 105040. [Google Scholar] [CrossRef]
- CDC. Antibiotics Tested by N ARMS. Available online: https://www.cdc.gov/narms/antibiotics-tested.html (accessed on 1 February 2022).
- Castanheira, M.; Simner, P.J.; Bradford, P.A. Extended-spectrum β-lactamases: An update on their characteristics, epidemiology and detection. JAC Antimicrob. Resist. 2021, 3, dlab092. [Google Scholar] [CrossRef]
- Winokur, P.L.; Vonstein, D.L.; Hoffman, L.J.; Uhlenhopp, E.K.; Doern, G.V. Evidence for transfer of CMY-2 AmpC beta-lactamase plasmids between Escherichia coli and Salmonella isolates from food animals and humans. Antimicrob. Agents Chemother. 2001, 45, 2716–2722. [Google Scholar] [CrossRef]
- Heider, L.C.; Hoet, A.E.; Wittum, T.E.; Khaitsa, M.L.; Love, B.C.; Huston, C.L.; Morley, P.S.; Funk, J.A.; Gebreyes, W.A. Genetic and phenotypic characterization of the bla Cmy gene from Escherichia coli and Salmonella enterica isolated from food-producing animals, humans, the environment, and retail meat. Foodborne Pathog. Dis. 2009, 6, 1235–1240. [Google Scholar] [CrossRef]
- Bhattacharyya, R.P.; Bandyopadhyay, N.; Ma, P.; Son, S.S.; Liu, J.; He, L.L.; Wu, L.; Khafizov, R.; Boykin, R.; Cerqueira, G.C.; et al. Simultaneous detection of genotype and phenotype enables rapid and accurate antibiotic susceptibility determination. Nat. Med. 2019, 25, 1858–1864. [Google Scholar] [CrossRef]
- Strutz, T. Data Fitting and Uncertainty: A Practical Introduction to Weighted Least Squares and Beyond; Vieweg+Teubner: Wiesbaden, Germany, 2011; Volume 1. [Google Scholar]


| Variables | Categories | Cefepime | Ceftazidime | Ceftaroline | Imipenem | Meropenem | ||||||||||
|---|---|---|---|---|---|---|---|---|---|---|---|---|---|---|---|---|
| MIC | 95% CI | p Value | MIC | 95% CI | p Value | MIC | 95% CI | p Value | MIC | 95% CI | p Value | MIC | 95% CI | p Value | ||
| Country | Argentina | Ref | ||||||||||||||
| Australia | 0.75 | 0.65–0.99 | <0.01 | 0.64 | 0.52–0.77 | <0.01 | 0.81 | 0.66–0.98 | 0.03 | 1.12 | 1.01–1.23 | 0.02 | 1.15 | 1.01–1.31 | 0.03 | |
| Austria | 0.80 | 0.77–0.96 | 0.04 | 0.72 | 0.54–0.95 | 0.02 | 0.71 | 0.53–0.94 | 0.02 | 1.17 | 1.01–1.34 | 0.03 | 1.13 | 0.95–1.34 | 0.14 | |
| Belgium | 0.86 | 0.87–1.04 | 0.01 | 0.80 | 0.70–0.92 | <0.01 | 1.00 | 0.88–1.14 | 0.94 | 1.10 | 1.01–1.19 | 0.02 | 1.18 | 1.05–1.32 | <0.01 | |
| Brazil | 0.95 | 0.69–1.38 | 0.26 | 0.95 | 0.86–1.05 | 0.36 | 0.87 | 0.79–0.96 | 0.01 | 1.17 | 1.09–1.25 | <0.01 | 1.35 | 1.22–1.49 | <0.01 | |
| Cameroon | 0.98 | 0.67–0.95 | 0.90 | 0.89 | 0.68–1.16 | 0.42 | 0.61 | 0.52–0.70 | <0.01 | 1.11 | 0.92–1.35 | 0.28 | 0.80 | 0.66–0.97 | 0.02 | |
| Canada | 0.80 | 0.96–1.15 | 0.01 | 0.83 | 0.68–1.01 | 0.08 | 0.57 | 0.49–0.65 | <0.01 | 1.17 | 1.05–1.31 | 0.01 | 1.26 | 1.09–1.46 | <0.01 | |
| Chile | 1.06 | 1.03–1.32 | 0.24 | 1.16 | 1.02–1.31 | 0.02 | 0.86 | 0.77–0.96 | 0.01 | 1.22 | 1.13–1.31 | <0.01 | 1.84 | 1.65–2.06 | <0.01 | |
| China | 1.17 | 0.74–0.89 | 0.01 | 0.96 | 0.81–1.14 | 0.65 | 0.50 | 0.44–0.56 | <0.01 | 1.37 | 1.24–1.51 | <0.01 | 1.33 | 1.18–1.49 | <0.01 | |
| Colombia | 0.82 | 0.74–1.47 | <0.01 | 0.73 | 0.65–0.82 | <0.01 | 0.90 | 0.81–0.99 | 0.04 | 1.02 | 0.95–1.09 | 0.57 | 0.98 | 0.89–1.09 | 0.75 | |
| Costa Rica | 1.04 | 1.05–1.38 | 0.82 | 0.85 | 0.55–1.32 | 0.48 | 0.63 | 0.54–0.74 | <0.01 | 1.06 | 0.88–1.29 | 0.53 | 1.34 | 1.03–1.74 | 0.03 | |
| Croatia | 1.20 | 0.87–1.06 | 0.01 | 1.42 | 1.21–1.68 | <0.01 | 0.62 | 0.56–0.69 | <0.01 | 1.34 | 1.20–1.48 | <0.01 | 1.44 | 1.24–1.68 | <0.01 | |
| Czech Republic | 0.96 | 0.46–0.70 | 0.42 | 0.82 | 0.73–0.93 | <0.01 | 1.04 | 0.93–1.17 | 0.47 | 1.04 | 0.97–1.12 | 0.29 | 0.89 | 0.81–0.98 | 0.02 | |
| Denmark | 0.57 | 0.83–1.28 | <0.01 | 0.36 | 0.26–0.49 | <0.01 | 0.77 | 0.55–1.07 | 0.12 | 1.17 | 1.01–1.34 | 0.03 | 0.95 | 0.81–1.09 | 0.46 | |
| Dominican Republic | 1.03 | 0.32–1.86 | 0.79 | 1.42 | 1.16–1.72 | <0.01 | 0.53 | 0.46–0.60 | <0.01 | 0.93 | 0.82–1.06 | 0.27 | 1.03 | 0.93–1.15 | 0.59 | |
| Finland | 0.77 | 0.71–0.87 | 0.56 | 0.82 | 0.35–1.93 | 0.66 | 0.49 | 0.25–0.97 | 0.04 | 0.99 | 0.74–1.34 | 0.96 | 1.04 | 0.85–1.28 | 0.70 | |
| France | 0.78 | 0.75–0.92 | <0.01 | 0.75 | 0.66–0.85 | <0.01 | 0.87 | 0.77–0.98 | 0.02 | 1.06 | 0.99–1.14 | 0.11 | 0.99 | 0.91–1.09 | 0.87 | |
| Germany | 0.83 | 1.16–1.41 | <0.01 | 0.65 | 0.56–0.74 | <0.01 | 0.86 | 0.76–0.97 | 0.01 | 1.16 | 1.07–1.25 | <0.01 | 1.09 | 0.98–1.21 | 0.11 | |
| Greece | 1.28 | 0.96–1.25 | <0.01 | 1.25 | 1.10–1.40 | <0.01 | 1.08 | 0.97–1.21 | 0.17 | 1.27 | 1.18–1.37 | <0.01 | 1.69 | 1.53–1.87 | <0.01 | |
| Guatemala | 1.09 | 0.53–0.93 | 0.19 | 1.24 | 1.06–1.44 | 0.01 | 0.60 | 0.54–0.67 | <0.01 | 1.37 | 1.24–1.52 | <0.01 | 1.76 | 1.53–2.02 | <0.01 | |
| Hong Kong | 0.70 | 0.85–1.03 | 0.01 | 0.79 | 0.58–1.06 | 0.12 | 0.62 | 0.49–0.79 | <0.01 | 1.35 | 1.13–1.61 | <0.01 | 1.20 | 0.99–1.46 | 0.06 | |
| Hungary | 0.94 | 1.16–1.37 | 0.20 | 1.01 | 0.88–1.14 | 0.92 | 1.00 | 0.89–1.13 | 0.99 | 1.12 | 1.04–1.22 | 0.01 | 1.07 | 0.97–1.19 | 0.18 | |
| India | 1.26 | 0.50–0.88 | <0.01 | 1.38 | 1.25–1.53 | <0.01 | 0.64 | 0.59–0.69 | <0.01 | 1.30 | 1.21–1.41 | <0.01 | 1.79 | 1.61–1.99 | <0.01 | |
| Ireland | 0.67 | 0.89–1.08 | <0.01 | 0.69 | 0.52–0.91 | 0.01 | 0.54 | 0.44–0.67 | <0.01 | 1.17 | 1.00–1.36 | 0.05 | 1.07 | 0.88–1.30 | 0.48 | |
| Israel | 0.98 | 1.09–1.28 | 0.72 | 0.97 | 0.86–1.08 | 0.62 | 1.07 | 0.96–1.19 | 0.20 | 1.04 | 0.97–1.11 | 0.29 | 1.03 | 0.94–1.13 | 0.51 | |
| Italy | 1.18 | 0.72–1.20 | <0.01 | 1.44 | 1.30–1.58 | <0.01 | 1.02 | 0.93–1.12 | 0.62 | 1.19 | 1.12–1.27 | <0.01 | 1.45 | 1.33–1.58 | <0.01 | |
| Ivory Coast | 0.93 | 0.67–0.95 | 0.59 | 0.96 | 0.74–1.24 | 0.75 | 0.68 | 0.59–0.79 | <0.01 | 0.97 | 0.83–1.14 | 0.71 | 0.86 | 0.74–0.99 | 0.04 | |
| Japan | 0.80 | 0.55–1.10 | 0.01 | 0.67 | 0.54–0.82 | <0.01 | 0.72 | 0.58–0.89 | <0.01 | 1.11 | 0.99–1.23 | 0.06 | 1.11 | 0.99–1.25 | 0.08 | |
| Jordan | 0.78 | 1.01–1.35 | 0.16 | 1.15 | 0.88–1.48 | 0.30 | 0.44 | 0.38–0.52 | <0.01 | 0.93 | 0.73–1.19 | 0.59 | 0.79 | 0.58–1.08 | 0.14 | |
| Kenya | 1.17 | 0.99–1.21 | 0.04 | 1.23 | 0.98–1.55 | 0.07 | 0.81 | 0.68–0.95 | 0.01 | 0.87 | 0.69–1.09 | 0.24 | 1.36 | 1.11–1.67 | <0.01 | |
| South Korea | 1.10 | 0.87–1.04 | 0.06 | 1.19 | 1.06–1.34 | <0.01 | 1.01 | 0.90–1.12 | 0.91 | 1.10 | 1.03–1.18 | 0.01 | 1.19 | 1.09–1.31 | <0.01 | |
| Kuwait | 0.95 | 1.41–2.28 | 0.27 | 0.99 | 0.89–1.11 | 0.96 | 1.05 | 0.95–1.17 | 0.30 | 1.12 | 1.04–1.21 | <0.01 | 1.22 | 1.11–1.35 | <0.01 | |
| Latvia | 1.79 | 0.84–1.22 | <0.01 | 1.64 | 1.24–2.15 | <0.01 | 0.57 | 0.49–0.65 | <0.01 | 1.28 | 1.08–1.52 | 0.01 | 0.95 | 0.83–1.09 | 0.45 | |
| Lithuania | 1.01 | 0.94–1.18 | 0.90 | 0.94 | 0.75–1.18 | 0.59 | 0.52 | 0.46–0.59 | <0.01 | 1.17 | 1.02–1.34 | 0.02 | 1.05 | 0.88–1.24 | 0.61 | |
| Malaysia | 1.05 | 0.99–1.16 | 0.40 | 1.08 | 0.94–1.24 | 0.28 | 0.76 | 0.68–0.85 | <0.01 | 1.31 | 1.18–1.45 | <0.01 | 1.18 | 1.04–1.33 | 0.01 | |
| Mexico | 1.07 | 0.88–1.17 | 0.06 | 1.07 | 0.97–1.18 | 0.17 | 1.01 | 0.92–1.10 | 0.85 | 1.09 | 1.02–1.16 | 0.01 | 1.14 | 1.04–1.23 | <0.01 | |
| Morocco | 1.01 | 0.55–0.85 | 0.87 | 1.16 | 0.98–1.37 | 0.07 | 0.65 | 0.58–0.73 | <0.01 | 1.16 | 1.04–1.30 | 0.01 | 1.10 | 0.95–1.28 | 0.20 | |
| The Netherlands | 0.69 | 0.28–0.74 | <0.01 | 0.41 | 0.32–0.54 | <0.01 | 0.68 | 0.49–0.94 | 0.02 | 1.21 | 1.05–1.39 | 0.01 | 1.10 | 0.92–1.31 | 0.31 | |
| New Zealand | 0.46 | 1.11–1.35 | <0.01 | 0.71 | 0.41–1.22 | 0.22 | 0.60 | 0.44–0.80 | <0.01 | 1.40 | 0.99–1.97 | 0.06 | 0.95 | 0.81–1.11 | 0.50 | |
| Nigeria | 1.23 | 0.98–1.39 | <0.01 | 1.27 | 1.14–1.42 | <0.01 | 0.64 | 0.59–0.71 | <0.01 | 1.23 | 1.14–1.33 | <0.01 | 1.29 | 1.16–1.43 | <0.01 | |
| Panama | 1.17 | 0.75–0.91 | 0.08 | 1.25 | 1.04–1.51 | 0.02 | 0.59 | 0.52–0.67 | <0.01 | 1.06 | 0.91–1.22 | 0.46 | 1.18 | 0.99–1.42 | 0.07 | |
| Philippines | 0.83 | 1.09–1.33 | <0.01 | 1.28 | 1.14–1.43 | <0.01 | 1.04 | 0.93–1.16 | 0.51 | 1.15 | 1.07–1.23 | <0.01 | 1.22 | 1.10–1.34 | <0.01 | |
| Poland | 1.21 | 0.77–0.92 | <0.01 | 1.24 | 1.09–1.40 | <0.01 | 0.98 | 0.88–1.10 | 0.77 | 1.34 | 1.22–1.46 | <0.01 | 1.68 | 1.47–1.92 | <0.01 | |
| Portugal | 0.84 | 0.71–1.16 | <0.01 | 0.89 | 0.79–1.0 | 0.05 | 0.89 | 0.79–0.99 | 0.03 | 0.97 | 0.90–1.03 | 0.32 | 1.01 | 0.92–1.09 | 0.89 | |
| Qatar | 0.90 | 1.05–1.28 | 0.42 | 0.89 | 0.67–1.16 | 0.38 | 0.75 | 0.64–0.87 | <0.01 | 1.57 | 1.36–1.82 | <0.01 | 1.26 | 1.00–1.59 | 0.05 | |
| Romania | 1.16 | 1.01–1.18 | <0.01 | 1.51 | 1.33–1.71 | <0.01 | 0.79 | 0.71–0.88 | <0.01 | 1.31 | 1.19–1.44 | <0.01 | 1.68 | 1.48–1.91 | <0.01 | |
| Russia | 1.09 | 0.65–1.08 | 0.03 | 1.25 | 1.13–1.38 | <0.01 | 0.93 | 0.85–1.01 | 0.09 | 1.29 | 1.21–1.38 | <0.01 | 1.59 | 1.46–1.74 | <0.01 | |
| Saudi Arabia | 0.84 | 0.59–1.87 | 0.17 | 1.12 | 0.86–1.45 | 0.39 | 0.57 | 0.49–0.65 | <0.01 | 1.35 | 1.15–1.58 | <0.01 | 1.63 | 1.30–2.04 | <0.01 | |
| Singapore | 1.05 | 0.29–0.91 | 0.87 | 1.65 | 0.86–3.17 | 0.13 | 0.52 | 0.35–0.78 | <0.01 | 0.88 | 0.50–1.54 | 0.65 | 1.40 | 0.77–2.53 | 0.27 | |
| Slovenia | 0.51 | 0.85–1.02 | 0.02 | 0.54 | 0.27–1.08 | 0.08 | 1.27 | 0.72–2.23 | 0.41 | 0.91 | 0.67–1.22 | 0.52 | 2.46 | 0.62–9.68 | 0.20 | |
| South Africa | 0.93 | 0.66–0.79 | 0.14 | 0.89 | 0.78–1.01 | 0.07 | 0.92 | 0.82–1.03 | 0.16 | 1.05 | 0.97–1.14 | 0.24 | 1.19 | 1.07–1.32 | <0.01 | |
| Spain | 0.72 | 0.49–0.86 | <0.01 | 0.81 | 0.72–0.91 | <0.01 | 0.74 | 0.66–0.83 | <0.01 | 1.11 | 1.03–1.19 | <0.01 | 1.11 | 1.00–1.22 | 0.04 | |
| Sweden | 0.65 | 0.57–1.03 | <0.01 | 0.62 | 0.45–0.86 | <0.01 | 0.37 | 0.25–0.54 | <0.01 | 1.18 | 0.99–1.39 | 0.05 | 1.12 | 0.91–1.36 | 0.28 | |
| Switzerland | 0.76 | 1.01–1.29 | 0.08 | 0.76 | 0.55–1.04 | 0.09 | 0.54 | 0.45–0.65 | <0.01 | 1.21 | 1.02–1.43 | 0.03 | 1.21 | 0.99–1.47 | 0.05 | |
| Taiwan | 1.14 | 0.97–1.15 | 0.03 | 1.58 | 1.38–1.79 | <0.01 | 1.03 | 0.92–1.16 | 0.62 | 1.24 | 1.15–1.34 | <0.01 | 1.24 | 1.11–1.37 | <0.01 | |
| Thailand | 1.06 | 0.90–1.08 | 0.22 | 1.29 | 1.16–1.43 | <0.01 | 1.01 | 0.91–1.11 | 0.85 | 1.13 | 1.05–1.22 | <0.01 | 1.13 | 1.02–1.24 | 0.02 | |
| Turkey | 0.99 | 1.17–1.46 | 0.75 | 0.98 | 0.88–1.09 | 0.70 | 0.96 | 0.87–1.06 | 0.39 | 1.37 | 1.28–1.47 | <0.01 | 1.53 | 1.39–1.67 | <0.01 | |
| Ukraine | 1.29 | 0.59–0.78 | <0.01 | 1.33 | 1.16–1.52 | <0.01 | 0.54 | 0.49–0.59 | <0.01 | 1.40 | 1.25–1.56 | <0.01 | 2.40 | 2.04–2.83 | <0.01 | |
| United Kingdom | 0.68 | 0.85–1.01 | <0.01 | 0.69 | 0.59–0.81 | <0.01 | 0.80 | 0.68–0.93 | <0.01 | 1.00 | 0.92–1.10 | 0.93 | 0.99 | 0.89–1.11 | 0.86 | |
| United States | 0.93 | 0.88–1.07 | 0.09 | 1.07 | 0.96–1.19 | 0.23 | 0.65 | 0.59–0.72 | <0.01 | 1.12 | 1.05–1.20 | <0.01 | 1.27 | 1.16–1.39 | <0.01 | |
| Venezuela | 0.97 | 1.07–1.92 | 0.56 | 1.05 | 0.93–1.19 | 0.43 | 1.08 | 0.96–1.21 | 0.19 | 1.05 | 0.97–1.13 | 0.25 | 1.11 | 1.00–1.22 | 0.04 | |
| Bacteria | E. coli | Ref | ||||||||||||||
| Citrobacter spp. | 1.43 | 1.07–1.93 | 0.02 | 1.58 | 1.08–2.31 | 0.02 | 2.00 | 1.58–2.52 | <0.01 | 2.04 | 1.67–2.49 | <0.01 | 2.79 | 1.98–3.92 | <0.01 | |
| Enterobacter spp. | 1.66 | 1.46–1.88 | <0.01 | 2.33 | 2.05–2.64 | <0.01 | 1.16 | 1.04–1.28 | 0.01 | 3.03 | 2.73–3.38 | <0.01 | 4.97 | 4.18–5.91 | <0.01 | |
| Klebsiella spp. | 0.85 | 0.81–0.90 | <0.01 | 0.73 | 0.67–0.78 | <0.01 | 1.24 | 1.17–1.31 | <0.01 | 1.63 | 1.57–1.69 | <0.01 | 1.72 | 1.63–1.81 | <0.01 | |
| Morganella spp. | 1.32 | 0.21–8.26 | 0.77 | 0.95 | 0.05–17.1 | 0.97 | 2.60 | 1.87–3.62 | <0.01 | 2.30 | 1.86–2.84 | <0.01 | 1.61 | 0.55–4.71 | 0.38 | |
| Proteus spp. | 0.93 | 0.85–1.03 | 0.17 | 0.28 | 0.24–0.32 | <0.01 | 0.70 | 0.60–0.81 | <0.01 | 9.98 | 9.35–10.7 | <0.01 | 2.16 | 1.99–2.34 | <0.01 | |
| Providencia spp. | 1.91 | 1.60–2.28 | <0.01 | 1.44 | 1.17–1.76 | <0.01 | 1.50 | 1.26–1.77 | <0.01 | 3.55 | 3.09–4.08 | <0.01 | 3.72 | 3.08–4.49 | <0.01 | |
| Raoultella spp. | 0.52 | 0.19–1.35 | 0.18 | 0.66 | 0.14–3.05 | 0.60 | 0.91 | 0.11–7.35 | 0.93 | 2.35 | 1.24–4.43 | 0.01 | 1.32 | 0.78–2.24 | 0.29 | |
| Serratia spp. | 0.75 | 0.61–0.93 | 0.01 | 0.23 | 0.18–0.29 | <0.01 | 0.40 | 0.32–0.51 | <0.01 | 4.67 | 4.16–5.26 | <0.01 | 5.39 | 4.41–6.59 | <0.01 | |
| Gender | Male | Ref | ||||||||||||||
| Female | 0.98 | 0.96–1.00 | 0.08 | 0.97 | 0.95–0.99 | 0.04 | 1.00 | 0.98–1.03 | 0.82 | 0.99 | 0.98–1.01 | 0.59 | 0.99 | 0.97–1.02 | 0.63 | |
| Age group | 0 to 2 Years | Ref | ||||||||||||||
| 13 to 18 Years | 0.96 | 0.85–1.07 | 0.42 | 1.03 | 0.89–1.18 | 0.66 | 0.98 | 0.88–1.09 | 0.69 | 1.00 | 0.91–1.09 | 0.94 | 1.12 | 0.99–1.27 | 0.08 | |
| 19 to 64 Years | 1.07 | 0.99–1.16 | 0.08 | 1.07 | 0.97–1.18 | 0.18 | 1.00 | 0.91–1.08 | 0.93 | 1.08 | 1.01–1.15 | 0.02 | 1.17 | 1.07–1.28 | <0.01 | |
| 3 to 12 Years | 0.93 | 0.85–1.01 | 0.10 | 1.01 | 0.89–1.12 | 0.92 | 0.98 | 0.89–1.07 | 0.63 | 1.04 | 0.98–1.11 | 0.23 | 1.04 | 0.95–1.13 | 0.43 | |
| 65 to 84 Years | 1.11 | 1.02–1.19 | 0.01 | 1.11 | 0.99–1.22 | 0.05 | 1.03 | 0.94–1.12 | 0.50 | 1.06 | 0.99–1.13 | 0.07 | 1.17 | 1.07–1.28 | <0.01 | |
| 85 and over | 1.07 | 0.98–1.16 | 0.15 | 1.05 | 0.93–1.17 | 0.43 | 0.99 | 0.89–1.09 | 0.86 | 1.07 | 0.99–1.14 | 0.05 | 1.11 | 1.01–1.22 | 0.03 | |
| Specialty | Clinic/Office | Ref | ||||||||||||||
| General Unspecified ICU | 1.03 | 0.96–1.09 | 0.47 | 1.07 | 0.98–1.16 | 0.10 | 1.07 | 0.99–1.16 | 0.05 | 1.05 | 0.99–1.10 | 0.07 | 1.05 | 0.97–1.13 | 0.21 | |
| Medicine-General | 1.01 | 0.97–1.06 | 0.48 | 1.06 | 1.01–1.11 | 0.02 | 1.09 | 1.04–1.14 | <0.01 | 1.03 | 0.99–1.06 | 0.05 | 1.01 | 0.97–1.05 | 0.55 | |
| Medicine-ICU | 1.06 | 1.01–1.11 | 0.02 | 1.15 | 1.08–1.22 | <0.01 | 1.05 | 1.00–1.11 | 0.04 | 1.07 | 1.03–1.10 | <0.01 | 1.09 | 1.04–1.15 | <0.01 | |
| None Given | 1.02 | 0.94–1.09 | 0.64 | 1.05 | 0.96–1.15 | 0.24 | 1.13 | 1.04–1.23 | <0.01 | 1.00 | 0.94–1.06 | 0.90 | 1.01 | 0.93–1.09 | 0.83 | |
| Other | 1.01 | 0.93–1.11 | 0.75 | 1.02 | 0.92–1.13 | 0.68 | 1.08 | 0.98–1.19 | 0.12 | 1.00 | 0.94–1.07 | 0.95 | 0.98 | 0.89–1.07 | 0.60 | |
| Pediatric-General | 1.05 | 0.96–1.16 | 0.28 | 0.96 | 0.84–1.08 | 0.46 | 1.07 | 0.96–1.18 | 0.22 | 1.04 | 0.97–1.12 | 0.25 | 0.99 | 0.89–1.09 | 0.86 | |
| Pediatric-ICU | 1.06 | 0.96–1.17 | 0.22 | 1.14 | 1.00–1.28 | 0.04 | 1.06 | 0.95–1.17 | 0.28 | 1.03 | 0.96–1.11 | 0.38 | 0.98 | 0.88–1.09 | 0.74 | |
| Surgery-General | 1.00 | 0.95–1.05 | 0.99 | 1.03 | 0.97–1.09 | 0.33 | 1.03 | 0.98–1.08 | 0.25 | 1.06 | 1.02–1.09 | <0.01 | 1.05 | 1.01–1.09 | 0.03 | |
| Surgery-ICU | 1.04 | 0.98–1.09 | 0.19 | 1.07 | 1.00–1.15 | 0.04 | 1.01 | 0.95–1.07 | 0.76 | 1.11 | 1.06–1.16 | <0.01 | 1.11 | 1.05–1.18 | <0.01 | |
| Year | Year | 1.05 | 1.05–1.06 | <0.01 | 0.97 | 0.96–0.97 | <0.01 | 0.65 | 0.65–0.66 | <0.01 | 1.03 | 1.02–1.03 | <0.01 | 1.09 | 1.09–1.1 | <0.01 |
| blaCTX-M-1 | Yes | 6.98 | 6.69–7.29 | <0.01 | 2.97 | 2.83–3.11 | <0.01 | 3.09 | 2.96–3.23 | <0.01 | 0.81 | 0.79–0.83 | <0.01 | 0.87 | 0.84–0.91 | <0.01 |
| blaCTX-M-2 | Yes | 5.46 | 4.96–6.00 | <0.01 | 1.54 | 1.37–1.72 | <0.01 | 2.70 | 2.44–2.99 | <0.01 | 1.06 | 0.98–1.14 | 0.13 | 2.46 | 2.15–2.82 | <0.01 |
| blaCTX-M-8/25 | Yes | 4.41 | 3.81–5.11 | <0.01 | 0.34 | 0.28–0.43 | <0.01 | 3.07 | 2.62–3.61 | <0.01 | 0.93 | 0.83–1.05 | 0.27 | 0.89 | 0.75–1.06 | 0.20 |
| blaCTX-M-9 | Yes | 3.98 | 3.77–4.20 | <0.01 | 0.58 | 0.55–0.62 | <0.01 | 3.07 | 2.91–3.25 | <0.01 | 0.84 | 0.81–0.86 | <0.01 | 0.83 | 0.79–0.87 | <0.01 |
| VEB | Yes | 3.24 | 2.70–3.89 | <0.01 | 6.23 | 4.90–7.91 | <0.01 | 1.91 | 1.62–2.25 | <0.01 | 0.64 | 0.56–0.73 | <0.01 | 0.57 | 0.47–0.67 | <0.01 |
| PER | Yes | 2.98 | 2.09–4.24 | <0.01 | 7.44 | 4.48–12.3 | <0.01 | 1.26 | 0.89–1.79 | 0.19 | 1.21 | 0.88–1.65 | 0.25 | 0.93 | 0.64–1.35 | 0.70 |
| GES | Yes | 0.86 | 0.62–1.19 | 0.37 | 2.17 | 1.56–3.03 | <0.01 | 0.83 | 0.62–1.11 | 0.21 | 1.61 | 1.22–2.12 | <0.01 | 1.87 | 1.27–2.76 | <0.01 |
| ACC | Yes | 0.90 | 0.62–1.31 | 0.59 | 9.62 | 7.15–12.9 | <0.01 | 2.88 | 2.18–3.79 | <0.01 | 0.69 | 0.55–0.86 | <0.01 | 0.68 | 0.50–0.92 | 0.01 |
| CMY-2 | Yes | 0.37 | 0.33–0.40 | <0.01 | 3.29 | 3.06–3.54 | <0.01 | 1.06 | 0.97–1.14 | 0.18 | 1.46 | 1.39–1.53 | <0.01 | 1.09 | 1.02–1.16 | 0.01 |
| DHA | Yes | 0.33 | 0.29–0.36 | <0.01 | 2.14 | 1.98–2.30 | <0.01 | 0.70 | 0.64–0.76 | <0.01 | 2.20 | 2.09–2.32 | <0.01 | 1.05 | 0.99–1.12 | 0.12 |
| FOX | Yes | 0.44 | 0.18–1.06 | 0.07 | 2.12 | 1.09–4.18 | 0.03 | 0.87 | 0.42–1.81 | 0.70 | 0.85 | 0.61–1.17 | 0.31 | 0.87 | 0.63–1.21 | 0.41 |
| ACT | Yes | 0.62 | 0.31–1.23 | 0.17 | 0.36 | 0.10–1.28 | 0.12 | 0.30 | 0.05–1.83 | 0.19 | 1.77 | 0.82–3.83 | 0.14 | 0.80 | 0.56–1.13 | 0.21 |
| KPC | Yes | 4.14 | 3.92–4.37 | <0.01 | 3.44 | 3.25–3.64 | <0.01 | 1.98 | 1.88–2.09 | <0.01 | 17.1 | 16.5–17.7 | <0.01 | 67.38 | 63.7–71.2 | <0.01 |
| OXA | Yes | 1.22 | 1.17–1.26 | <0.01 | 1.23 | 1.16–1.31 | <0.01 | 0.97 | 0.93–1.01 | 0.17 | 7.46 | 7.13–7.80 | <0.01 | 21.21 | 19.8–22.7 | <0.01 |
| NDM | Yes | 2.09 | 1.99–2.19 | <0.01 | 2.57 | 2.45–2.69 | <0.01 | 1.06 | 1.02–1.10 | 0.01 | 10.1 | 9.59–10.6 | <0.01 | 37.68 | 34.9–40.6 | <0.01 |
| IMP | Yes | 3.71 | 2.91–4.73 | <0.01 | 5.77 | 4.48–7.42 | <0.01 | 2.37 | 1.85–3.03 | <0.01 | 5.39 | 4.22–6.90 | <0.01 | 19.40 | 13.1–28.7 | <0.01 |
| VIM | Yes | 3.28 | 2.89–3.73 | <0.01 | 3.51 | 3.06–4.02 | <0.01 | 1.58 | 1.41–1.76 | <0.01 | 7.76 | 6.83–8.80 | <0.01 | 15.05 | 12.4–18.2 | <0.01 |
| SHV | Yes | 1.22 | 1.16–1.29 | <0.01 | 2.46 | 2.30–2.64 | <0.01 | 0.84 | 0.79–0.89 | <0.01 | 0.95 | 0.91–0.98 | 0.01 | 1.05 | 0.99–1.11 | 0.05 |
| TEM | Yes | 1.09 | 1.07–1.12 | <0.01 | 1.06 | 1.02–1.08 | <0.01 | 1.09 | 1.06–1.11 | <0.01 | 1.02 | 1.00–1.04 | 0.01 | 1.01 | 0.99–1.04 | 0.27 |
Disclaimer/Publisher’s Note: The statements, opinions and data contained in all publications are solely those of the individual author(s) and contributor(s) and not of MDPI and/or the editor(s). MDPI and/or the editor(s) disclaim responsibility for any injury to people or property resulting from any ideas, methods, instructions or products referred to in the content. |
© 2024 by the authors. Licensee MDPI, Basel, Switzerland. This article is an open access article distributed under the terms and conditions of the Creative Commons Attribution (CC BY) license (https://creativecommons.org/licenses/by/4.0/).
Share and Cite
Rahman, M.K.; Williams, R.B.; Ajulo, S.; Levent, G.; Loneragan, G.H.; Awosile, B. Predictive Modeling of Phenotypic Antimicrobial Susceptibility of Selected Beta-Lactam Antimicrobials from Beta-Lactamase Resistance Genes. Antibiotics 2024, 13, 224. https://doi.org/10.3390/antibiotics13030224
Rahman MK, Williams RB, Ajulo S, Levent G, Loneragan GH, Awosile B. Predictive Modeling of Phenotypic Antimicrobial Susceptibility of Selected Beta-Lactam Antimicrobials from Beta-Lactamase Resistance Genes. Antibiotics. 2024; 13(3):224. https://doi.org/10.3390/antibiotics13030224
Chicago/Turabian StyleRahman, Md. Kaisar, Ryan B. Williams, Samuel Ajulo, Gizem Levent, Guy H. Loneragan, and Babafela Awosile. 2024. "Predictive Modeling of Phenotypic Antimicrobial Susceptibility of Selected Beta-Lactam Antimicrobials from Beta-Lactamase Resistance Genes" Antibiotics 13, no. 3: 224. https://doi.org/10.3390/antibiotics13030224
APA StyleRahman, M. K., Williams, R. B., Ajulo, S., Levent, G., Loneragan, G. H., & Awosile, B. (2024). Predictive Modeling of Phenotypic Antimicrobial Susceptibility of Selected Beta-Lactam Antimicrobials from Beta-Lactamase Resistance Genes. Antibiotics, 13(3), 224. https://doi.org/10.3390/antibiotics13030224