Reflectance-Based Organic Pulse Meter Sensor for Wireless Monitoring of Photoplethysmogram Signal

 ,
, 
Abstract
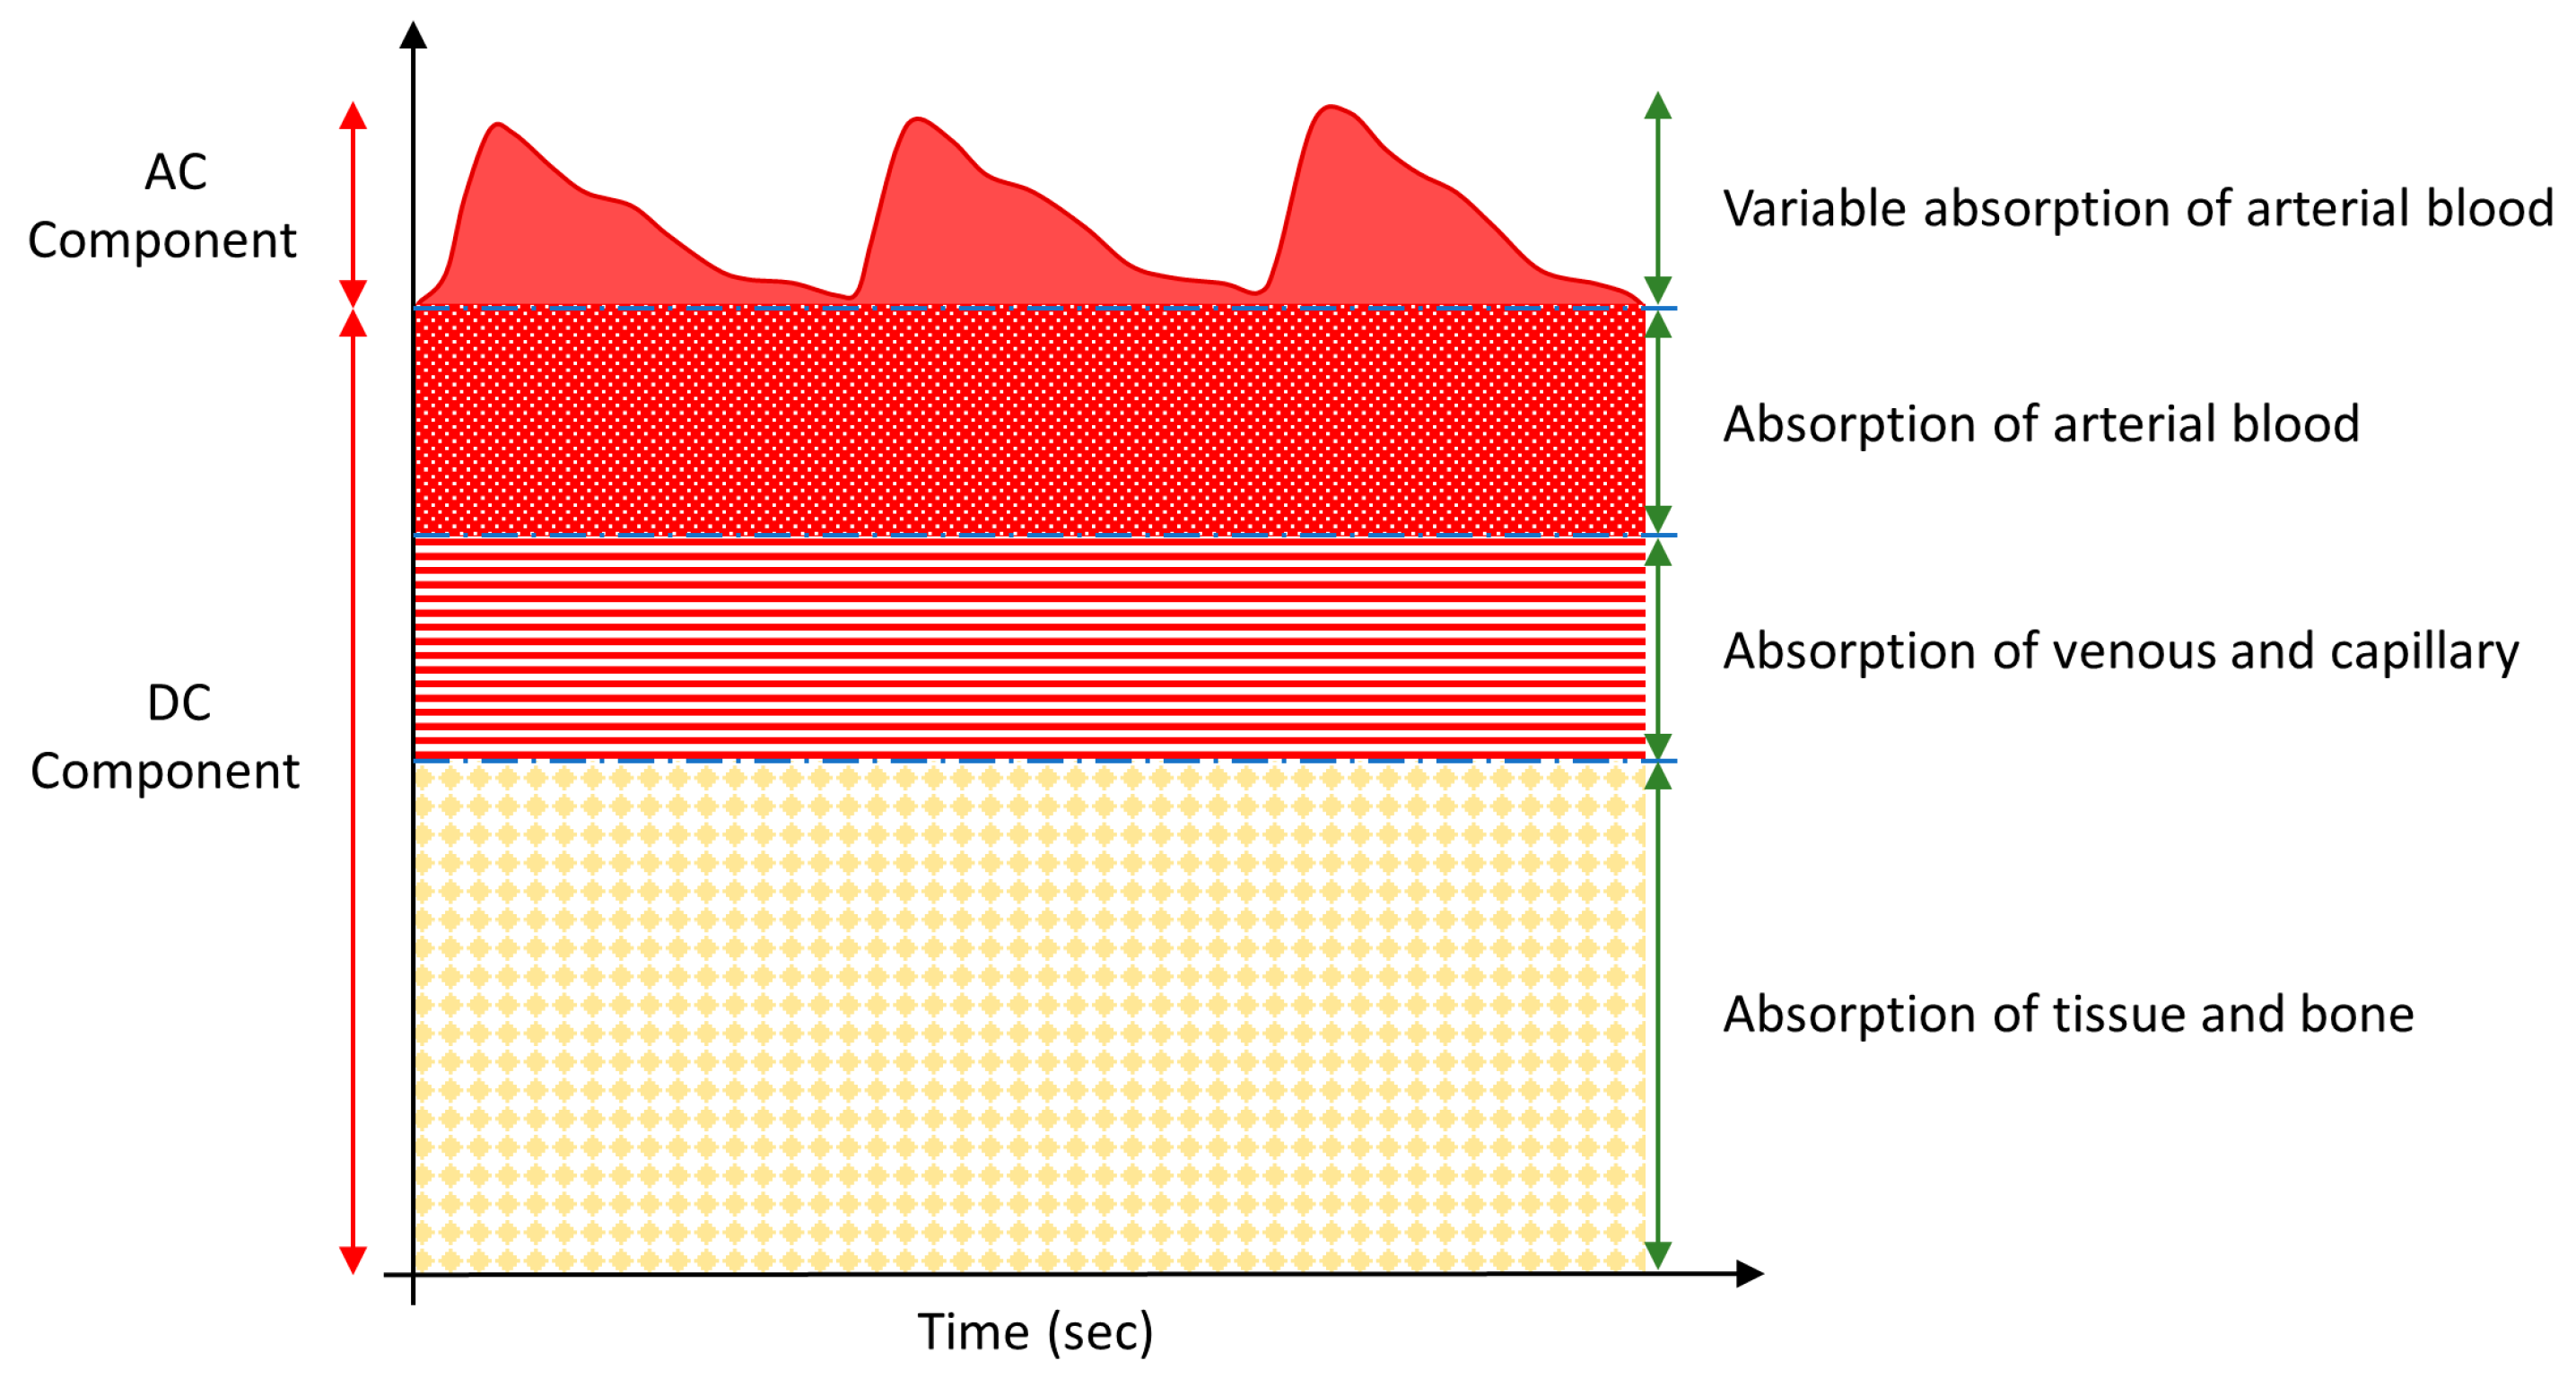
1. Introduction
2. Materials and Methods
2.1. Optical Simulation
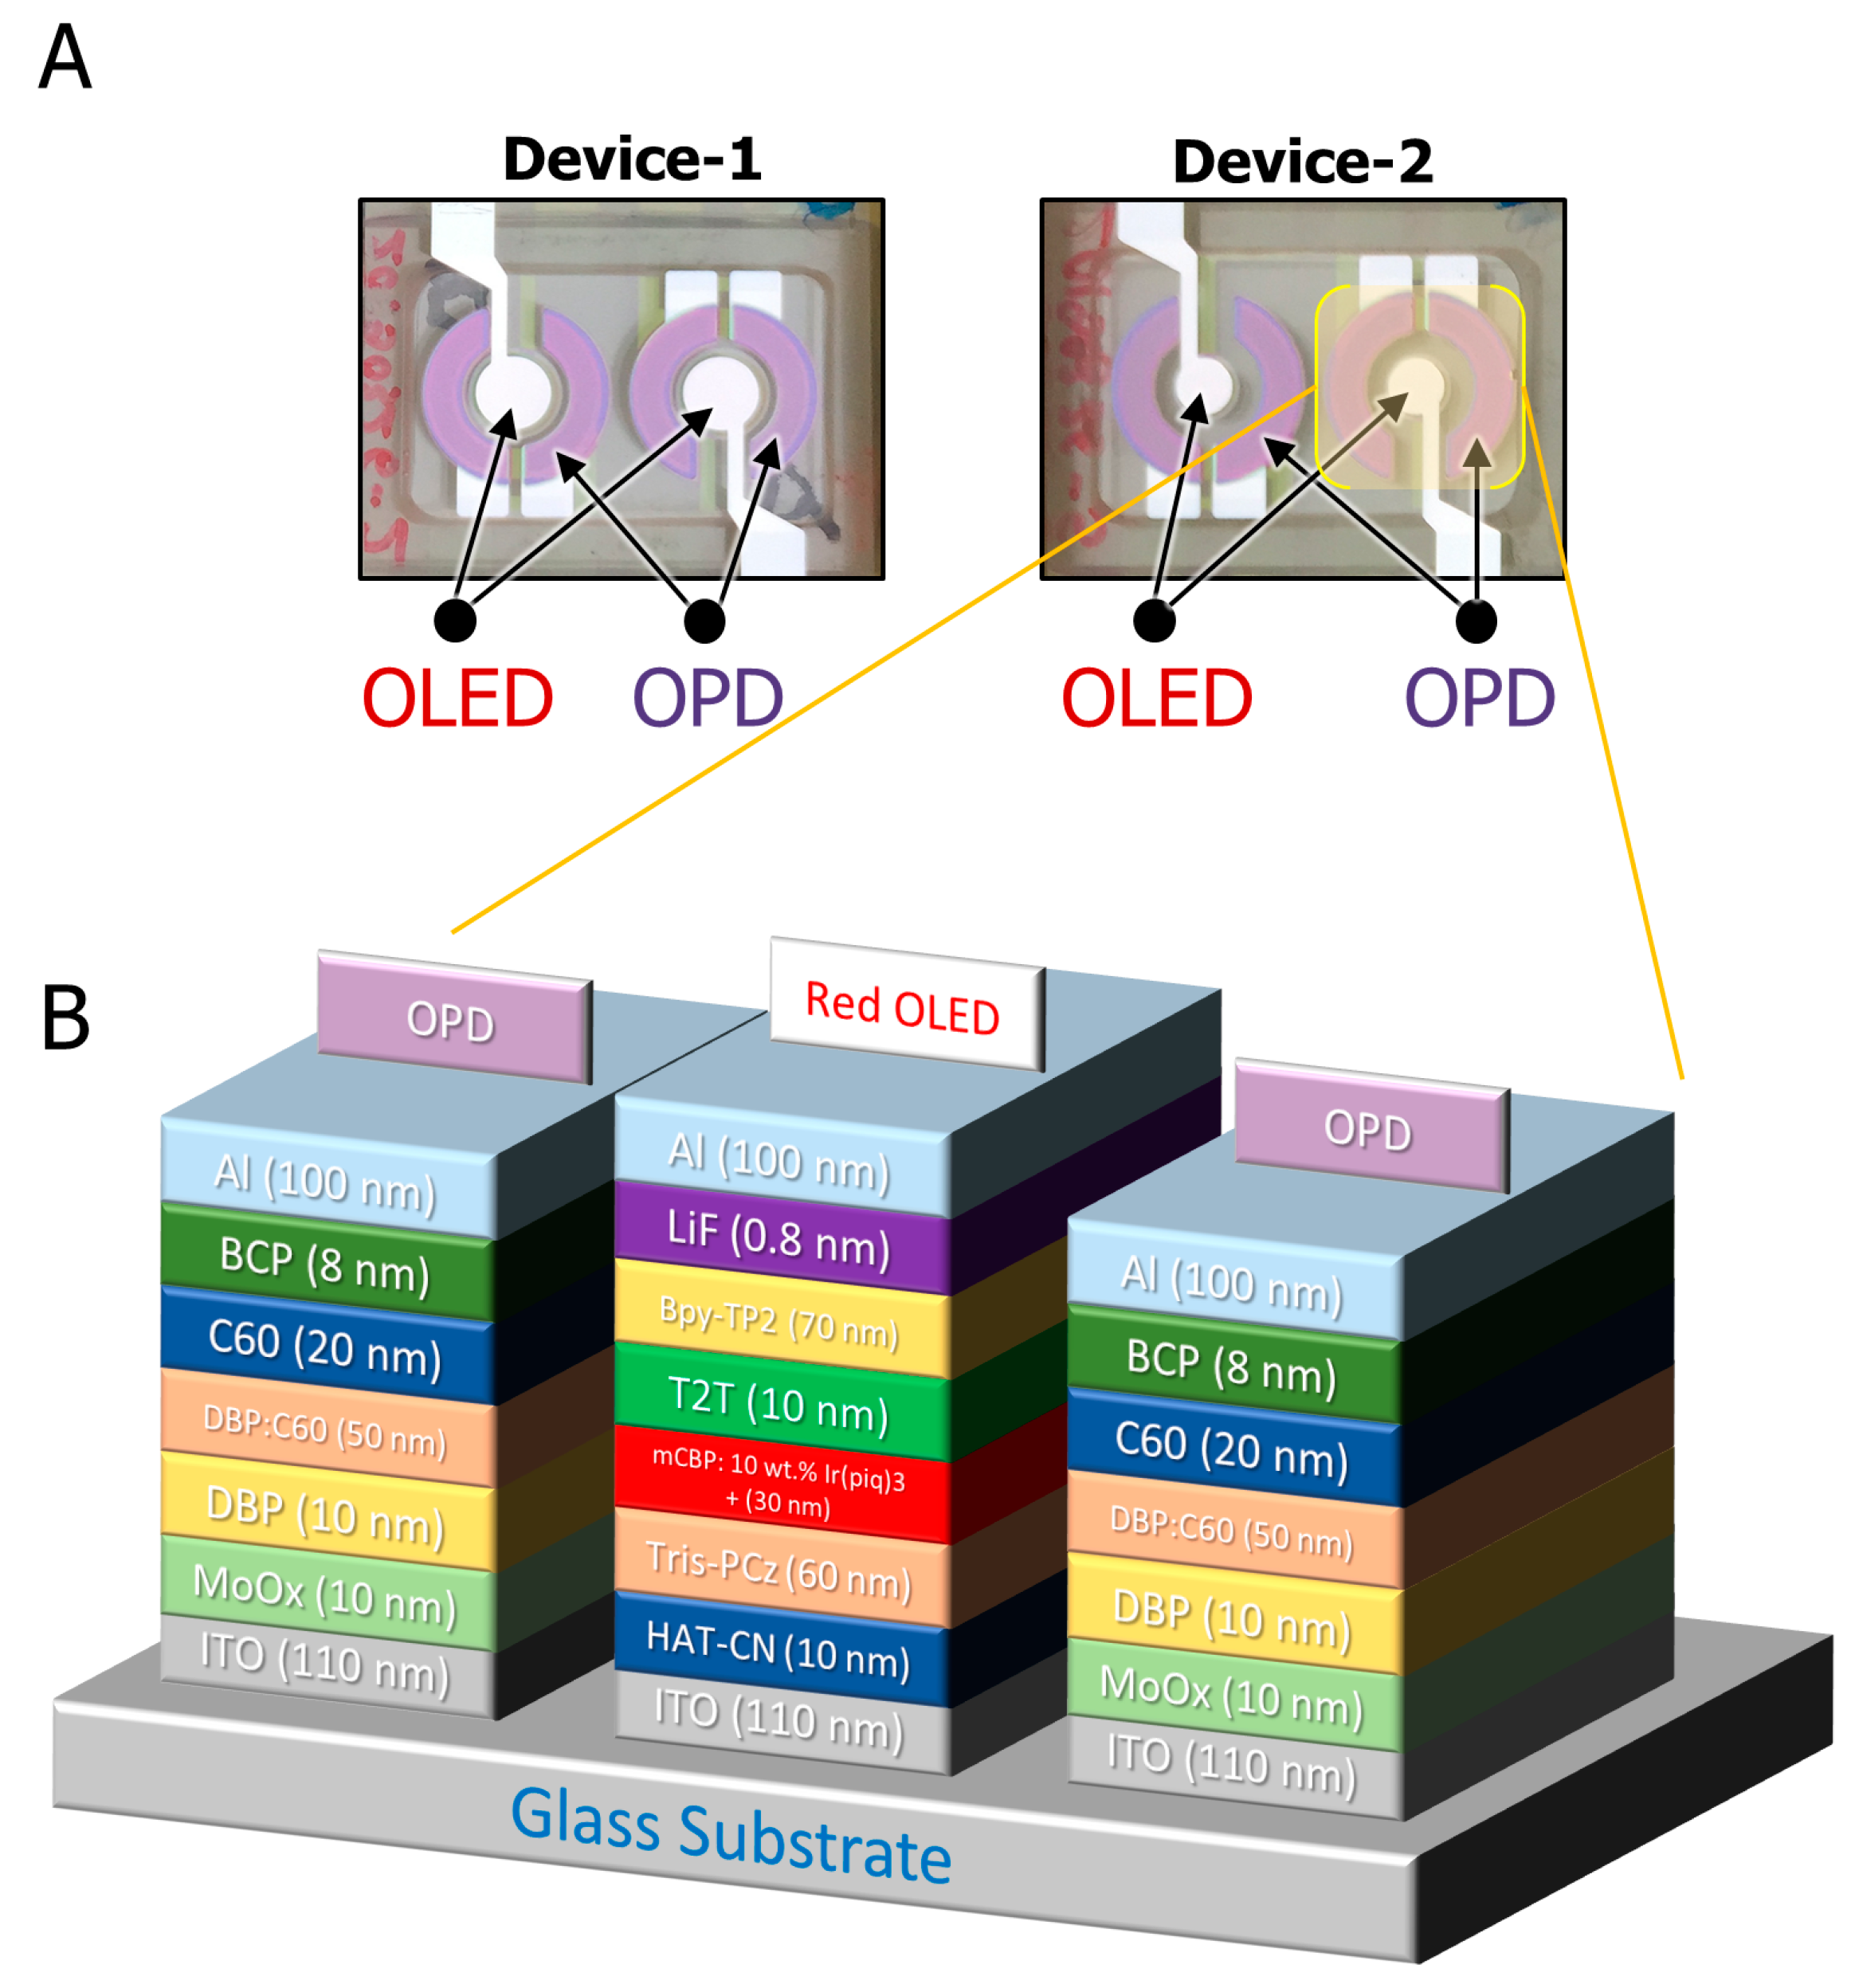
2.2. The Organic Optoelectronic Device
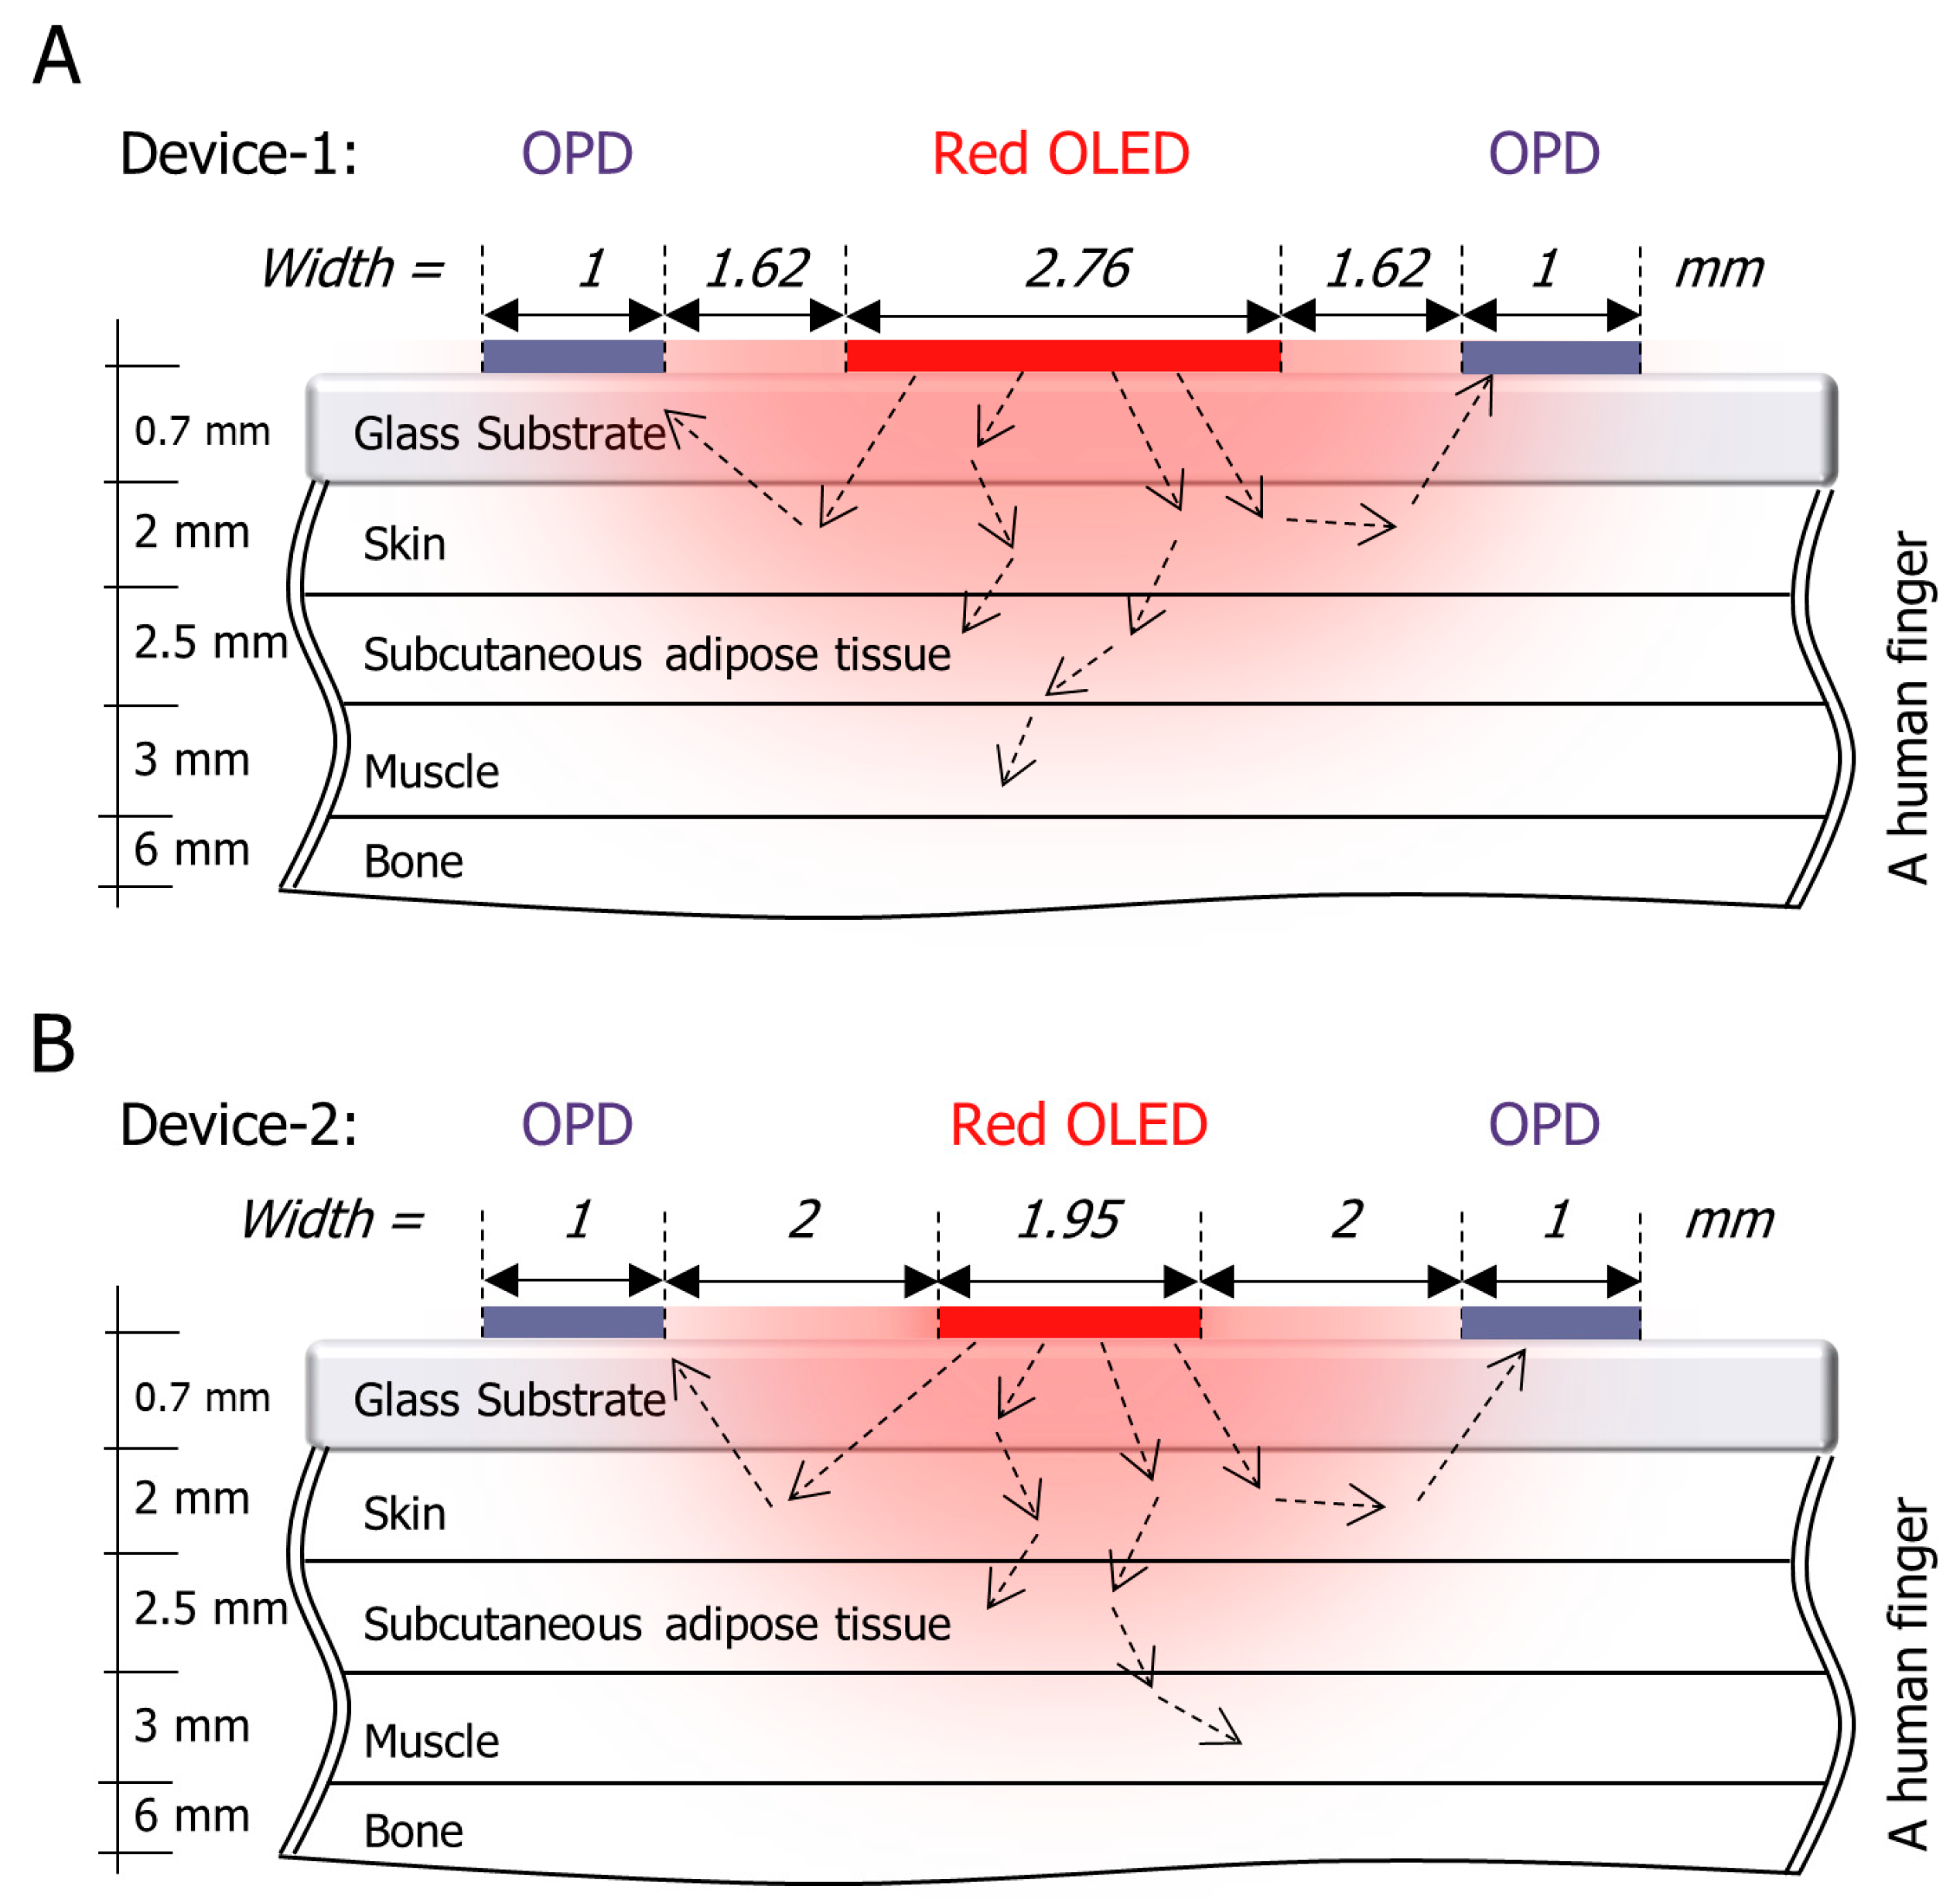
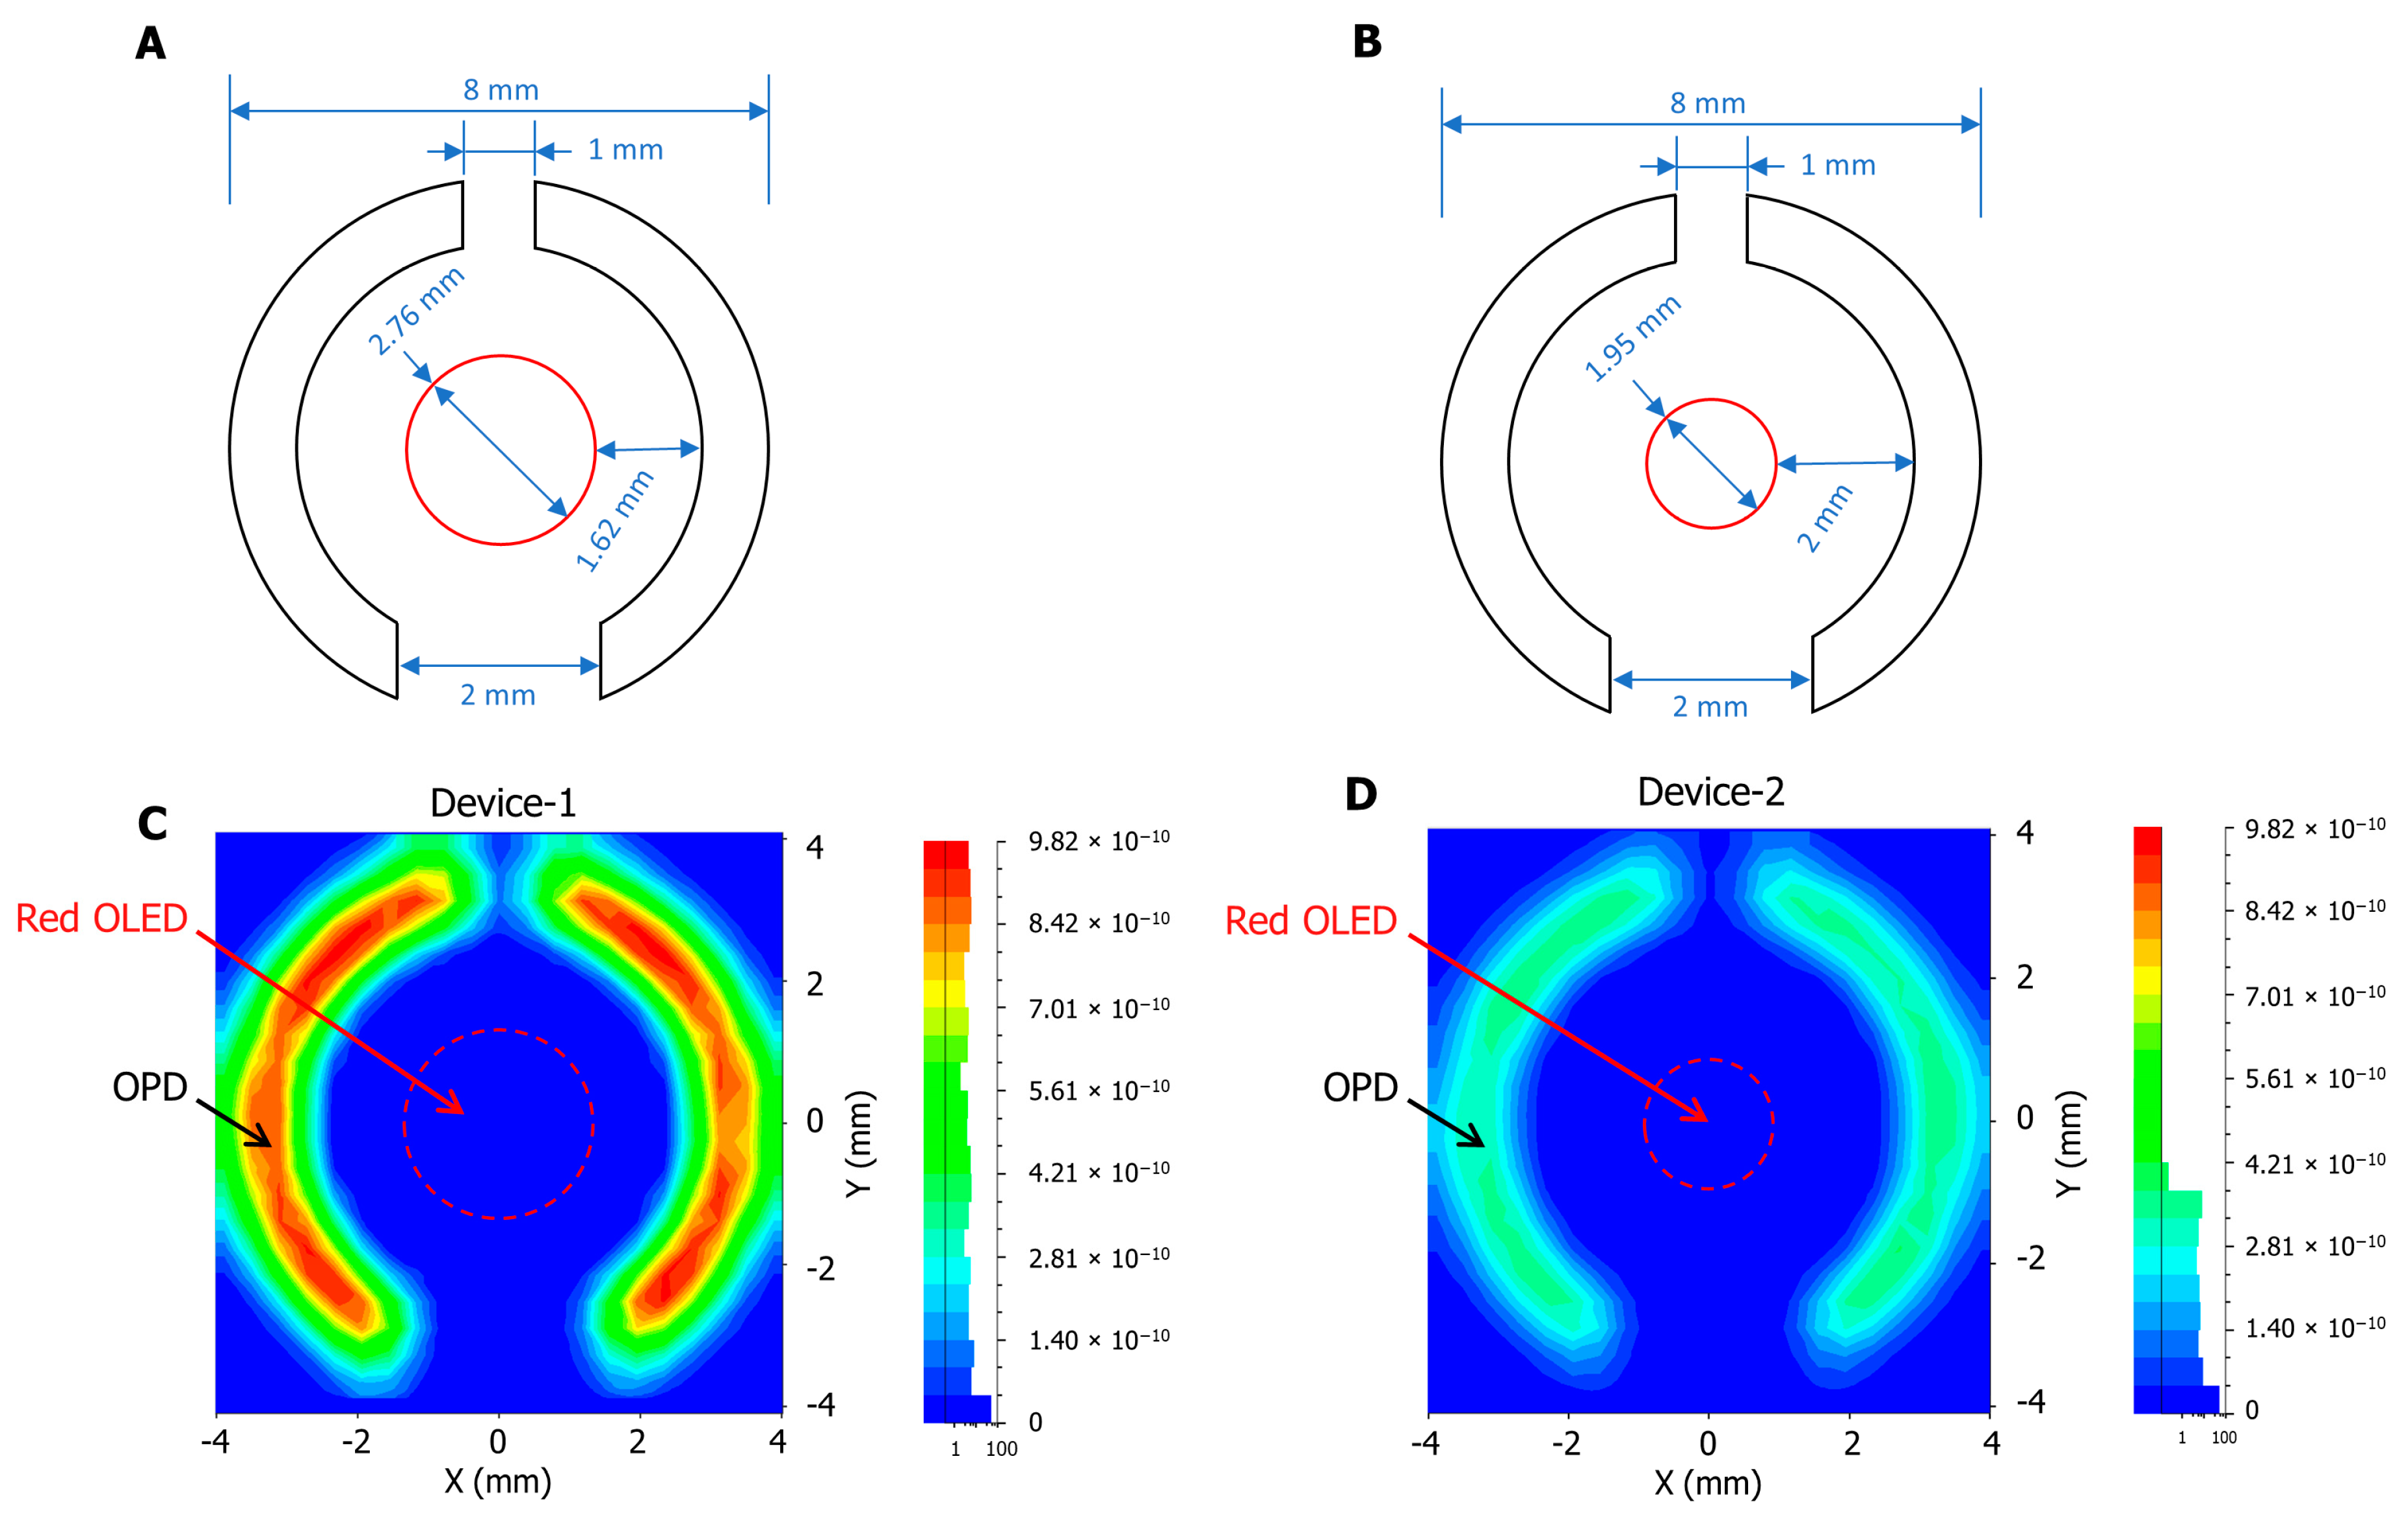
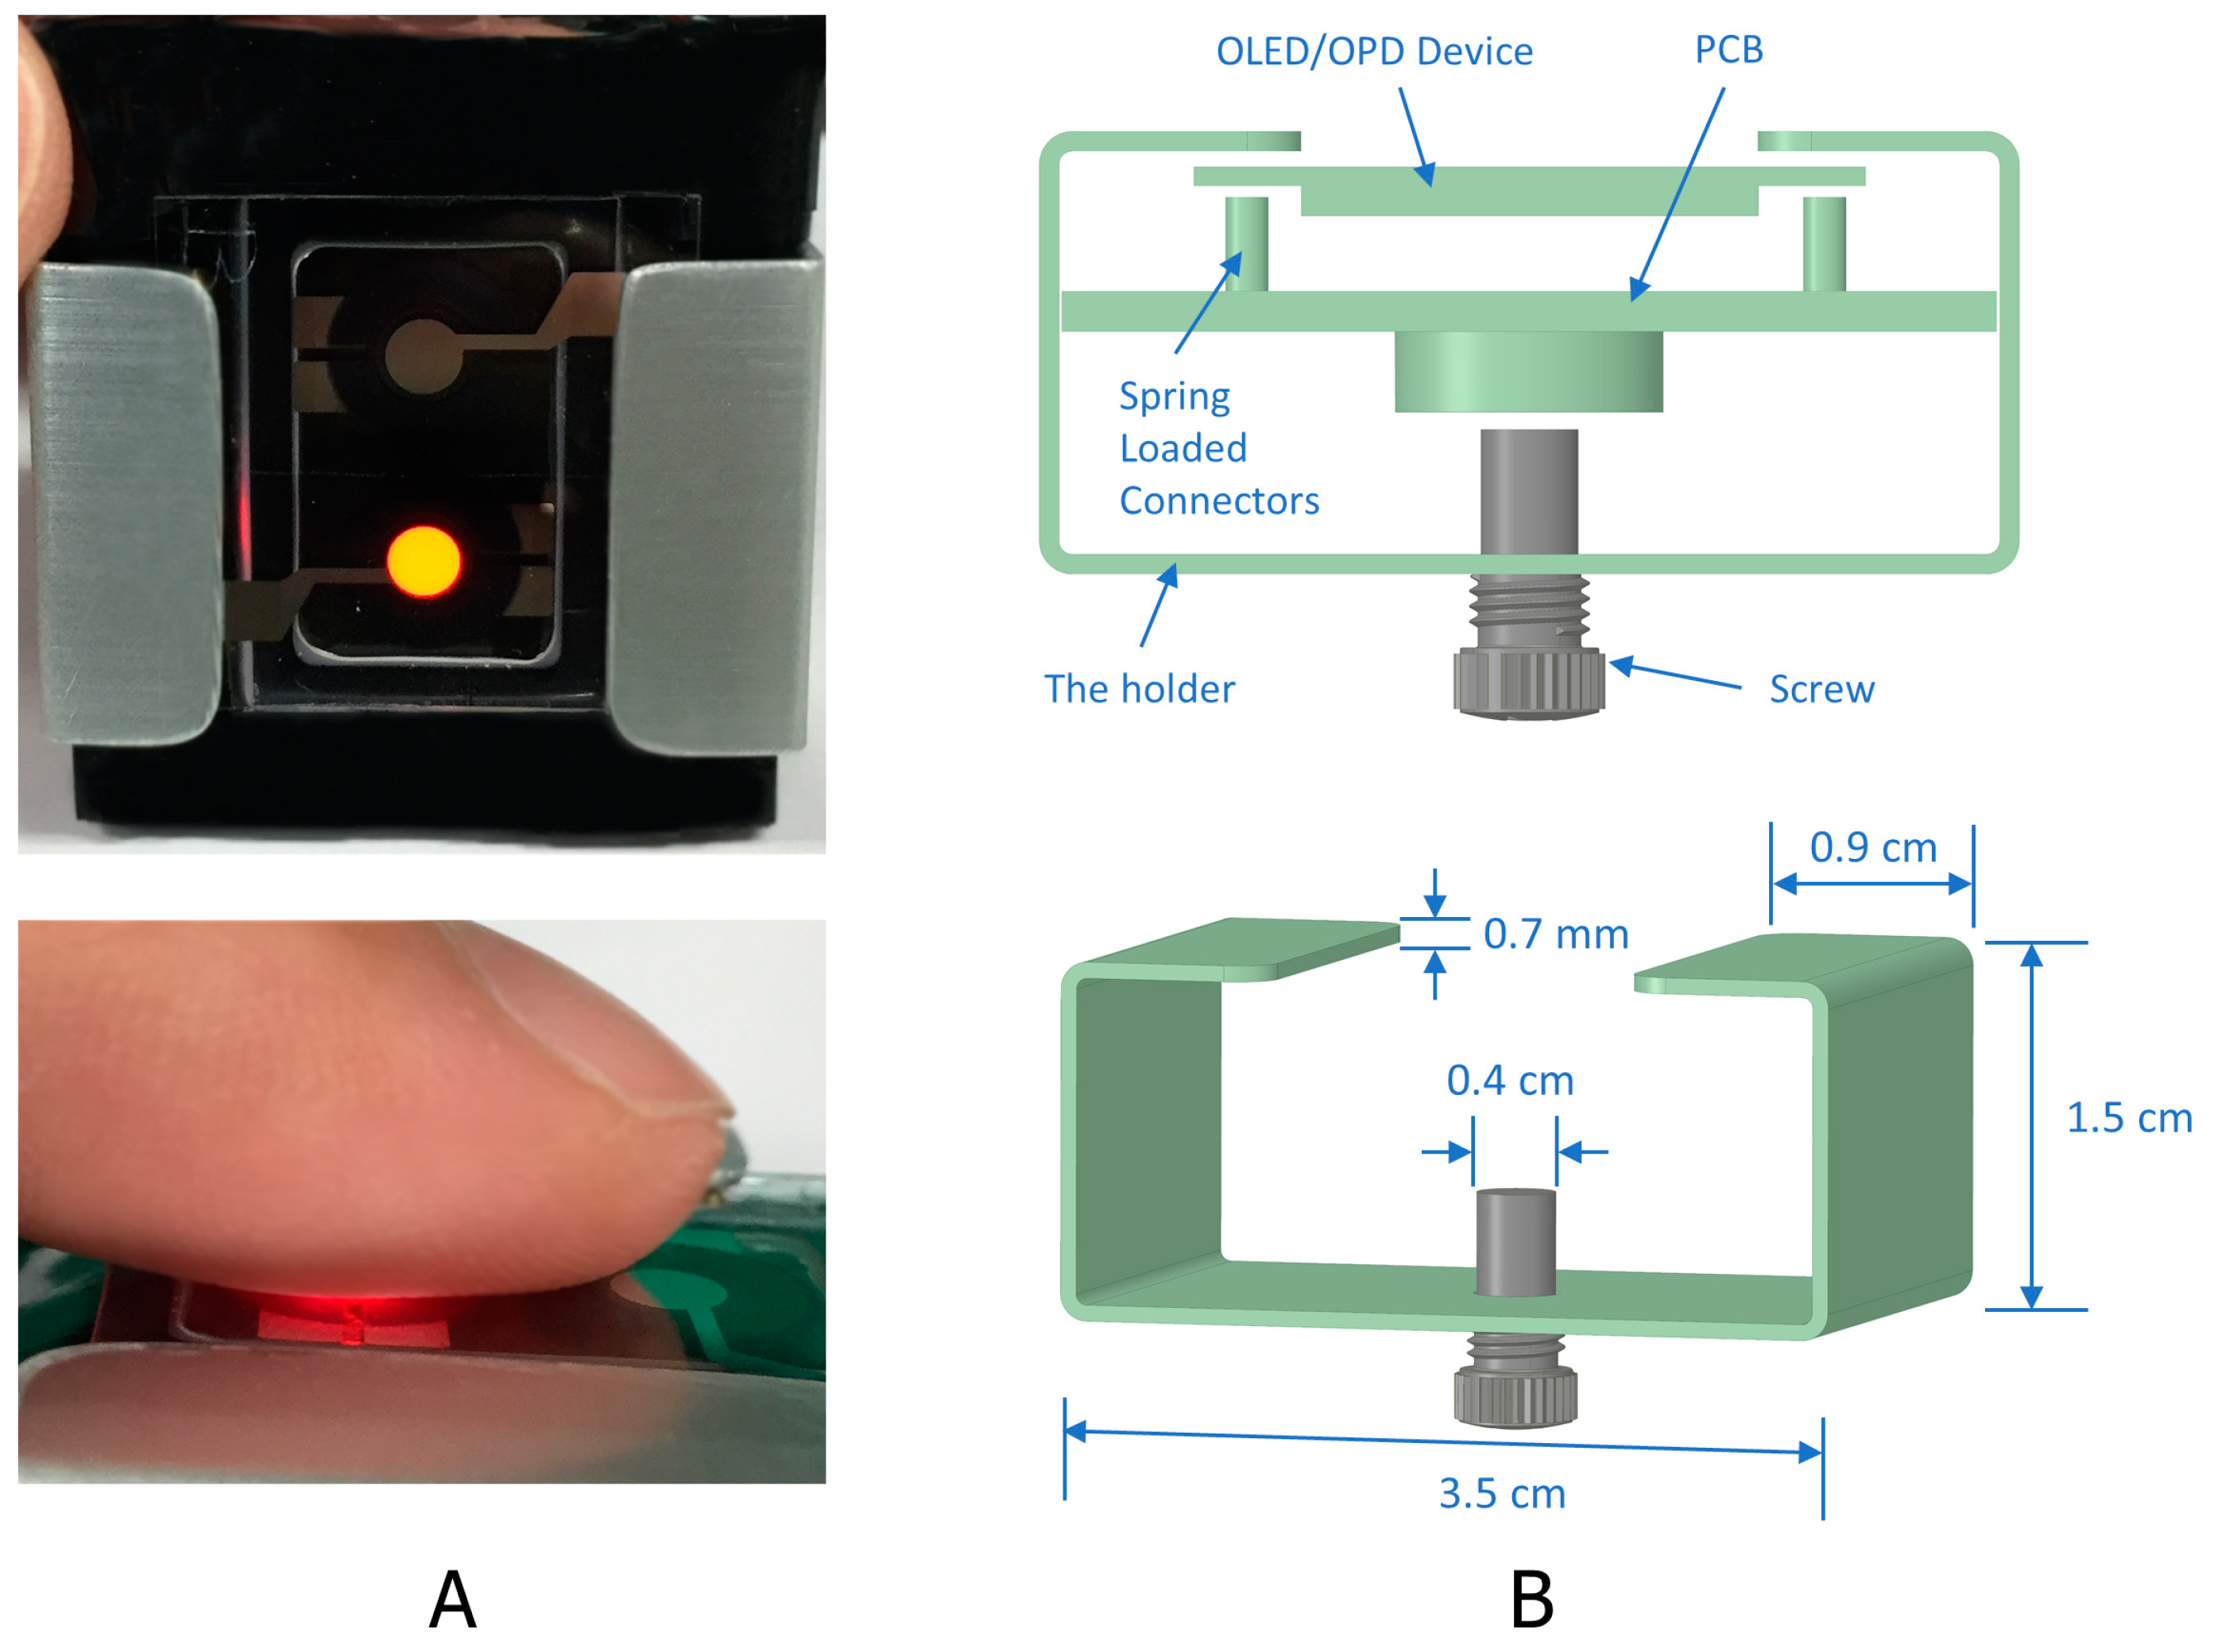
2.3. The Device Structure
3. Results and Discussion
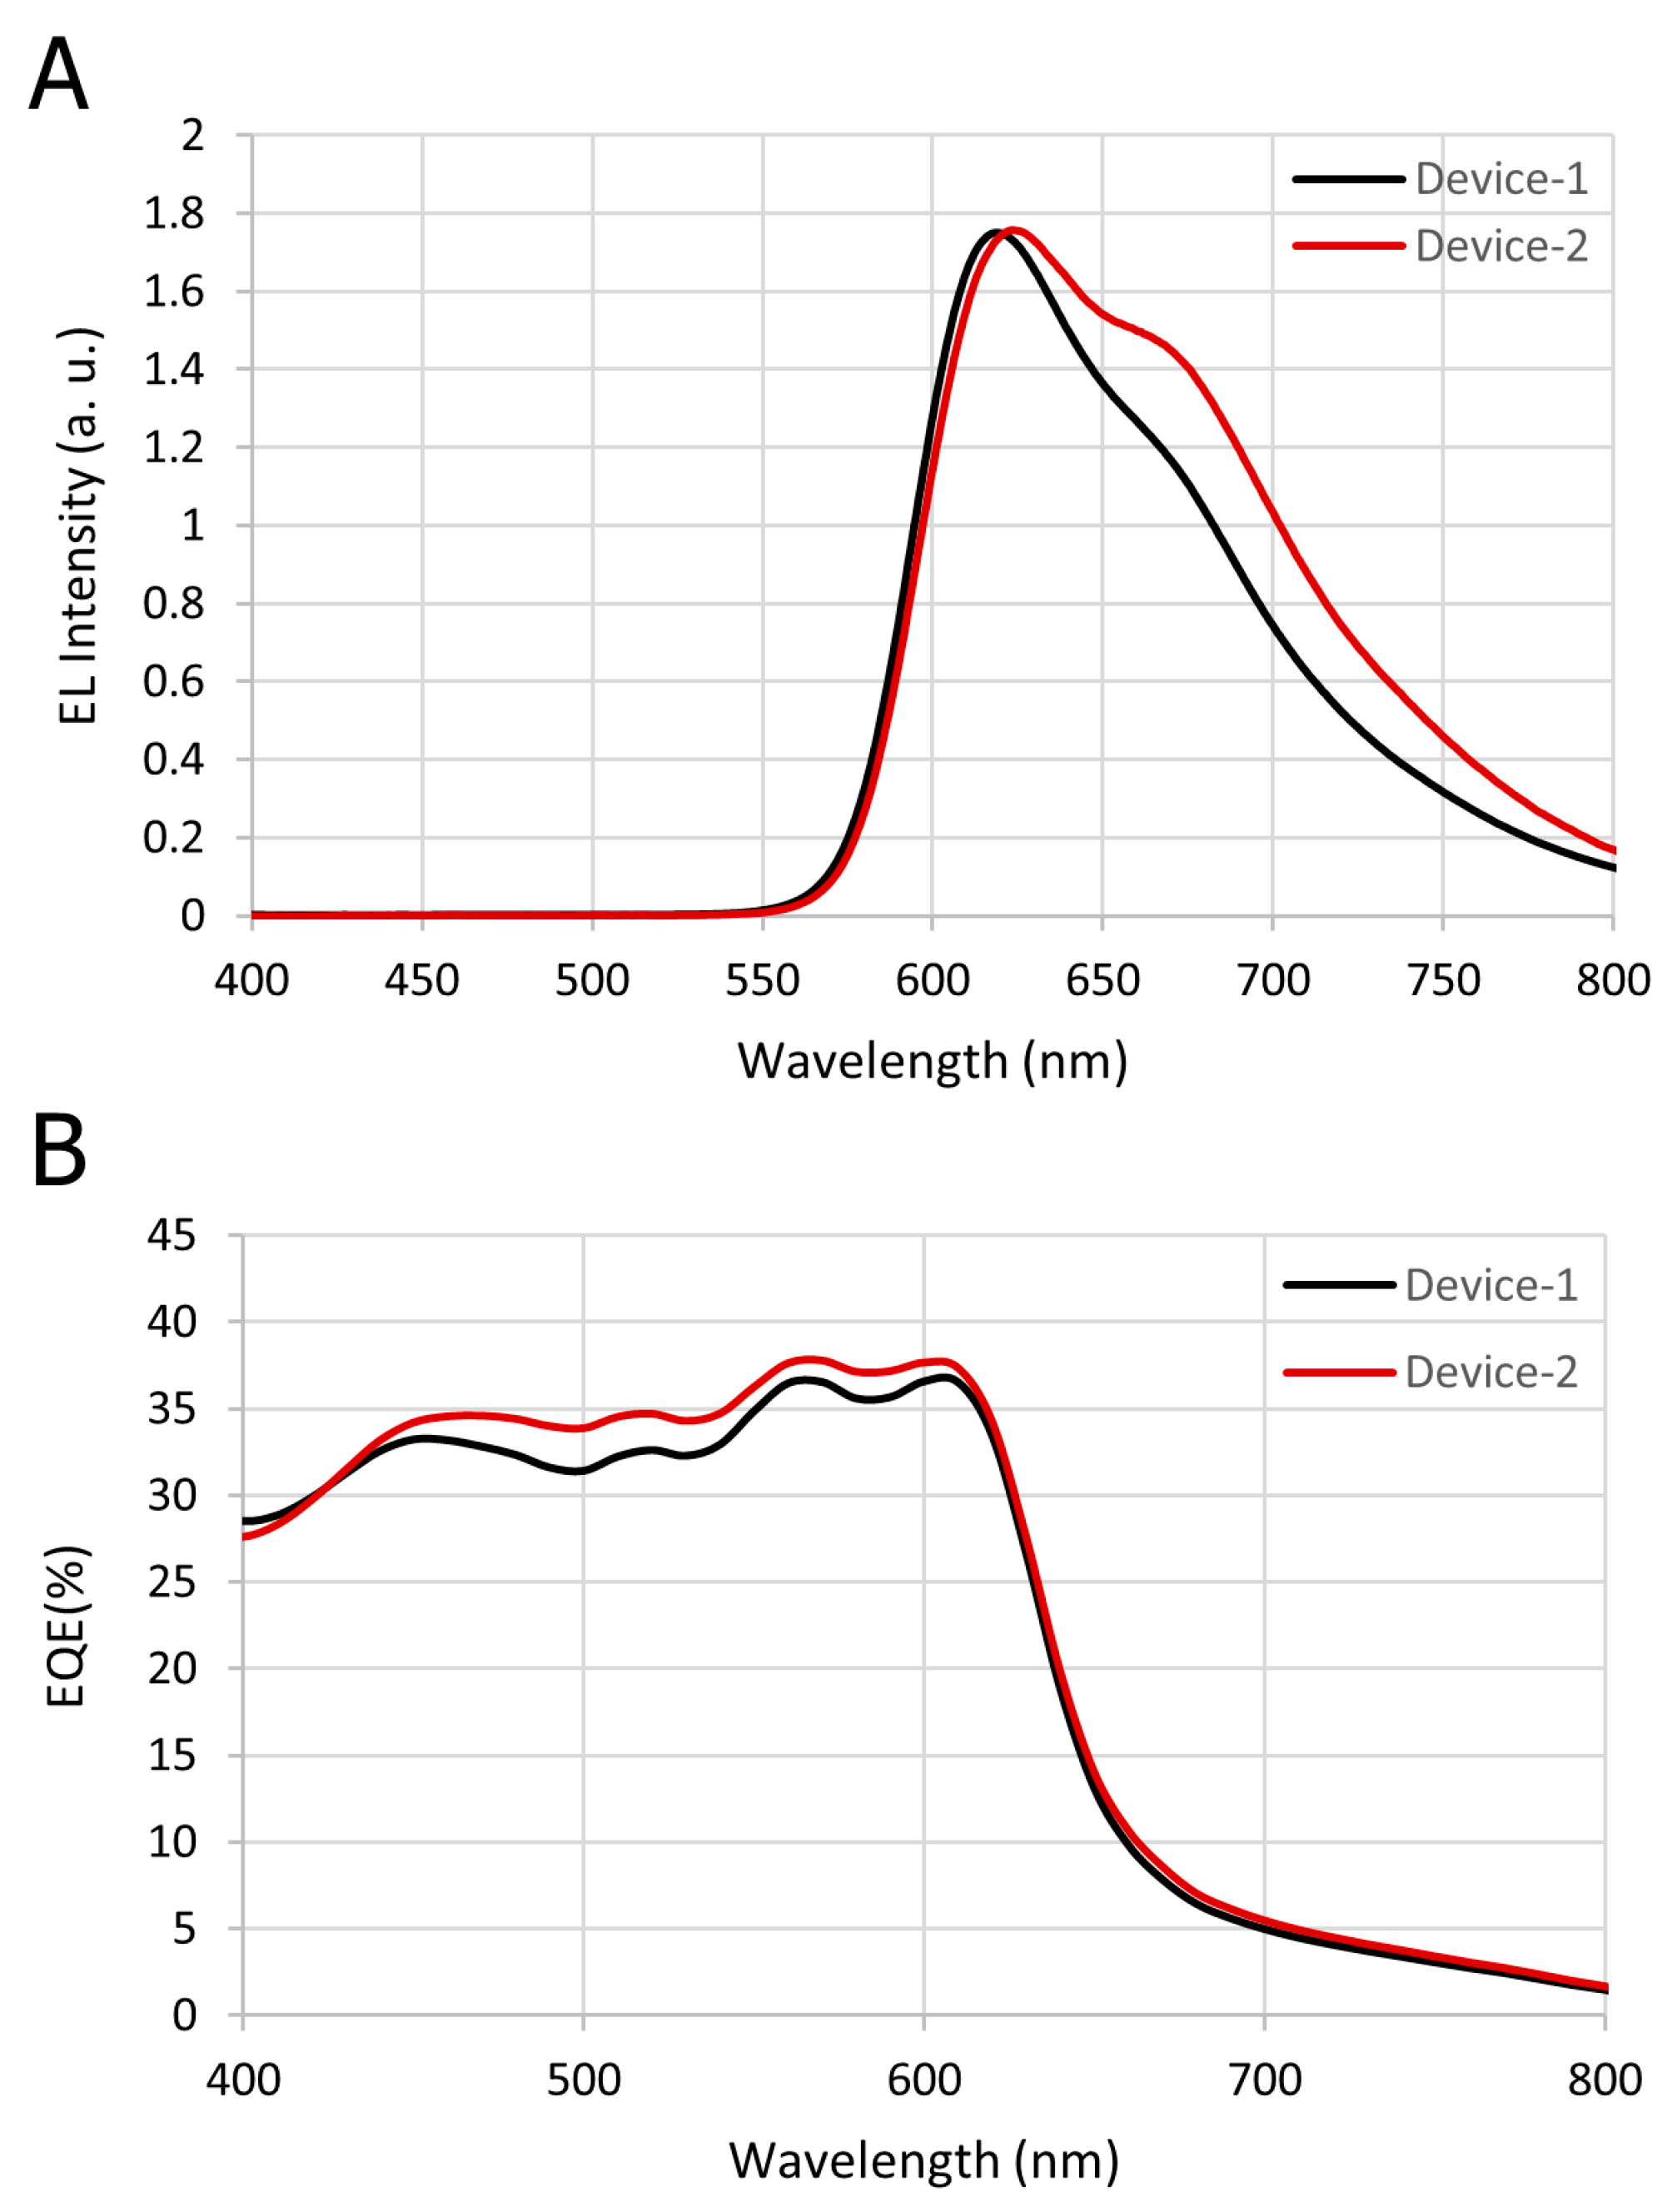
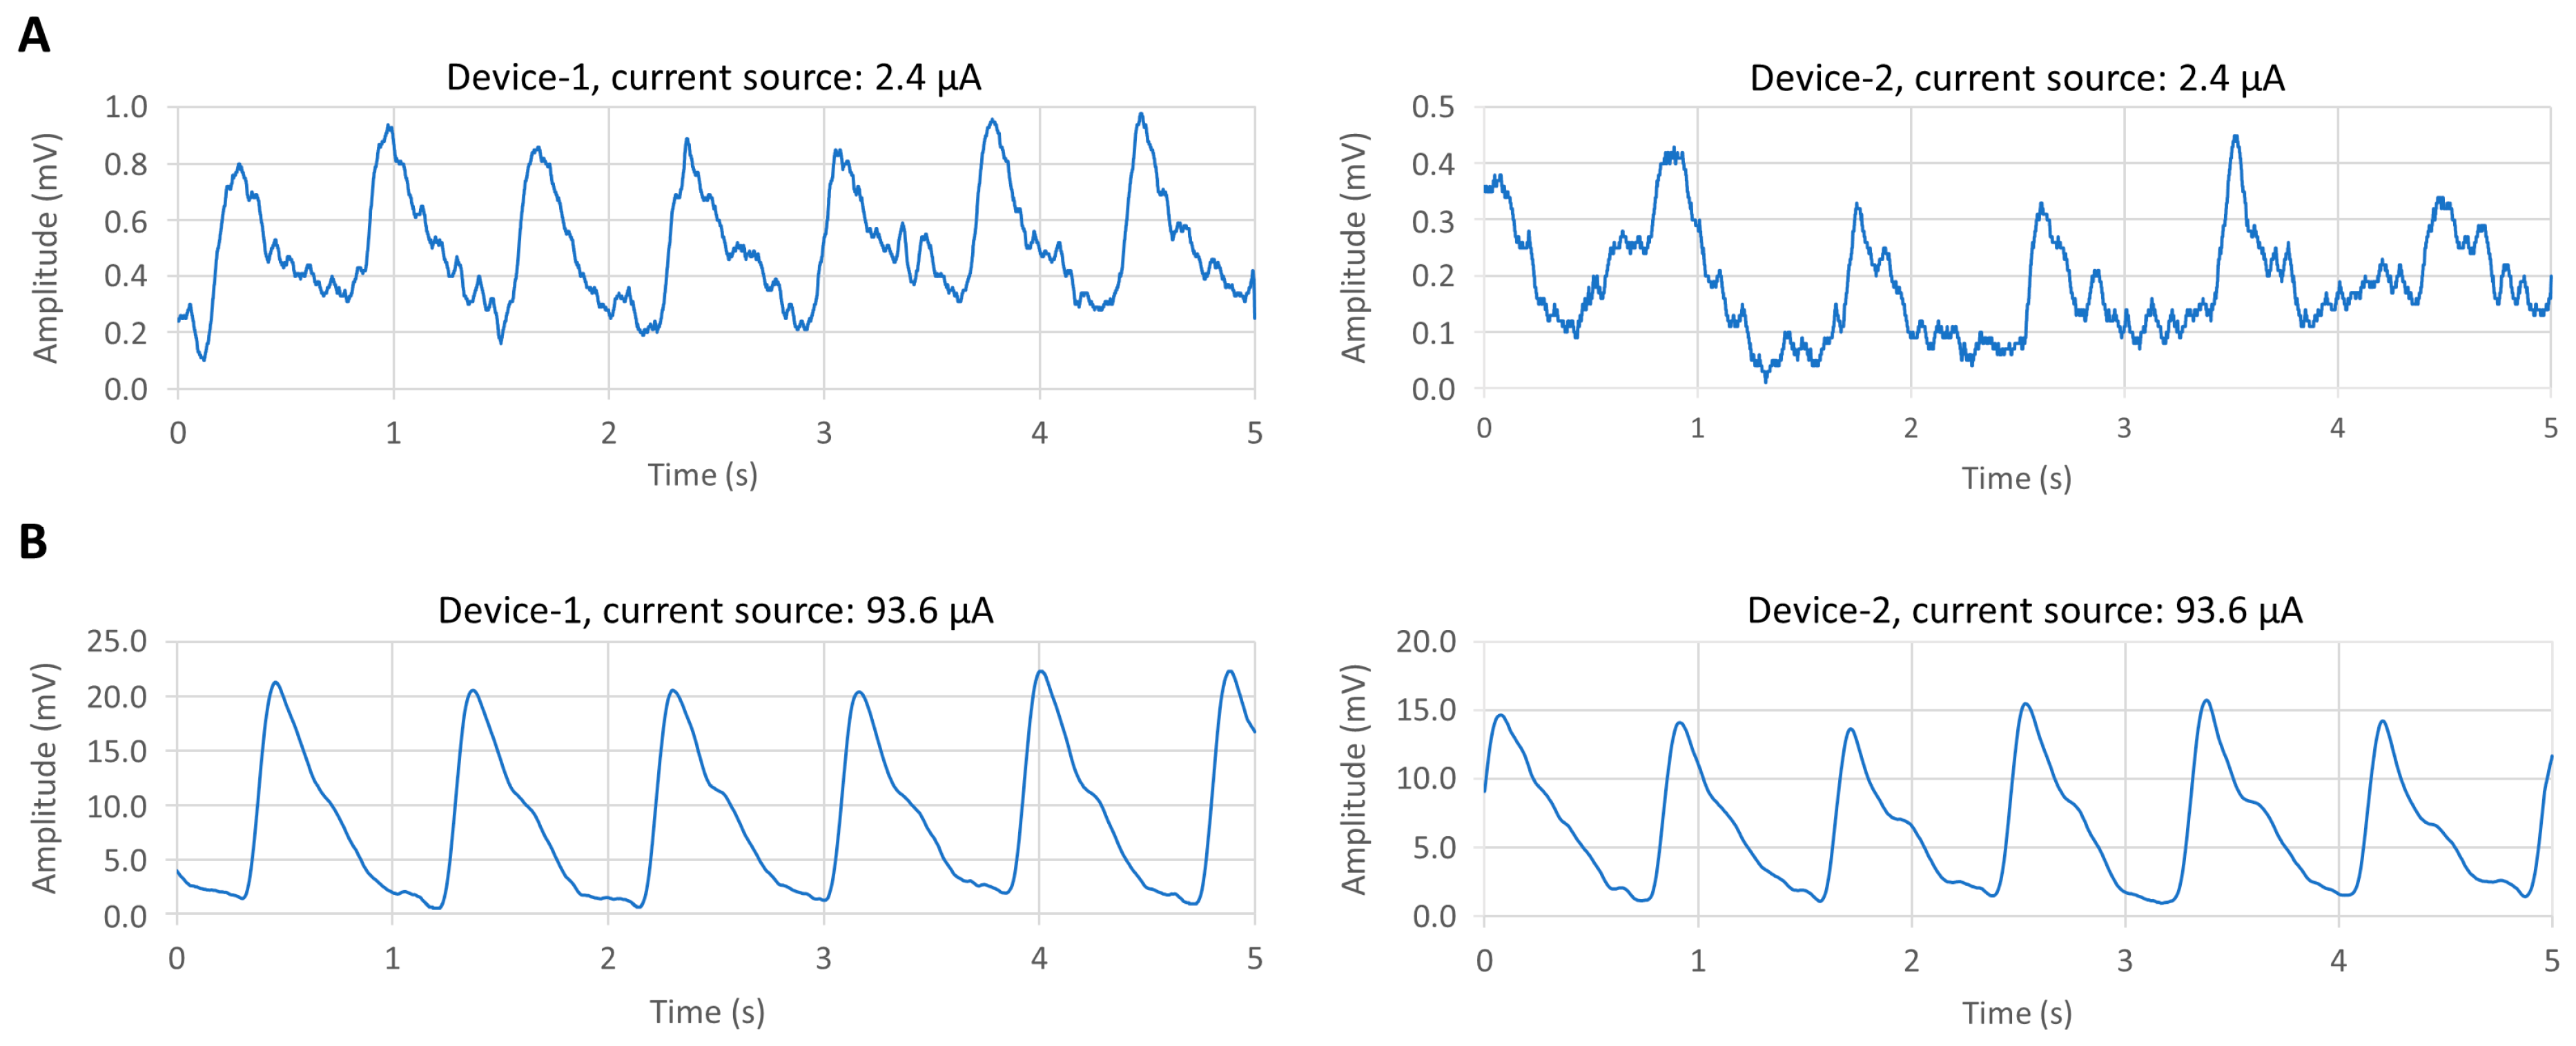
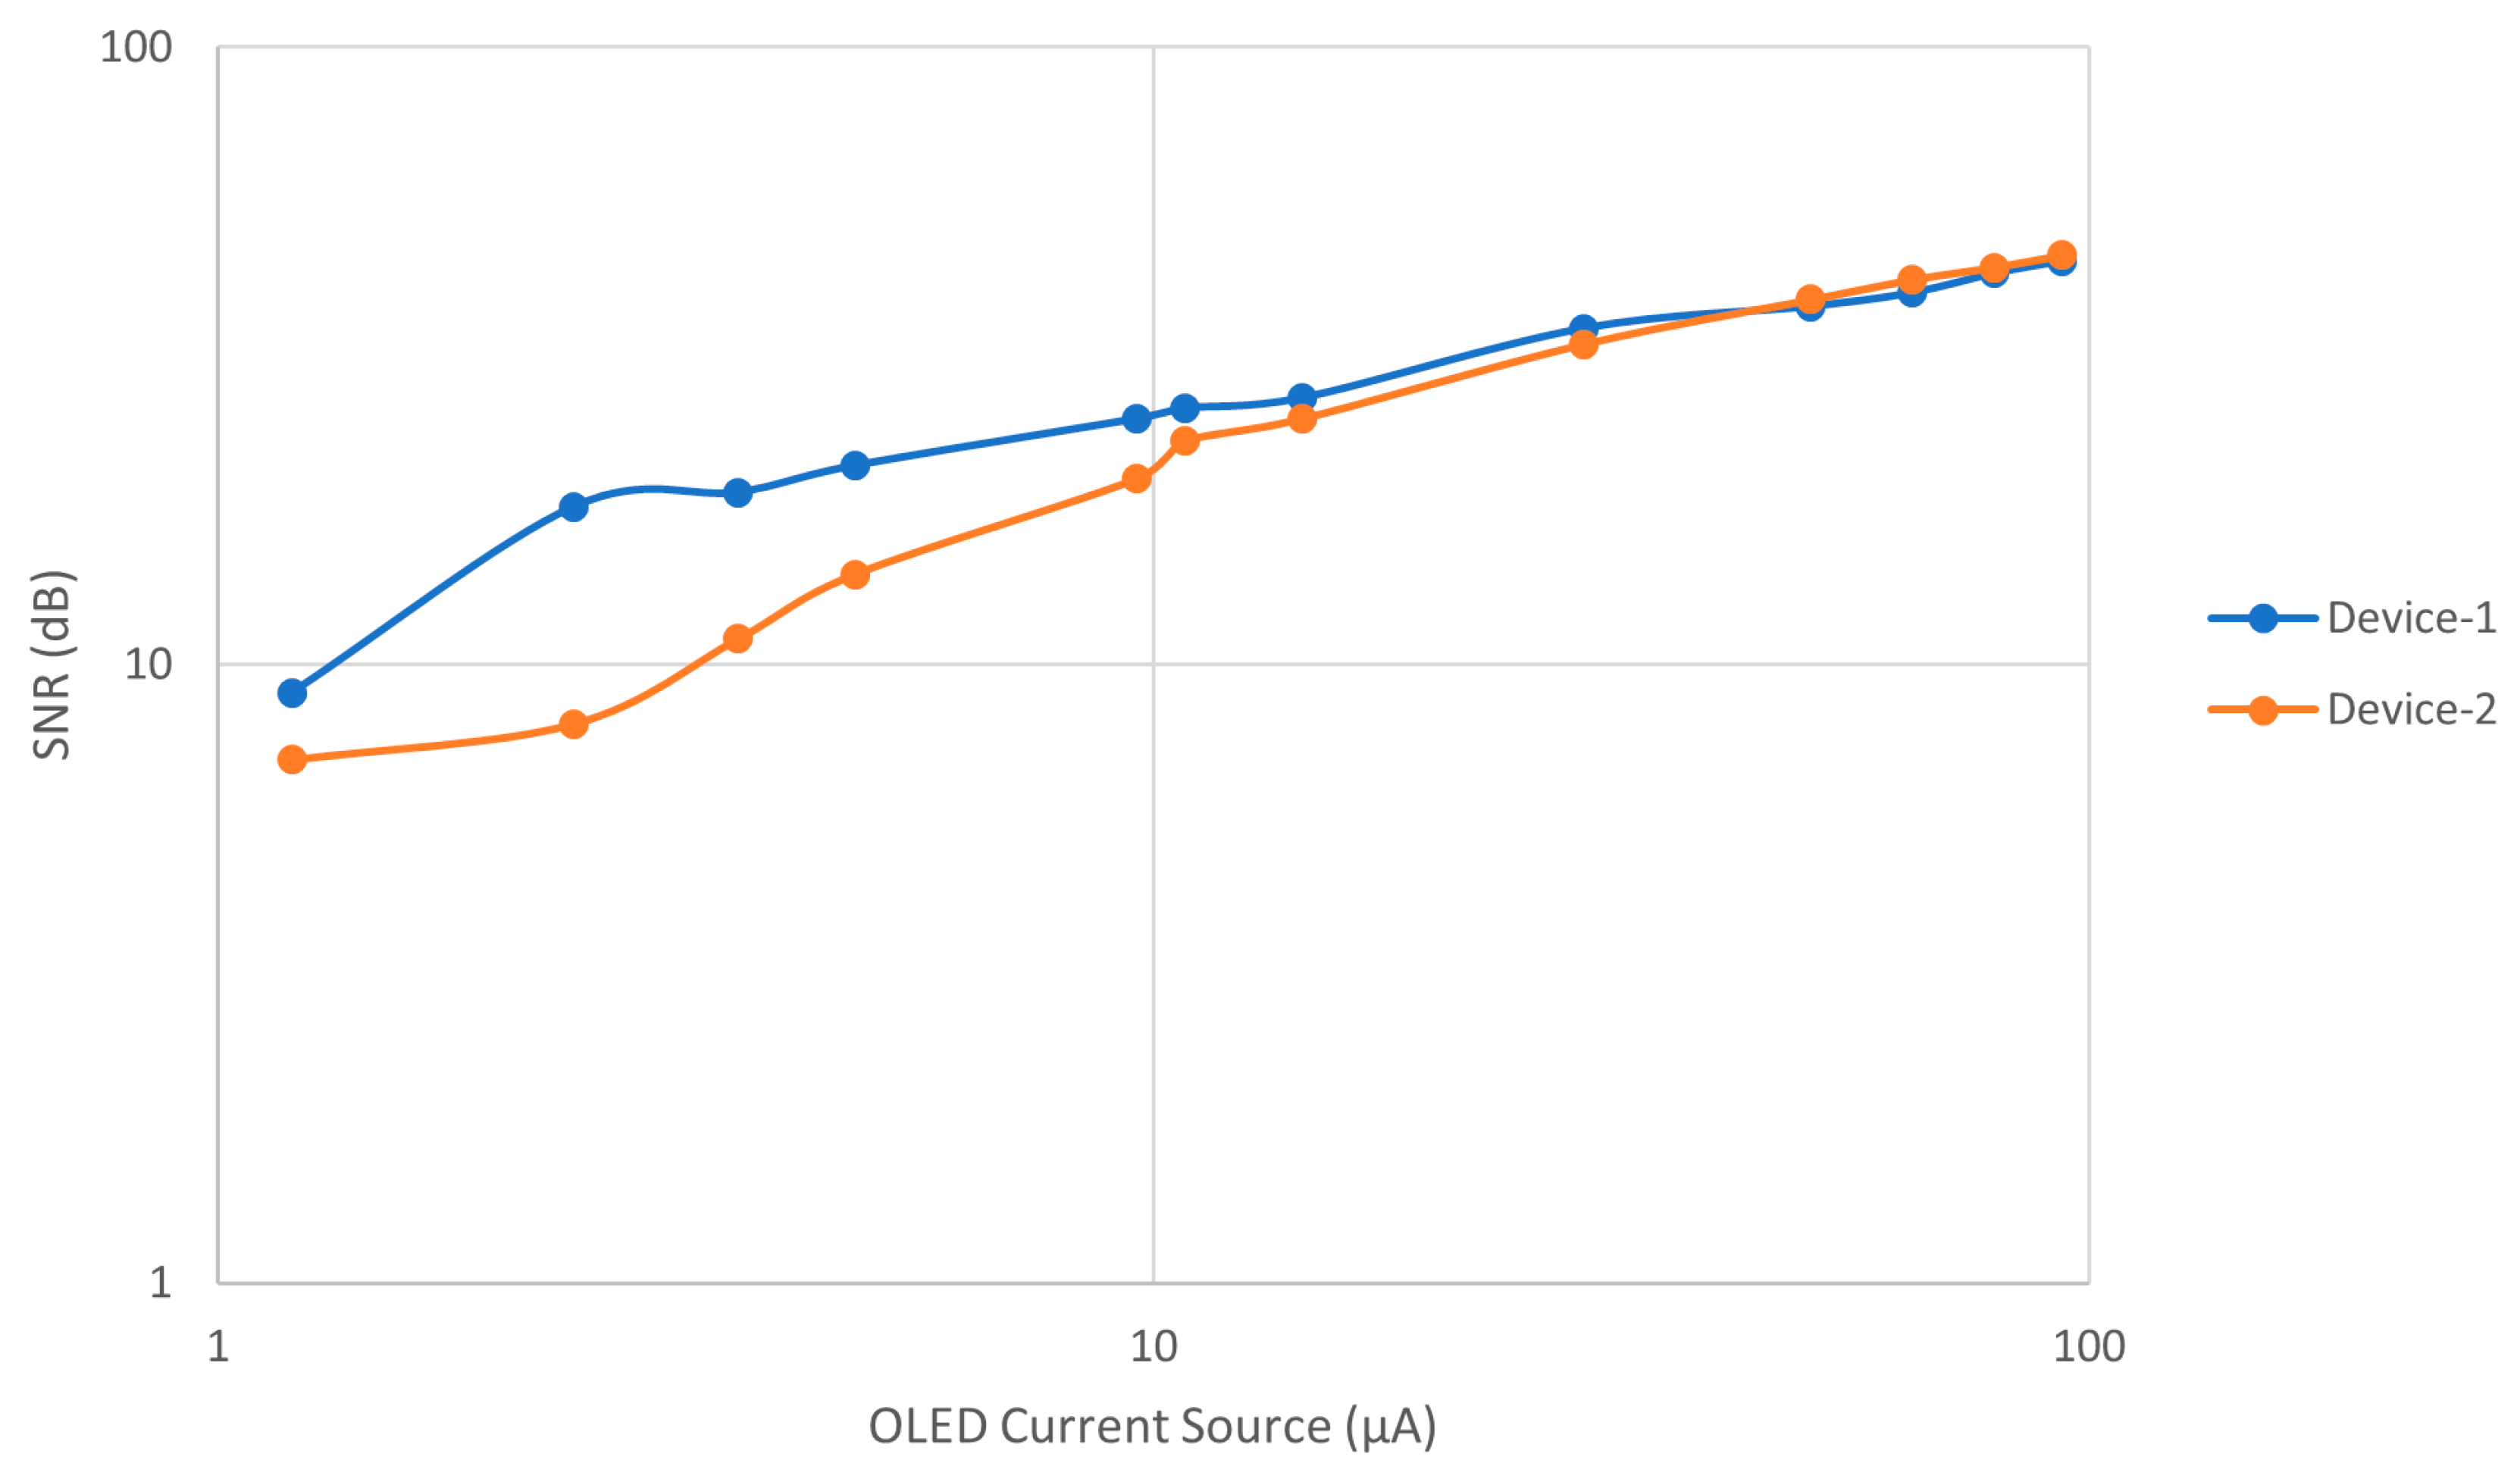
3.1. Comparative Results for Device-1 and Device-2
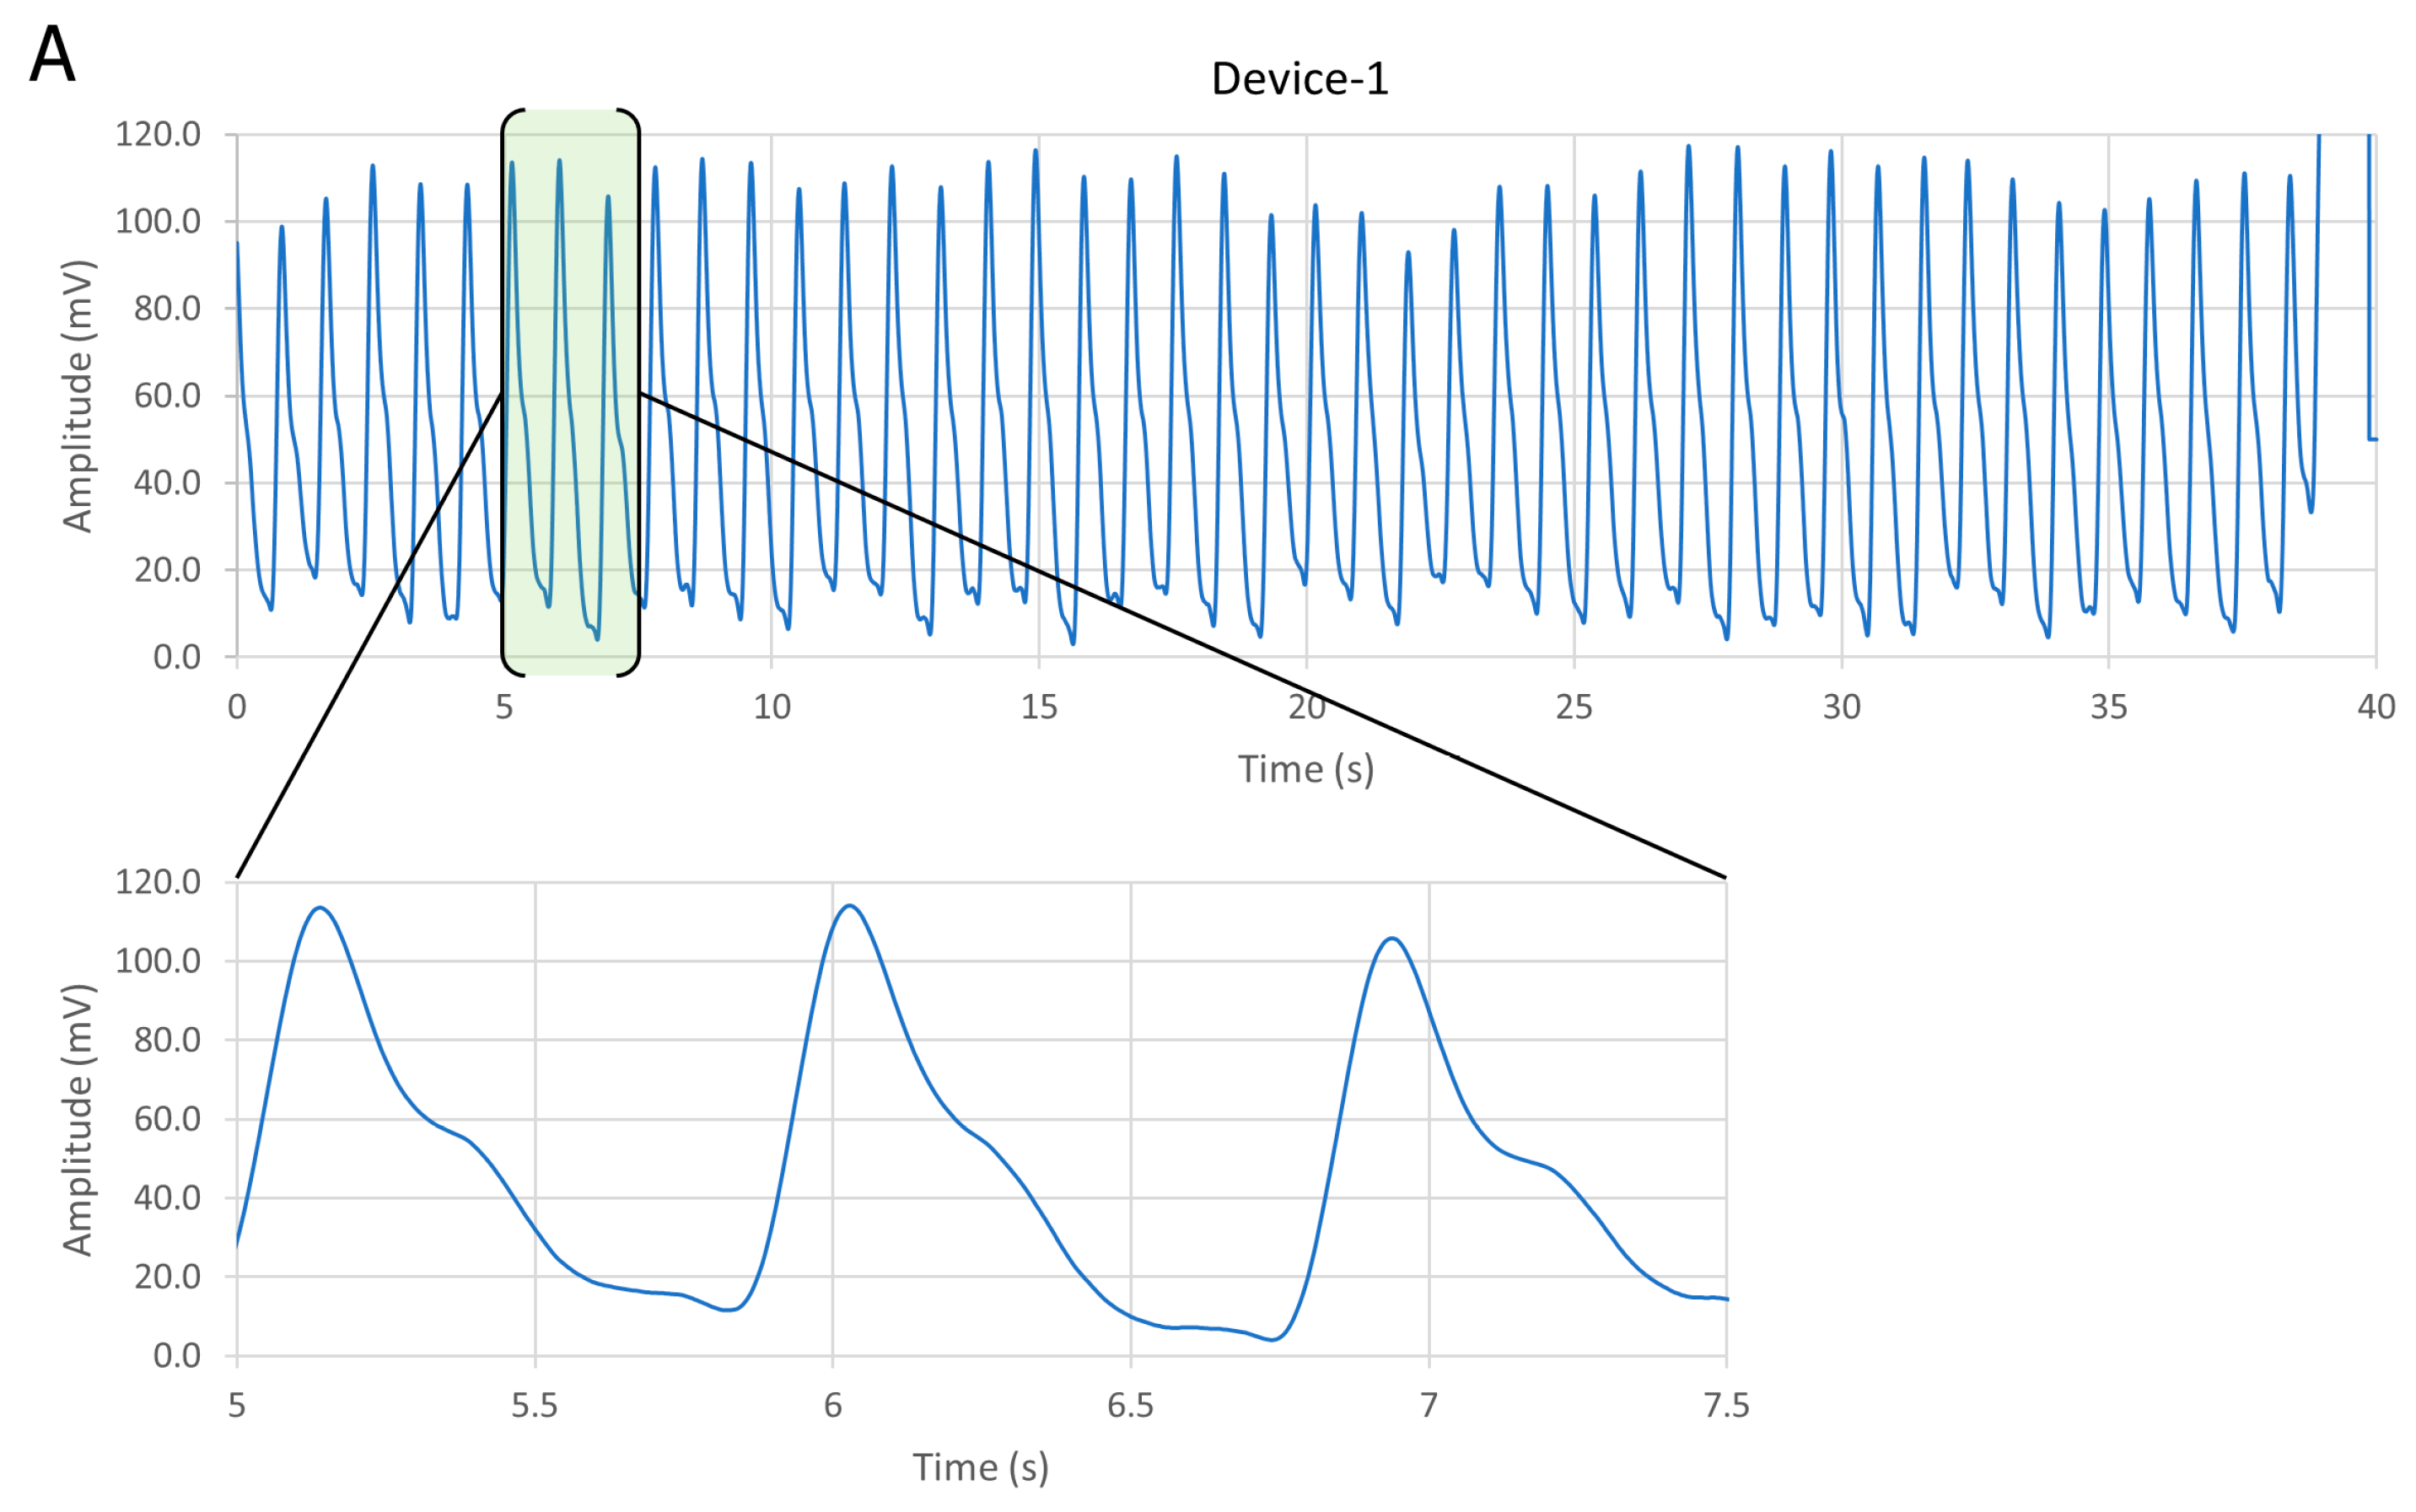
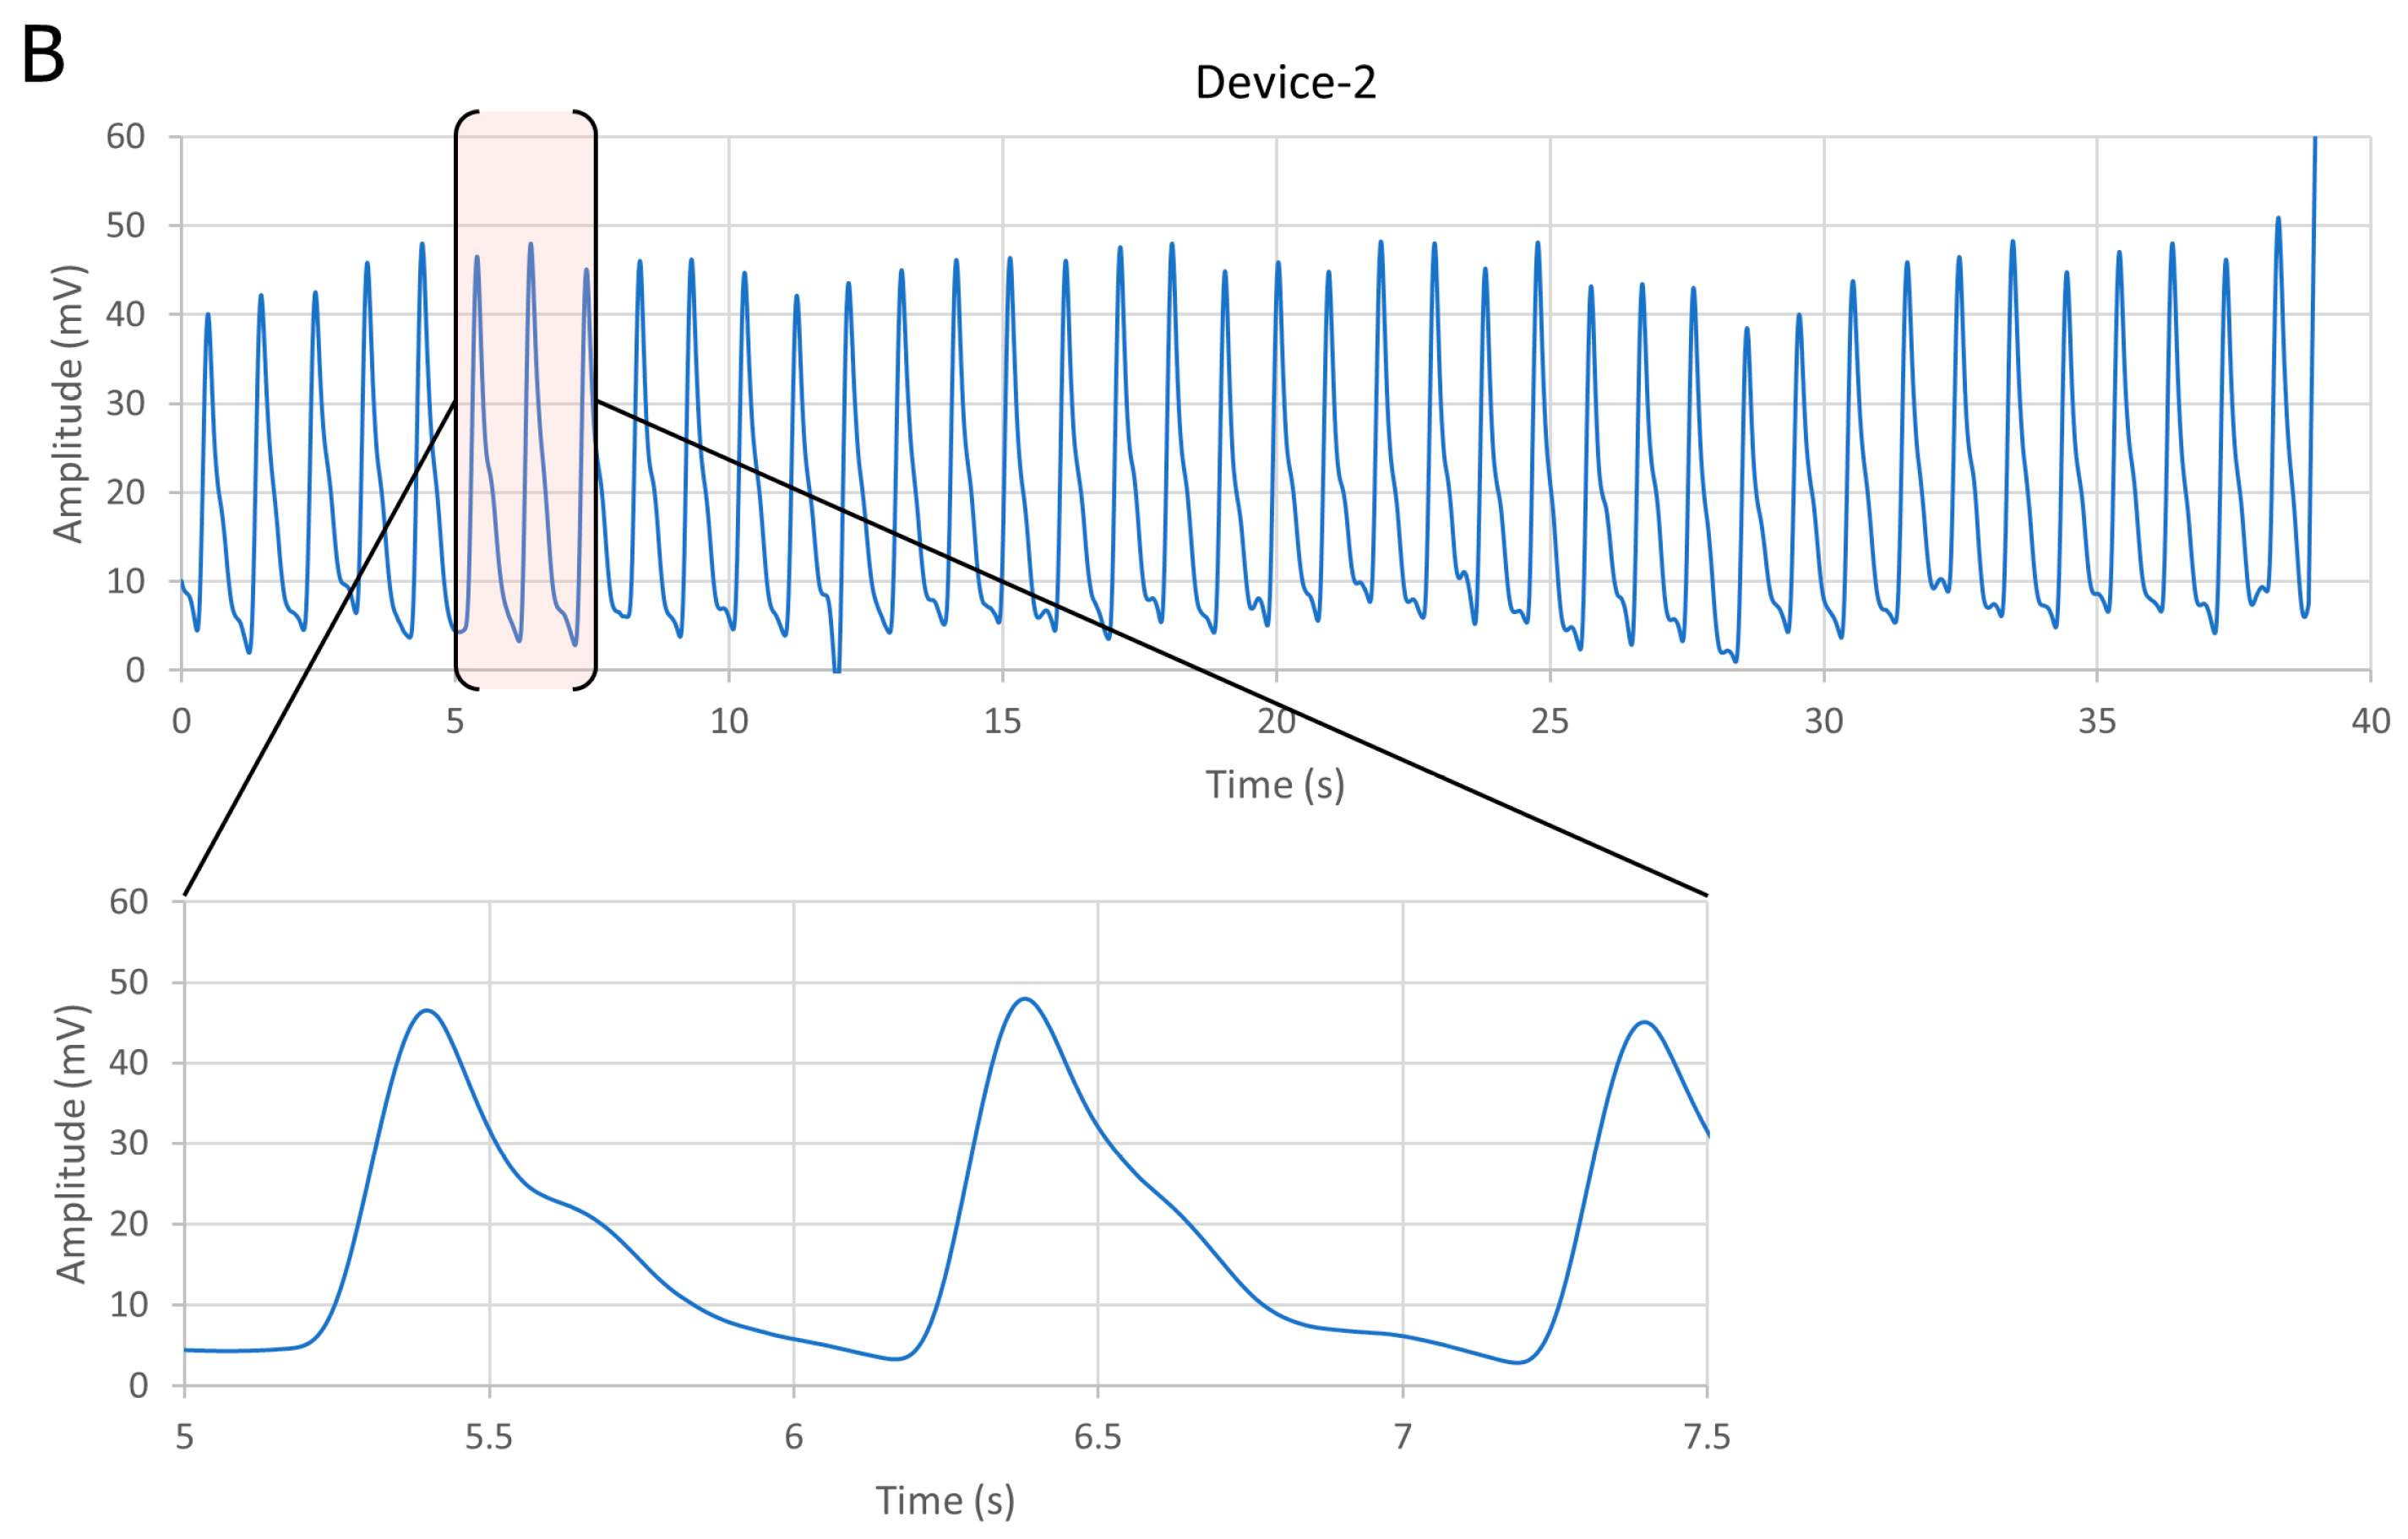
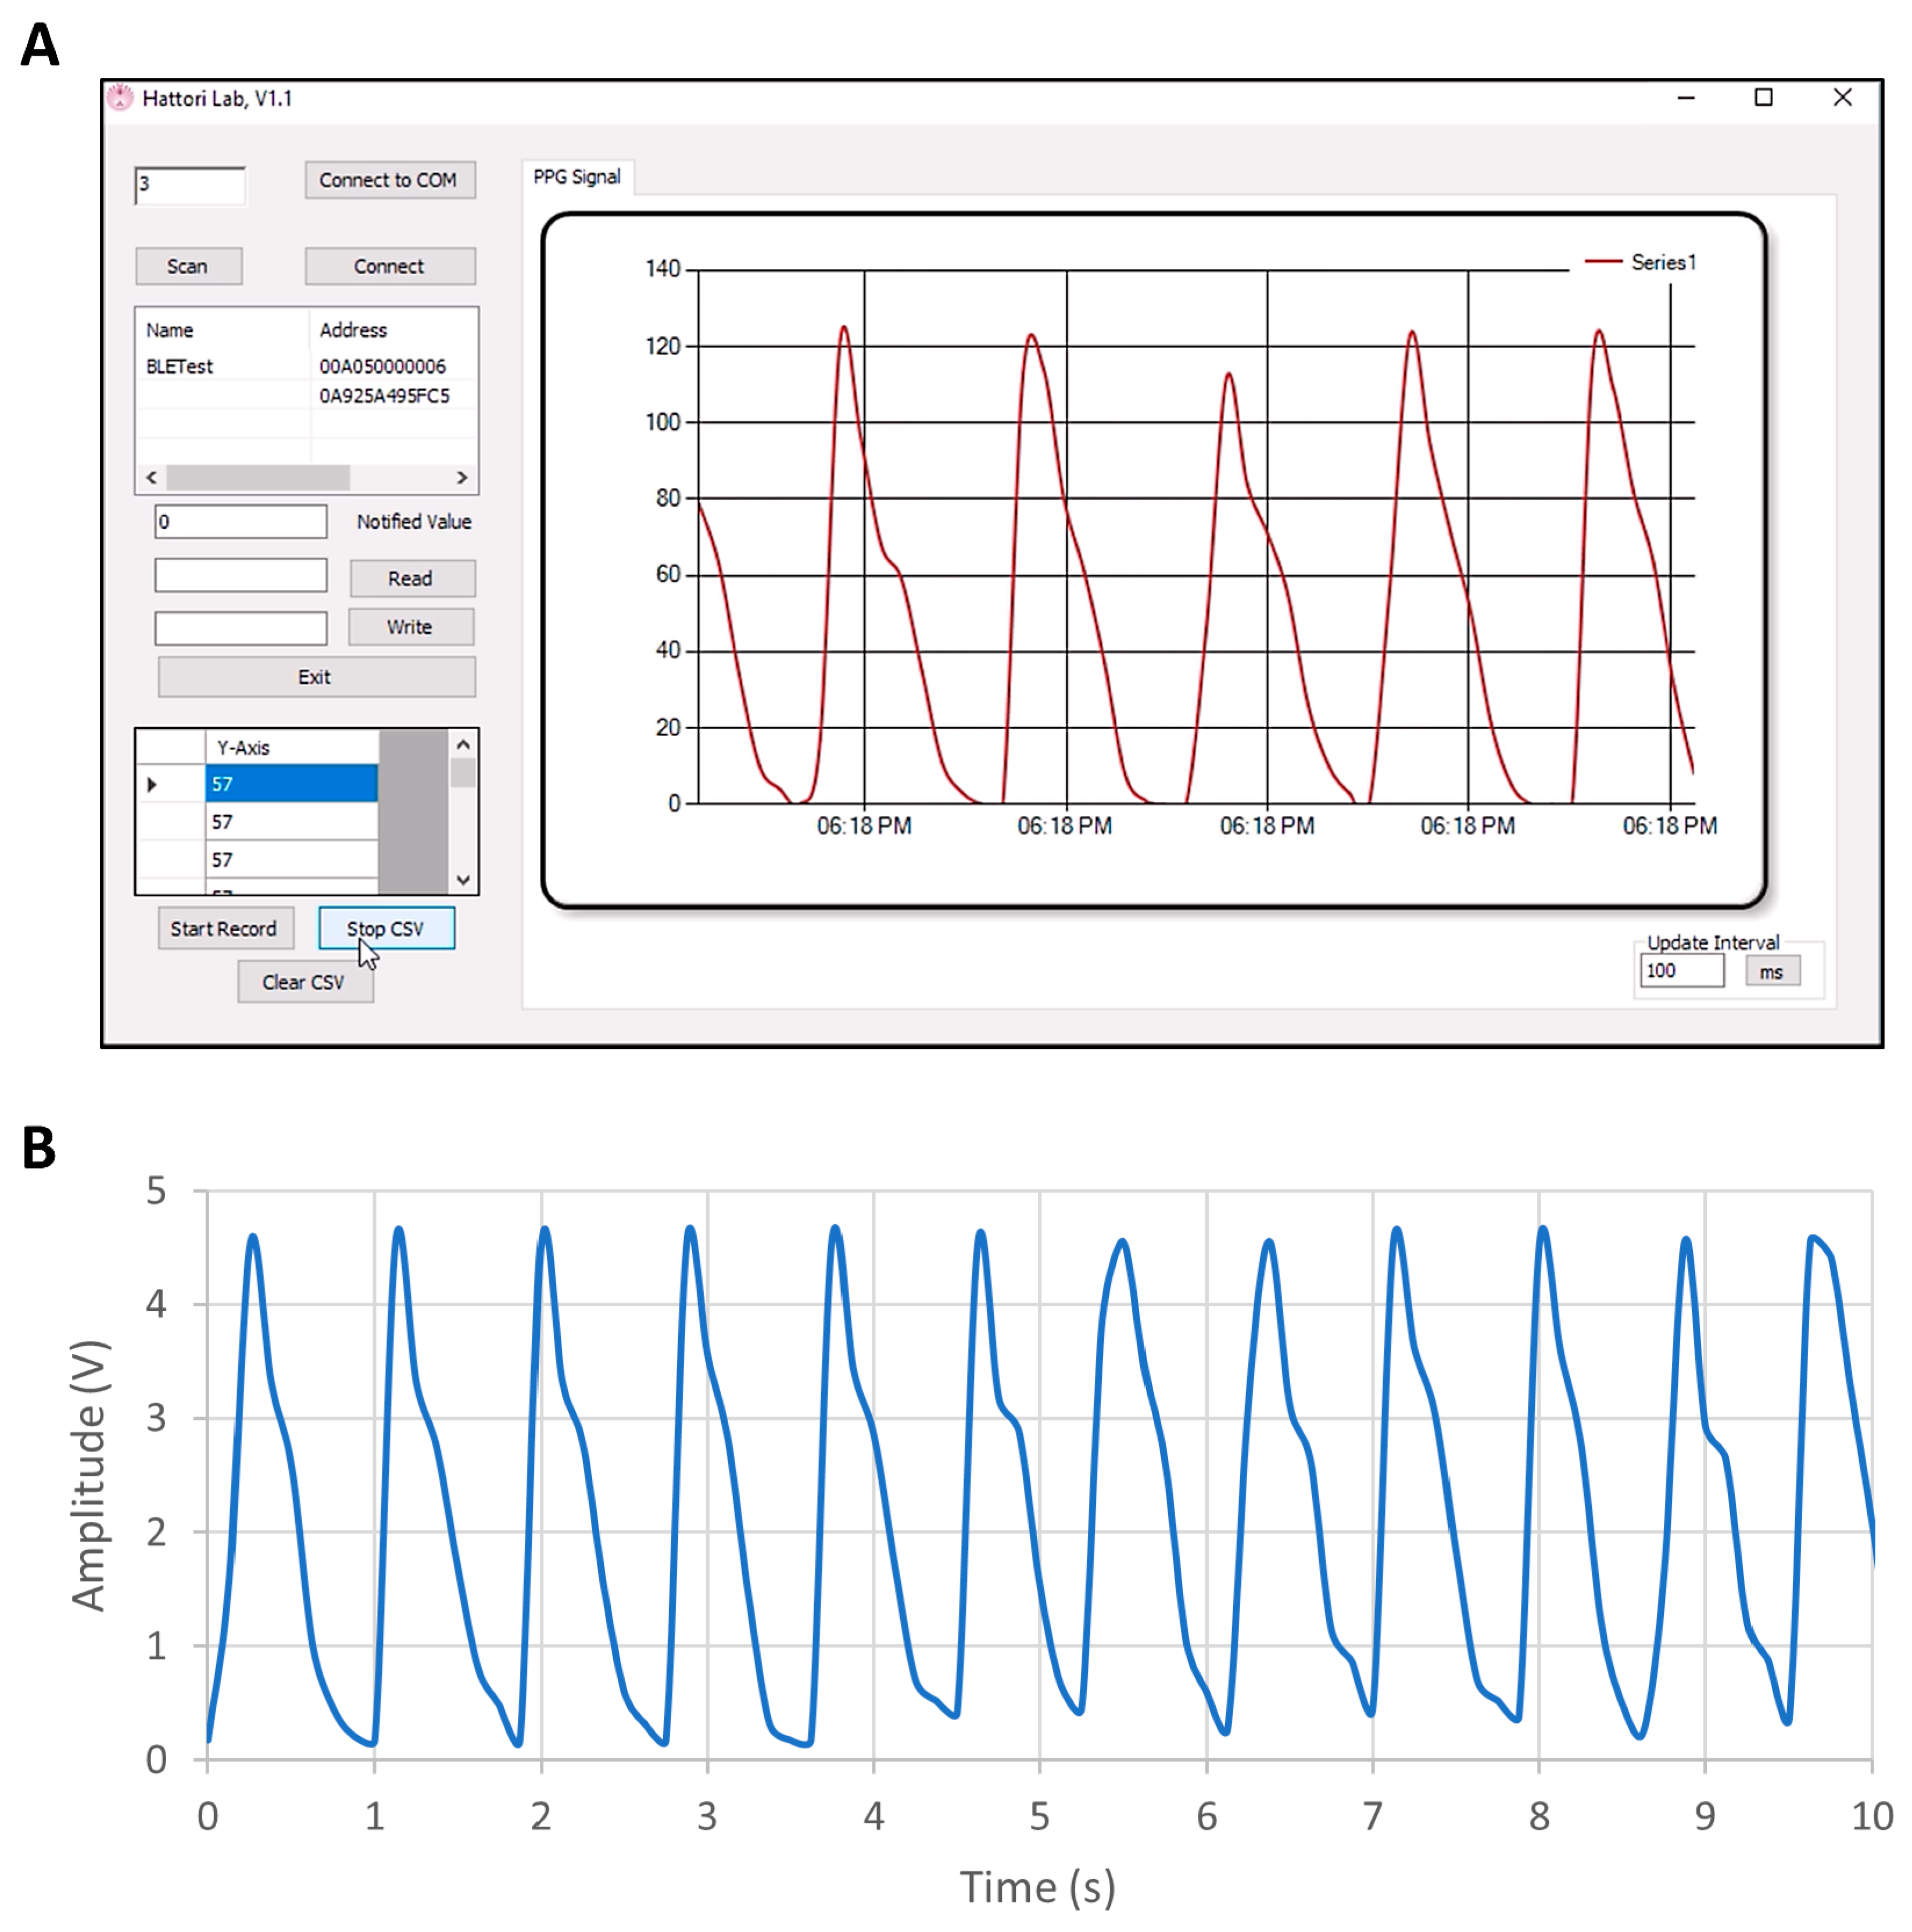
3.2. Results of BLE PPG Signal from Device-1
4. Conclusions
Author Contributions
Funding
Acknowledgments
Conflicts of Interest
References
- Webster, J.G. Design of Pulse Oximeters; CRC Press: Boca Raton, FL, USA, 1997. [Google Scholar]
- Jubran, A. Pulse oximetry. In Applied Physiology in Intensive Care Medicine 1, 3rd ed.; Physiological Notes—Technical Notes—Seminal Studies in Intensive Care; Springer-Verlag: Berlin/Heidelberg, Germany, 2012; pp. 51–54. [Google Scholar]
- Guk, K.; Han, G.; Lim, J.; Jeong, K.; Kang, T. Evolution of Wearable Devices with Real-Time Disease Monitoring for Personalized Healthcare. Nanomaterials 2019, 9, 813. [Google Scholar] [CrossRef] [PubMed]
- de Kock, J.P.; Tarassenko, L. Pulse oximetry: theoretical and experimental models. Med. Biol. Eng. Comput. 1993, 31, 291–300. [Google Scholar] [CrossRef] [PubMed]
- Chen, C.T. Evolution of red organic light-emitting diodes: Materials and devices. Chem. Mater. 2004, 16, 4389–4400. [Google Scholar] [CrossRef]
- Thejo Kalyani, N.; Dhoble, S.J. Organic light emitting diodes: Energy saving lighting technology–A review. Renew. Sustain. Energy Rev. 2012, 16, 2696–2723. [Google Scholar] [CrossRef]
- Geffroy, B.; le Roy, P.; Prat, C. Organic light-emitting diode (OLED) technology: Materials, devices and display technologies. Polym. Int. 2006, 55, 572–582. [Google Scholar] [CrossRef]
- Mendelson, Y.; Pujary, C. Measurement site and photodetector size considerations in optimizing power consumption of a wearable reflectance pulse oximeter. In Proceedings of the 25th Annual International Conference of the IEEE Engineering in Medicine and Biology Society, Cancun, Mexico, 17–21 September 2003; pp. 3016–3019. [Google Scholar]
- Lochner, C.M.; Khan, Y.; Pierre, A.; Arias, A.C. All-organic optoelectronic sensor for pulse oximetry. Nat. Commun. 2014, 5, 1–7. [Google Scholar] [CrossRef] [PubMed]
- Tachibana, Y.; Kaltenbrunner, M.; Koizumi, M.; Matsuhisa, N.; Yukita, W.; Zalar, P.; Jinno, H.; Someya, T.; Kitanosako, H.; Yokota, T. Ultraflexible organic photonic skin. Sci. Adv. 2016, 2, e1501856. [Google Scholar]
- Kim, H.; Lee, H.; Yoo, S.; Kim, M.; Kim, E.; Lee, J.; Yoo, H.-J.; Lee, Y. Toward all-day wearable health monitoring: An ultralow-power, reflective organic pulse oximetry sensing patch. Sci. Adv. 2018, 4, eaas9530. [Google Scholar]
- Li, K.; Warren, S. A wireless reflectance pulse oximeter with digital baseline control for unfiltered photoplethysmograms. IEEE Trans. Biomed. Circuits Syst. 2012, 6, 269–278. [Google Scholar] [CrossRef] [PubMed]
- Ayance, T.; Trevi, C.G. Wireless heart rate and oxygen saturation monitor Wireless Heart Rate and Oxygen Saturation Monitor. AIP Conf. Proc. 2019, 2090, 1–5. [Google Scholar]
- Huang, C.; Chan, M.; Chen, C.; Lin, B. Novel Wearable and Wireless Ring-Type Pulse Oximeter with Multi-Detectors. Sensors 2014, 14, 17586–17599. [Google Scholar] [CrossRef] [PubMed]
- Spigulis, J.; Erts, R.; Nikiforovs, V.; Kviesis-kipge, E. Wearable wireless photoplethysmography sensors. In Proceedings of the Biophotonics: Photonic Solutions for Better Health Care, Strasbourg, France, 7–11 April 2008; Volume 6991, pp. 1–7. [Google Scholar]
- Ha, M.; Lim, S.; Ko, H. Wearable and flexible sensors for user-interactive health-monitoring devices. J. Mater. Chem. B 2018, 6, 4043–4064. [Google Scholar] [CrossRef]
- Elsamnah, F.; Bilgaiyan, A.; Affiq, M.; Shim, C.-H.; Ishidai, H.; Hattori, R. Comparative Design Study for Power Reduction in Organic Optoelectronic Pulse Meter Sensor. Biosensors 2019, 9, 48. [Google Scholar] [CrossRef] [PubMed]
- Bilgaiyan, A.; Sugawara, R.; Elsamnah, F.; Shim, C.; Affiq, M.; Hattori, R. Optimizing performance of reflectance-based organic Photoplethysmogram (PPG) sensor. In Proceedings of the Organic and Hybrid Sensors and Bioelectronics XI, San Diego, CA, USA, 19–23 August 2018; Volume 10738, p. 1073808. [Google Scholar]
- Elsamnah, F.; Hattori, R.; Shim, C.-H.; Bilgaiyan, A.; Sugawara, R.; Affiq, M. Reflectance-based Monolithic Organic Pulsemeter Device for Measuring Photoplethysmogram Signal. In Proceedings of the 2018 IEEE International Instrumentation and Measurement Technology Conference (I2MTC), Houston, TX, USA, 14–17 May 2018; pp. 1–5. [Google Scholar]
- Sommer, J.R.; Farley, R.T.; Graham, K.R.; Yang, Y.; Reynolds, J.R.; Xue, J.; Schanze, K.S. Efficient Near-Infrared Polymer and Organic Light-Emitting Diodes Based on Electrophosphorescence from. ACS Appl. Mater. Interfaces 2009, 1, 274–278. [Google Scholar] [CrossRef] [PubMed]
- Xue, J.; Li, C.; Xin, L.; Duan, L.; Qiao, J. High-efficiency and low efficiency roll-off near-infrared fluorescent OLEDs through triplet fusion. Chem. Sci. 2016, 7, 2888–2895. [Google Scholar] [CrossRef] [PubMed]
- Jacques, S.L. Optical properties of biological tissues: a review. Phys. Med. Biol. 2013, 58, R37. [Google Scholar] [CrossRef] [PubMed]
- Zamburlini, M.; Pejović-Milić, A.; Chettle, D.R.; Webber, C.E.; Gyorffy, J. In vivo study of an x-ray fluorescence system to detect bone strontium non-invasively. Phys. Med. Biol. 2007, 52, 2107–2122. [Google Scholar] [CrossRef] [PubMed]
- Akkus, O.; Uzunlulu, M.; Kizilgul, M. Evaluation of Skin and Subcutaneous Adipose Tissue Thickness for Optimal Insulin Injection. J. Diabetes Metab. 2012, 3. [Google Scholar] [CrossRef]
- Drahansky, M.; Kanich, O.; Brezinová, E.; Shinoda, K. Experiments with Optical Properties of Skin on Fingers. Int. J. Opt. Appl. 2016, 6, 37–46. [Google Scholar]
- Luthra, G. PROJECT #024: BLE Throughput—Pushing the Limits. Available online: http://www.cypress.com/blog/100-projects-100-days/project-024-ble-throughput-pushing-limits (accessed on 10 June 2019).


| Tissue | Wave-length (nm) | Index of Refraction (n) | Henyey–Greenstein (g) | Absorption Coefficient (Ua) in mm−1 | Scatter Coefficient (Us) in mm−1 | Thickness (mm) |
|---|---|---|---|---|---|---|
| Human Skin | 625 | 1.55 | 0.81 | 0.27 | 18.7 | 2 |
| Subcutaneous Fat | 625 | 1.44 | 0.9 | 1.14 | 12.8 | 2.5 |
| Muscle | 625 | 1.37 | 0.9 | 0.56 | 64.7 | 3 |
| Bone | 625 | 1.37 | 0.9 | 0.04 | 19.5 | 6 |
| Device No. | Average Vpp (mV) | SNR (dB) | Current Source (μA) |
|---|---|---|---|
| Device-1 | 20 | 45 | 93.6 |
| Device-2 | 13 | 46 | 93.6 |
| Device-1 | 0.7 | 18 | 2.4 |
| Device-2 | 0.3 | 8 | 2.4 |
| This Work | Reference [11] | Reference [17] | Reference [10] | Reference [9] | |
|---|---|---|---|---|---|
| OLED Type | Red OLED | Red OLED | Red OLED | Red PLED | Red OLED |
| Device Flexibility | Rigid | Flexible | Rigid | Flexible | Rigid |
| Voltage Supply (V) | 3.3 | 3.3 | 5 | 5 | 9 |
| OLED Driving Current (μA) | 2.4 | 21 | 20 | 1000 | 20000 |
| OLED Area (mm2) | 6 | 0.5 | 3 | N.C. | 4 |
| Power Consumption (μW) | 8 | 24 | 100 | N.C. | N.C. |
| PPG Signal-to-Noise Ratio (dB) | 18 | N.C. | 45 | N.C. | N.C. |
© 2019 by the authors. Licensee MDPI, Basel, Switzerland. This article is an open access article distributed under the terms and conditions of the Creative Commons Attribution (CC BY) license (http://creativecommons.org/licenses/by/4.0/).
Share and Cite
Elsamnah, F.; Bilgaiyan, A.; Affiq, M.; Shim, C.-H.; Ishidai, H.; Hattori, R. Reflectance-Based Organic Pulse Meter Sensor for Wireless Monitoring of Photoplethysmogram Signal. Biosensors 2019, 9, 87. https://doi.org/10.3390/bios9030087
Elsamnah F, Bilgaiyan A, Affiq M, Shim C-H, Ishidai H, Hattori R. Reflectance-Based Organic Pulse Meter Sensor for Wireless Monitoring of Photoplethysmogram Signal. Biosensors. 2019; 9(3):87. https://doi.org/10.3390/bios9030087
Chicago/Turabian StyleElsamnah, Fahed, Anubha Bilgaiyan, Muhamad Affiq, Chang-Hoon Shim, Hiroshi Ishidai, and Reiji Hattori. 2019. "Reflectance-Based Organic Pulse Meter Sensor for Wireless Monitoring of Photoplethysmogram Signal" Biosensors 9, no. 3: 87. https://doi.org/10.3390/bios9030087
APA StyleElsamnah, F., Bilgaiyan, A., Affiq, M., Shim, C.-H., Ishidai, H., & Hattori, R. (2019). Reflectance-Based Organic Pulse Meter Sensor for Wireless Monitoring of Photoplethysmogram Signal. Biosensors, 9(3), 87. https://doi.org/10.3390/bios9030087