An Automated Microfluidic Platform for In Vitro Raman Analysis of Living Cells

 ,
,  ,
,  , ,
, ,  ,
,  ,
,  , ,
, ,  ,
,  ,
,  and
and 
Abstract
1. Introduction
2. Methods
2.1. Materials
2.1.1. PMD
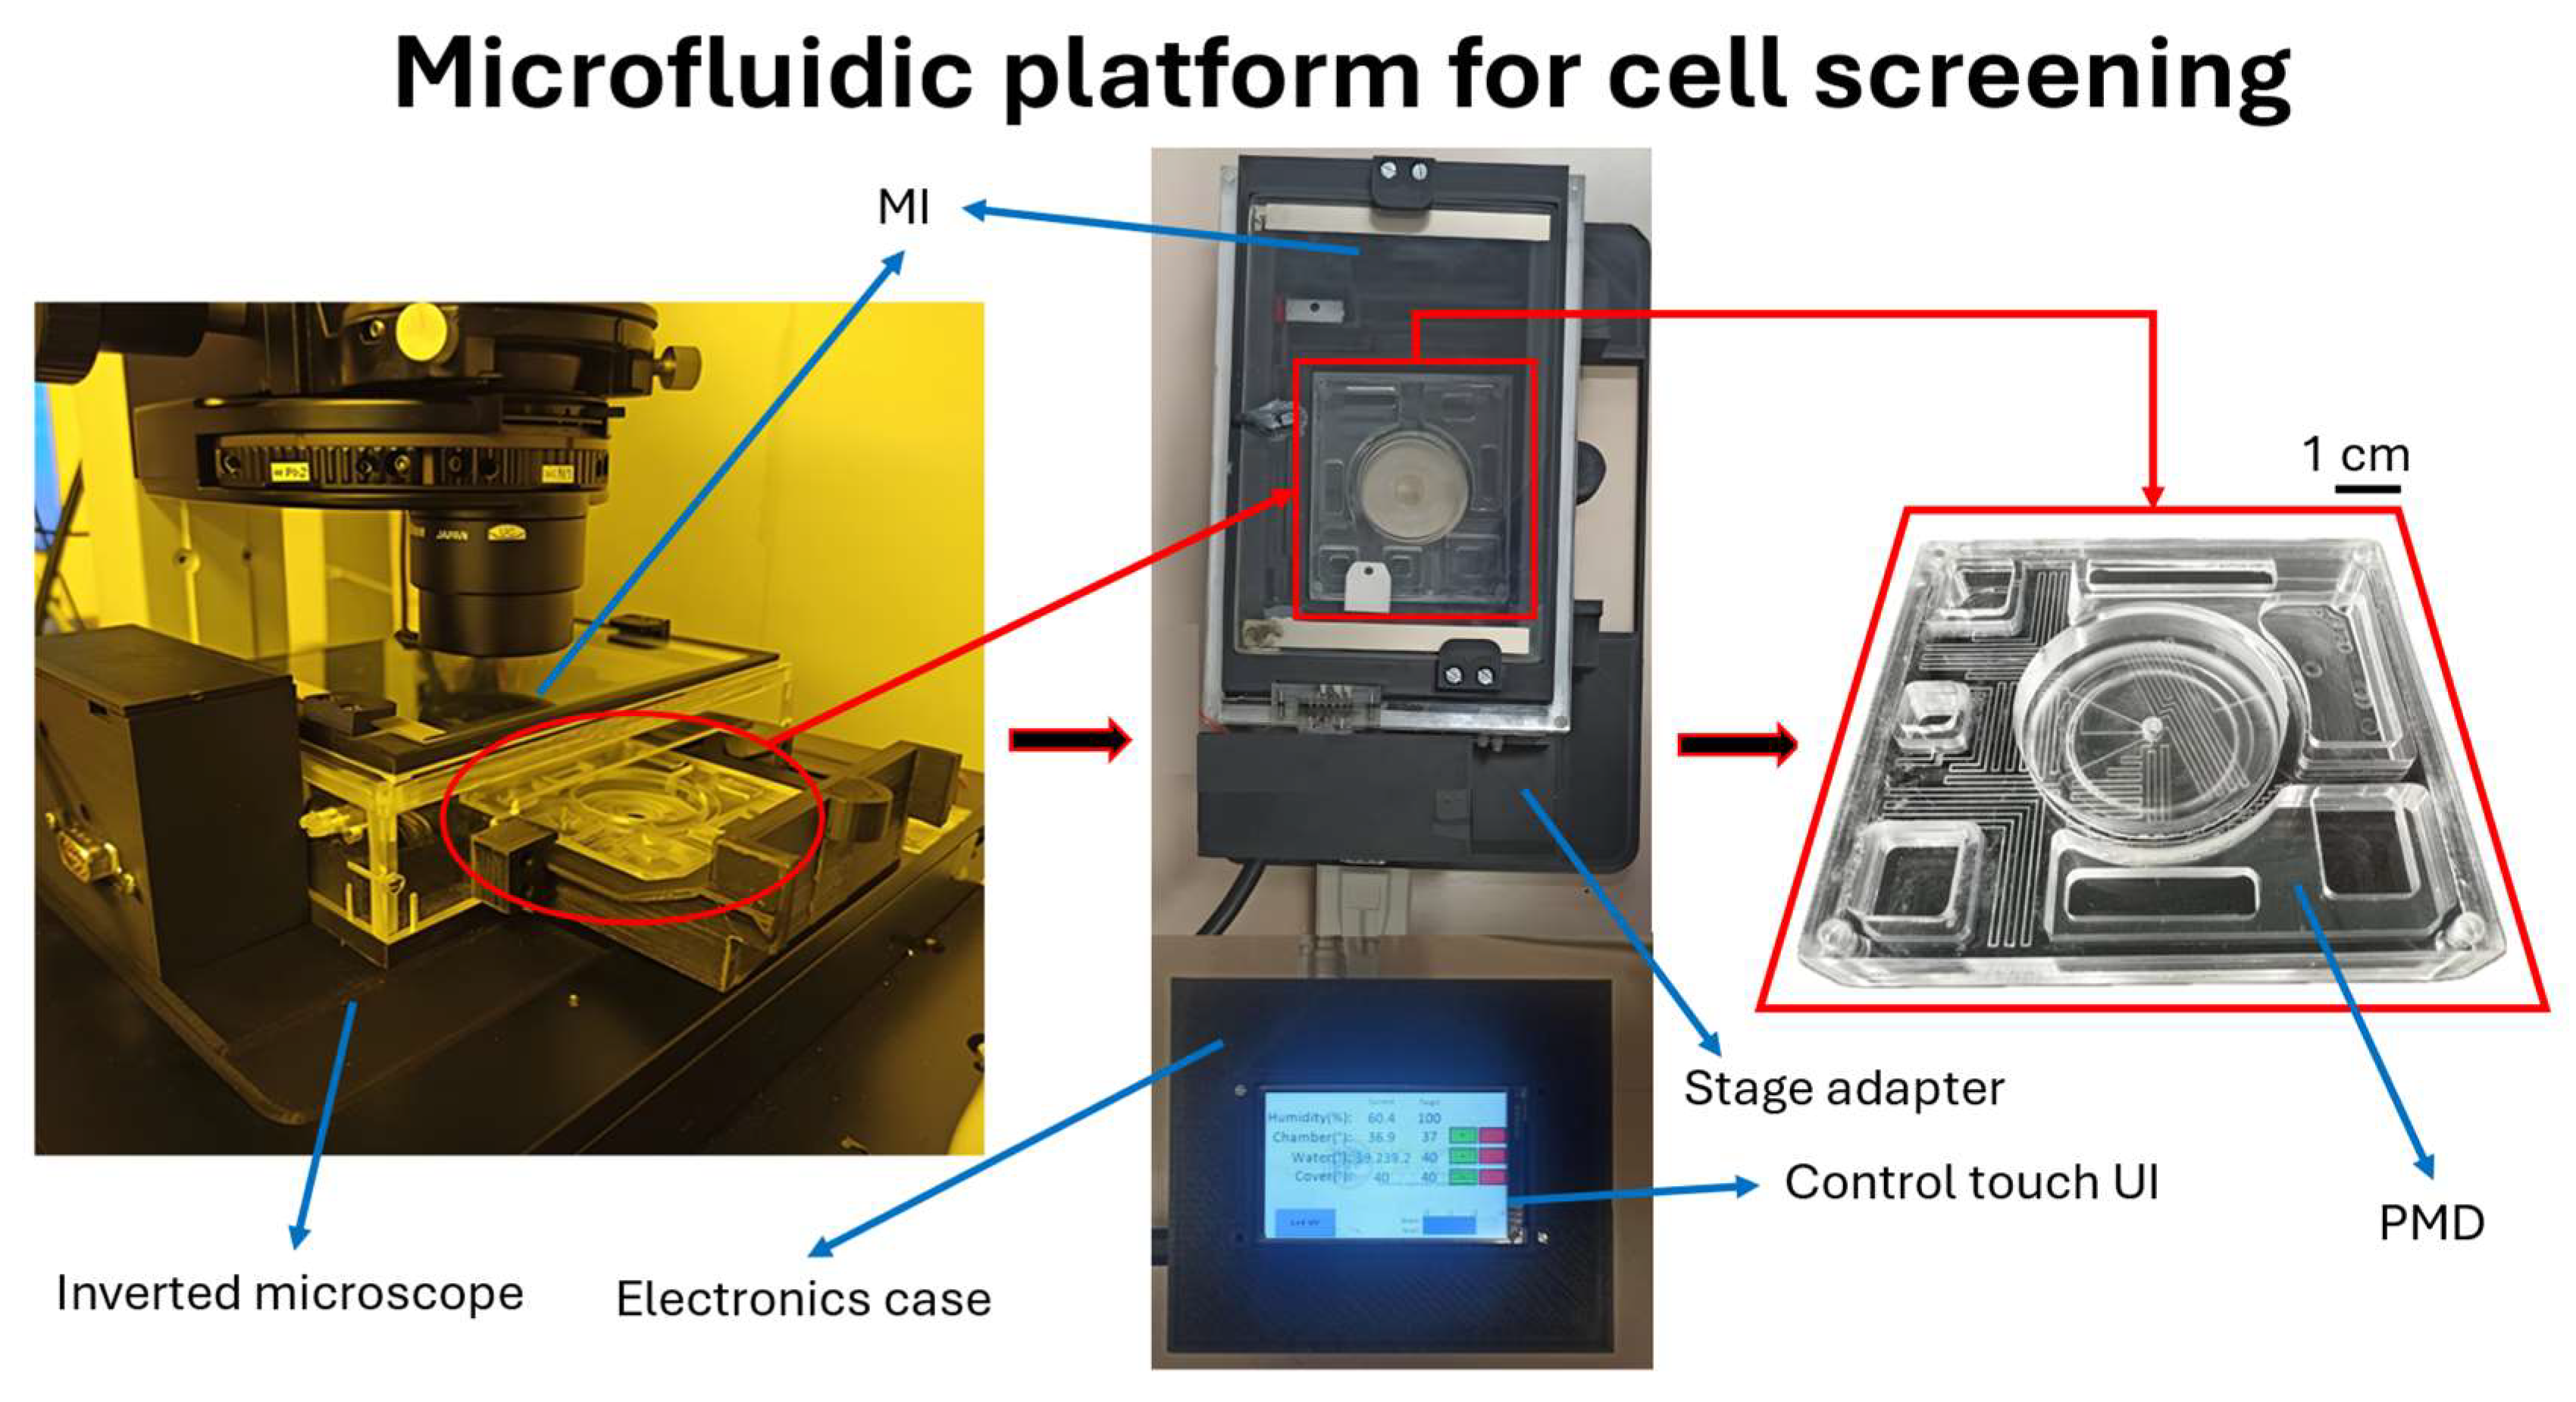
2.1.2. MI
2.1.3. Biological Samples and Reagents
2.1.4. Raman Data Analysis
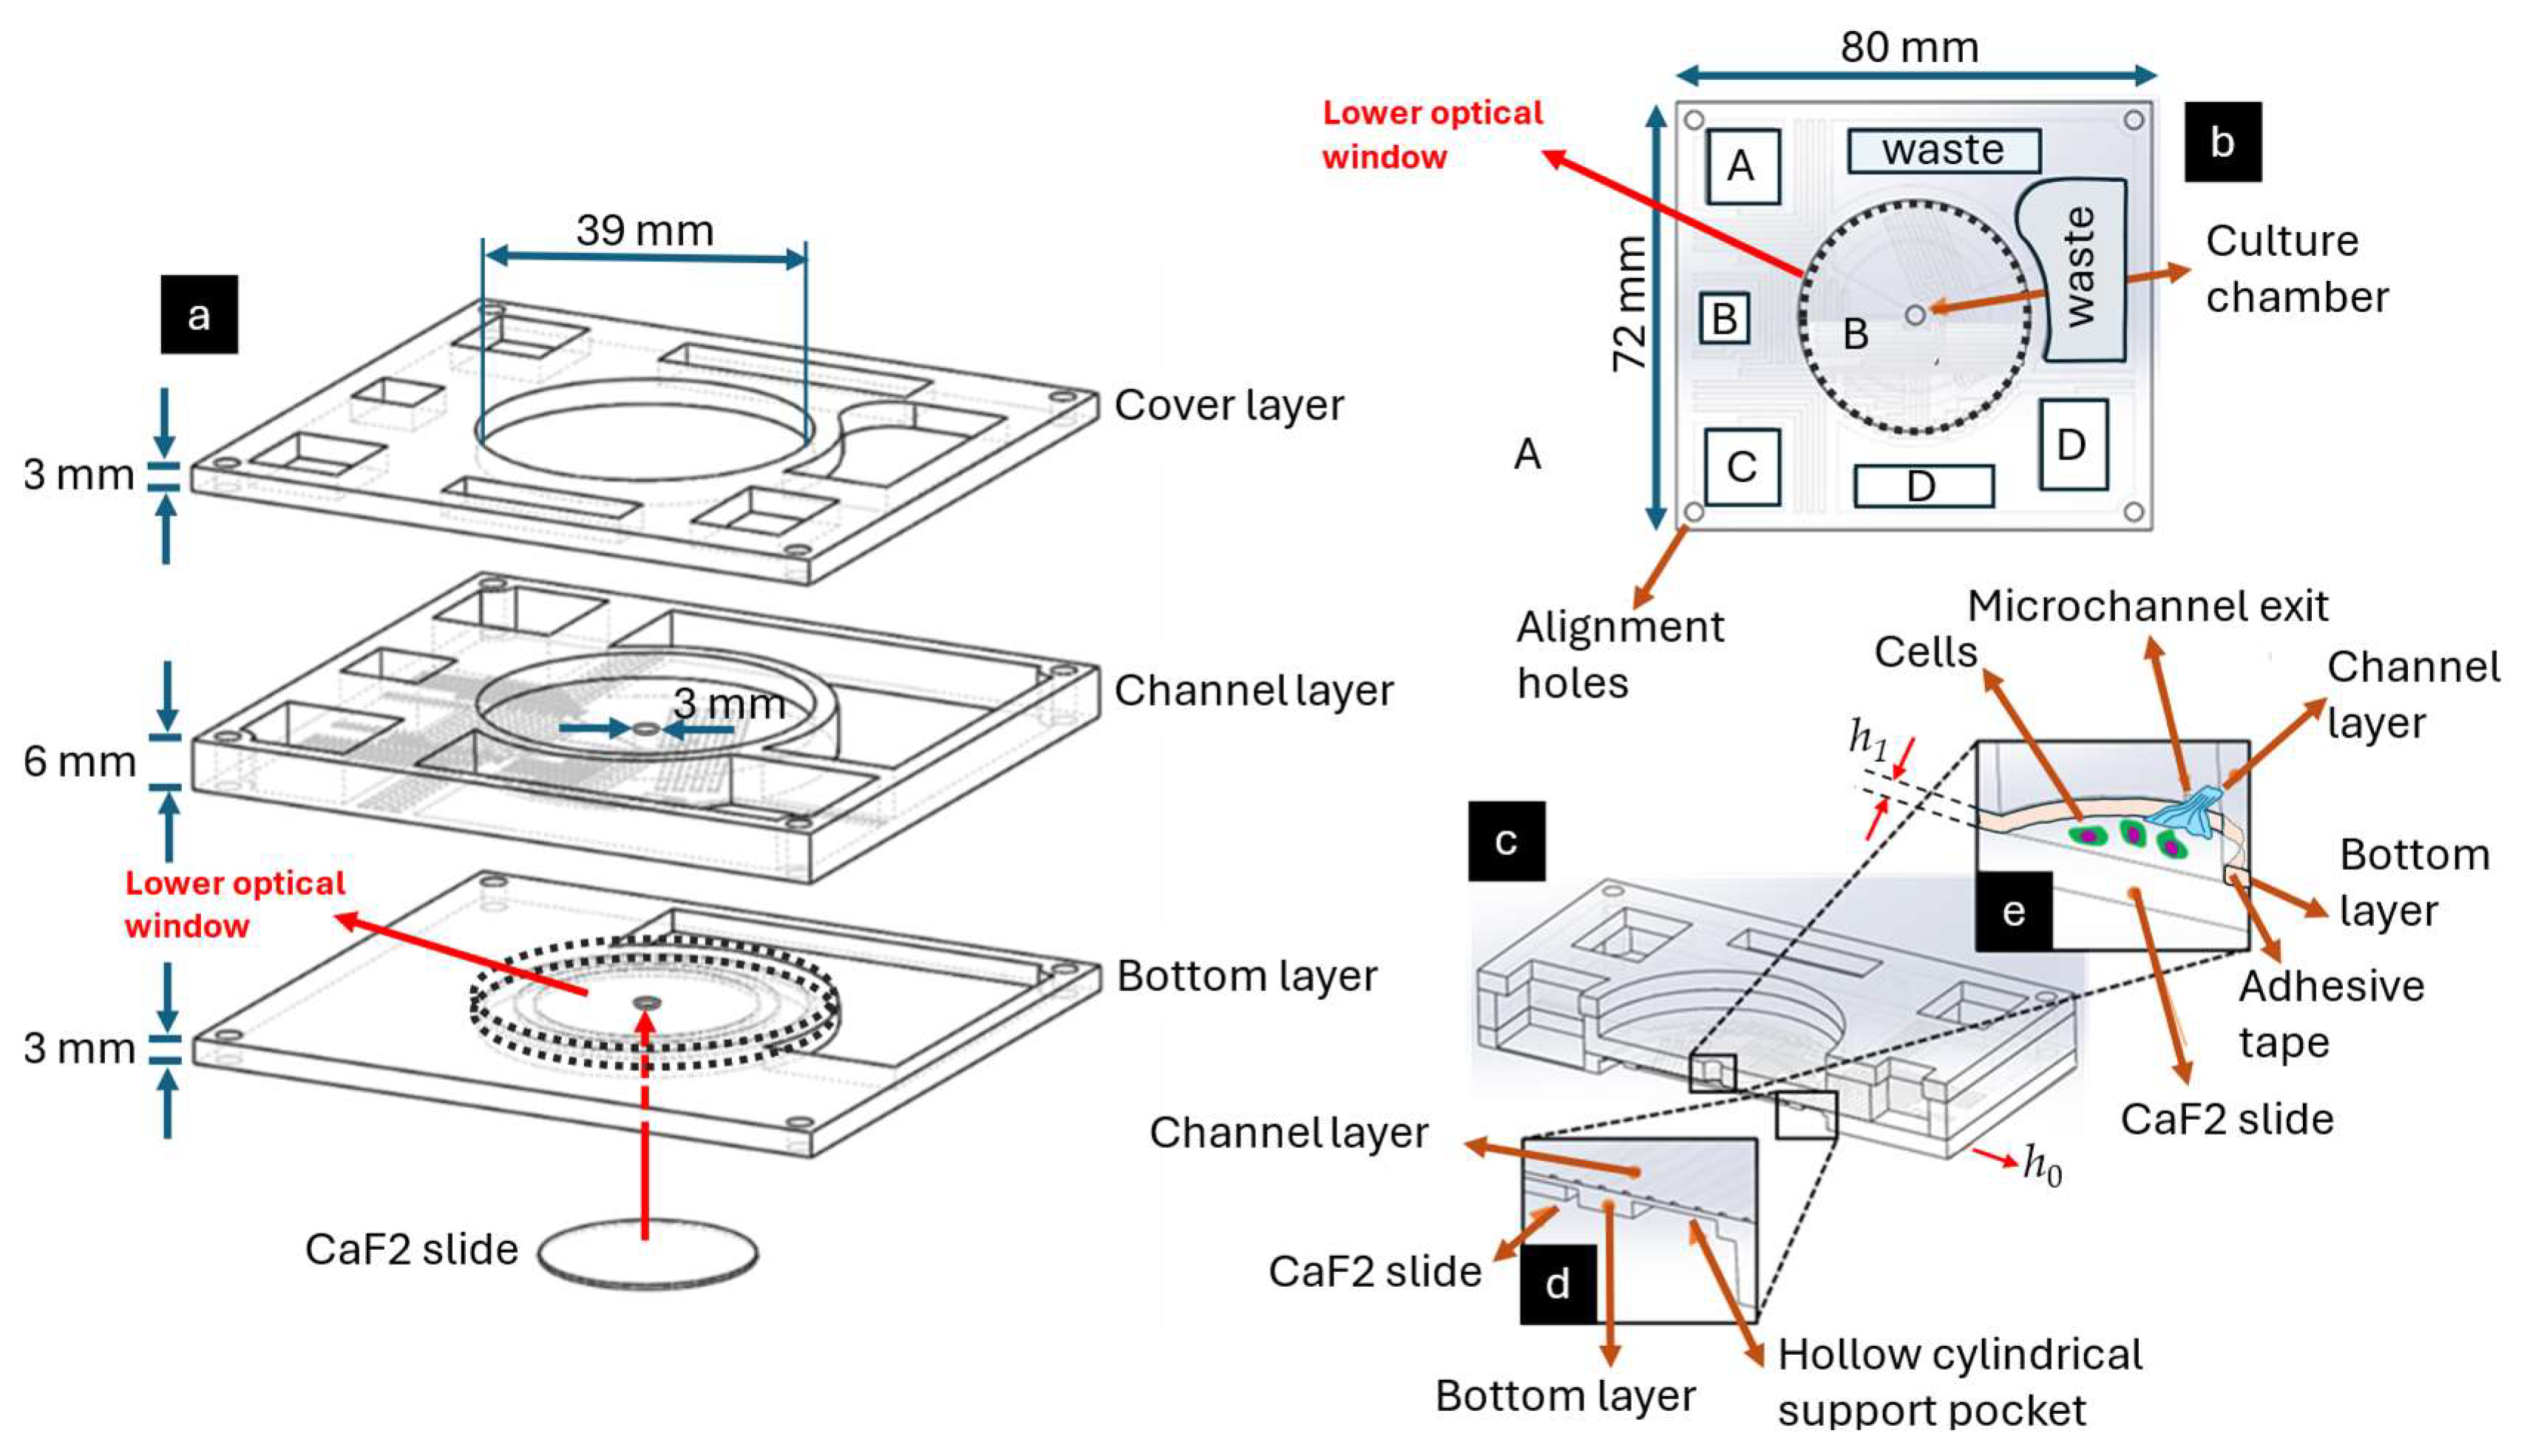
2.2. Fabrication of the PMD
2.3. Fabrication of the MI
2.4. Working Principles
2.4.1. Operating Principles of PMD
2.4.2. PMD’s Flow Rate Measurement
2.4.3. Operating Principles of MI
- Heating of the MI allows it to maintain the target temperature of the environment. This was achieved by the transparent conductive glass attached to the sliding lid, two 3D printer hot-end heating blocks placed inside the MI, and a custom-made donut-shaped Joule-effect heater placed onto the sliding drawer on which the PMD lays;
- A humidification system was used to achieve high relative humidity inside the MI environment in order to mitigate the evaporation rate of the media of the PMD. Two 3D printer hot-end heating blocks were placed inside the water tank inside the MI to make the water evaporate. A water level sensor was used to ensure water was not missing inside the tank, and, as it evaporated, a volumetric pump refilled the water tank to compensate for the evaporation;
- Sterilization was achieved via 6 UV-LEDs installed onto the sliding lid. The number of LEDs was determined based on the area that needed to be sterilized. The exposure time estimation (circa 30 min) was based on the UV dose needed for the biological inactivation of bacteria (Supplementary Table S4). Prior and subsequent to the biological experiments, sterilization was carried out.
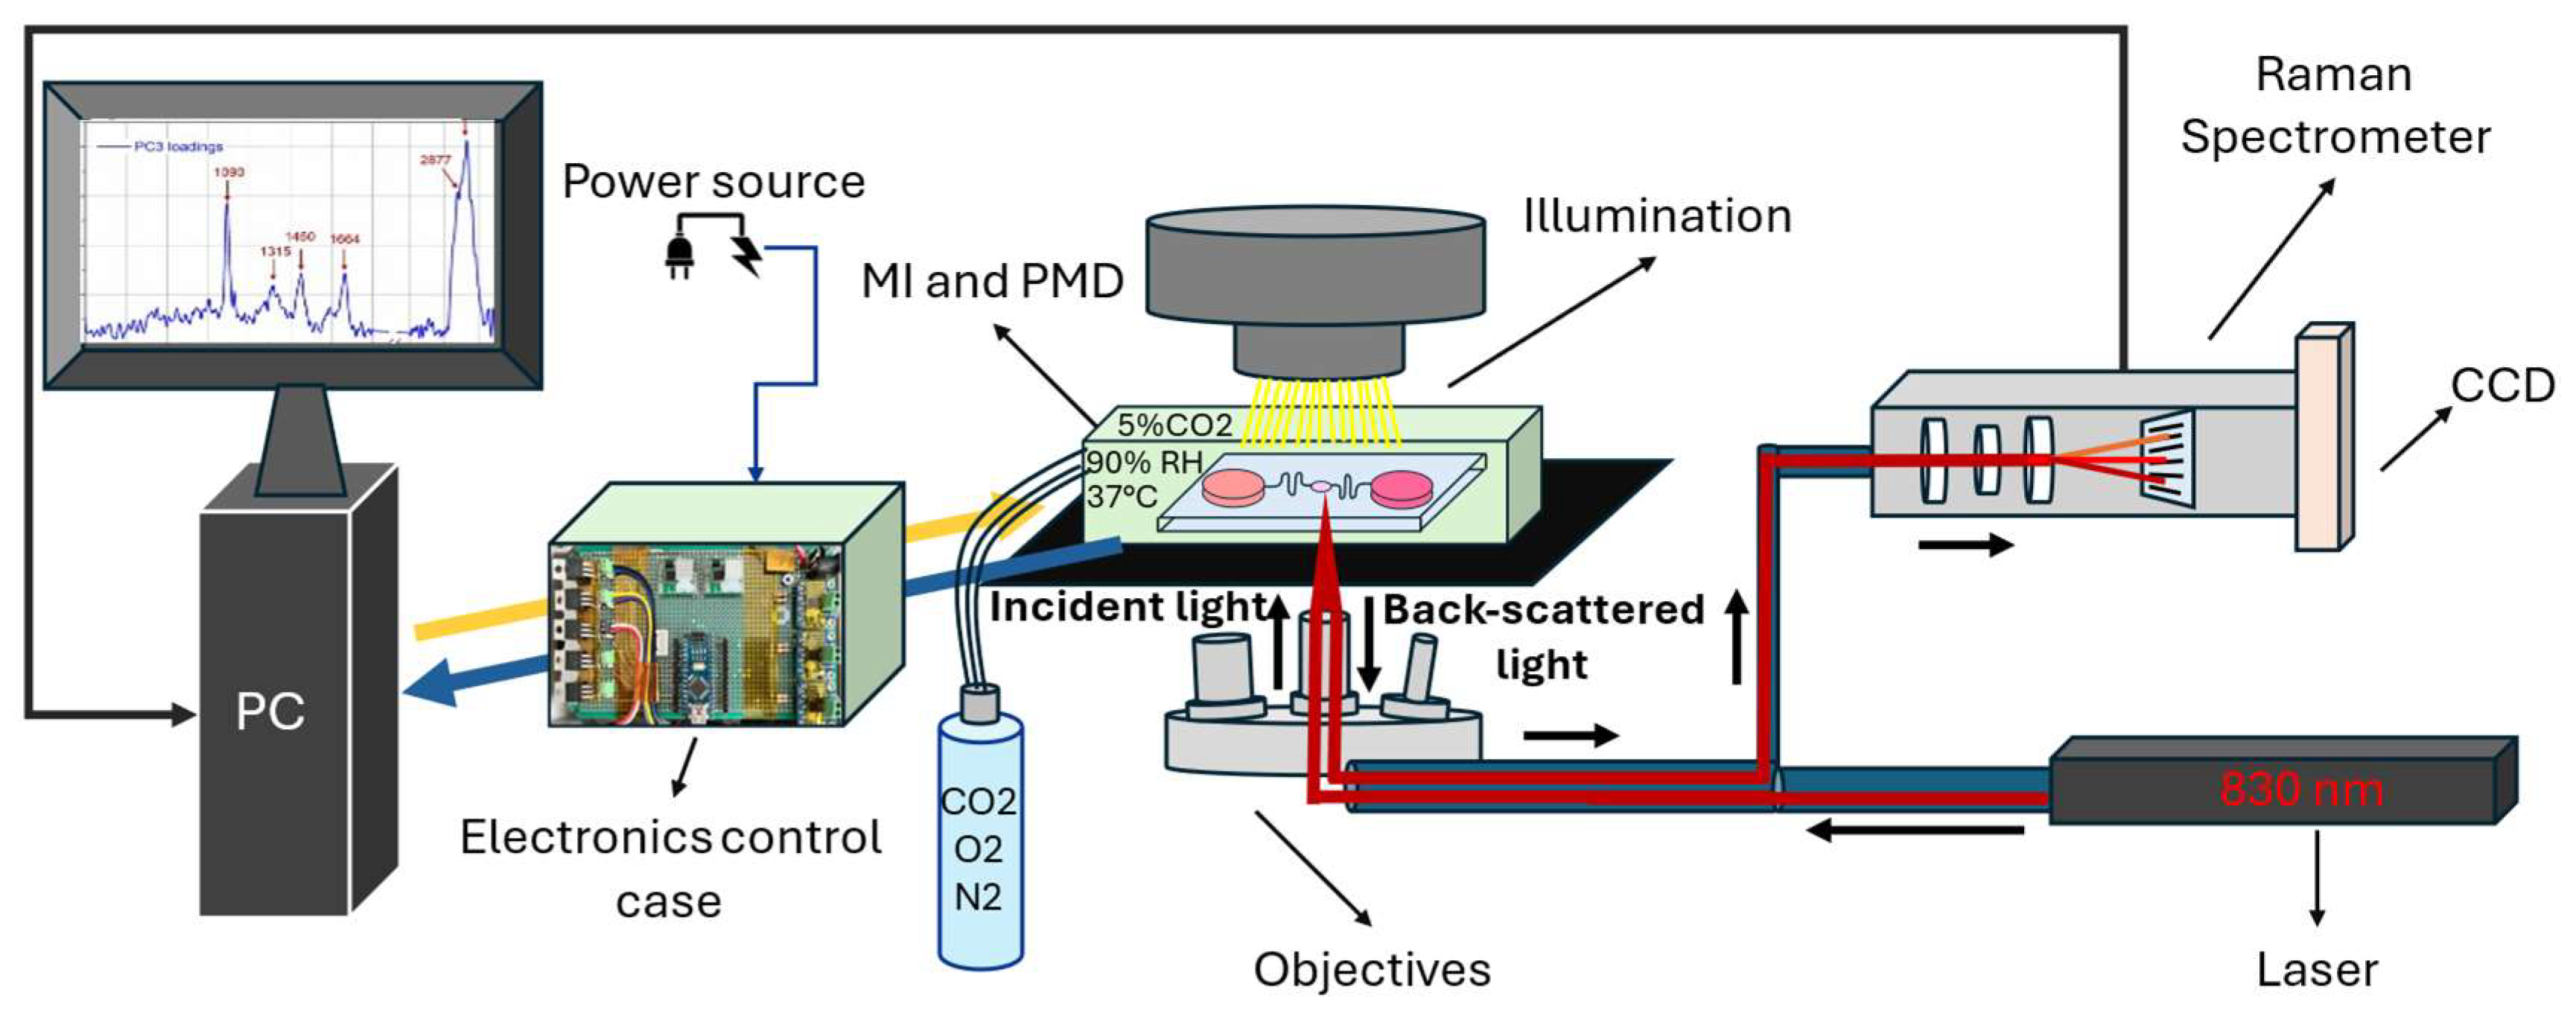
2.5. Experimental Setup
2.6. Biological Experiments
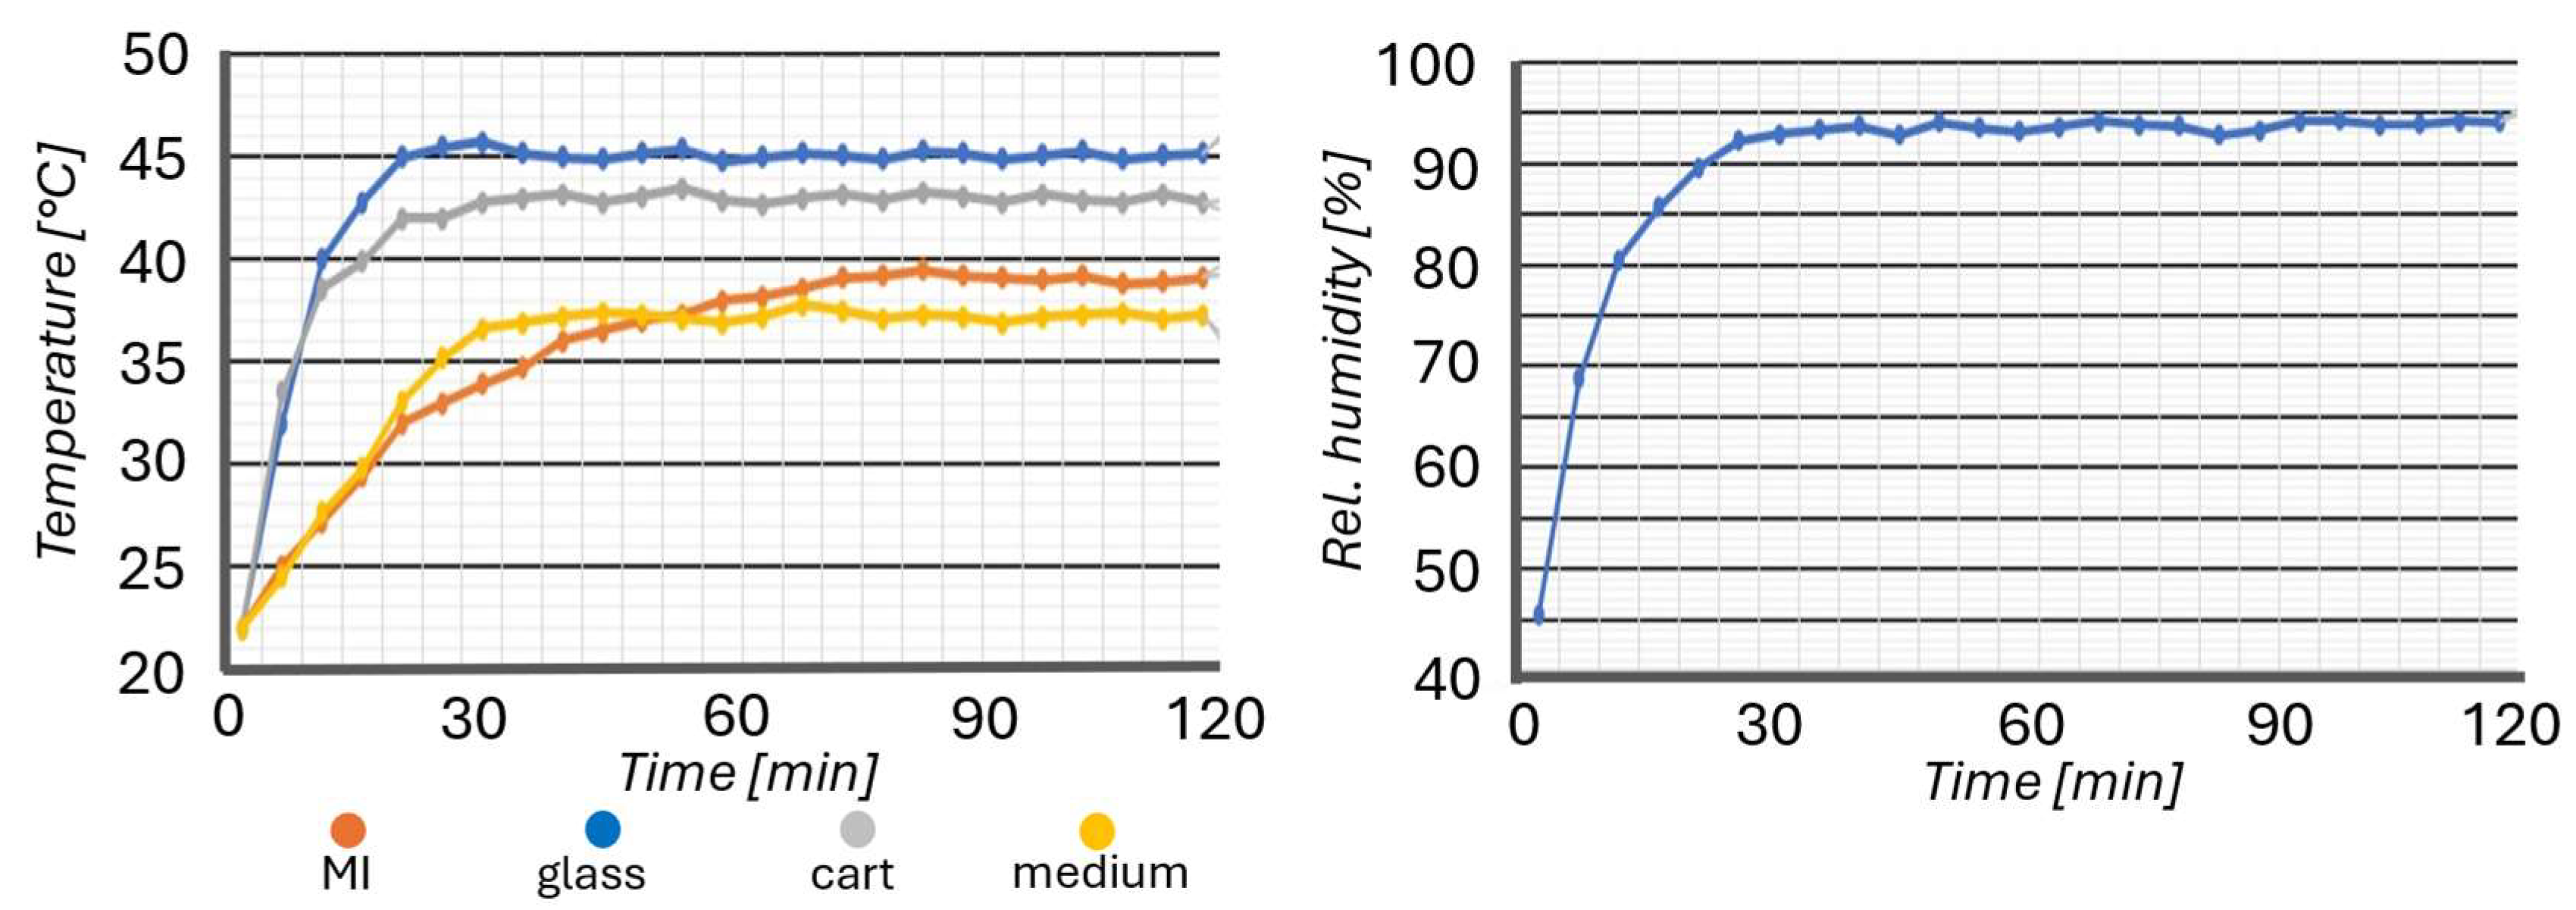
2.7. Experimental Characterization
2.8. Experimental Procedure with Biological Samples
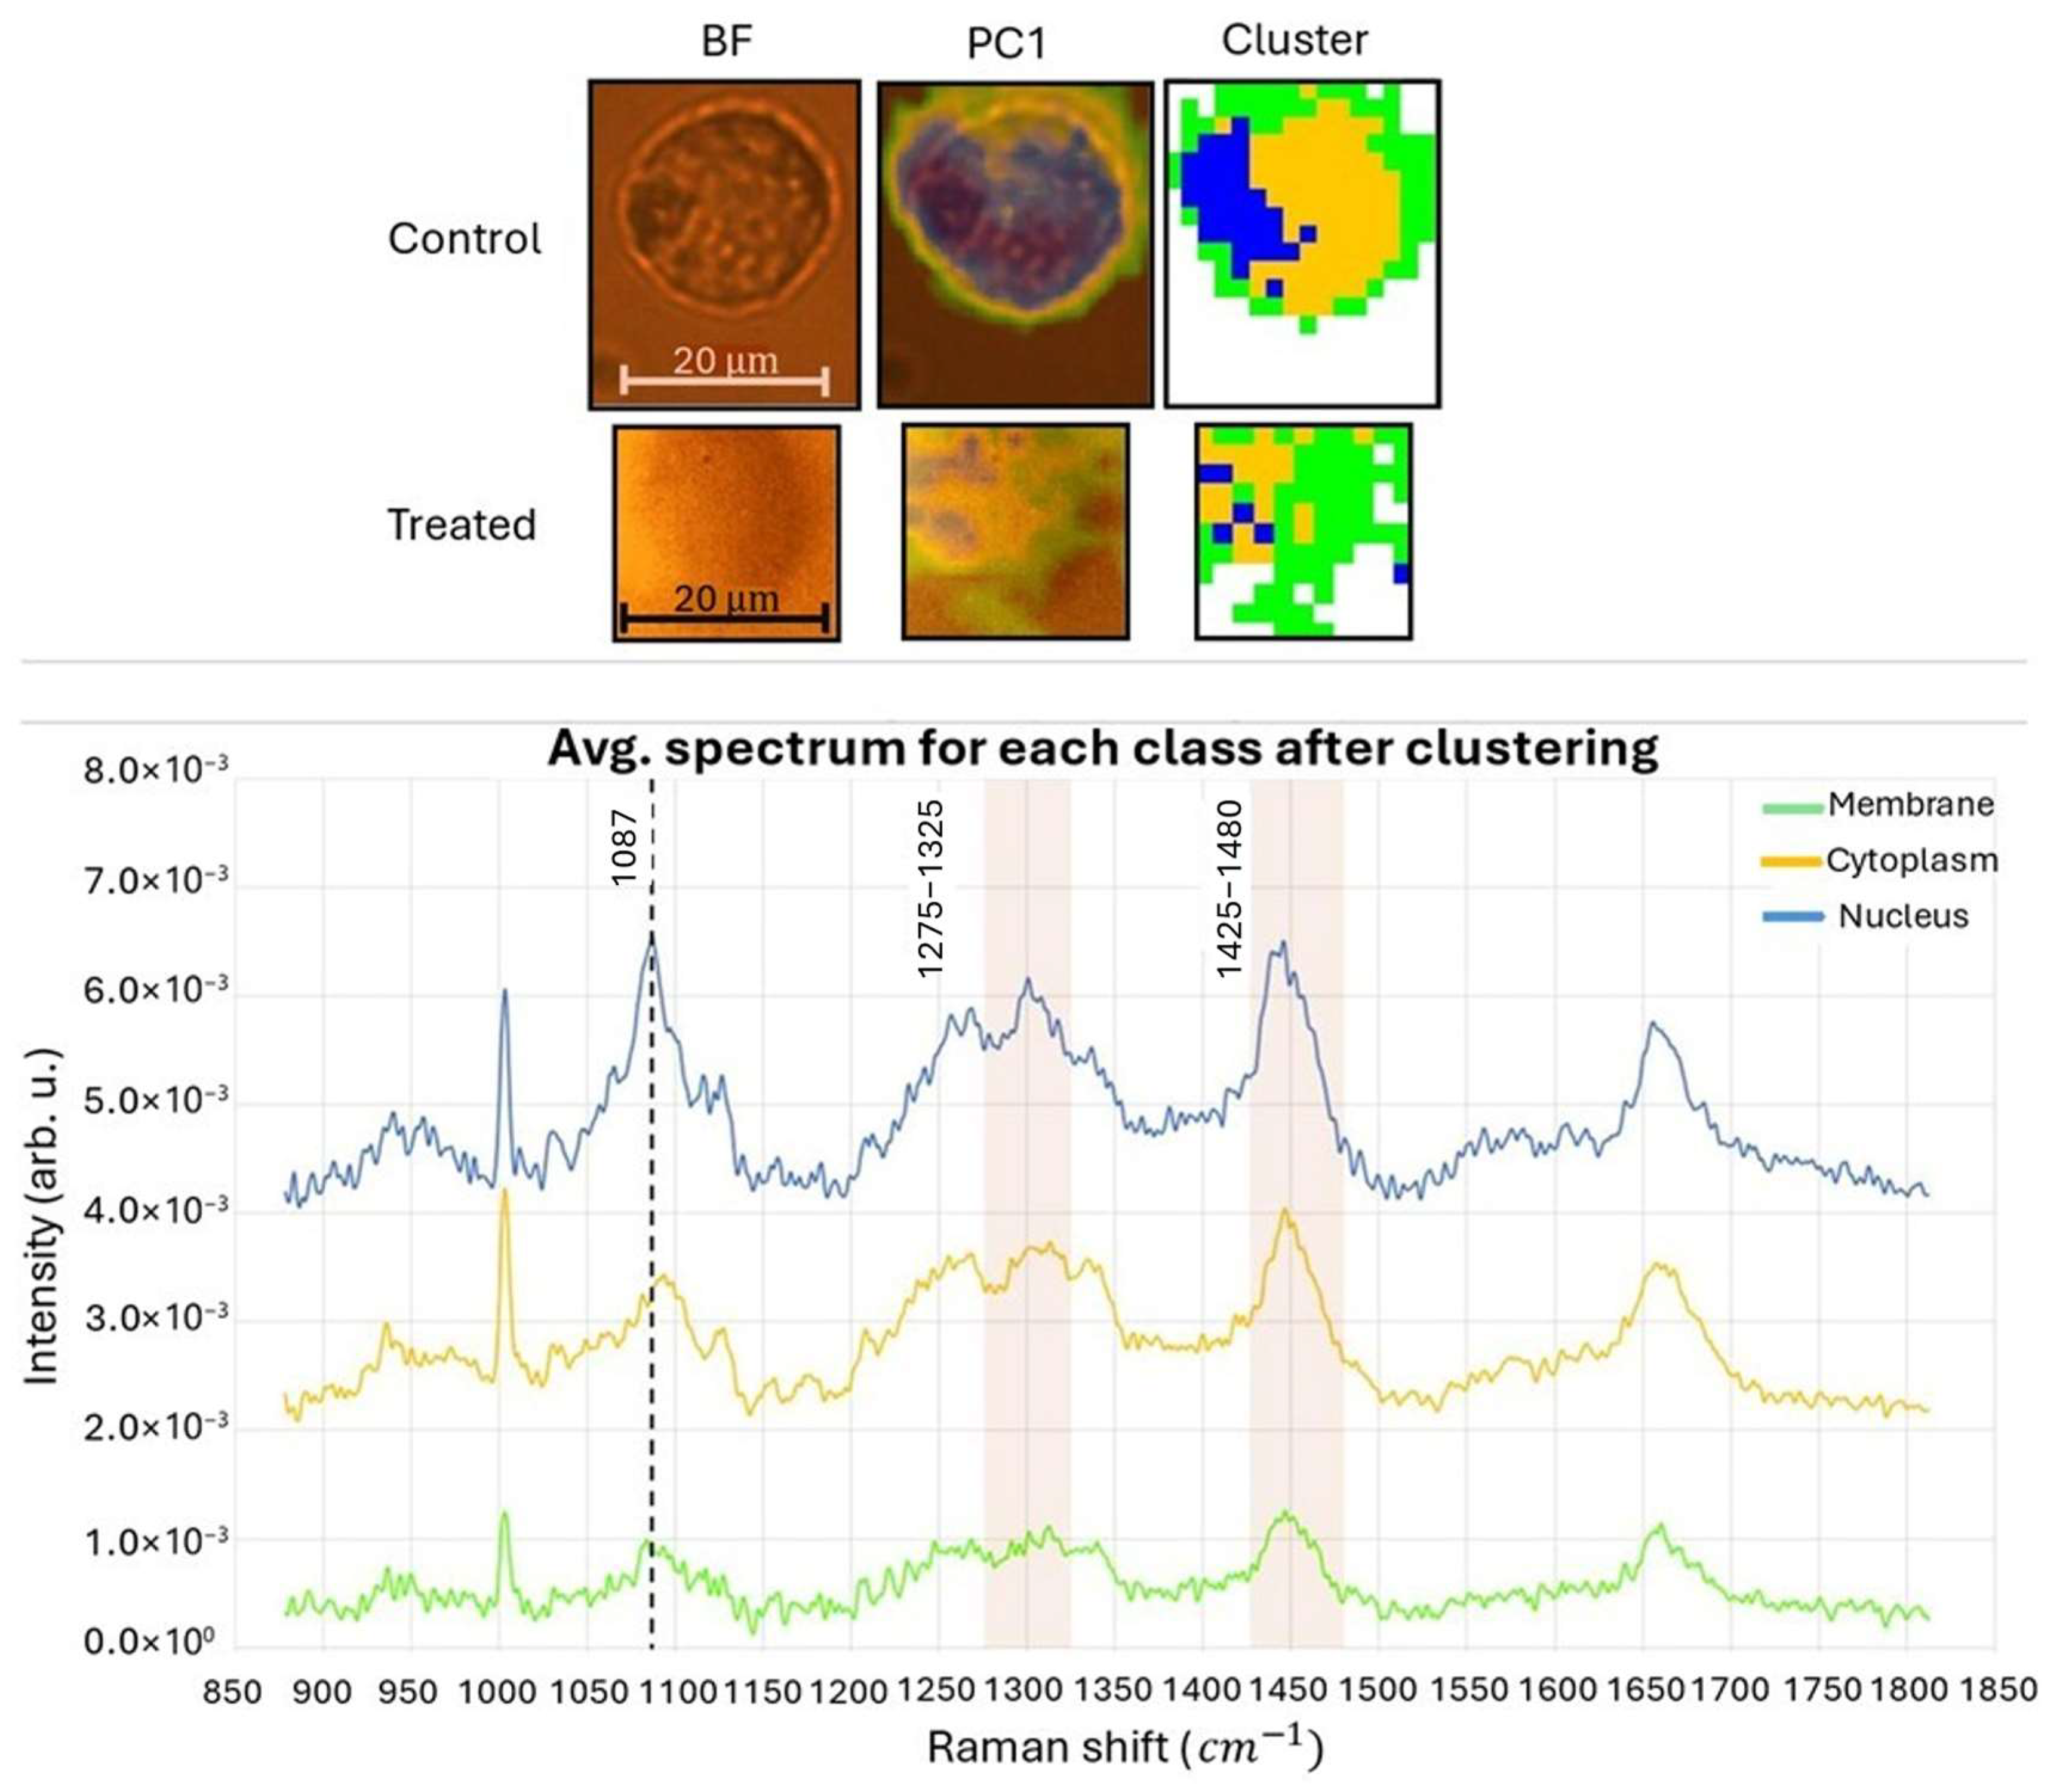
- The first map was collected from the control sample using an objective lens with a magnification of 50× and N.A. 0.50. The acquired map had dimensions of 32 μm × 36 μm. The pixel matrix used was 16 × 18, resulting in a total of 288 pixels. Each pixel had a square shape with a side length of 2 μm.
- The second map was acquired from the H2O2-treated sample using the same 50×/0.50 objective lens. The dimensions of this map were 22 μm × 22 μm. The pixel matrix used for this map was 11 × 11, resulting in a total of 121 pixels. Each pixel had a square shape with a side length of 2 μm.
3. Results
3.1. Experimental Characterization of the PMD
3.2. Experimental Validation with Biological Samples

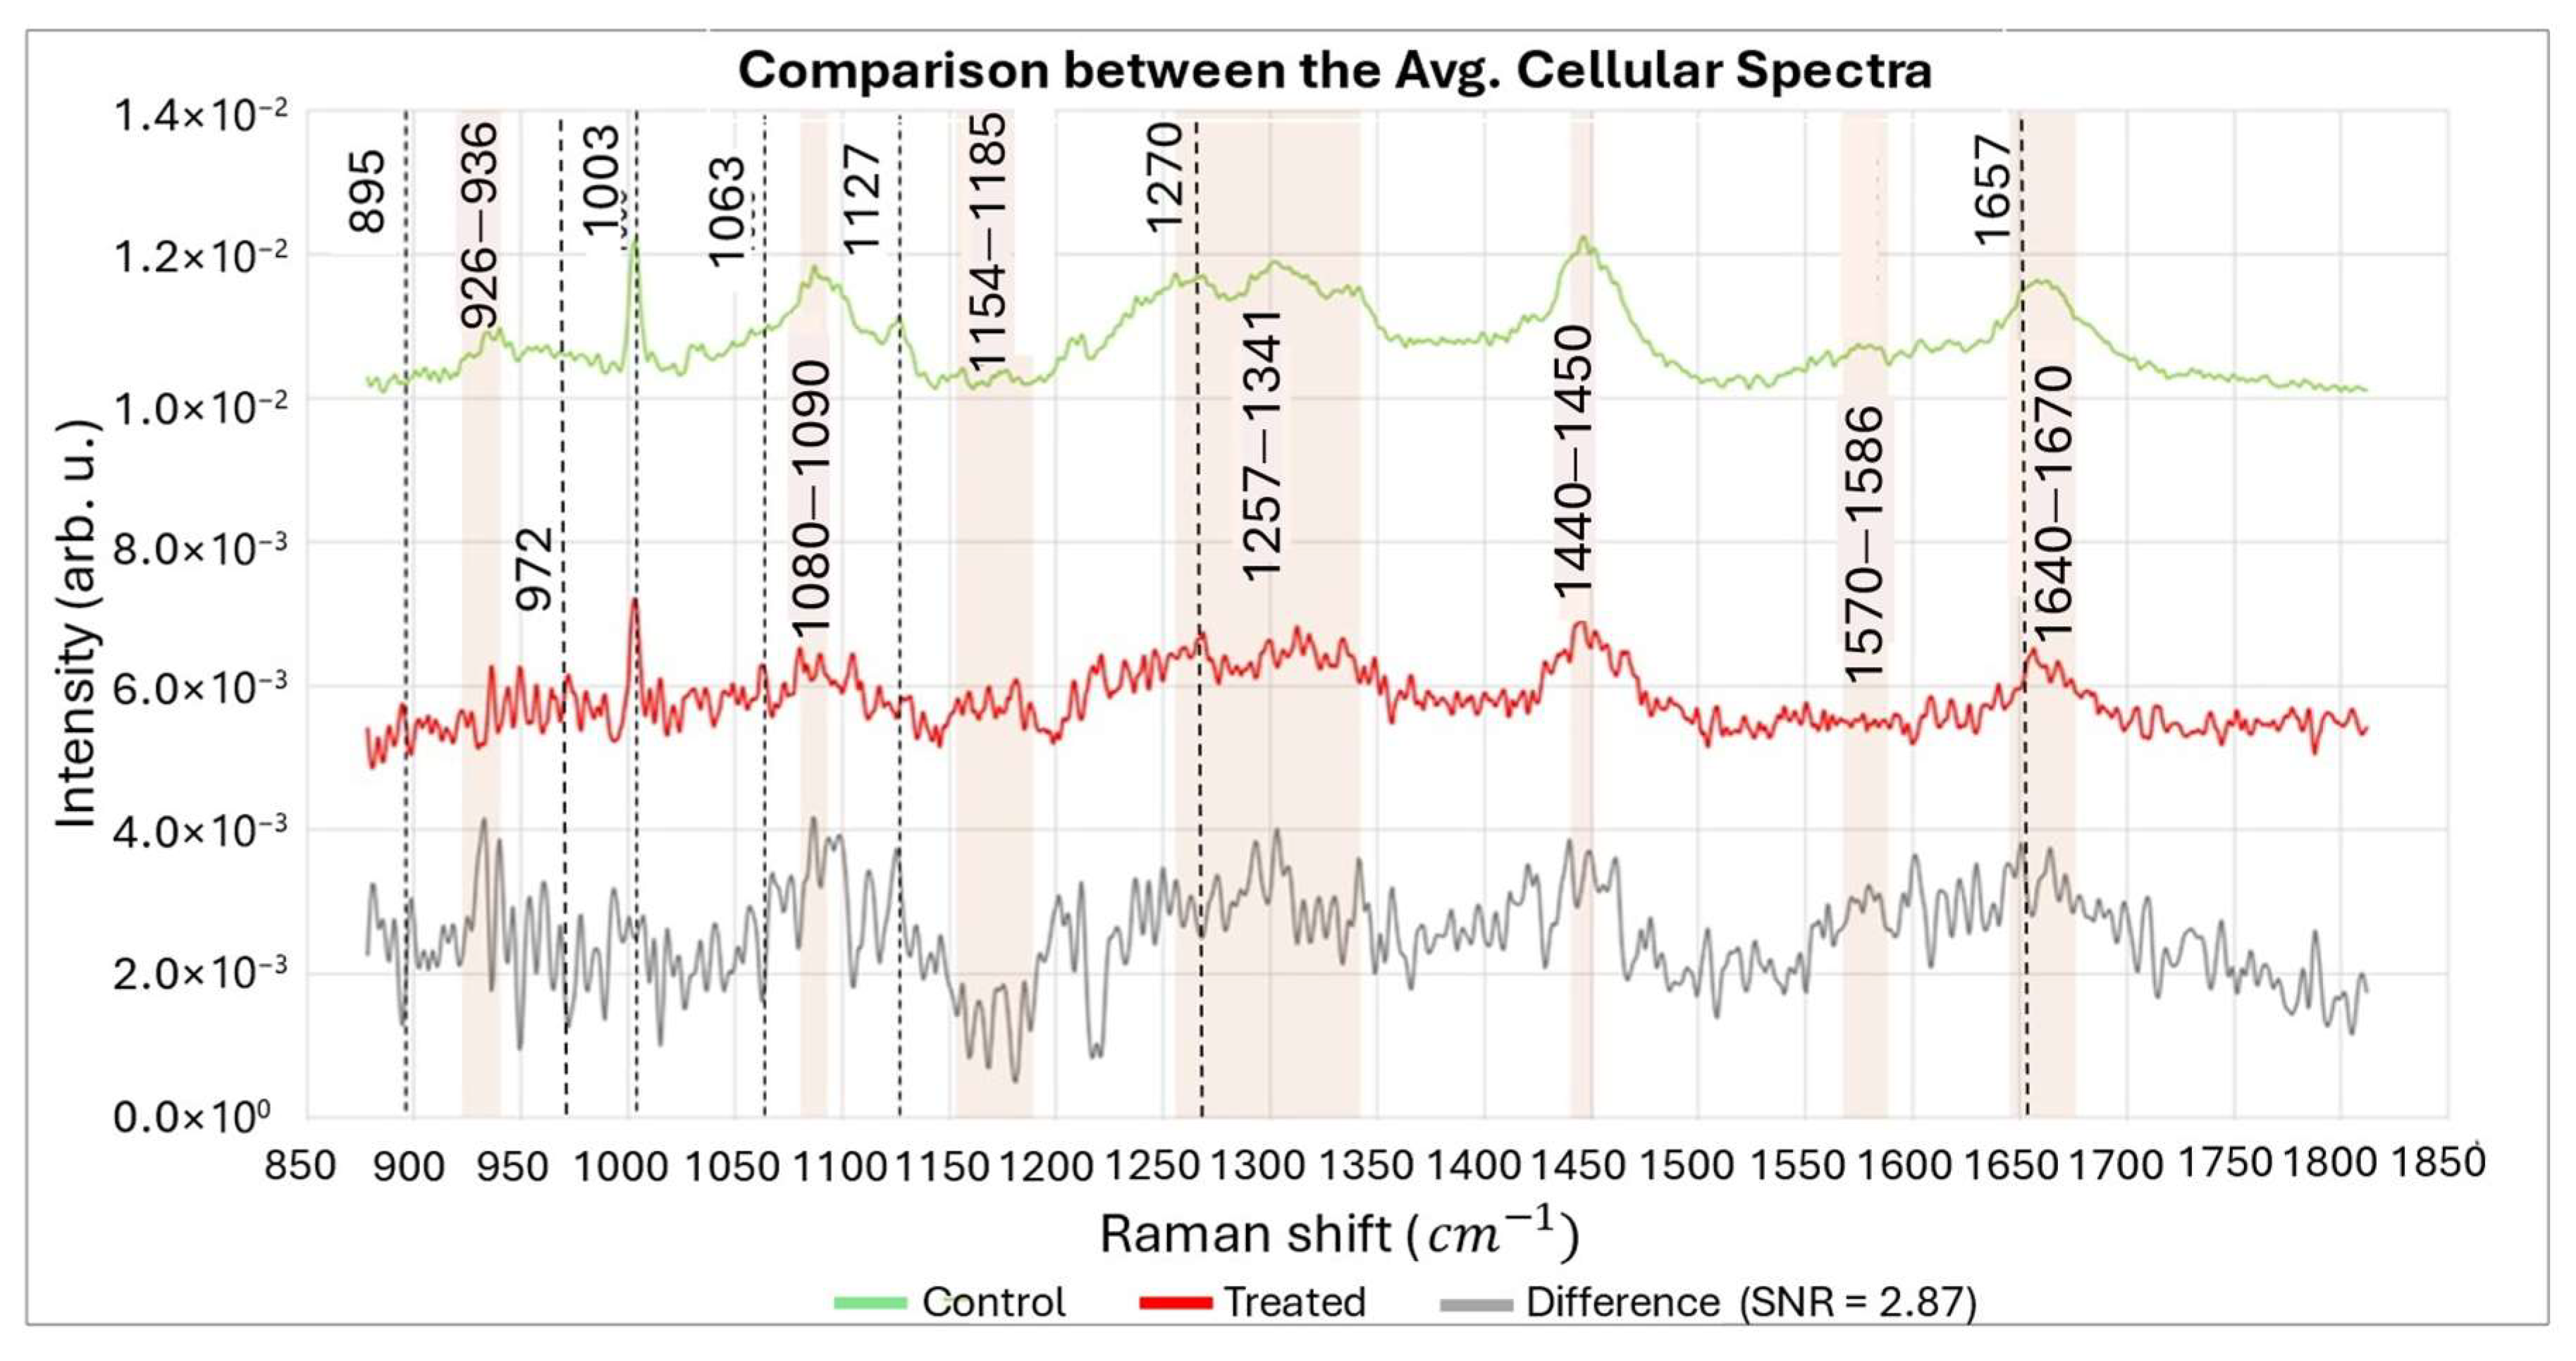
| Before ROS Attack | After ROS Attack | Possible Assignments of Raman Peaks | References |
|---|---|---|---|
| 895 | ↑ | Phosphodiester, Deoxyribose | [69] |
| 926–940 | ↓↑ | DNA backbone vibration | [59,70] |
| 972 | ↑ | Phosphatidylcholine | [67,68] |
| 1003 | ↔ | Phenylalanine | [59] |
| 1063 | ↑ | C-C skeletal stretch random conformation | [71] |
| 1080–1090 | ↓ | DNA backbone vibration | [59,61,63] |
| 1127 | ↓ | C-N stretching (proteins) C-O stretching (carbohydrates) | [72] |
| 1154–1185 | ↑ | Unpaired nucleotides | [60,61,63] |
| 1270 | ↑ | Phosphatidylcholine | [67,68] |
| 1257–1341 | ↓ | dA, dT (ring breathing modes of the DNA/RNA bases), Amide III (protein), CH3, CH2 (twisting), CH2 deformation (lipid) | [59,73,74] |
| 1440–1450 | ↓ | CH2 bending modes of proteins and lipids | [59,61] |
| 1570–1586 | ↓ | dG, dA, ring breathing modes in the DNA bases, C=C Phenylalanine, Pyrimidine ring (nucleic acids) | [59] |
| 1657 | ↑ | Phosphatidylcholine | [67,68] |
| 1640–1670 | ↓ | Amide I, Nucleic acids, C=O and C=C stretches | [59,64] |
4. Conclusions
Supplementary Materials
Author Contributions
Funding
Institutional Review Board Statement
Informed Consent Statement
Data Availability Statement
Conflicts of Interest
References
- Ma, D.; Qin, X.; Zhong, Z.A.; Liao, H.; Chen, P.; Zhang, B. Systematic analysis of myocardial immune progression in septic cardiomyopathy: Immune-related mechanisms in septic cardiomyopathy. Front. Cardiovasc. Med. 2023, 9, 1036928. [Google Scholar] [CrossRef] [PubMed]
- Langhans, S.A. Three-Dimensional in Vitro Cell Culture Models in Drug Discovery and Drug Repositioning. Front. Pharmacol. 2018, 9, 6. [Google Scholar] [CrossRef] [PubMed]
- Ramaiahgari, S.C.; den Braver, M.W.; Herpers, B.; Terpstra, V.; Commandeur, J.N.; van de Water, B.; Price, L.S. A 3D in vitro model of differentiated HepG2 cell spheroids with improved liver-like properties for repeated dose high-throughput toxicity studies. Arch. Toxicol. 2014, 88, 1083–1095. [Google Scholar] [CrossRef] [PubMed]
- Kamel, R.; El-Wakil, N.A.; Abdelkhalek, A.A.; Elkasabgy, N.A. Nanofibrillated cellulose/cyclodextrin based 3D scaffolds loaded with raloxifene hydrochloride for bone regeneration. Int. J. Biol. Macromol. 2020, 156, 704–716. [Google Scholar] [CrossRef] [PubMed]
- de Siqueira, L.; Grenho, L.; Fernandes, M.H.; Monteiro, F.J.; Trichês, E.S. 45S5 bioglass-derived glass-ceramic scaffolds containing niobium obtained by gelcasting method. Mater. Res. 2021, 24, e20200403. [Google Scholar] [CrossRef]
- Miller, A.J.; Spence, J.R. In Vitro Models to Study Human Lung Development, Disease and Homeostasis. Physiology 2017, 32, 246–260. [Google Scholar] [CrossRef] [PubMed]
- Roulis, M.; Kaklamanos, A.; Schernthanner, M.; Bielecki, P.; Zhao, J.; Kaffe, E.; Frommelt, L.S.; Qu, R.; Knapp, M.S.; Henriques, A.; et al. Paracrine orchestration of intestinal tumorigenesis by a mesenchymal niche. Nature 2020, 580, 524–529. [Google Scholar] [CrossRef] [PubMed]
- González-Gualda, E.; Baker, A.G.; Fruk, L.; Muñoz-Espín, D. A guide to assessing cellular senescence in vitro and in vivo. FEBS J. 2021, 288, 56–80. [Google Scholar] [CrossRef] [PubMed]
- Hashemzadeh, H.; Shojaeilangari, S.; Allahverdi, A.; Rothbauer, M.; Ertl, P.; Naderi-Manesh, H. A combined microfluidic deep learning approach for lung cancer cell high throughput screening toward automatic cancer screening applications. Sci. Rep. 2021, 11, 9804. [Google Scholar] [CrossRef] [PubMed]
- Jagannadh, V.K.; Gopakumar, G.; Subrahmanyam, G.; Gorthi, S.S. Microfluidic microscopy-assisted label-free approach for cancer screening: Automated microfluidic cytology for cancer screening. Med. Biol. Eng. Comput. 2017, 55, 711–718. [Google Scholar] [CrossRef] [PubMed]
- Lee, S.Y.; Yoon, K.A.; Jang, S.H.; Ganbold, E.O.; Uuriintuya, D.; Shin, S.M.; Ryu, P.D.; Joo, S.W. Infrared spectroscopy characterization of normal and lung cancer cells originated from epithelium. J. Vet. Sci. 2009, 10, 299–304. [Google Scholar] [CrossRef] [PubMed]
- Willner, M.R.; McMillan, K.S.; Graham, D.; Vikesland, P.J.; Zagnoni, M. Surface-Enhanced Raman Scattering Based Microfluidics for Single-Cell Analysis. Anal. Chem. 2018, 90, 12004–12010. [Google Scholar] [CrossRef] [PubMed]
- Spengler, N.; Höfflin, J.; Moazenzadeh, A.; Mager, D.; MacKinnon, N.; Badilita, V.; Wallrabe, U.; Korvink, J.G. Heteronuclear Micro-Helmholtz Coil Facilitates µm-Range Spatial and Sub-Hz Spectral Resolution NMR of nL-Volume Samples on Customisable Microfluidic Chips. PLoS ONE 2016, 11, e0146384. [Google Scholar] [CrossRef] [PubMed]
- Kosa, G.; Shapaval, V.; Kohler, A.; Zimmermann, B. FTIR spectroscopy as a unified method for simultaneous analysis of intra- and extracellular metabolites in high-throughput screening of microbial bioprocesses. Microb. Cell Factories 2017, 16, 195. [Google Scholar] [CrossRef] [PubMed]
- Perozziello, G.; Candeloro, P.; De Grazia, A.; Esposito, F.; Allione, M.; Coluccio, M.; Tallerico, R.; Valpapuram, I.; Tirinato, L.; Das, G.; et al. Microfluidic device for continuous single cells analysis via Raman spectroscopy enhanced by integrated plasmonic nanodimers. Opt. Express 2016, 24, A180. [Google Scholar] [CrossRef] [PubMed]
- Marze, S.; Nguyen, H.T.; Marquis, M. Manipulating and studying triglyceride droplets in microfluidic devices. Biochimie 2020, 169, 88–94. [Google Scholar] [CrossRef] [PubMed]
- Lai, S.; Wang, S.; Luo, J.; Lee, L.J.; Yang, S.T.; Madou, M.J. Design of a compact disk-like microfluidic platform for enzyme-linked immunosorbent assay. Anal. Chem. 2004, 76, 1832–1837. [Google Scholar] [CrossRef] [PubMed]
- Adler, A.S.; Mizrahi, R.A.; Spindler, M.J.; Adams, M.S.; Asensio, M.A.; Edgar, R.C.; Leong, J.; Leong, R.; Johnson, D.S. Rare, high-affinity mouse anti-PD-1 antibodies that function in checkpoint blockade, discovered using microfluidics and molecular genomics. mAbs 2017, 9, 1270–1281. [Google Scholar] [CrossRef] [PubMed]
- MacArthur Clark, J. The 3Rs in research: A contemporary approach to replacement, reduction and refinement. Br. J. Nutr. 2018, 120, S1–S7. [Google Scholar] [CrossRef] [PubMed]
- Zille, M.; Farr, T.D.; Przesdzing, I.; Müller, J.; Sommer, C.; Dirnagl, U.; Wunder, A. Visualizing Cell Death in Experimental Focal Cerebral Ischemia: Promises, Problems, and Perspectives. J. Cereb. Blood Flow. Metab. 2011, 32, 213–231. [Google Scholar] [CrossRef] [PubMed]
- Hickey, S.M.; Ung, B.; Bader, C.; Brooks, R.; Lazniewska, J.; Johnson, I.R.D.; Sorvina, A.; Logan, J.; Martini, C.; Moore, C.R.; et al. Fluorescence Microscopy—An Outline of Hardware, Biological Handling, and Fluorophore Considerations. Cells 2022, 11, 35. [Google Scholar] [CrossRef] [PubMed]
- Xie, J.; Han, D.; Xu, S.; Zhang, H.; Li, Y.; Zhang, M.; Deng, Z.; Tian, J.; Ye, Q. An Image-Based High-Throughput and High-Content Drug Screening Method Based on Microarray and Expansion Microscopy. ACS Nano 2023, 17, 15516–15528. [Google Scholar] [CrossRef] [PubMed]
- Lubin, A.; Otterstrom, J.; Hoade, Y.; Bjedov, I.; Stead, E.; Whelan, M.; Gestri, G.; Paran, Y.; Payne, E. A versatile, automated and high-throughput drug screening platform for zebrafish embryos. Biol. Open 2021, 10, bio058513. [Google Scholar] [CrossRef] [PubMed]
- Ma, J.; Cao, Q.; McLeod, S.M.; Ferguson, K.; Gao, N.; Breeze, A.L.; Hu, J. Target-based whole-cell screening by 1H NMR spectroscopy. Angew. Chem. (Int. Ed. Engl.) 2015, 54, 4764–4767. [Google Scholar] [CrossRef] [PubMed]
- Altangerel, N.; Neuman, B.W.; Hemmer, P.R.; Yakovlev, V.V.; Rajil, N.; Yi, Z.; Sokolov, A.V.; Scully, M.O. Label-free drug interaction screening via Raman microscopy. Proc. Natl. Acad. Sci. USA 2023, 120, e2218826120. [Google Scholar] [CrossRef] [PubMed]
- Polshin, E.; Verbruggen, B.; Witters, D.; Sels, B.; De Vos, D.; Nicolaï, B.; Lammertyn, J. Integration of Microfluidics and FT-IR Microscopy for Label-Free Study of Enzyme Kinetics. Sens. Actuators B Chem. 2014, 196, 175–182. [Google Scholar] [CrossRef]
- Srisa-Art, M.; Noblitt, S.D.; Krummel, A.T.; Henry, C.S. IR-Compatible PDMS microfluidic devices for monitoring of enzyme kinetics. Anal. Chim. Acta 2018, 1021, 95–102. [Google Scholar] [CrossRef] [PubMed]
- Loutherback, K.; Chen, L.; Holman, H.Y. Open-channel microfluidic membrane device for long-term FT-IR spectromicroscopy of live adherent cells. Anal. Chem. 2015, 87, 4601–4606. [Google Scholar] [CrossRef] [PubMed]
- Flaman, G.T.; Boyle, N.D.; Vermelle, C.; Morhart, T.A.; Ramaswami, B.; Read, S.; Rosendahl, S.M.; Wells, G.; Newman, L.P.; Atkinson, N.; et al. Chemical Imaging of Mass Transport Near the No-Slip Interface of a Microfluidic Device using Attenuated Total Reflection–Fourier Transform Infrared Spectroscopy. Anal. Chem. 2023, 95, 4940–4949. [Google Scholar] [CrossRef] [PubMed]
- Candeloro, P.; Tirinato, L.; Malara, N.; Fregola, A.; Casals, E.; Puntes, V.; Perozziello, G.; Gentile, F.; Coluccio, M.L.; Das, G.; et al. Nanoparticle microinjection and Raman spectroscopy as tools for nanotoxicology studies. Analyst 2011, 136, 4402–4408. [Google Scholar] [CrossRef] [PubMed]
- Valpapuram, I.; Candeloro, P.; Coluccio, M.L.; Parrotta, E.I.; Giugni, A.; Das, G.; Cuda, G.; Di Fabrizio, E.; Perozziello, G. Waveguiding and SERS Simplified Raman Spectroscopy on Biological Samples. Biosensors 2019, 9, 37. [Google Scholar] [CrossRef] [PubMed]
- Coluccio, M.L.; Gentile, F.; Das, G.; Nicastri, A.; Perri, A.M.; Candeloro, P.; Perozziello, G.; Proietti Zaccaria, R.; Gongora, J.S.; Alrasheed, S.; et al. Detection of single amino acid mutation in human breast cancer by disordered plasmonic self-similar chain. Sci. Adv. 2015, 1, e1500487. [Google Scholar] [CrossRef] [PubMed]
- Russo, M.; Tirinato, L.; Scionti, F.; Coluccio, M.L.; Perozziello, G.; Riillo, C.; Mollace, V.; Gratteri, S.; Malara, N.; Di Martino, M.T.; et al. Raman Spectroscopic Stratification of Multiple Myeloma Patients Based on Exosome Profiling. ACS Omega 2020, 5, 30436–30443. [Google Scholar] [CrossRef] [PubMed]
- Read, D.S.; Whiteley, A.S. Chemical fixation methods for Raman spectroscopy-based analysis of bacteria. J. Microbiol. Methods 2015, 109, 79–83. [Google Scholar] [CrossRef] [PubMed]
- Rangan, S.; Wong, R.; Schulze, H.G.; Vardaki, M.Z.; Blades, M.W.; Turner, R.F.B.; Piret, J.M. Saline dry fixation for improved cell composition analysis using Raman spectroscopy. Analyst 2023, 148, 2745–2757. [Google Scholar] [CrossRef] [PubMed]
- Mariani, M.M.; Lampen, P.; Popp, J.; Wood, B.R.; Deckert, V. Impact of fixation on in vitro cell culture lines monitored with Raman spectroscopy. Analyst 2009, 134, 1198–1205. [Google Scholar] [CrossRef] [PubMed]
- Guzzi, F.; Candeloro, P.; Coluccio, M.L.; Cristiani, C.M.; Parrotta, E.I.; Scaramuzzino, L.; Scalise, S.; Dattola, E.; D’Attimo, M.A.; Cuda, G.; et al. A Disposable Passive Microfluidic Device for Cell Culturing. Biosensors 2020, 10, 18. [Google Scholar] [CrossRef] [PubMed]
- Limongi, T.; Guzzi, F.; Parrotta, E.; Candeloro, P.; Scalise, S.; Lucchino, V.; Gentile, F.; Tirinato, L.; Coluccio, M.L.; Torre, B.; et al. Microfluidics for 3D Cell and Tissue Cultures: Microfabricative and Ethical Aspects Updates. Cells 2022, 11, 1699. [Google Scholar] [CrossRef] [PubMed]
- Halldorsson, S.; Lucumi, E.; Gómez-Sjöberg, R.; Fleming, R.M.T. Advantages and challenges of microfluidic cell culture in polydimethylsiloxane devices. Biosens. Bioelectron. 2015, 63, 218–231. [Google Scholar] [CrossRef] [PubMed]
- Coluccio, M.L.; Perozziello, G.; Malara, N.; Parrotta, E.; Zhang, P.; Gentile, F.; Limongi, T.; Raj, P.M.; Cuda, G.; Candeloro, P.; et al. Microfluidic platforms for cell cultures and investigations. Microelectron. Eng. 2019, 208, 14–28. [Google Scholar] [CrossRef]
- Xu, Y.; Chan, M.T.J.; Yang, M.; Meng, H.; Chen, C.-H. Time-resolved single-cell secretion analysis via microfluidics. Lab A Chip 2025, 25, 1282–1295. [Google Scholar] [CrossRef] [PubMed]
- Wang, C.; Hu, W.; Guan, L.; Yang, X.; Liang, Q. Single-cell metabolite analysis on a microfluidic chip. Chin. Chem. Lett. 2021, 33, 2883–2892. [Google Scholar] [CrossRef]
- Yuan, S.; Zhang, P.; Zhang, F.; Yan, S.; Dong, R.; Wu, C.; Deng, J. Profiling signaling mediators for cell-cell interactions and communications with microfluidics-based single-cell analysis tools. iScience 2024, 28, 111663. [Google Scholar] [CrossRef] [PubMed]
- Vukasinovic, J.; Cullen, D.K.; LaPlaca, M.C.; Glezer, A. A microperfused incubator for tissue mimetic 3D cultures. Biomed. Microdevices 2009, 11, 1155–1165. [Google Scholar] [CrossRef] [PubMed]
- Yamashiro, T.; Kushibiki, T.; Mayumi, Y.; Tsuchiya, M.; Ishihara, M.; Azuma, R. Novel cell culture system for monitoring cells during continuous and variable negative-pressure wound therapy. Ski. Res. Technol. 2023, 29, e13262. [Google Scholar] [CrossRef] [PubMed]
- Resch, H.; Brühmann, J.; Lanzaro, L.; Niehren, S. Long-Term Live Cell Imaging on a Whole Slide Scanning Microscope: Watching Cells Adhering and Growing. 2021. Available online: https://www.molecular-machines.com/wp-content/uploads/AppNote_MMI-CS-006_LiveCellImaging_V01.pdf (accessed on 9 July 2025).
- Ince, C.; Ypey, D.L.; Diesselhoff-Den Dulk, M.M.; Visser, J.A.; De Vos, A.; Van Furth, R. Micro-CO2-incubator for use on a microscope. J. Immunol. Methods 1983, 60, 269–275. [Google Scholar] [CrossRef] [PubMed]
- Flueckiger, J.; Cheung, K.C. Integrated microfluidic systems for cell culture and characterization. In Proceedings of the 2008 IEEE 14th International Mixed-Signals, Sensors, and Systems Test Workshop, Vancouver, BC, Canada, 18–20 June 2008; pp. 1–6. [Google Scholar]
- Barata, D.; Provaggi, E.; van Blitterswijk, C.; Habibovic, P. Development of a microfluidic platform integrating high-resolution microstructured biomaterials to study cell-material interactions. Lab A Chip 2017, 17, 4134–4147. [Google Scholar] [CrossRef] [PubMed]
- Daniszewski, M.; Crombie, D.E.; Henderson, R.; Liang, H.H.; Wong, R.C.B.; Hewitt, A.W.; Pébay, A. Automated Cell Culture Systems and Their Applications to Human Pluripotent Stem Cell Studies. SLAS Technol. 2018, 23, 315–325. [Google Scholar] [CrossRef] [PubMed]
- Lorusso, D.; Nikolov, H.N.; Milner, J.S.; Ochotny, N.M.; Sims, S.M.; Dixon, S.J.; Holdsworth, D.W. Practical fabrication of microfluidic platforms for live-cell microscopy. Biomed. Microdevices 2016, 18, 78. [Google Scholar] [CrossRef] [PubMed]
- Perozziello, G.; Krühne, U.; Luciani, P. (Eds.) Microfluidics for Cellular Applications: A Volume in Micro and Nano Technologies; Elsevier: Amsterdam, The Netherlands, 2023. [Google Scholar]
- Scott, S.M.; Ali, Z. Fabrication Methods for Microfluidic Devices: An Overview. Micromachines 2021, 12, 319. [Google Scholar] [CrossRef] [PubMed]
- Snakenborg, D.; Perozziello, G.; Klank, H.; Geschke, O.; Kutter, J.P. Direct milling and casting of polymer-based optical waveguides for improved transparency in the visible range. J. Micromechanics MicroEngineering 2006, 16, 375–381. [Google Scholar] [CrossRef]
- Guckenberger, D.J.; de Groot, T.E.; Wan, A.M.; Beebe, D.J.; Young, E.W. Micromilling: A method for ultra-rapid prototyping of plastic microfluidic devices. Lab. A Chip 2015, 15, 2364–2378. [Google Scholar] [CrossRef] [PubMed]
- Wambua, J.M.; Mwema, F.M.; Tanya, B.; Jen, T.C. CNC Milling of Medical-Grade PMMA: Optimization of Material Removal Rate and Surface Roughness. Int. J. Manuf. Mater. Mech. Eng. 2022, 12, 1–15. [Google Scholar] [CrossRef]
- Bruus, H. Theoretical Microfluidics; Oxford University Press: Oxford, UK, 2008. [Google Scholar]
- Palizban, A.; Sadeghi-Aliabadi, H.; Abdolahpour, F. Effect of cerium lanthanide on Hela and MCF-7 cancer cell growth. Res. Pharm. Sci. 2011, 5, 119–125. [Google Scholar]
- Movasaghi, Z.; Rehman, S.; Rehman, I. Raman Spectroscopy of Biological Tissues. Appl. Spectrosc. Rev. 2007, 42, 493–541. [Google Scholar] [CrossRef]
- Notingher, I.; Verrier, S.; Romanska, H.; Bishop, A.E.; Polak, J.M.; Hench, L.L. In situ Characterisation of Living Cells by Raman Spectroscopy. J. Spectrosc. 2002, 16, 408381. [Google Scholar] [CrossRef]
- Panikkanvalappil, S.R.; Mahmoud, M.A.; Mackey, M.A.; El-Sayed, M.A. Surface-enhanced Raman spectroscopy for real-time monitoring of reactive oxygen species-induced DNA damage and its prevention by platinum nanoparticles. ACS Nano 2013, 7, 7524–7533. [Google Scholar] [CrossRef] [PubMed]
- Duguid, J.G.; Bloomfield, V.A.; Benevides, J.M.; Thomas, G.J., Jr. Raman spectroscopy of DNA-metal complexes, I.I. The thermal 291 References denaturation of DNA in the presence of Sr2+, Ba2+, Mg2+, Ca2+, Mn2+, Co2+, Ni2+, and Cd2+. Biophys. J. 1995, 69, 2623–2641. [Google Scholar] [CrossRef] [PubMed]
- Sofińska, K.; Wilkosz, N.; Szymoński, M.; Lipiec, E. Molecular Spectroscopic Markers of DNA Damage. Molecules 2020, 25, 561. [Google Scholar] [CrossRef] [PubMed]
- Cheng, W.T.; Liu, M.T.; Liu, H.N.; Lin, S.Y. Micro-Raman spectroscopy used to identify and grade human skin pilomatrixoma. Microsc. Res. Tech. 2005, 68, 75–79. [Google Scholar] [CrossRef] [PubMed]
- Tang, P.; Cheng, W.; He, X.; Zhang, Q.; Zhong, J.; Lu, X.; Liu, S.; Zhong, L. Raman spectrum spectral imaging revealing the molecular mechanism of Berberine-induced Jurkat cell apoptosis and the receptor-mediated Berberine delivery system. Biomed. Opt. Express 2019, 10, 1581–1600. [Google Scholar] [CrossRef] [PubMed]
- Fang, W.; Zhu, Y.; Yang, S.; Tong, X.; Ye, C. Reciprocal regulation of phosphatidylcholine synthesis and H3K36 methylation programs metabolic adaptation. Cell Rep. 2022, 39, 110672. [Google Scholar] [CrossRef] [PubMed]
- Pezzotti, G. Raman spectroscopy in cell biology and microbiology. J. Raman Spectrosc. 2021, 52, 2243–2348. [Google Scholar] [CrossRef]
- Perozziello, G.; Catalano, R.; Francardi, M.; Rondanina, E.; Pardeo, F.; Angelis, F.D.; Malara, N.; Candeloro, P.; Morrone, G.; Di Fabrizio, E. A microfluidic device integrating plasmonic nanodevices for Raman spectroscopy analysis on trapped single living cells. Microelectron. Eng. 2013, 111, 314–319. [Google Scholar] [CrossRef]
- Ruiz-Chica, A.J.; Medina, M.A.; Sánchez-Jiménez, F.; Ramírez, F.J. Characterization by Raman spectroscopy of conformational changes on guanine–cytosine and adenine–thymine oligonucleotides induced by aminooxy analogues of spermidine. J. Raman Spectrosc. 2004, 35, 93–100. [Google Scholar] [CrossRef]
- Olive, P.L.; Banáth, J.P. The comet assay: A method to measure DNA damage in individual cells. Nat. Protoc. 2006, 1, 23–29. [Google Scholar] [CrossRef] [PubMed]
- Ó Faoláin, E.; Hunter, M.B.; Byrne, J.M.; Kelehan, P.; McNamara, M.; Byrne, H.J.; Lyng, F.M. A study examining the effects of tissue processing on human tissue sections using vibrational spectroscopy. Vib. Spectrosc. 2005, 38, 121–127. [Google Scholar] [CrossRef]
- Notingher, I.; Green, C.; Dyer, C.; Perkins, E.; Hopkins, N.; Lindsay, C.; Hench, L.L. Discrimination between ricin and sulphur mustard toxicity in vitro using Raman spectroscopy. J. R. Soc. Interface 2004, 1, 79–90. [Google Scholar] [CrossRef] [PubMed]
- Stone, N.; Kendall, C.; Smith, J.; Crow, P.; Barr, H. Raman spectroscopy for identification of epithelial cancers. Faraday Discuss. 2004, 126, 141–157; discussion 169–183. [Google Scholar] [CrossRef] [PubMed]
- Frank, C.J.; McCreery, R.L.; Redd, D.C. Raman spectroscopy of normal and diseased human breast tissues. Anal. Chem. 1995, 67, 777–783. [Google Scholar] [CrossRef] [PubMed]
- IEC 60601-1:2005+AMD1:2012+AMD2:2020; Medical Electrical Equipment—Part 1: General Requirements for Basic Safety and Essential Performance. International Electrotechnical Commission (IEC): Geneva, Switzerland, 2020.
- ISO 10993-1:2018; Biological Evaluation of Medical Devices—Part 1: Evaluation and Testing Within a Risk Management Process. International Organization for Standardization (ISO): Geneva, Switzerland, 2018.
- ISO 13482:2014; Robots and Robotic Devices—Safety Requirements for Personal Care Robots. International Organization for Standardization (ISO): Geneva, Switzerland, 2014.
- IEC 62304:2006; Medical Device Software—Software Life Cycle Processes. International Electrotechnical Commission (IEC): Geneva, Switzerland, 2006.
- IEC 62366-1:2015/AMD1:2020; Medical Devices—Part 1: Application of Usability Engineering to Medical Devices. International Electrotechnical Commission (IEC): Geneva, Switzerland, 2020.
- Kosky, P.G.; Balmer, R.T.; Keat, W.D.; Wise, G. Chapter 12—Mechanical Engineering. In Exploring Engineering: An Introduction to Engineering and Design; Academic Press: Cambridge, UK, 2021. [Google Scholar]
- American Air & Water®, Inc. UV Irradiation Dosage Table. Availabe online: https://americanairandwater.com/uv-facts/uv-dosage.htm (accessed on 20 October 2022).
- Joux, F.; Jeffrey, W.H.; Lebaron, P.; Mitchell, D.L. Marine bacterial isolates display diverse responses to UV-B radiation. Appl. Environ. Microbiol. 1999, 65, 3820–3827. [Google Scholar] [CrossRef] [PubMed]
- Thurston-Enriquez, J.A.; Haas, C.N.; Jacangelo, J.; Riley, K.; Gerba, C.P. Inactivation of feline calicivirus and adenovirus type 40 by UV radiation. Appl. Environ. Microbiol. 2003, 69, 577–582. [Google Scholar] [CrossRef] [PubMed]

| Optimal Parameters for the Reproduction of the Cellular Microenvironment | |
|---|---|
| Temperature | |
| Relative humidity | |
| pH | |
| Sterility | Sterile environment |
| Parameter | Value |
|---|---|
| Heating glass temperature | 45 °C |
| Heating blocks temperature | 50 °C |
| Cart heater temperature | 43 °C |
Disclaimer/Publisher’s Note: The statements, opinions and data contained in all publications are solely those of the individual author(s) and contributor(s) and not of MDPI and/or the editor(s). MDPI and/or the editor(s) disclaim responsibility for any injury to people or property resulting from any ideas, methods, instructions or products referred to in the content. |
© 2025 by the authors. Licensee MDPI, Basel, Switzerland. This article is an open access article distributed under the terms and conditions of the Creative Commons Attribution (CC BY) license (https://creativecommons.org/licenses/by/4.0/).
Share and Cite
Klyusko, I.; Scalise, S.; Guzzi, F.; Randazzini, L.; Zaccone, S.; Parrotta, E.I.; Lucchino, V.; Merola, A.; Cosentino, C.; Krühne, U.; et al. An Automated Microfluidic Platform for In Vitro Raman Analysis of Living Cells. Biosensors 2025, 15, 459. https://doi.org/10.3390/bios15070459
Klyusko I, Scalise S, Guzzi F, Randazzini L, Zaccone S, Parrotta EI, Lucchino V, Merola A, Cosentino C, Krühne U, et al. An Automated Microfluidic Platform for In Vitro Raman Analysis of Living Cells. Biosensors. 2025; 15(7):459. https://doi.org/10.3390/bios15070459
Chicago/Turabian StyleKlyusko, Illya, Stefania Scalise, Francesco Guzzi, Luigi Randazzini, Simona Zaccone, Elvira Immacolata Parrotta, Valeria Lucchino, Alessio Merola, Carlo Cosentino, Ulrich Krühne, and et al. 2025. "An Automated Microfluidic Platform for In Vitro Raman Analysis of Living Cells" Biosensors 15, no. 7: 459. https://doi.org/10.3390/bios15070459
APA StyleKlyusko, I., Scalise, S., Guzzi, F., Randazzini, L., Zaccone, S., Parrotta, E. I., Lucchino, V., Merola, A., Cosentino, C., Krühne, U., Aquila, I., Cuda, G., Di Fabrizio, E., Candeloro, P., & Perozziello, G. (2025). An Automated Microfluidic Platform for In Vitro Raman Analysis of Living Cells. Biosensors, 15(7), 459. https://doi.org/10.3390/bios15070459