A Self-Calibrated Single Wavelength Biosensor for Measuring Oxygen Saturation


Abstract
1. Introduction
2. Materials and Methods
2.1. Theory
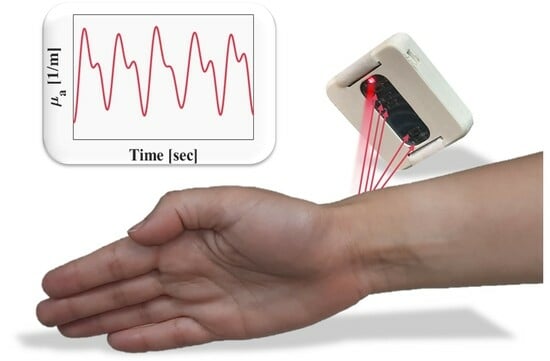
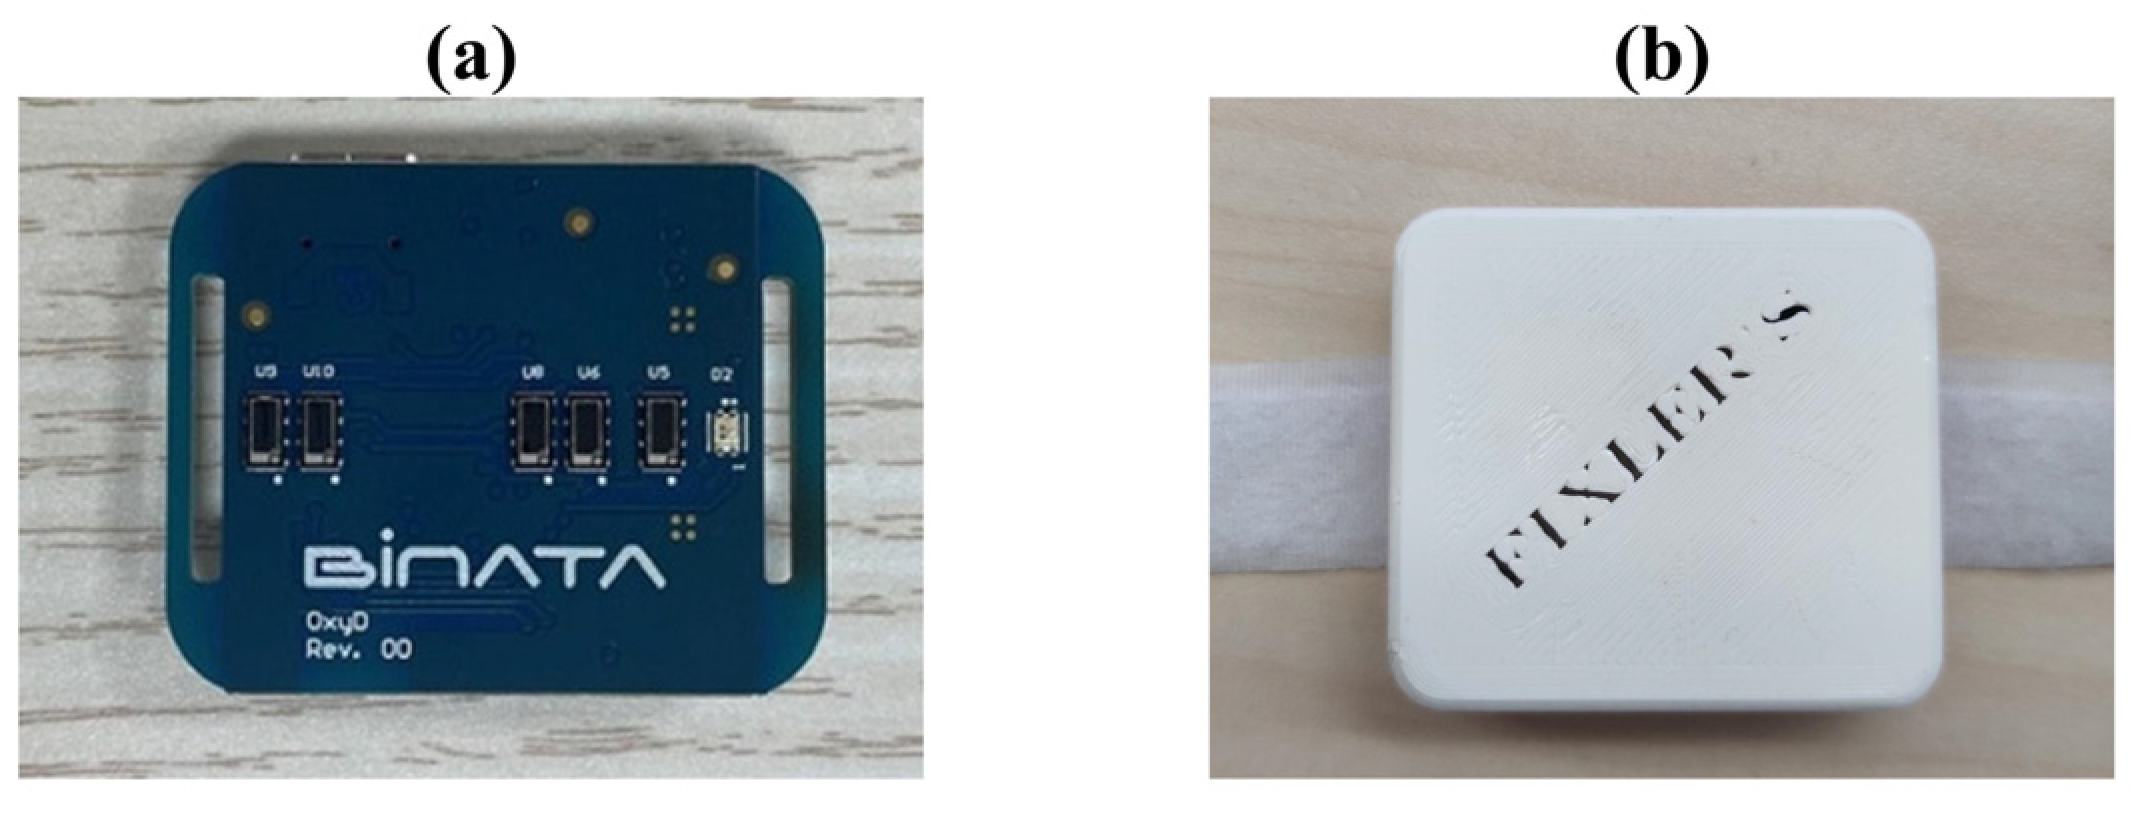
2.2. Biosensor
2.3. Phantoms
2.4. Human Research
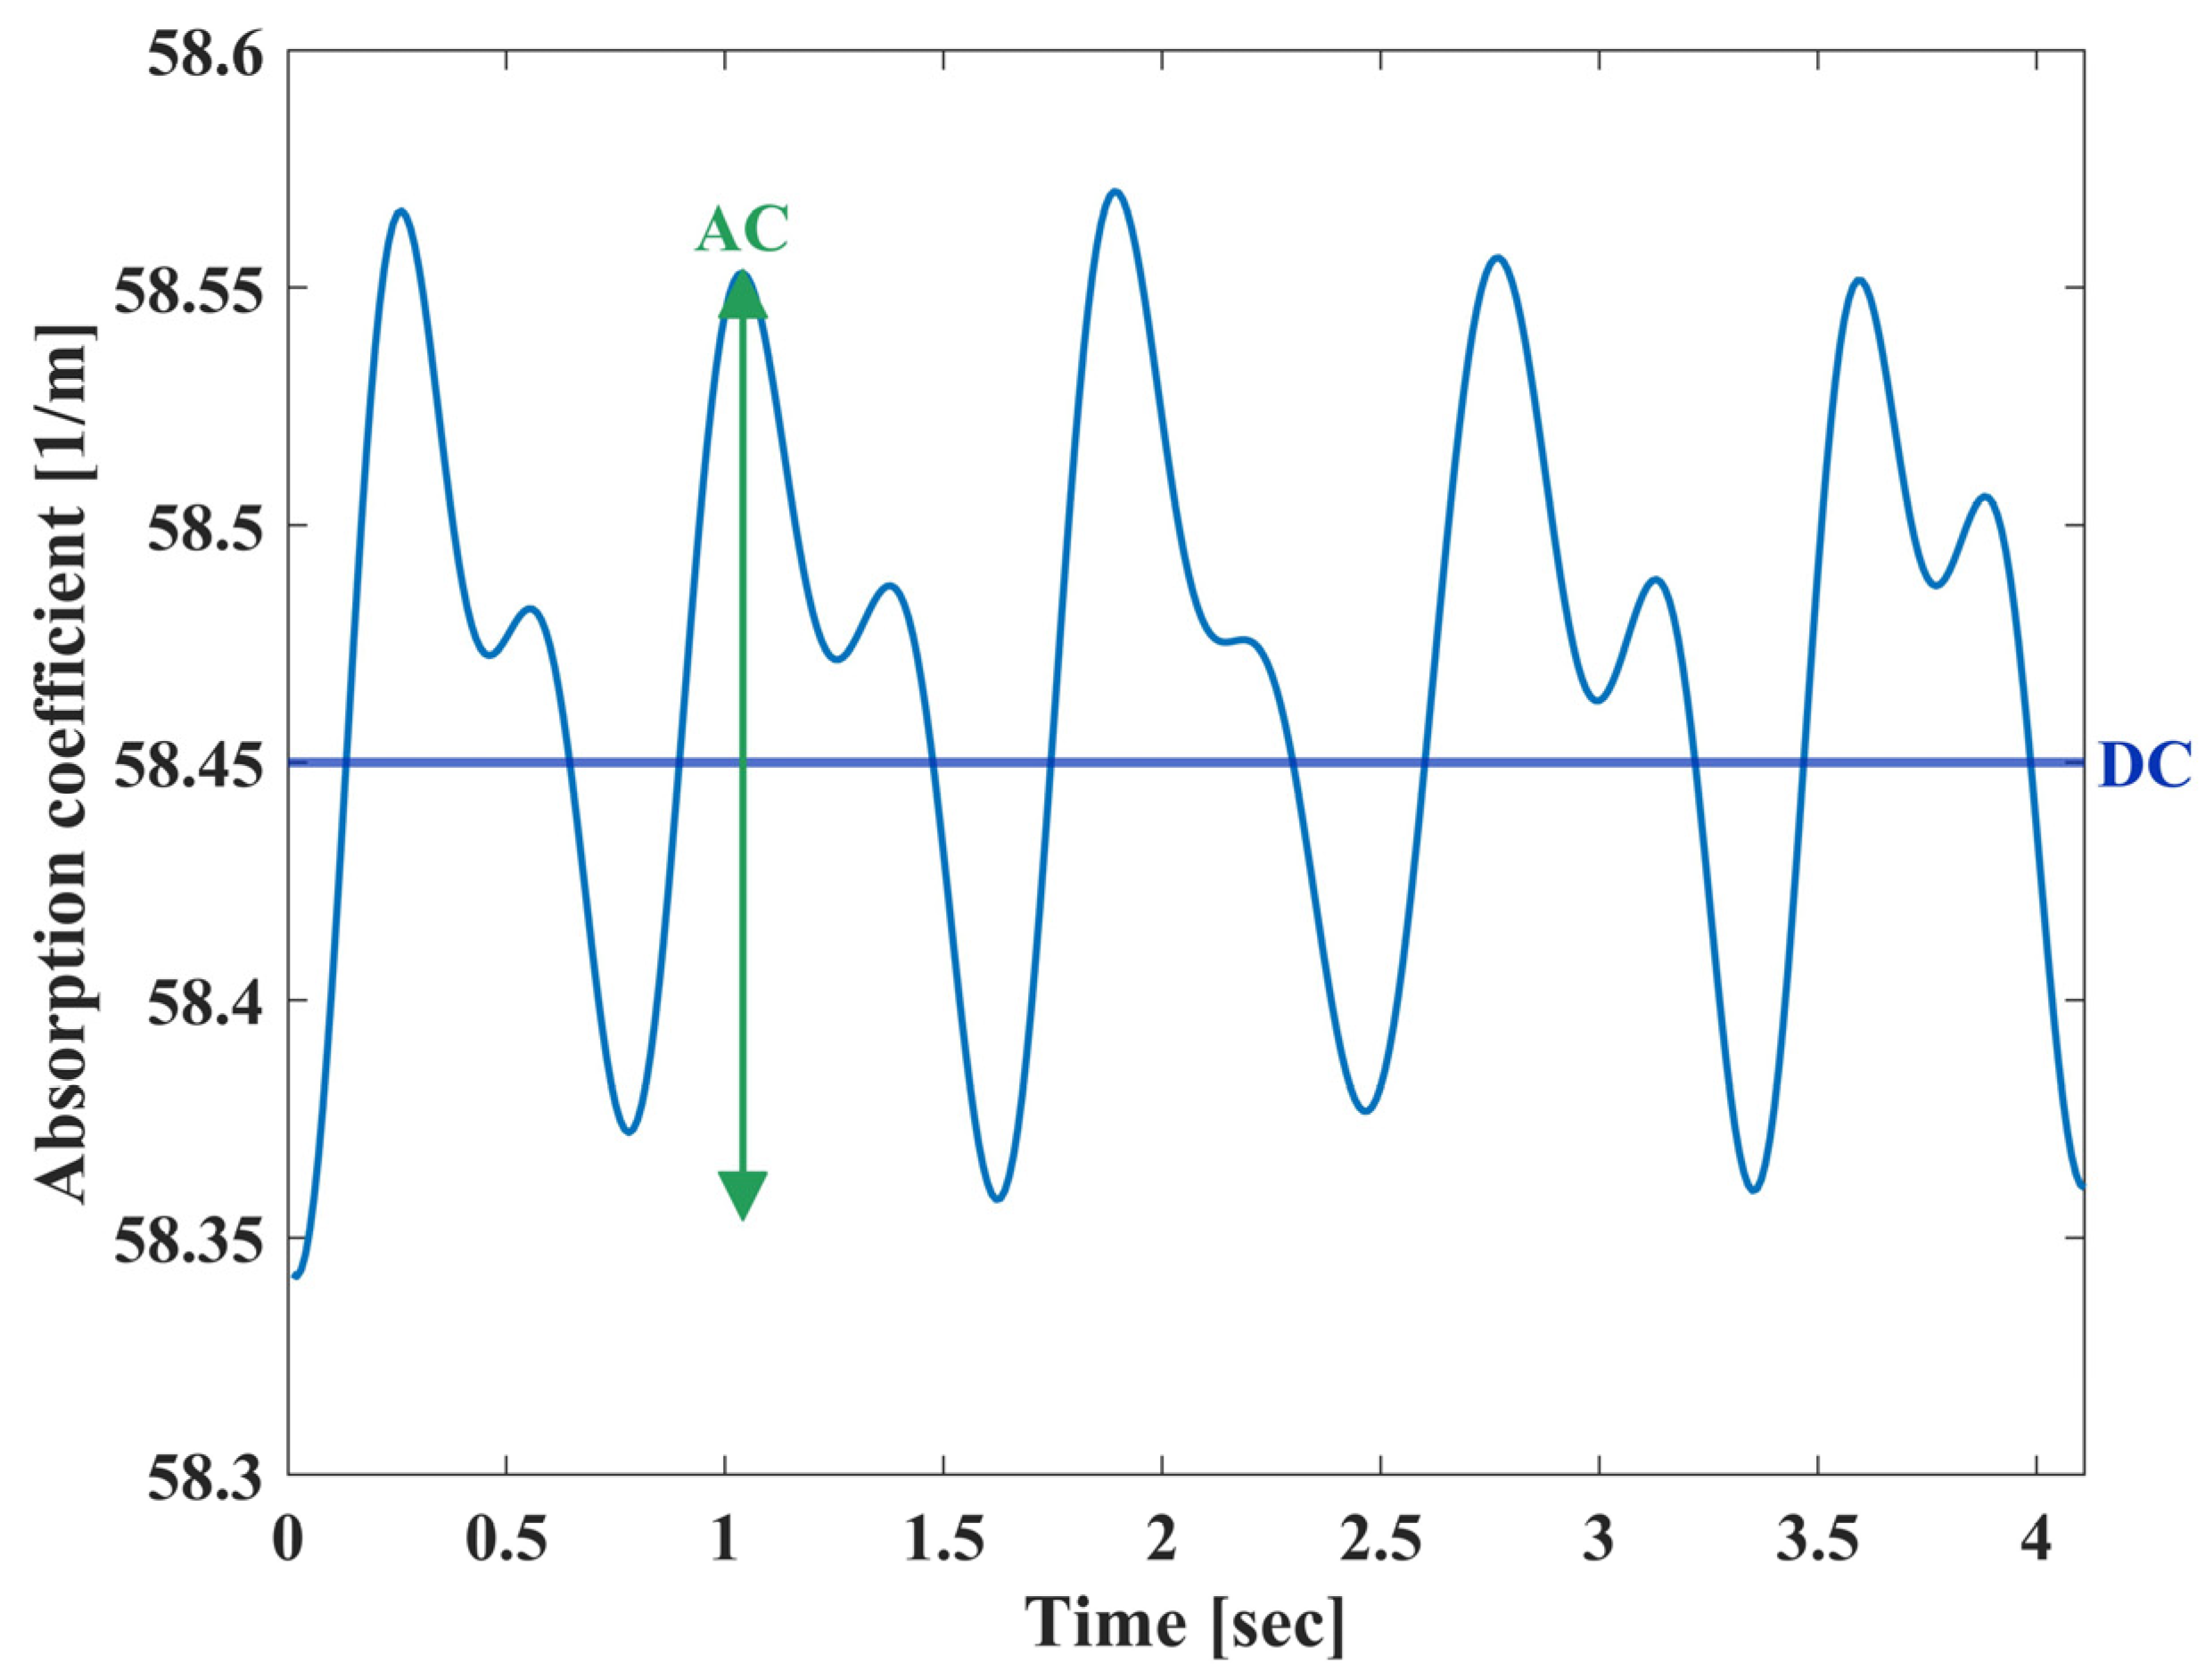
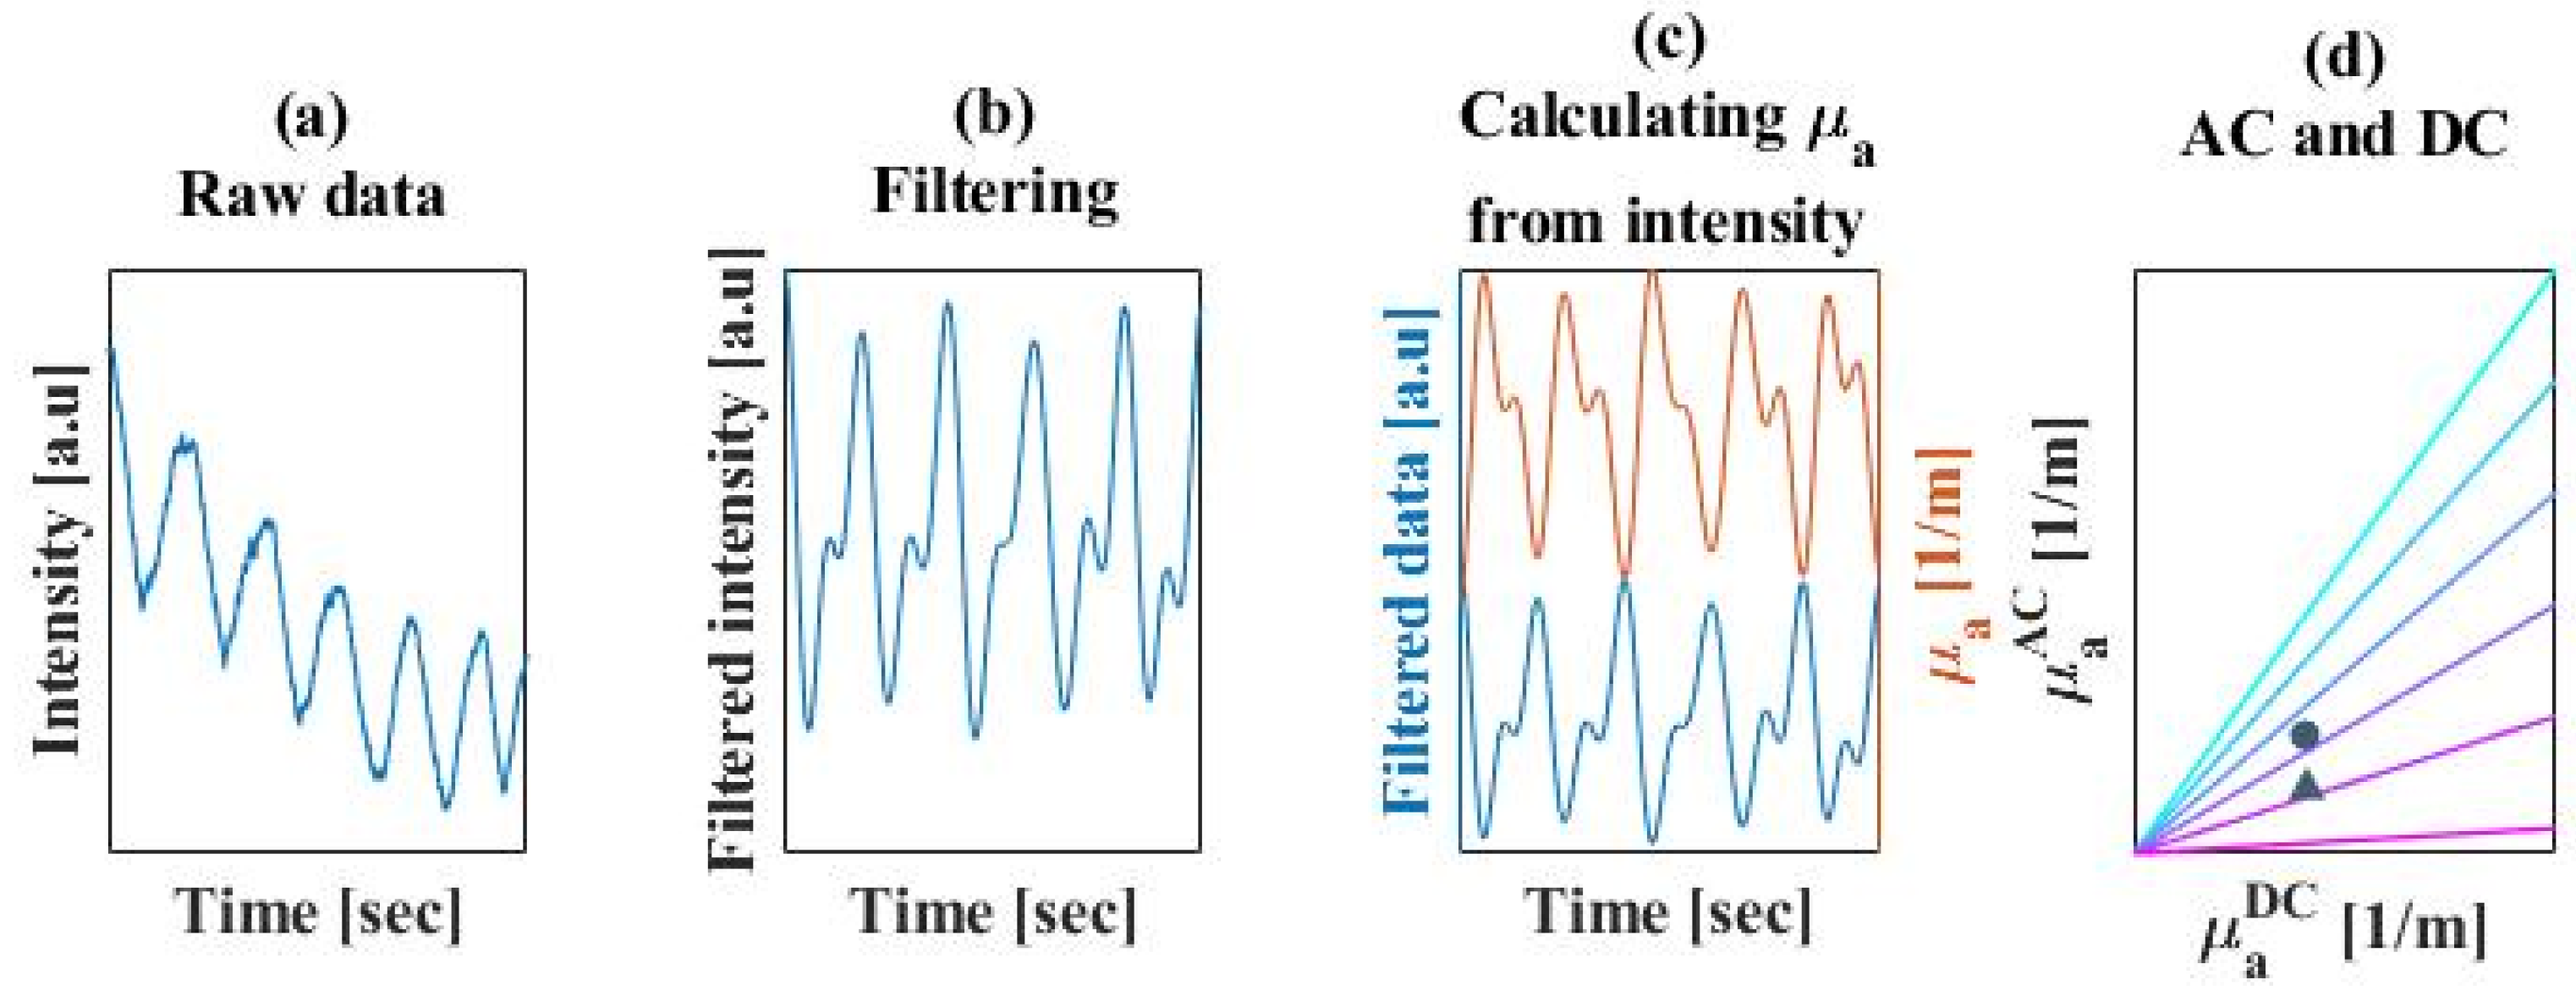
2.5. Processing Analysis
3. Results
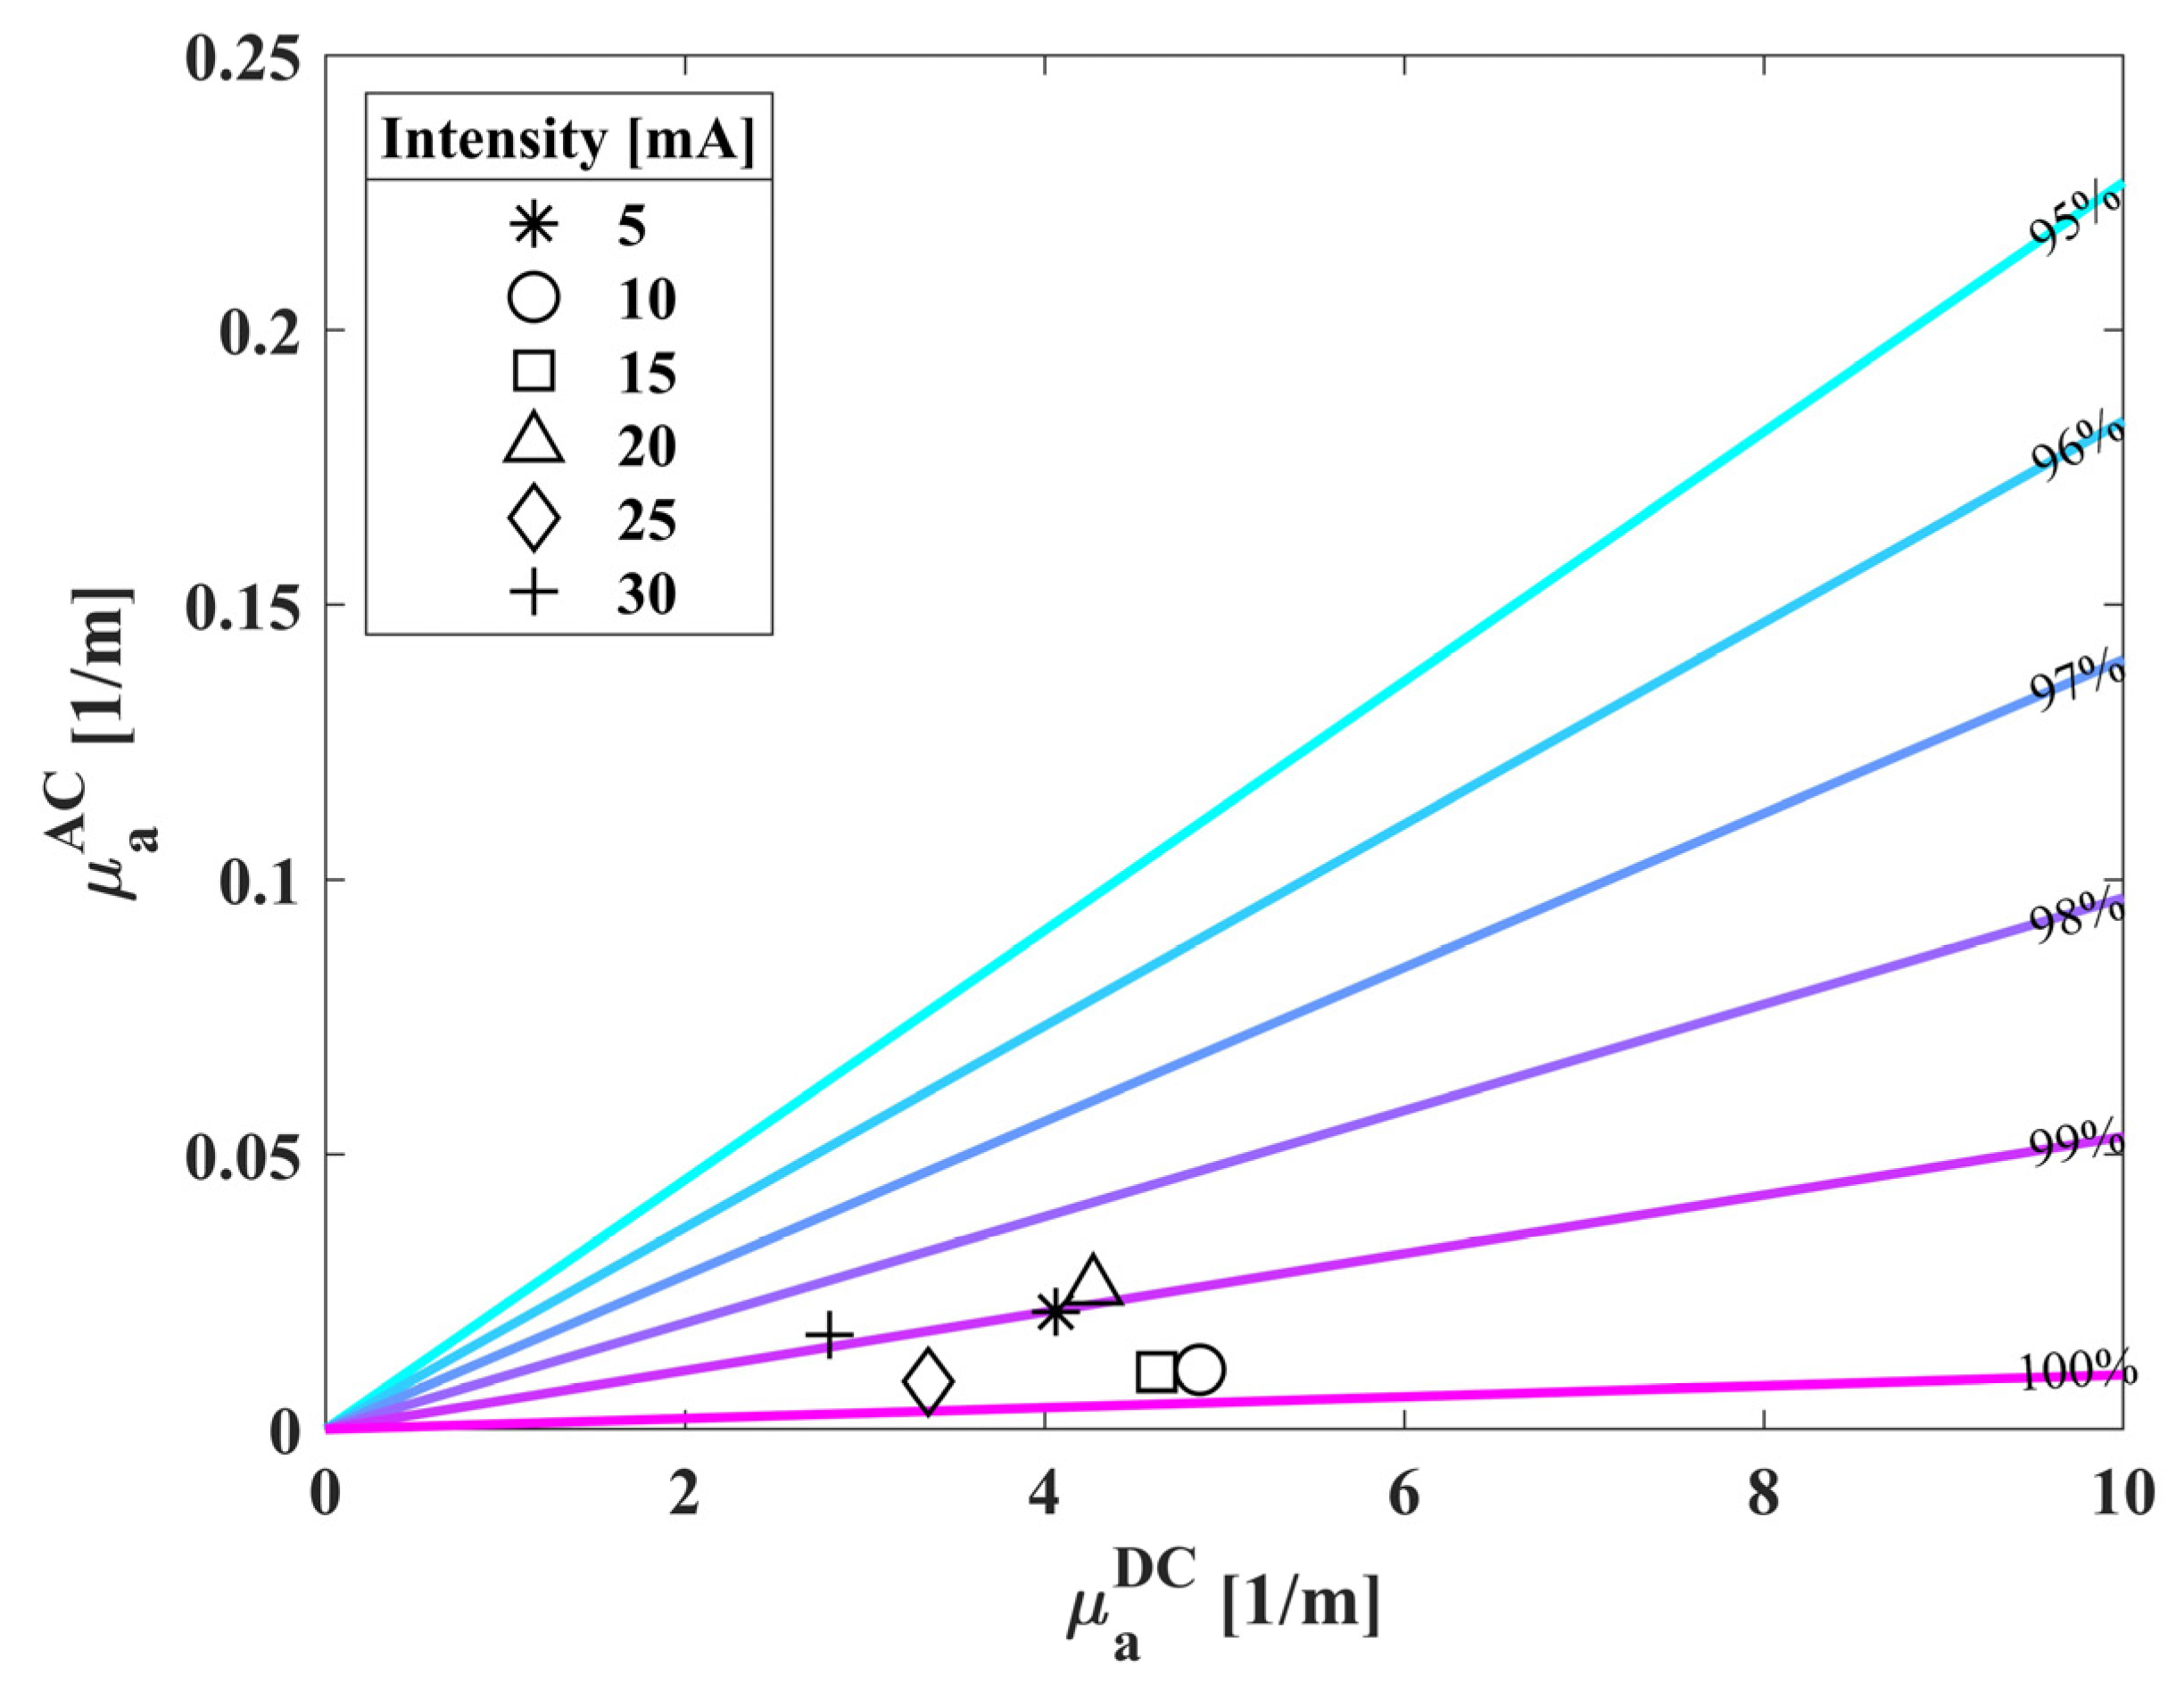
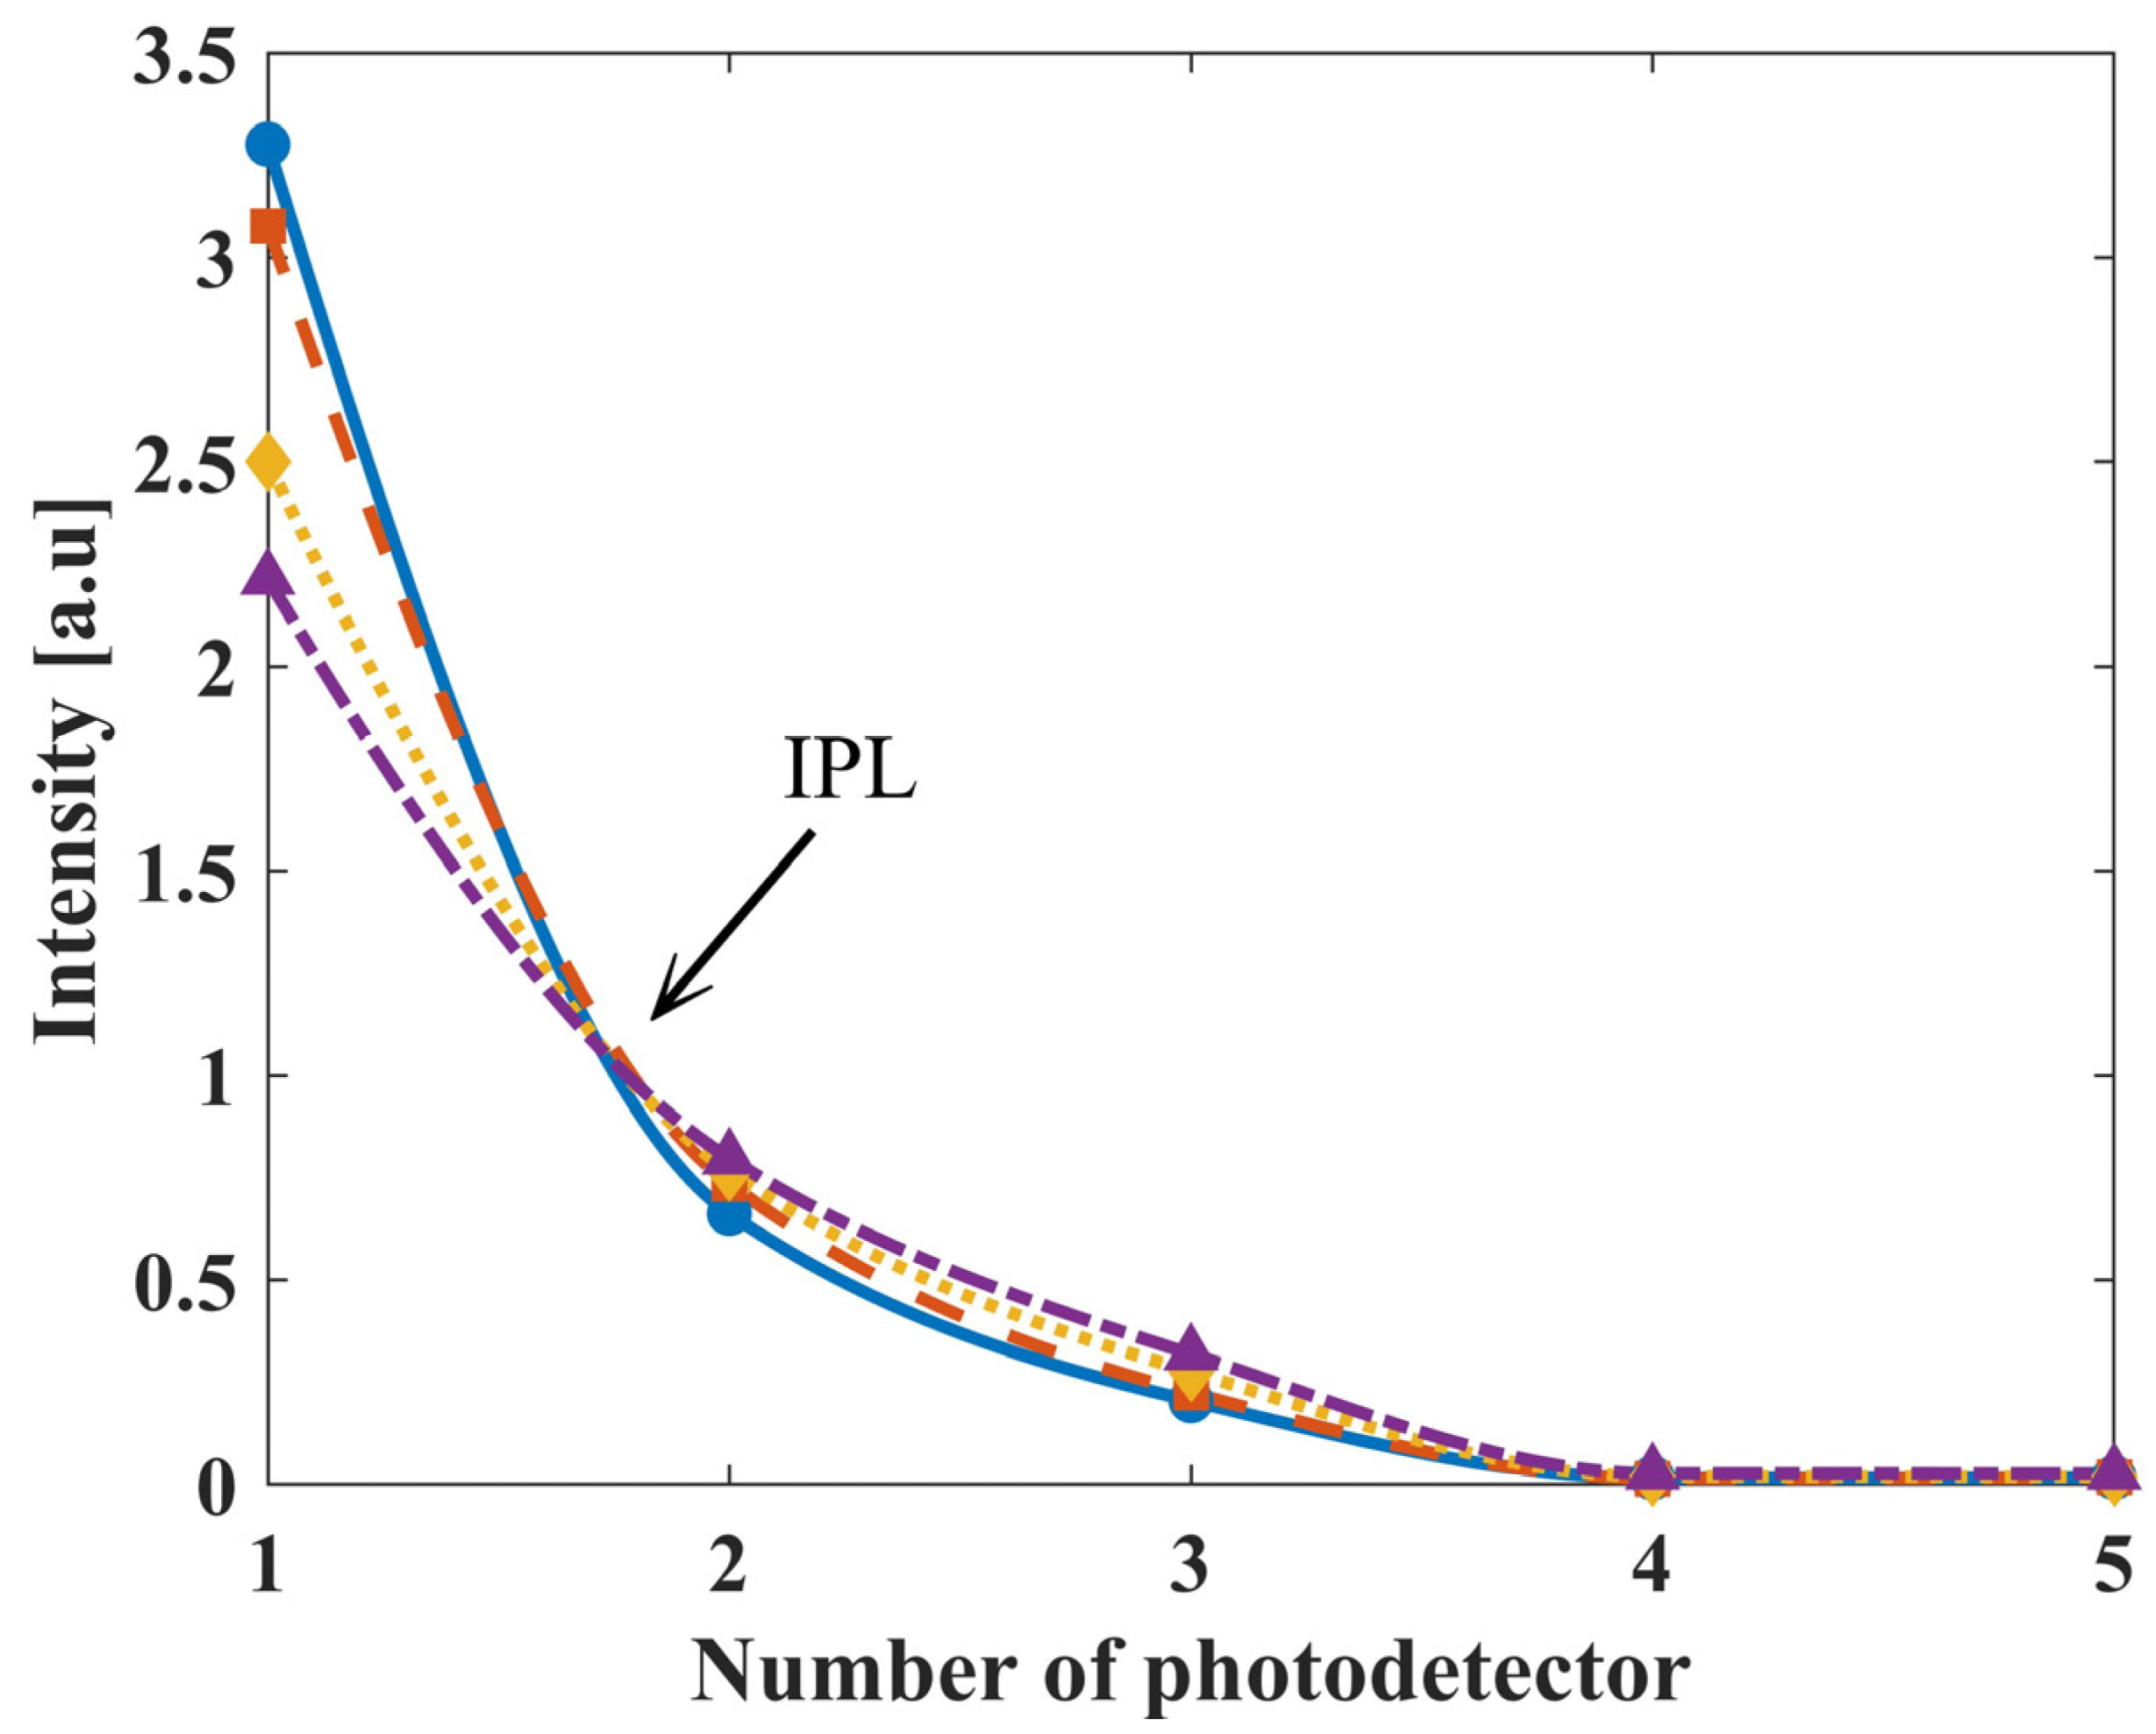
3.1. Biosensor’s Measurement of Phantoms
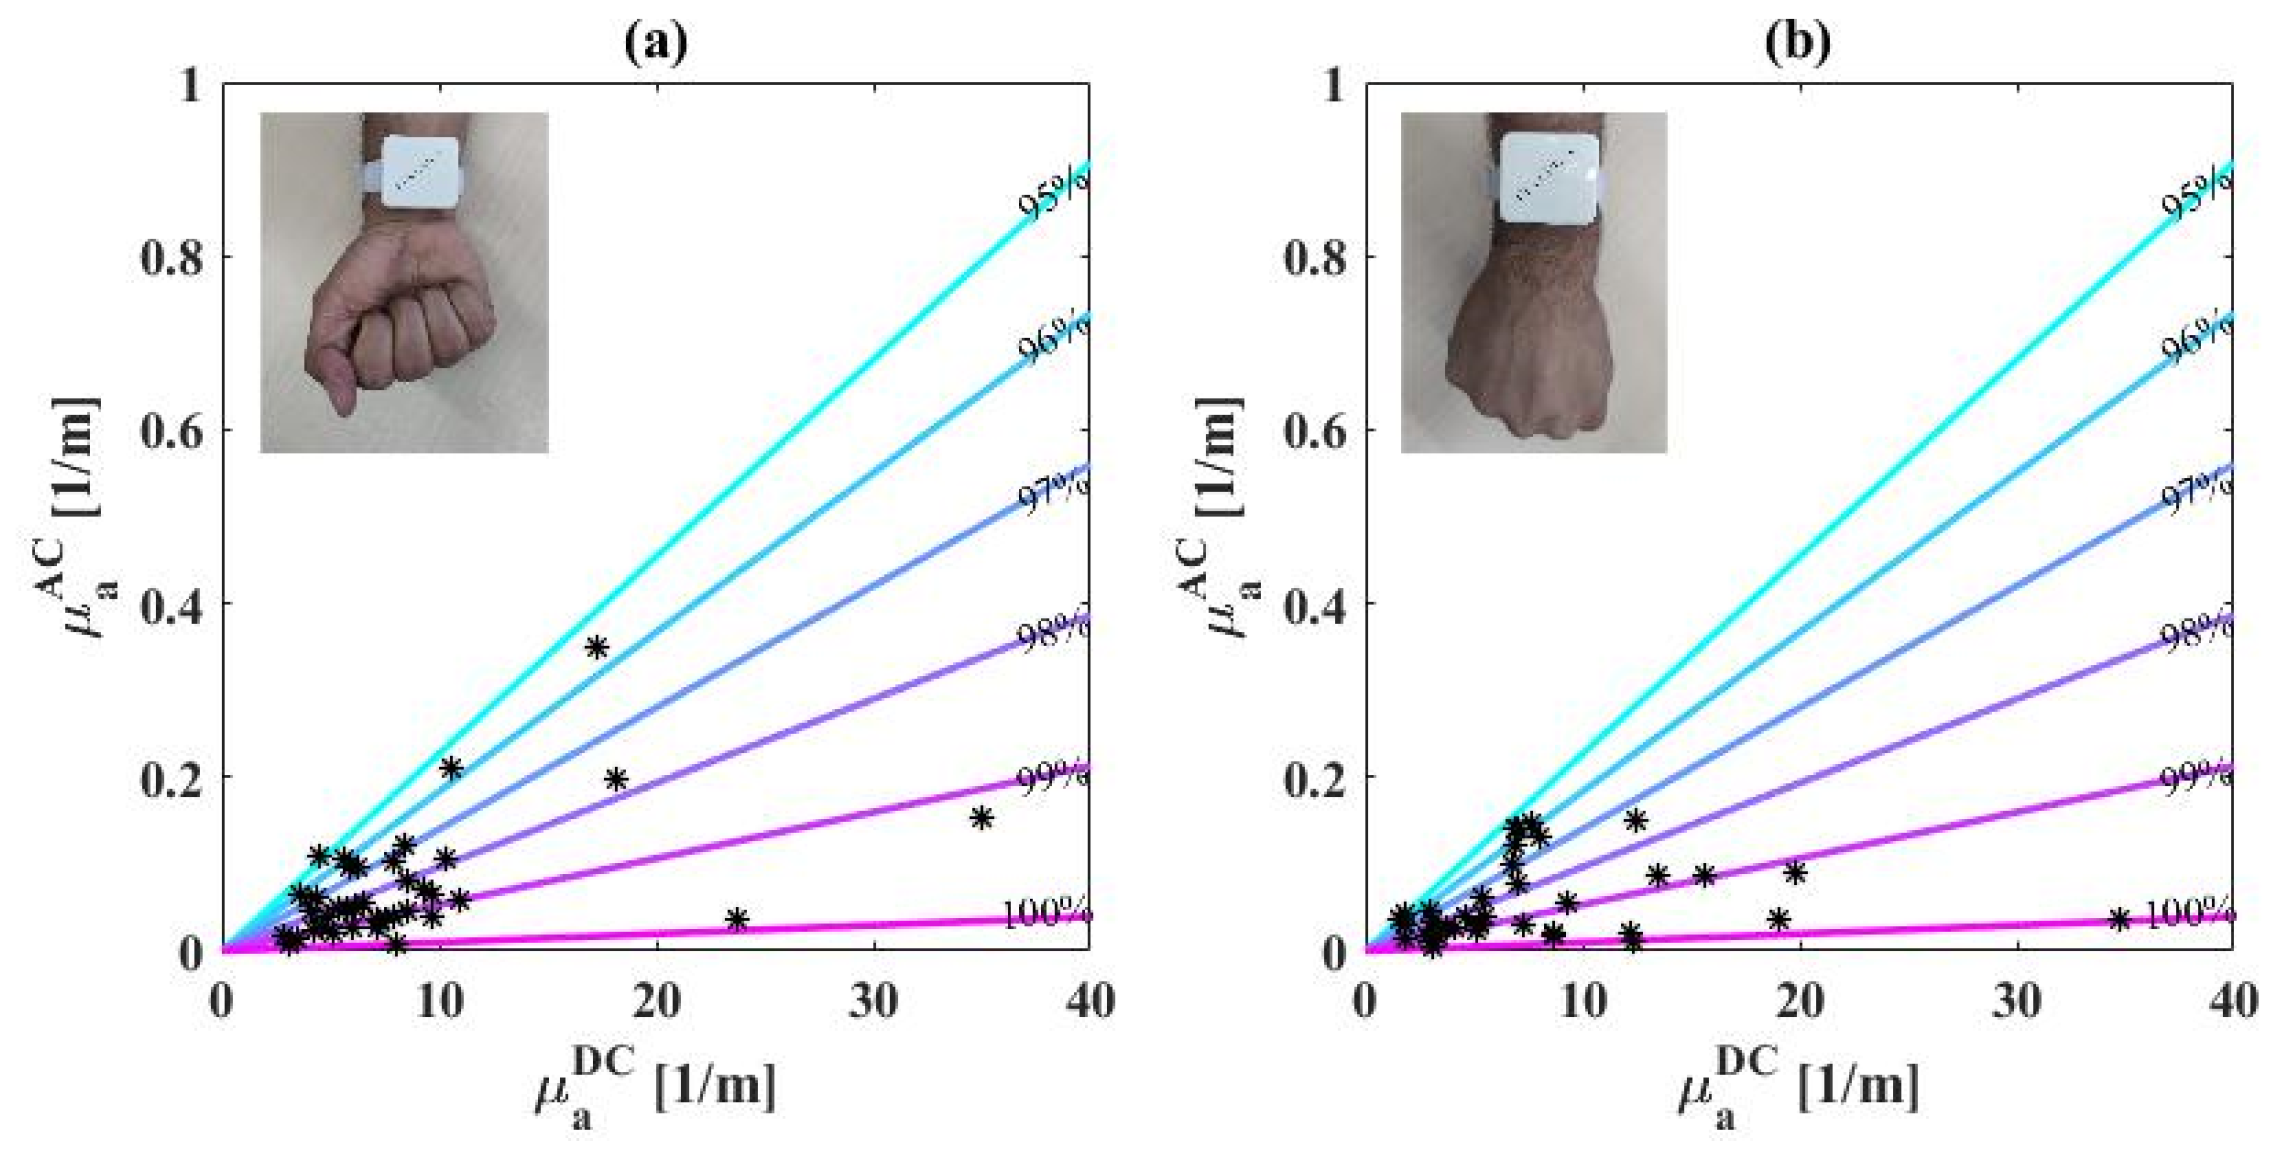
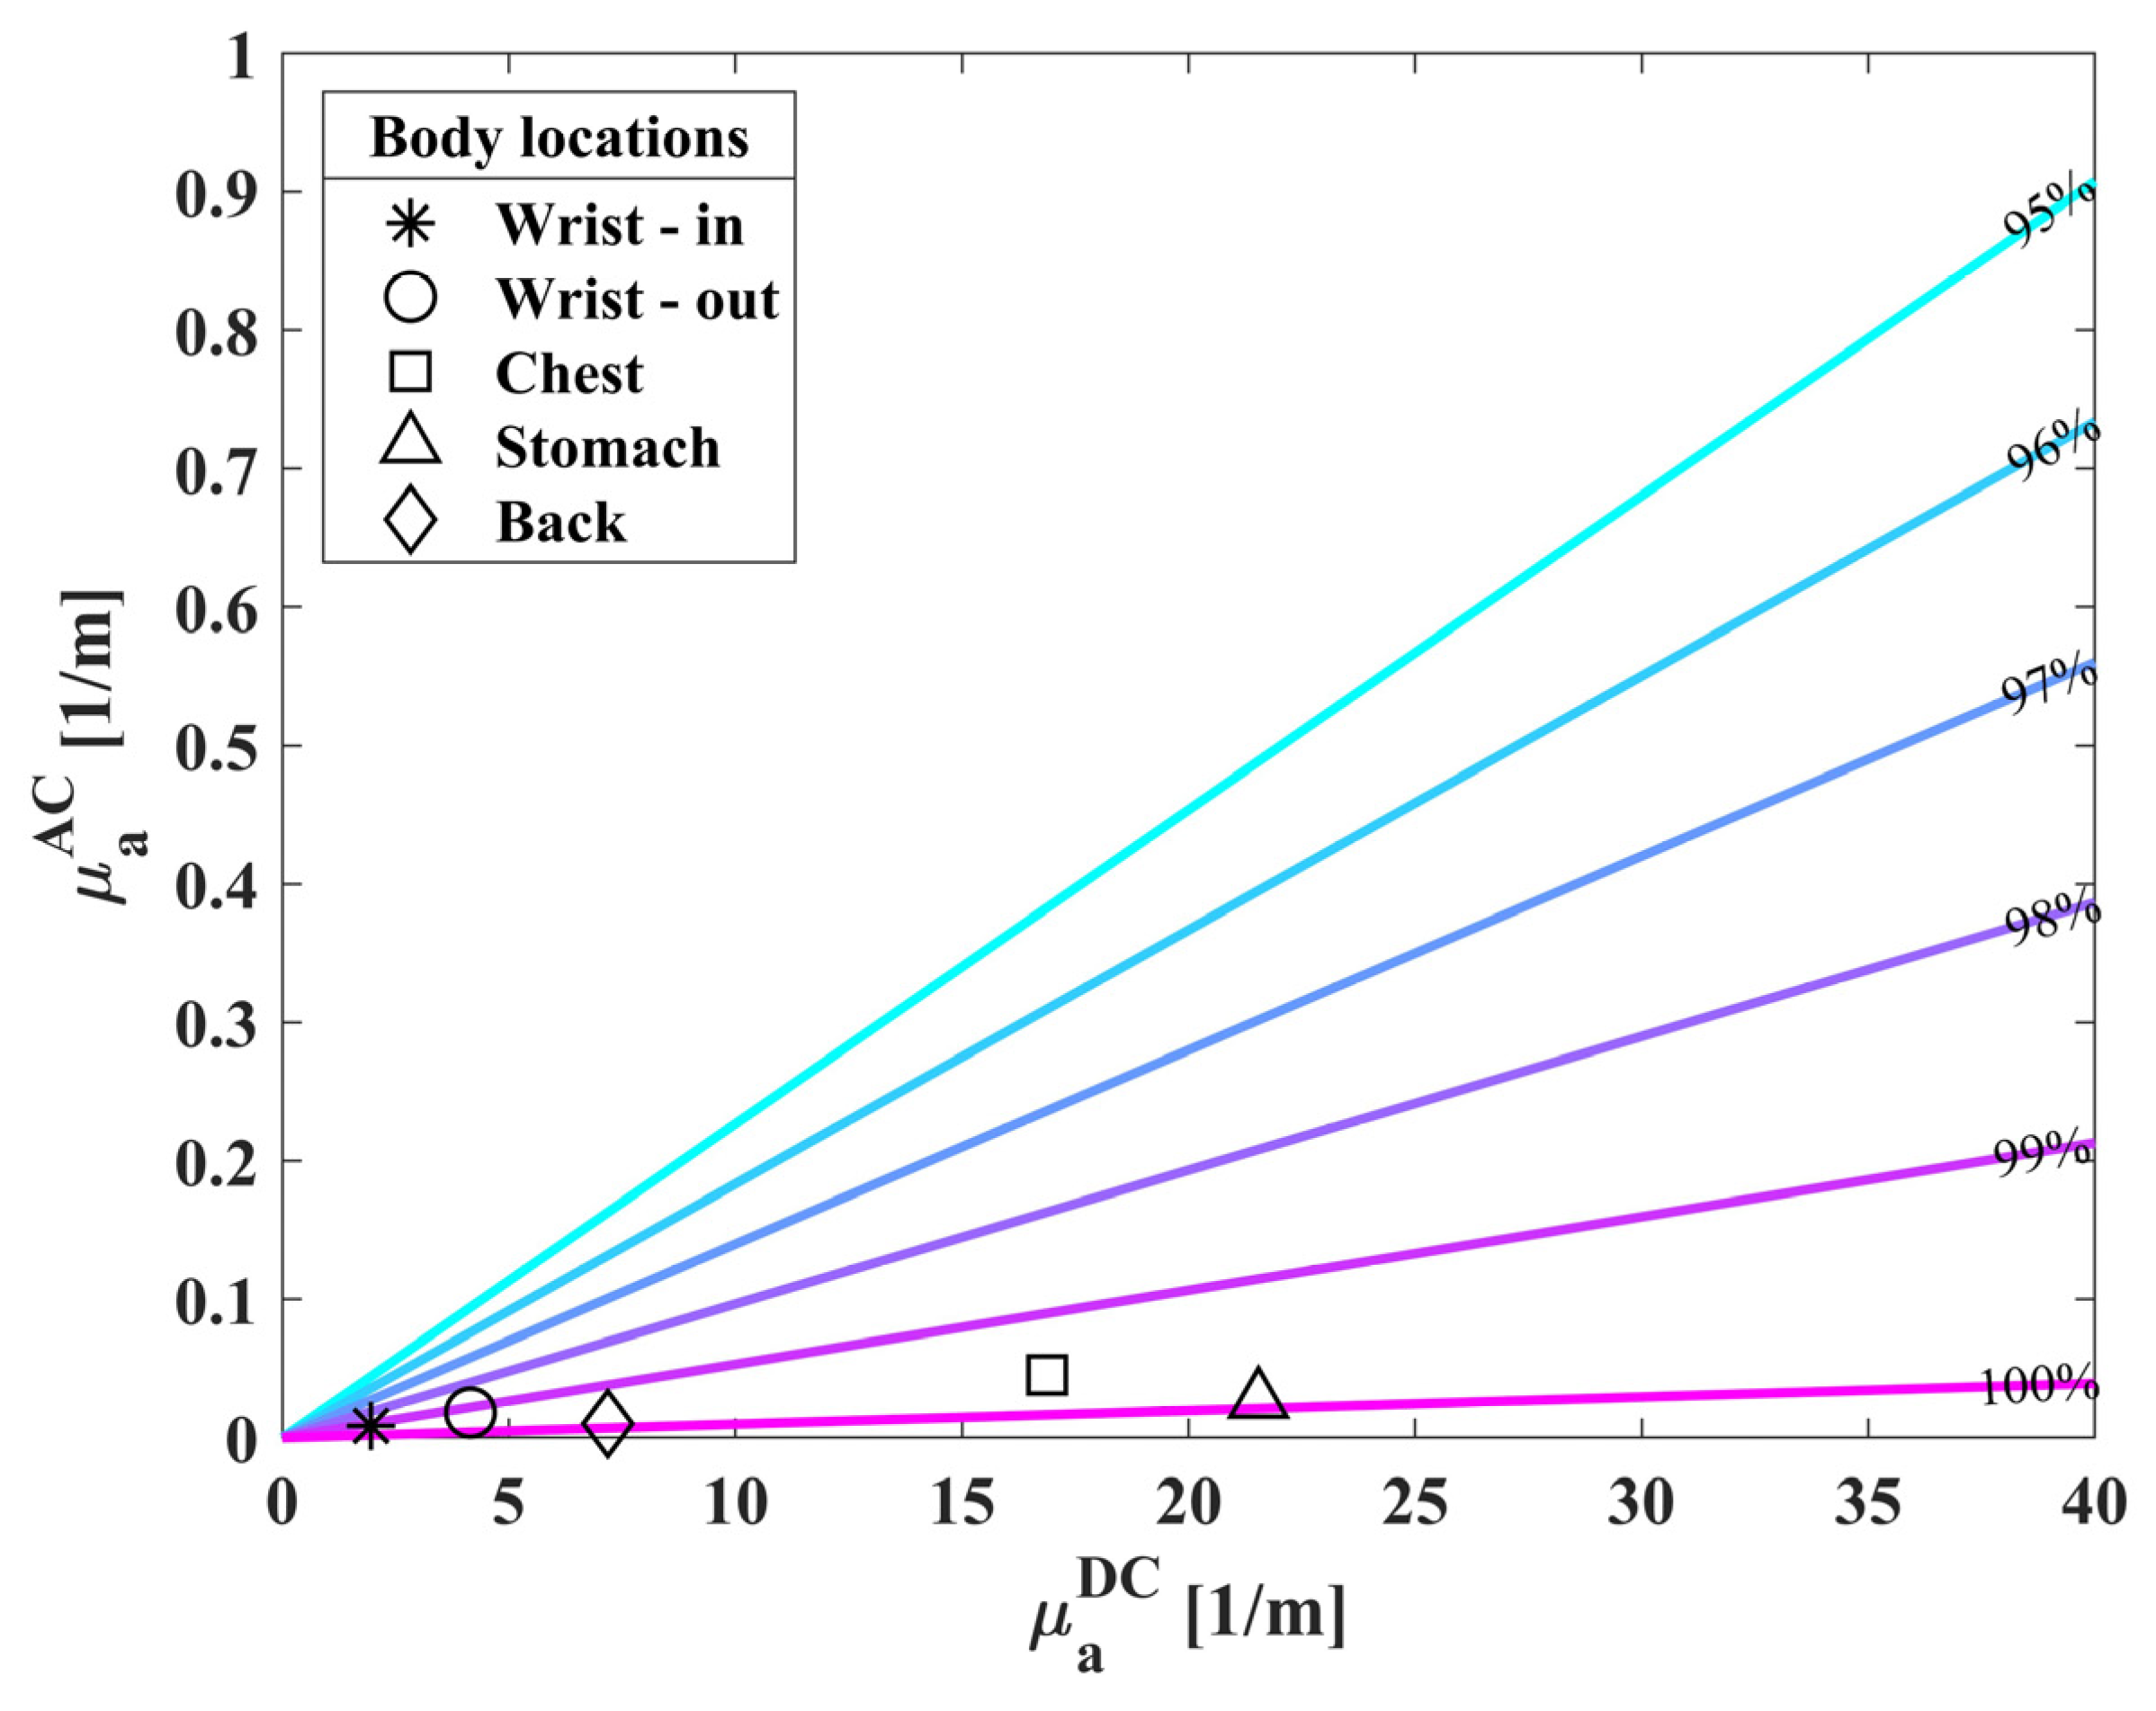
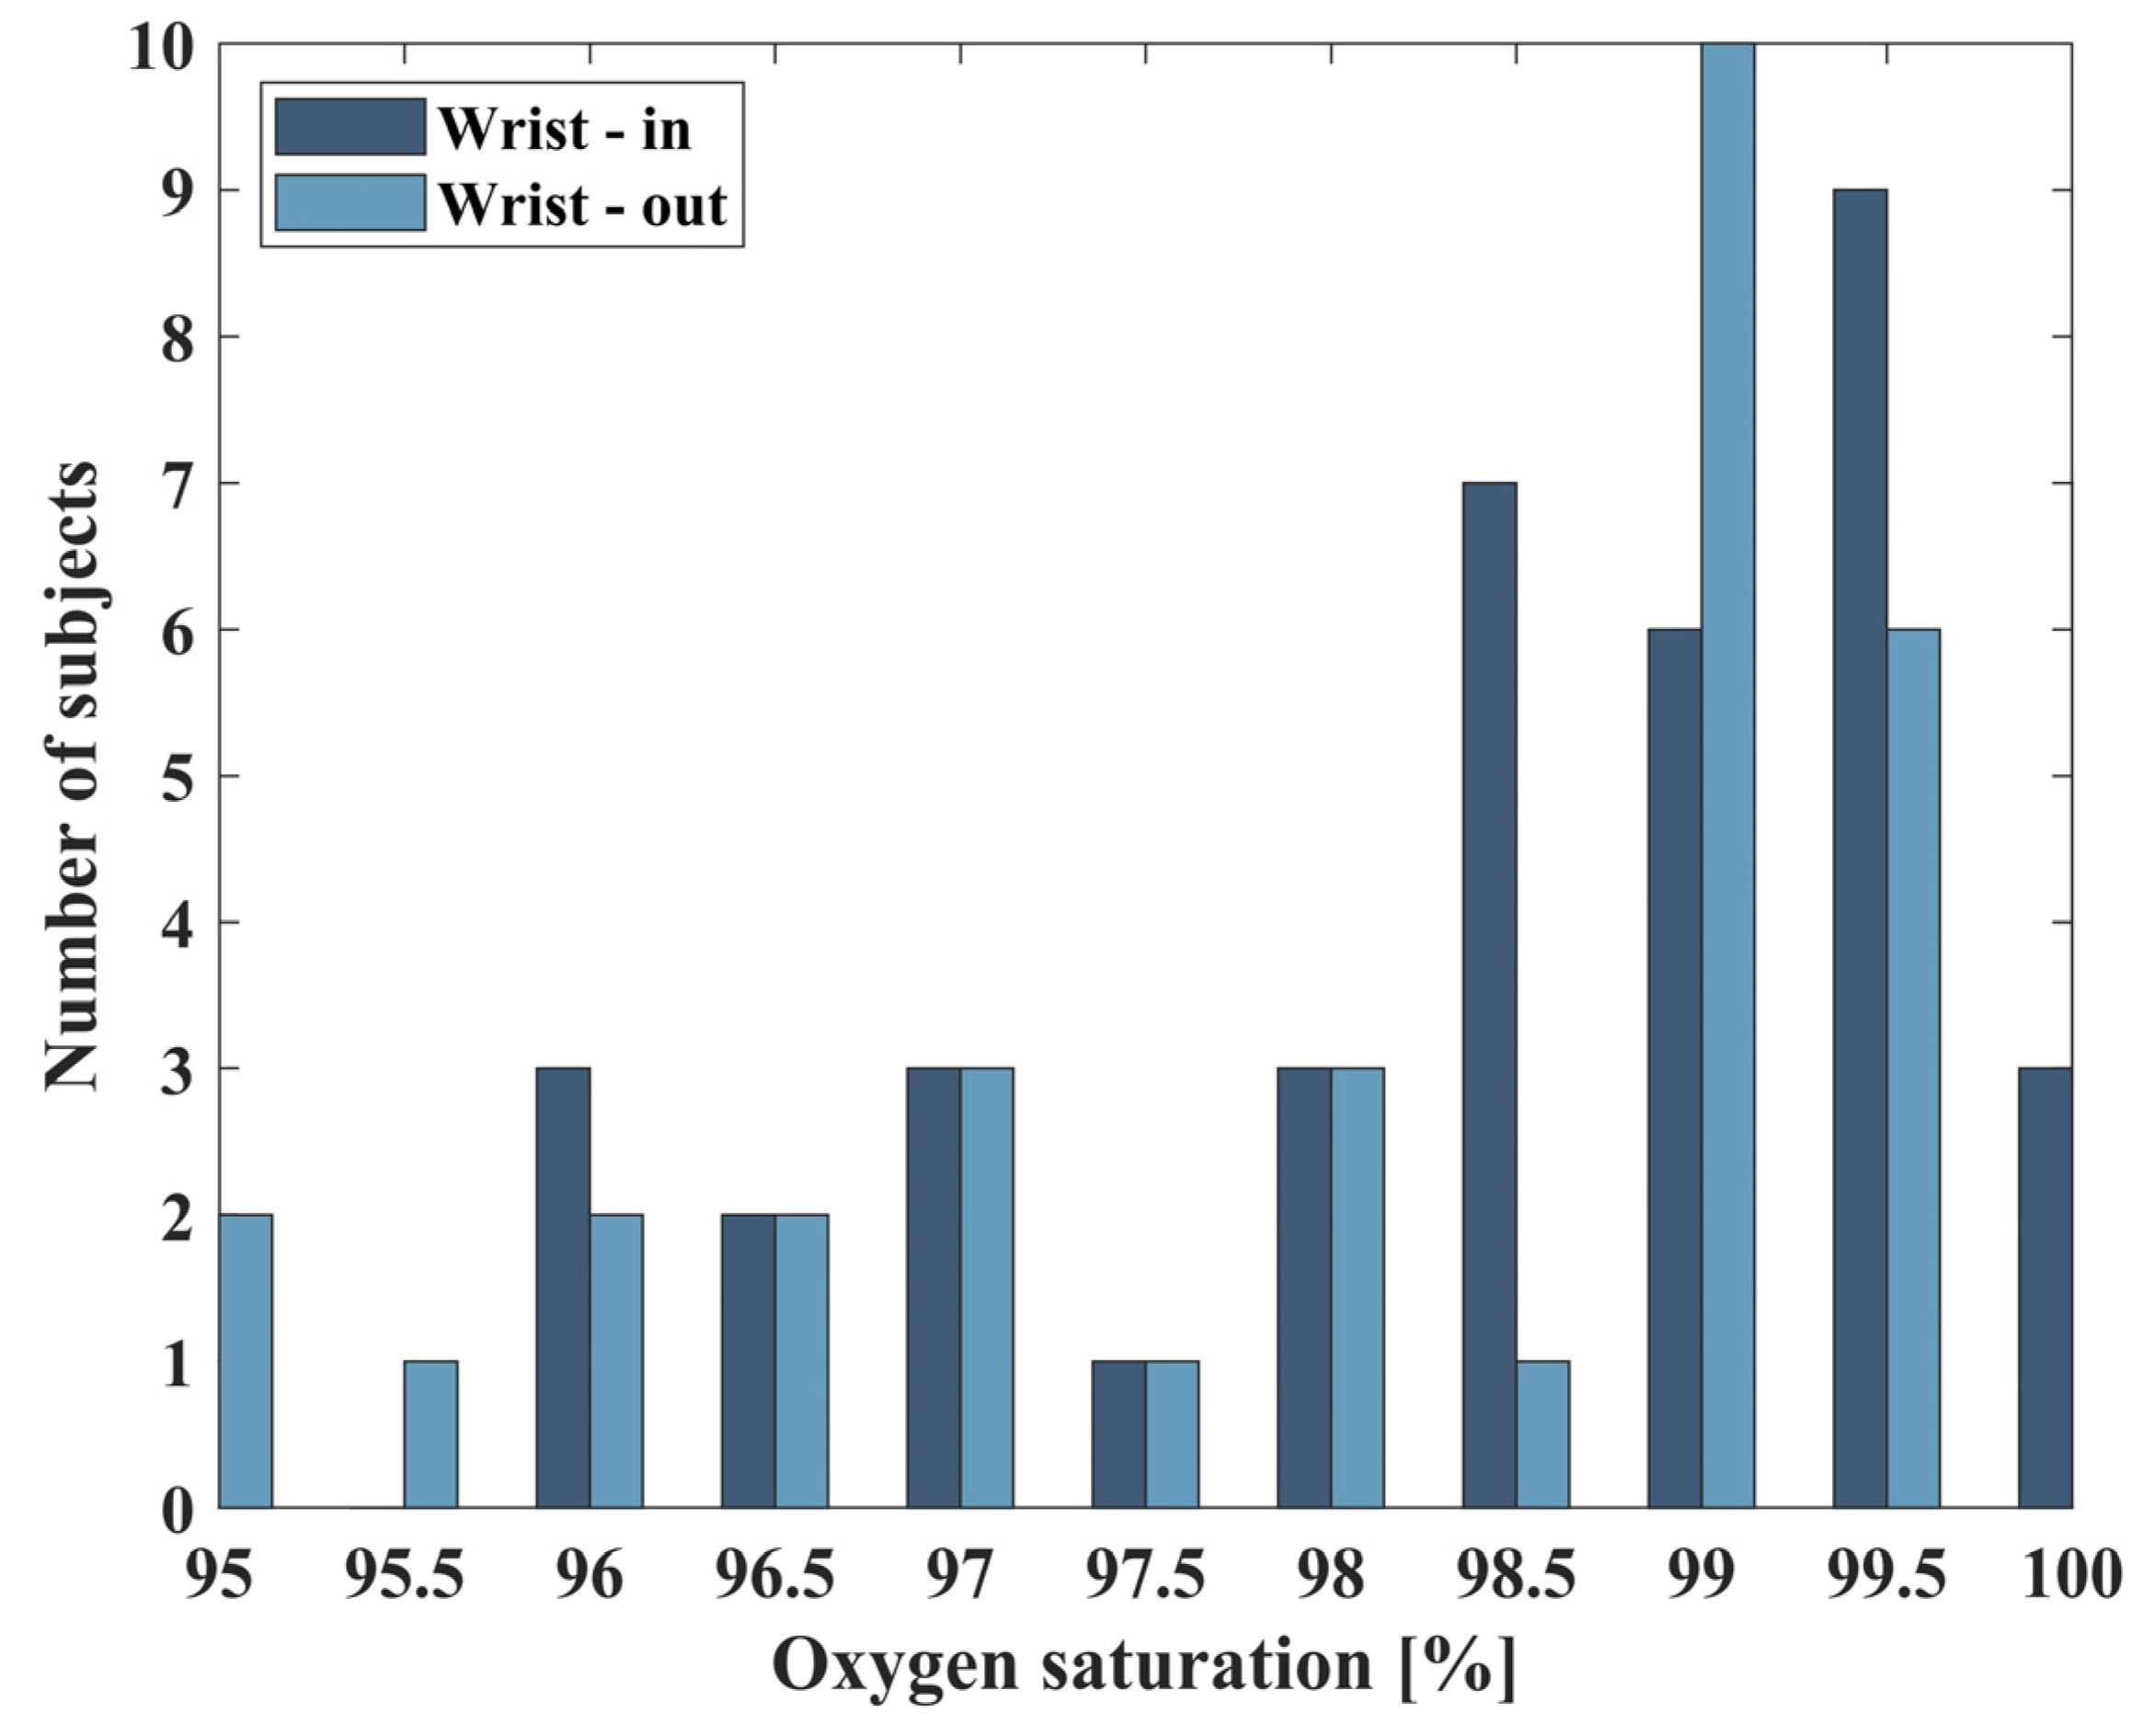
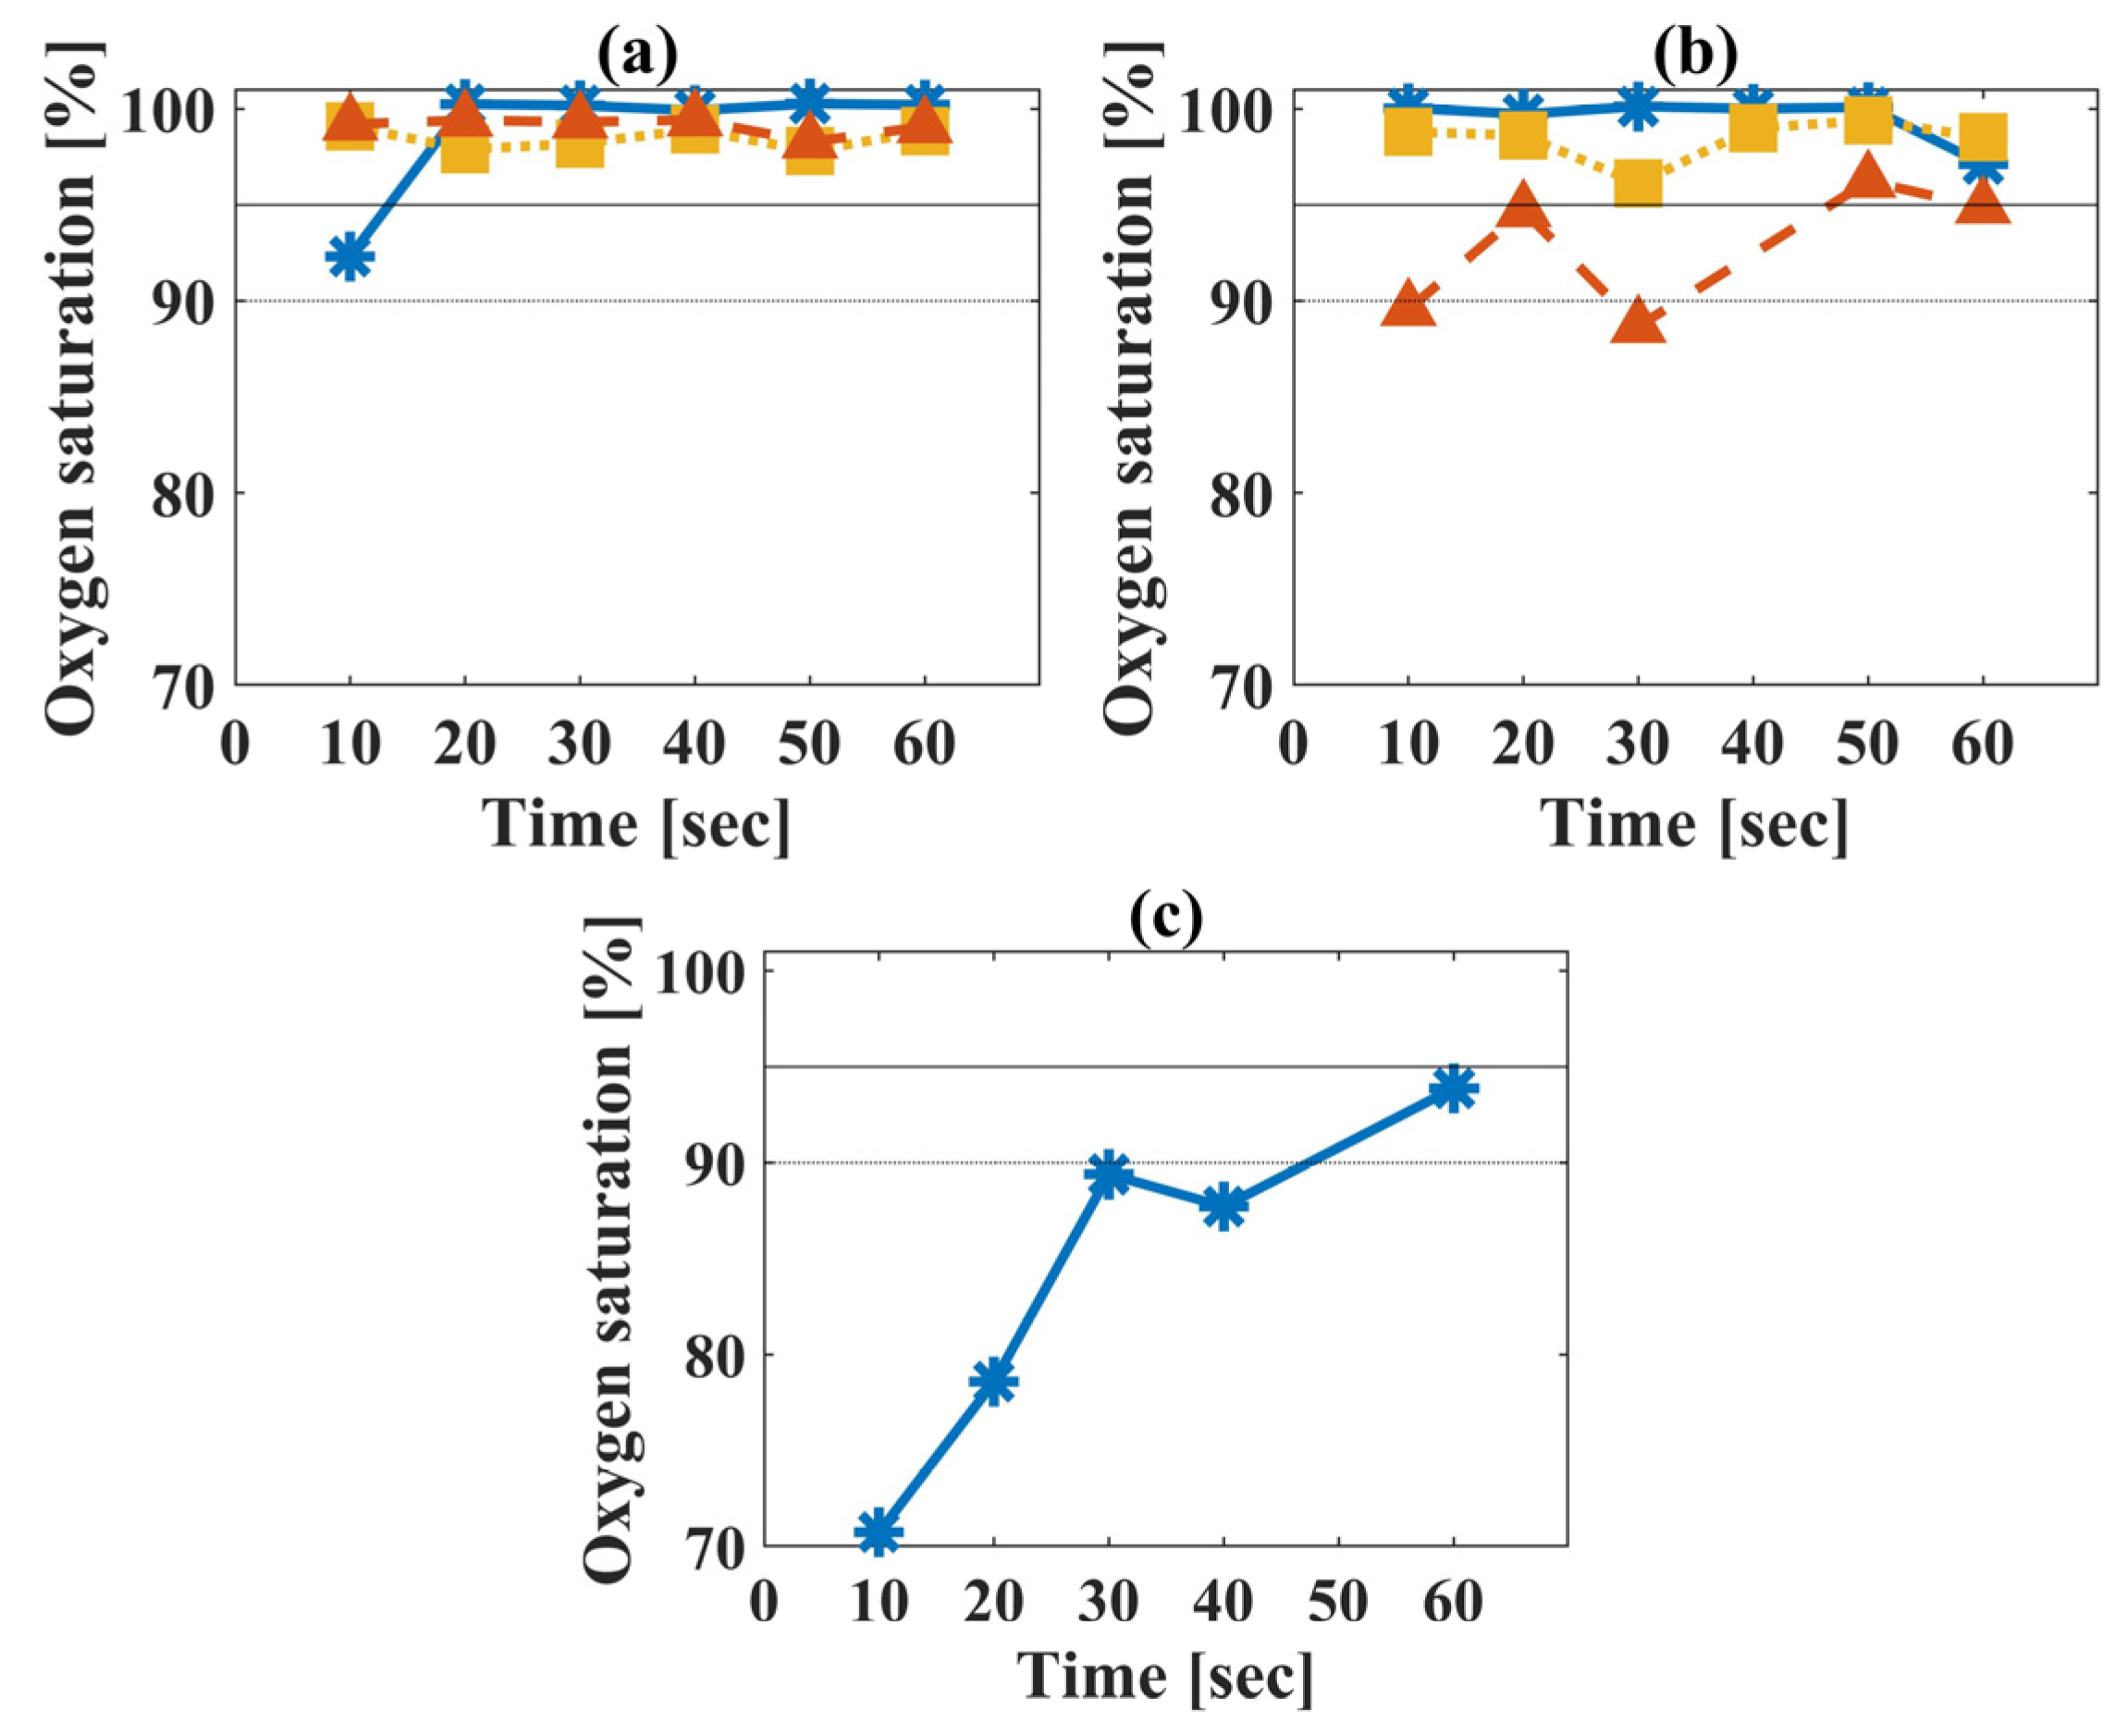
3.2. Extracted Saturation Values of Healthy Population
3.3. Extracted Saturation Values in Hypoxic Conditions
4. Discussion
Author Contributions
Funding
Institutional Review Board Statement
Informed Consent Statement
Data Availability Statement
Conflicts of Interest
References
- Sydorova, E.; Pahomova, A.; Halász, S. Designing Socio-Technical Systems Using the System Paradigm in the Context of Nano-, Bio-, Information Technology and Cognitive Science Convergence. Qual. Innov. Prosper. 2022, 26, 170–182. [Google Scholar] [CrossRef]
- Roco, M.C. Principles of convergence in nature and society and their application: From nanoscale, digits, and logic steps to global progress. J. Nanoparticle Res. 2020, 22, 321. [Google Scholar] [CrossRef]
- Sharp, P.; Hockfield, S. Convergence: The future of health. Science 2017, 355, 589. [Google Scholar] [CrossRef]
- Estevez, M.C.; Alvarez, M.; Lechuga, L.M. Integrated optical devices for lab on a chip biosensing applications. Laser Photonics Rev. 2012, 6, 463–487. [Google Scholar] [CrossRef]
- Mourant, J.R.; Fuselier, T.; Boyer, J.; Johnson, T.M.; Bigio, I.J. Predictions and measurements of scattering and absorption over broad wavelength ranges in tissue phantoms. Appl. Opt. 1997, 36, 949–957. [Google Scholar] [CrossRef]
- Hafen, B.B.; Sharma, S. Oxygen Saturation; StatPearls Publishing: St. Petersburg, FL, USA, 2018. [Google Scholar]
- Tamura, T. Current progress of photoplethysmography and SPO2 for health monitoring. Biomed. Eng. Lett. 2019, 9, 21–36. [Google Scholar] [CrossRef]
- Teng, X.; Zhang, Y.-T. The effect of contacting force on photoplethysmographic signals. Physiol. Meas. 2004, 25, 1323. [Google Scholar] [CrossRef]
- Alexander, C.M.; Teller, L.E.; Gross, J.B. Principles of pulse oximetry: Theoretical and practical considerations. Anesth. Analg. 1989, 68, 368–376. [Google Scholar] [CrossRef]
- Mannheimer, P.D. The light–tissue interaction of pulse oximetry. Anesth. Analg. 2007, 105, S10–S17. [Google Scholar] [CrossRef]
- Feder, I.; Duadi, H.; Fridman, M.; Dreifuss, T.; Fixler, D. Experimentally testing the role of blood vessels in the full scattering profile: Solid phantom measurements. J. Biomed. Photonics Eng. 2016, 2, 40301. [Google Scholar] [CrossRef]
- Nitzan, M.; Babchenko, A.; Khanokh, B.; Taitelbaum, H. Measurement of oxygen saturation in venous blood by dynamic near IR spectroscopy. J. Biomed. Opt. 2000, 5, 155–162. [Google Scholar] [CrossRef]
- Pätz, C.; Michaelis, A.; Markel, F.; Löffelbein, F.; Dähnert, I.; Gebauer, R.; Paech, C. Accuracy of the Apple Watch oxygen saturation measurement in adults and children with congenital heart disease. Pediatr. Cardiol. 2023, 44, 333–343. [Google Scholar] [CrossRef]
- Xin, M.; Yu, T.; Jiang, Y.; Tao, R.; Li, J.; Ran, F.; Zhu, T.; Huang, J.; Zhang, J.; Zhang, J.H. Multi-vital on-skin optoelectronic biosensor for assessing regional tissue hemodynamics. SmartMat 2023, 4, e1157. [Google Scholar] [CrossRef]
- Worapruekjaru, S.; Dougjitjaroen, K. Improved Efficiency of Fingertip Reflective Pulse Oximetry with 2 positions Integrated Optical Biosensor. In Proceedings of the 11th International Conference on Advances in Information Technology, Bangkok, Thailand, 1–3 July 2020; pp. 1–5. [Google Scholar]
- Bradke, B.; Everman, B. Investigation of photoplethysmography behind the ear for pulse oximetry in hypoxic conditions with a novel device (SPYDR). Biosensors 2020, 10, 34. [Google Scholar] [CrossRef]
- Kalyuzhner, Z.; Agdarov, S.; Bennett, A.; Beiderman, Y.; Zalevsky, Z. Remote photonic sensing of blood oxygen saturation via tracking of anomalies in micro-saccades patterns. Opt. Express 2021, 29, 3386–3394. [Google Scholar] [CrossRef] [PubMed]
- Wei, B.; Wu, X.; Zhang, C.; Lv, Z. Analysis and improvement of non-contact SpO2 extraction using an RGB webcam. Biomed. Opt. Express 2021, 12, 5227–5245. [Google Scholar] [CrossRef]
- Sun, Z.; He, Q.; Li, Y.; Wang, W.; Wang, R.K. Robust non-contact peripheral oxygenation saturation measurement using smartphone-enabled imaging photoplethysmography. Biomed. Opt. Express 2021, 12, 1746–1760. [Google Scholar] [CrossRef]
- Duadi, H.; Fixler, D.; Popovtzer, R. Dependence of light scattering profile in tissue on blood vessel diameter and distribution: A computer simulation study. J. Biomed. Opt. 2013, 18, 111408. [Google Scholar] [CrossRef] [PubMed]
- Feder, I.; Duadi, H.; Fixler, D. Experimental system for measuring the full scattering profile of circular phantoms. Biomed. Opt. Express 2015, 6, 2877–2886. [Google Scholar] [CrossRef]
- Feder, I.; Duadi, H.; Fixler, D. Effect of Spatial Modulated Light on Position of Self-Calibration Point. IEEE Photonics J. 2021, 13, 1–5. [Google Scholar] [CrossRef]
- Fixler, D.; Duadi, H.; Feder, I. Optical System and Method for Detecting Light Scattered from Tissue. U.S. Patent Application 17/920,338, 8 June 2023. [Google Scholar]
- Feder, I.; Wróbel, M.; Duadi, H.; Jędrzejewska-Szczerska, M.; Fixler, D. Experimental results of full scattering profile from finger tissue-like phantom. Biomed. Opt. Express 2016, 7, 4695–4701. [Google Scholar] [CrossRef] [PubMed]
- Duadi, H.; Feder, I.; Fixler, D. Influence of detector size and positioning on near-infrared measurements and ISO-pathlength point of turbid materials. Front. Phys. 2021, 9, 647281. [Google Scholar] [CrossRef]
- Feder, I.; Duadi, H.; Fixler, D. Single wavelength measurements of absorption coefficients based on iso-pathlength point. Biomed. Opt. Express 2020, 11, 5760–5771. [Google Scholar] [CrossRef]
- Jacques, S.L. Optical properties of biological tissues: A review. Phys. Med. Biol. 2013, 58, R37. [Google Scholar] [CrossRef]
- Dassel, A.; Graaff, R.; Aardema, M.; Zijlstra, W.; Aarnoudse, J. Effect of location of the sensor on reflectance pulse oximetry. BJOG: Int. J. Obstet. Gynaecol. 1997, 104, 910–916. [Google Scholar] [CrossRef]
- Yan, J.; Bin, G. Research on an anti-motion interference algorithm of blood oxygen saturation based on AC and DC analysis. Technol. Health Care 2015, 23, S285–S291. [Google Scholar] [CrossRef]
- Garde, A.; Karlen, W.; Ansermino, J.M.; Dumont, G.A. Estimating respiratory and heart rates from the correntropy spectral density of the photoplethysmogram. PLoS ONE 2014, 9, e86427. [Google Scholar] [CrossRef]
- Rudraiah, P.S.; Duadi, H.; Fixler, D. Diffused reflectance measurements to detect tattoo ink location in skin using the crossover point. J. Biophotonics 2022, 15, e202200003. [Google Scholar] [CrossRef]
- Hypoxic Chamber, Wingate Institute. Available online: https://wingate.org.il/%d7%90%d7%99%d7%9e%d7%95%d7%9f-%d7%91%d7%aa%d7%a0%d7%90%d7%99-%d7%94%d7%99%d7%a4%d7%95%d7%a7%d7%a1%d7%99%d7%94/ (accessed on 31 December 2023).
- Islam, M.T.; Zabir, I.; Ahamed, S.T.; Yasar, M.T.; Shahnaz, C.; Fattah, S.A. A time-frequency domain approach of heart rate estimation from photoplethysmographic (PPG) signal. Biomed. Signal Process. Control 2017, 36, 146–154. [Google Scholar] [CrossRef]
- Kramer, M.; Lobbestael, A.; Barten, E.; Eian, J.; Rausch, G. Wearable Pulse Oximetry Measurements on the Torso, Arms, and Legs: A Proof of Concept. Mil. Med. 2017, 182, 92–98. [Google Scholar] [CrossRef]
- Ash, C.; Dubec, M.; Donne, K.; Bashford, T. Effect of wavelength and beam width on penetration in light-tissue interaction using computational methods. Lasers Med. Sci. 2017, 32, 1909–1918. [Google Scholar] [CrossRef] [PubMed]
- Feder, I.; Duadi, H.; Chakraborty, R.; Fixler, D. Self-calibration phenomenon for near-infrared clinical measurements: Theory, simulation, and experiments. ACS Omega 2018, 3, 2837–2844. [Google Scholar] [CrossRef] [PubMed]
- Bugbee, B.; Blonquist, M. Absolute and relative gas concentration: Understanding oxygen in air. February 2006, 27, 1–9. [Google Scholar]


| Subject | Sex | Age | Referenced SpO2 [%] | Biosensor’s SpO2 [%] |
|---|---|---|---|---|
| 1 | male | 27 | 97 | 97.8 |
| 2 | male | 30 | 97 | 98.2 |
| 3 | male | 27 | 97 | 98.8 |
| 4 | female | 27 | 98 | 97.8 |
| 5 | male | 20 | 98 | 96.8 |
| 6 | female | 25 | 99 | 98.4 |
| 7 | female | 19 | 97 | 98.6 |
| 8 | female | 18 | 95 | 96.9 |
| 9 | male | 22 | 98 | 99.3 |
| 10 | female | 18 | 98 | 98.1 |
| 11 | male | 29 | 97 | 98.9 |
| 12 | female | 27 | 98 | 99.4 |
| 13 | female | 26 | 99 | 97.6 |
| 14 | female | 39 | 98 | 99.5 |
| 15 | male | 53 | 98 | 98.1 |
| 16 | male | 25 | 98 | 97.7 |
| 17 | male | 31 | 96 | 97.7 |
| 18 | female | 25 | 99 | 98.7 |
| 19 | female | 27 | 98 | 98.8 |
| 20 | male | 37 | 97 | 97.1 |
| 21 | female | 26 | 98 | 98.4 |
| 22 | male | 29 | 97 | 99.4 |
| 23 | male | 26 | 96 | 99.3 |
| 24 | male | 25 | 98 | 97.6 |
| 25 | male | 27 | 98 | 99.3 |
| 26 | male | 27 | 98 | 98.9 |
| 27 | male | 29 | 98 | 97.6 |
| 28 | female | 39 | 99 | 97.8 |
| 29 | male | 37 | 97 | 99.8 |
| 30 | male | 28 | 97 | 99.8 |
| 31 | male | 25 | 99 | 97.4 |
| 32 | male | 53 | 97 | 97.4 |
| 33 | male | 29 | 99 | 99.6 |
| 34 | male | 25 | 99 | 98.8 |
| 35 | male | 27 | 98 | 99.7 |
| 36 | male | 59 | 99 | 98.7 |
| 37 | female | 77 | 98 | 95.6 |
| 38 | female | 17 | 100 | 99.7 |
Disclaimer/Publisher’s Note: The statements, opinions and data contained in all publications are solely those of the individual author(s) and contributor(s) and not of MDPI and/or the editor(s). MDPI and/or the editor(s) disclaim responsibility for any injury to people or property resulting from any ideas, methods, instructions or products referred to in the content. |
© 2024 by the authors. Licensee MDPI, Basel, Switzerland. This article is an open access article distributed under the terms and conditions of the Creative Commons Attribution (CC BY) license (https://creativecommons.org/licenses/by/4.0/).
Share and Cite
Katan, M.; Pearl, O.; Tzroya, A.; Duadi, H.; Fixler, D. A Self-Calibrated Single Wavelength Biosensor for Measuring Oxygen Saturation. Biosensors 2024, 14, 132. https://doi.org/10.3390/bios14030132
Katan M, Pearl O, Tzroya A, Duadi H, Fixler D. A Self-Calibrated Single Wavelength Biosensor for Measuring Oxygen Saturation. Biosensors. 2024; 14(3):132. https://doi.org/10.3390/bios14030132
Chicago/Turabian StyleKatan, Michal, Ori Pearl, Alon Tzroya, Hamootal Duadi, and Dror Fixler. 2024. "A Self-Calibrated Single Wavelength Biosensor for Measuring Oxygen Saturation" Biosensors 14, no. 3: 132. https://doi.org/10.3390/bios14030132
APA StyleKatan, M., Pearl, O., Tzroya, A., Duadi, H., & Fixler, D. (2024). A Self-Calibrated Single Wavelength Biosensor for Measuring Oxygen Saturation. Biosensors, 14(3), 132. https://doi.org/10.3390/bios14030132