Using a Smartphone-Based Colorimetric Device with Molecularly Imprinted Polymer for the Quantification of Tartrazine in Soda Drinks


 ,
,  ,
,  and
and
Abstract
1. Introduction
2. Materials and Methods
2.1. Chemic als and Reagents
2.2. Synthesis of Molecularly Imprinted Polymer (MIP)
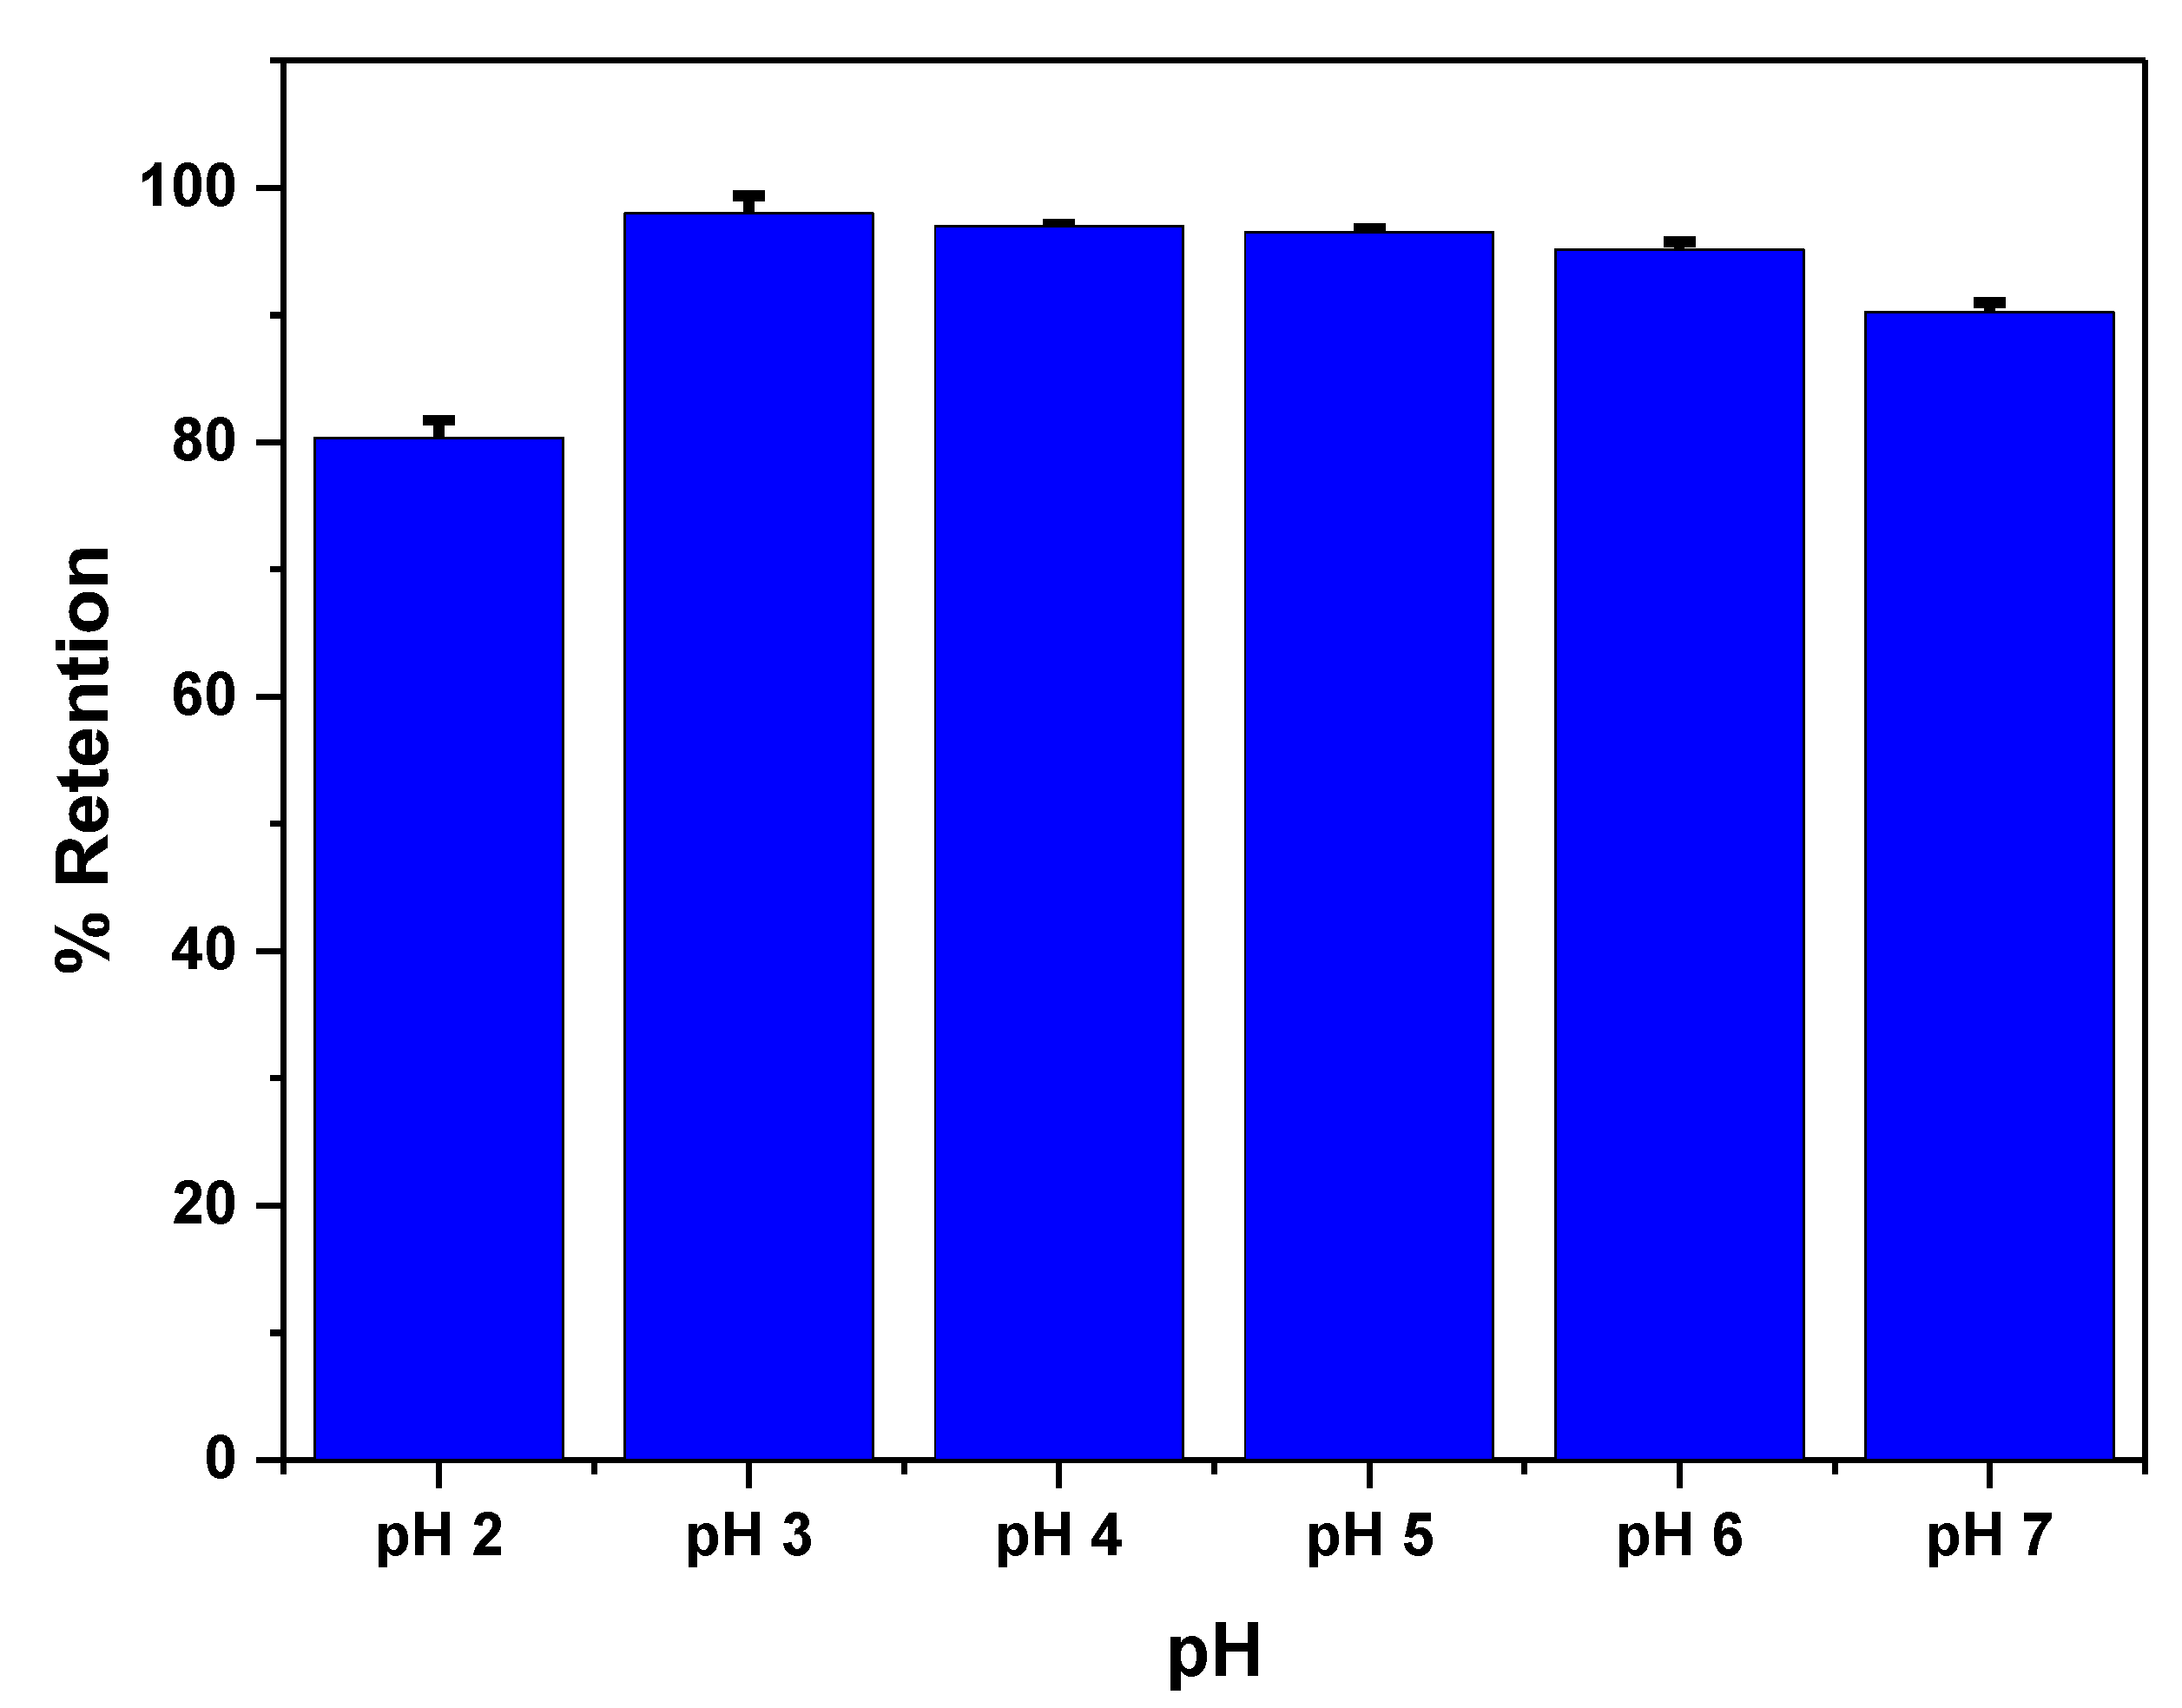
2.3. Adsorption Process
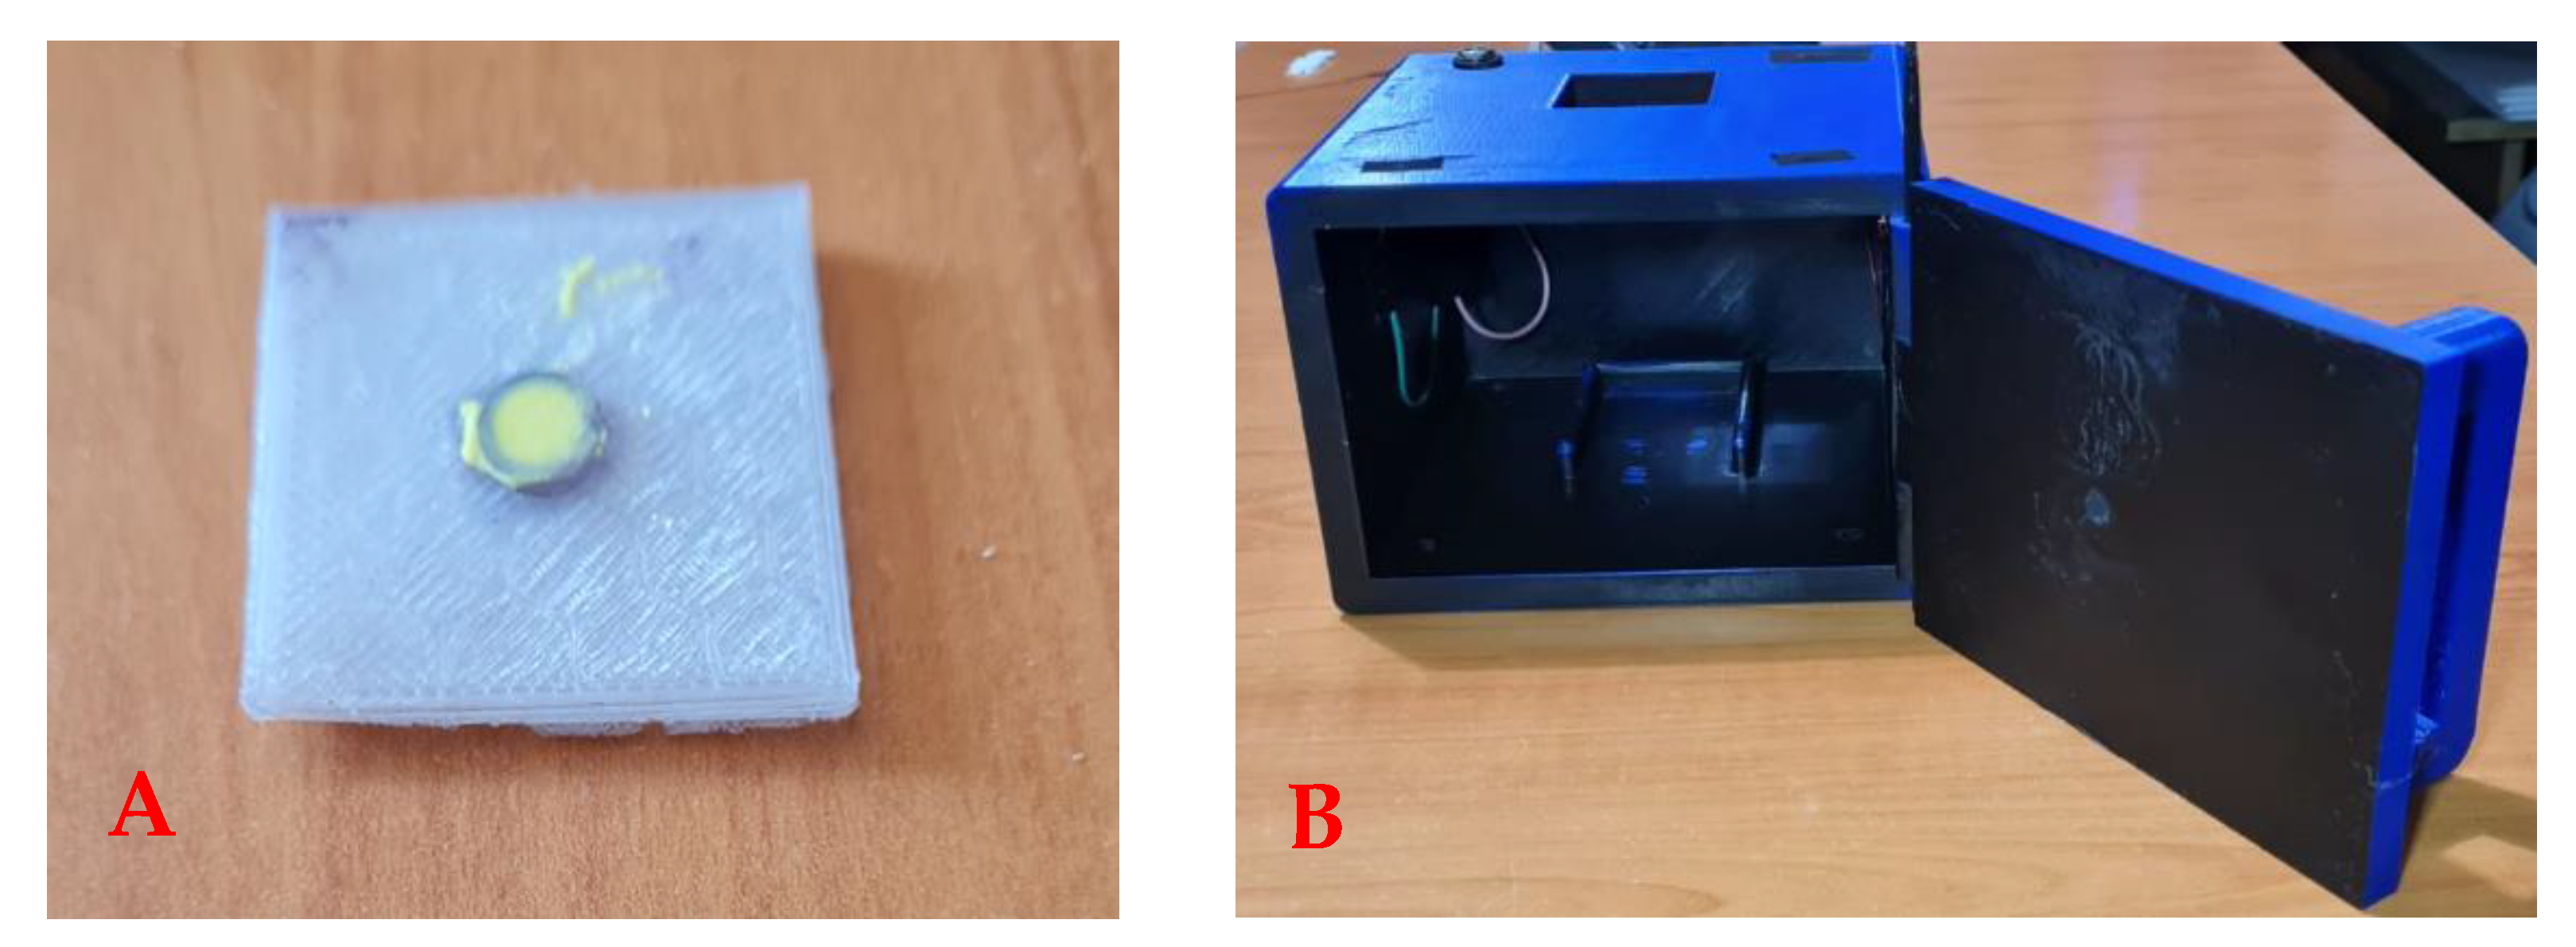
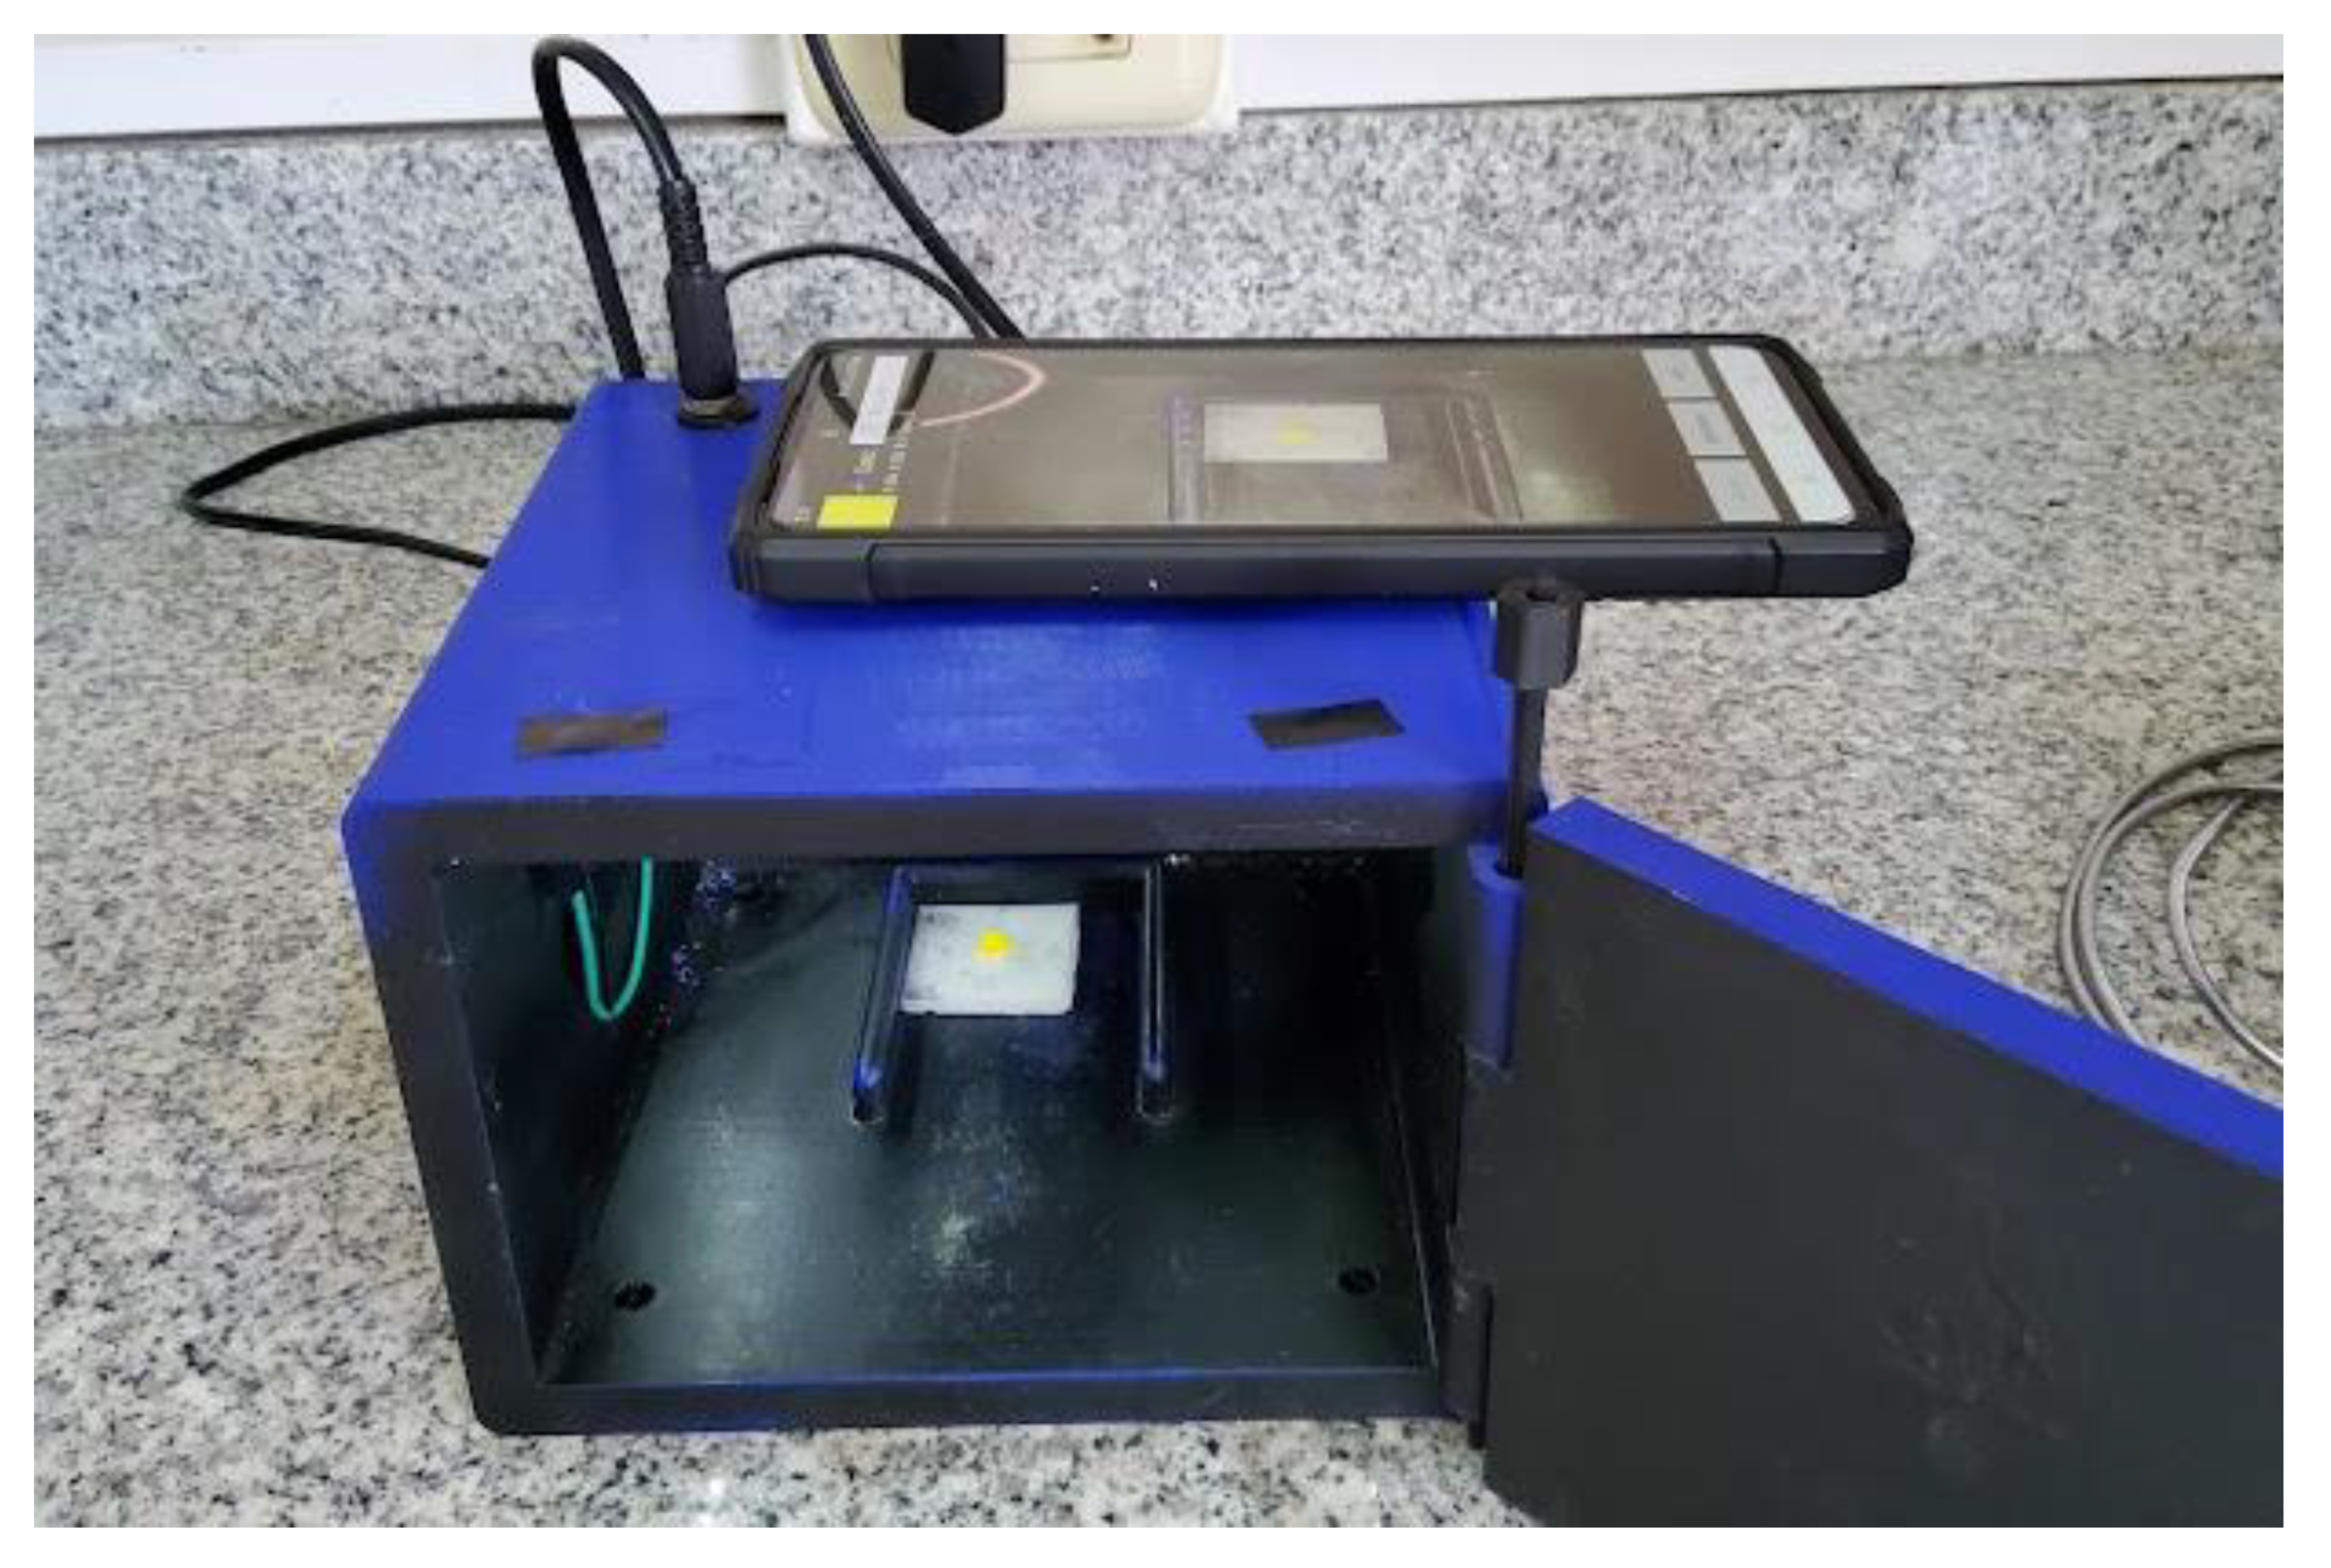
2.4. Construction of the RadesPhone Device
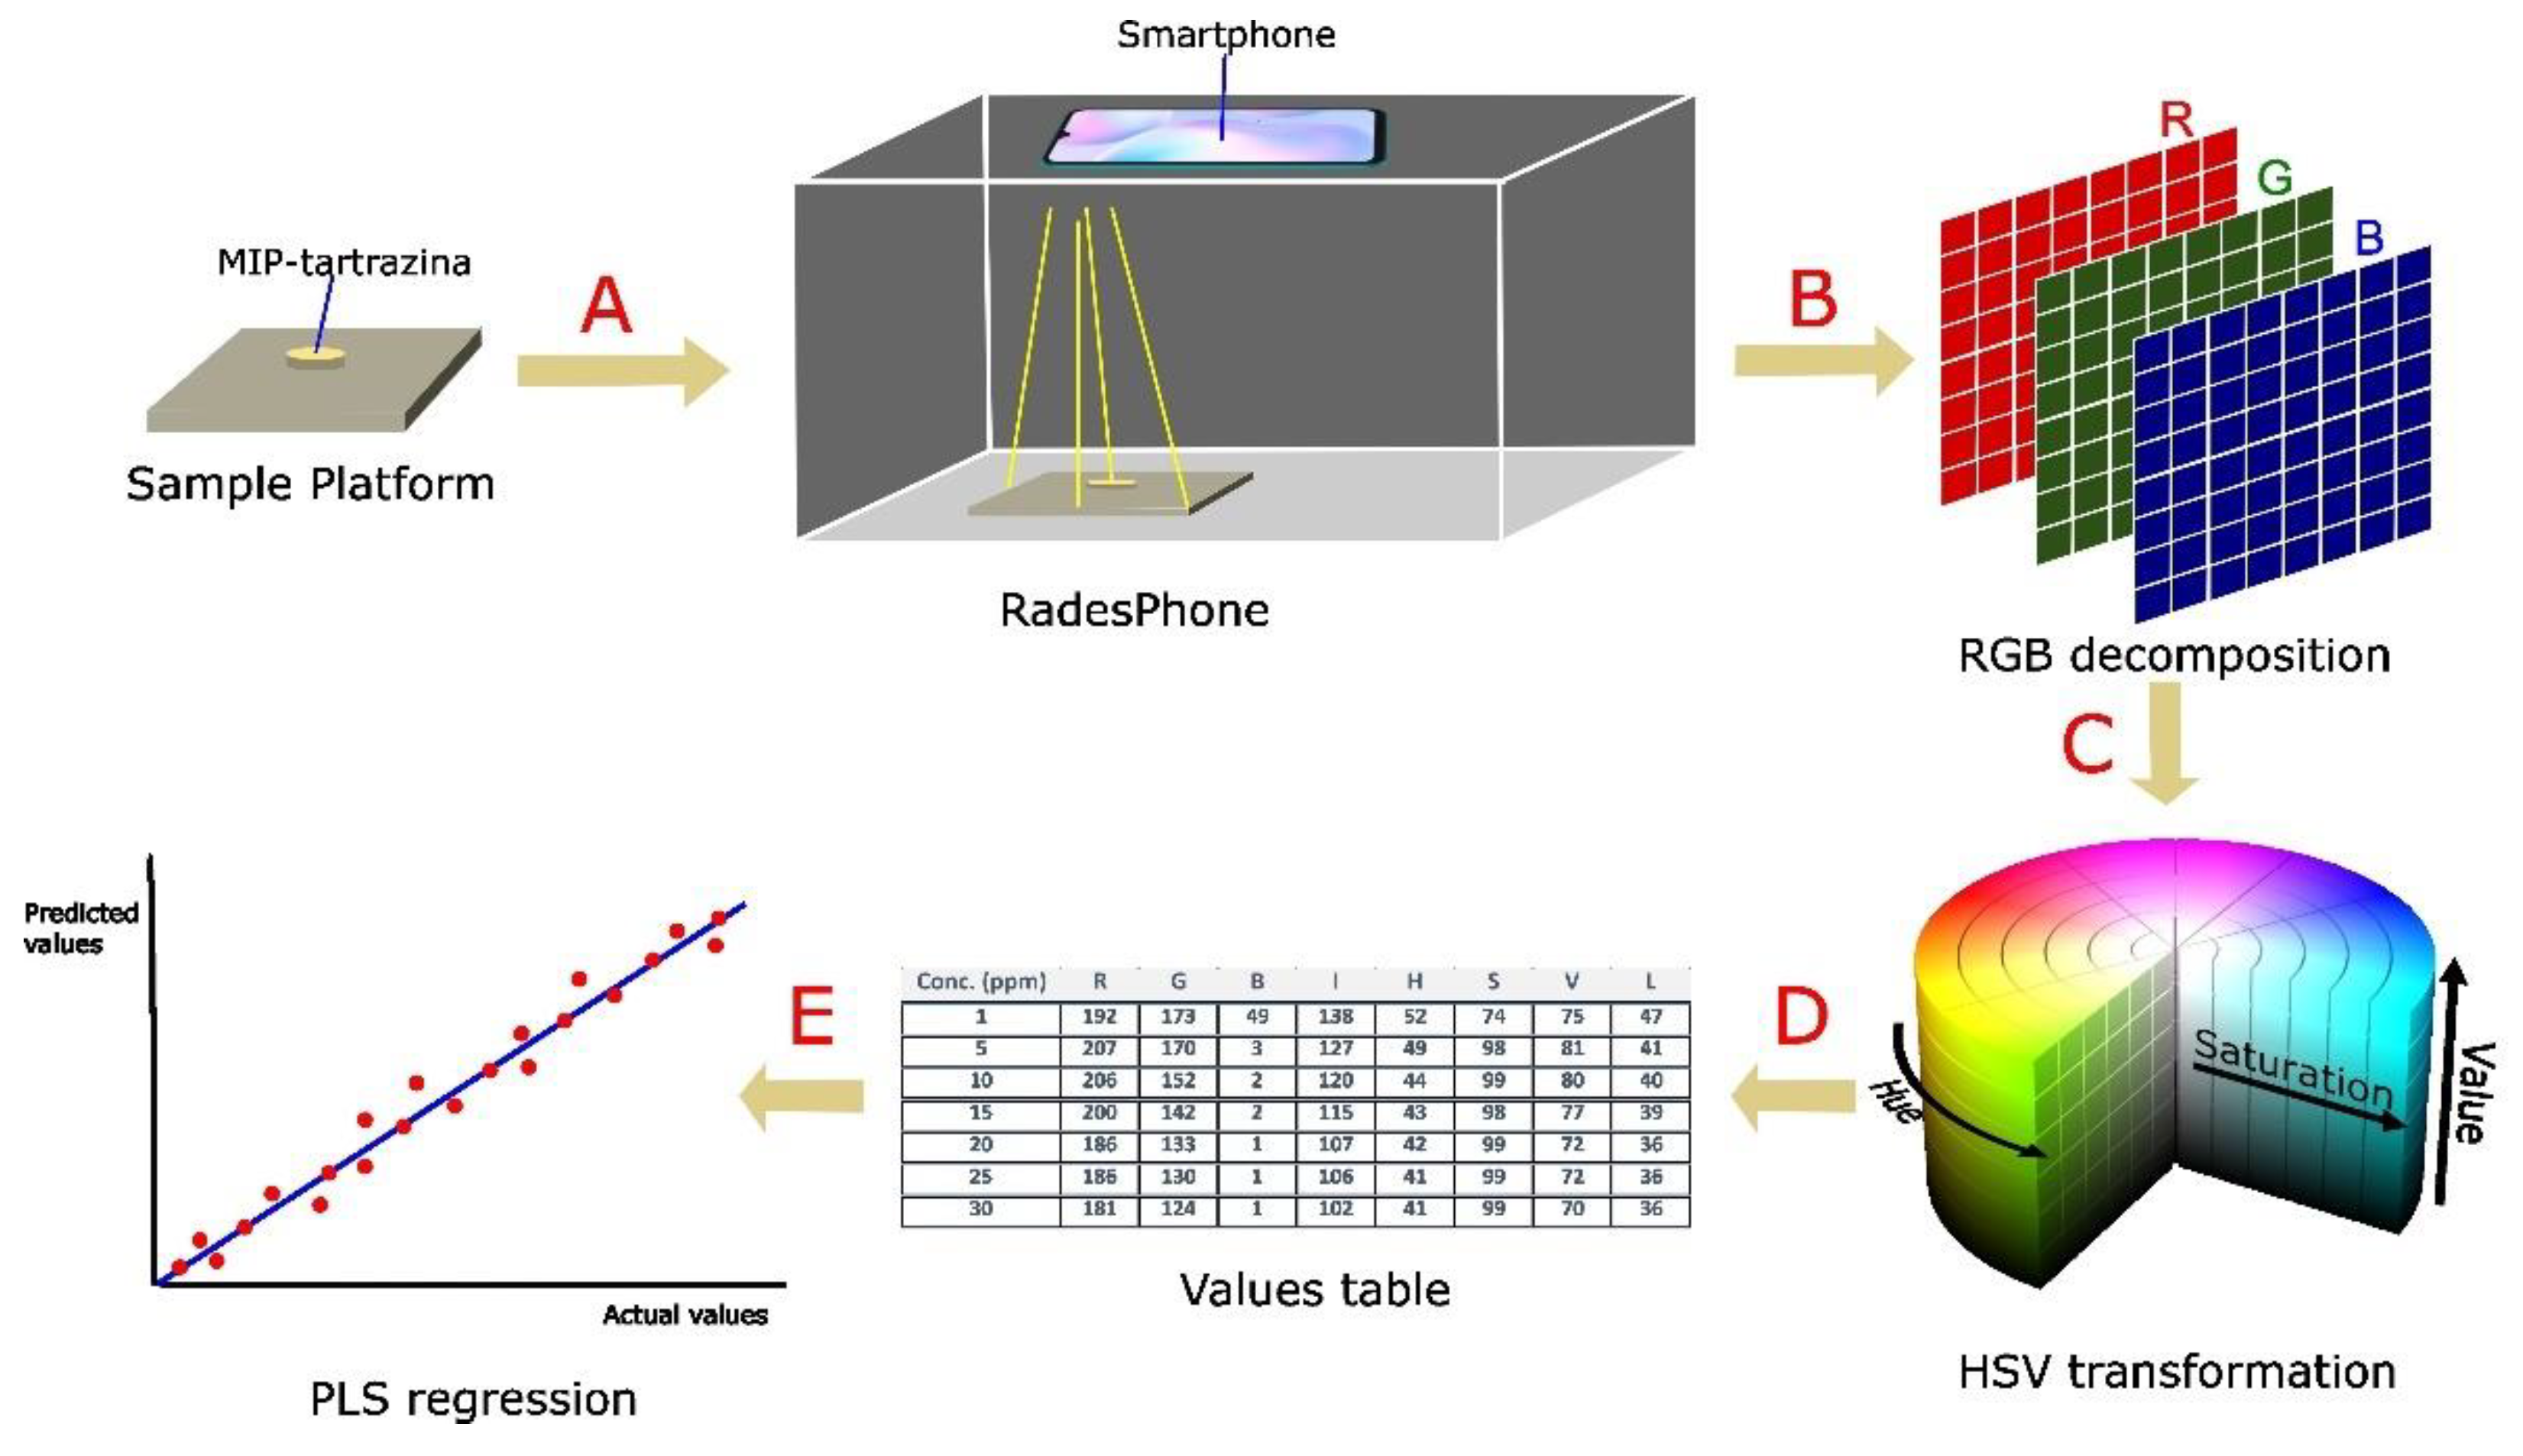
2.5. Image Acquisition with RadesPhone
2.6. Analysis of Soda Drinks by UHPLC
3. Results
3.1. Synthesis of MIP Obtained by Precipitation
3.2. Multivariate PLS Regression
4. Conclusions
Author Contributions
Funding
Institutional Review Board Statement
Informed Consent Statement
Data Availability Statement
Acknowledgments
Conflicts of Interest
References
- Yamjala, K.; Nainar, M.S.; Ramisetti, N.R. Methods for the analysis of azo dyes employed in food industry—A review. Food Chem. 2016, 192, 813–824. [Google Scholar] [CrossRef] [PubMed]
- EFSA Panel on Food Additives and Nutrient Sources Added to Food. Scientific Opinion on the re-evaluation Tartrazine (E 102). EFSA J. 2009, 7, 1331. [Google Scholar] [CrossRef]
- Atlı Şekeroğlu, Z.; Güneş, B.; Kontaş Yedier, S.; Şekeroğlu, V.; Aydın, B. Effects of tartrazine on proliferation and genetic damage in human lymphocytes. Toxicol. Mech. Methods 2017, 27, 370–375. [Google Scholar] [CrossRef] [PubMed]
- Liu, L.; Sun, H.; Xiao, L.; Yang, Z.Q.; Han, J.; Gong, X.; Hu, Q. Development of a highly sensitive fluorescence method for tartrazine determination in food matrices based on carbon dots. Anal. Bioanal. Chem. 2021, 413, 1485–1492. [Google Scholar] [CrossRef]
- Dinç, E.; Aktas, A.H.; Baleanu, D.; Ustundag, O. Simultaneous determination of tartrazine and allura red in commercial preparation by chemometric HPLC method. J. Food Drug Anal. 2006, 14, 284. [Google Scholar] [CrossRef]
- Alp, H.; Başkan, D.; Yaşar, A.; Yaylı, N. Simultaneous determination of sunset yellow FCF, allura red AC, quinoline yellow WS, and tartrazine in food samples by RP-HPLC. J. Chem. 2018, 2018, 6486250. [Google Scholar] [CrossRef]
- Agbokponto, J.E.; Kpaibe, A.P.S.; Yemoa, L.A.; Assanhou, A.G.; Ganfon, H.; Gbassi, G.K.; Aké, M.; Amin, N.C.; Agbokponto, J.E.; Kpaibe, A.P.S.; et al. Simultaneous Determination by HPLC-UV Vis of Tartrazine and Sunset Yellow in Soft Drinks Sold in Benin. Am. J. Anal. Chem. 2022, 13, 277–288. [Google Scholar] [CrossRef]
- Lawal, A.; Gwaram, N.S.; Abdulkarim, S. The Spectrophotometric Determination of Tartrazine in Some Selected Beverages: A Case Study of Katsina Town, Nigeria. FUDMA J. Sci. 2020, 4, 685–689. [Google Scholar]
- Sahraei, R.; Farmany, A.; Mortazavi, S.S. A nanosilver-based spectrophotometry method for sensitive determination of tartrazine in food samples. Food Chem. 2013, 138, 1239–1242. [Google Scholar] [CrossRef]
- Gharaghani, F.M.; Akhond, M.; Hemmateenejad, B. A three-dimensional origami microfluidic device for paper chromatography: Application to quantification of Tartrazine and Indigo carmine in food samples. J. Chromatogr. A 2020, 1621, 461049. [Google Scholar] [CrossRef]
- Lipskikh, O.I.; Korotkova, E.I.; Barek, J.; Vyskocil, V.; Saqib, M.; Khristunova, E.P. Simultaneous voltammetric determination of Brilliant Blue FCF and Tartrazine for food quality control. Talanta 2020, 218, 121136. [Google Scholar] [CrossRef]
- Ziyatdinova, G.K.; Budnikov, H.C. Voltammetric Determination of Tartrazine on an Electrode Modified with Cerium Dioxide Nanoparticles and Cetyltriphenylphosphonium Bromide. J. Anal. Chem. 2022, 77, 664–670. [Google Scholar] [CrossRef]
- Rovina, K.; Siddiquee, S.; Shaarani, S.M. A review of extraction and analytical methods for the determination of tartrazine (E 102) in foodstuffs. Crit. Rev. Anal. Chem. 2017, 47, 309–324. [Google Scholar] [CrossRef]
- Parisi, O.I.; Francomano, F.; Dattilo, M.; Patitucci, F.; Prete, S.; Amone, F.; Puoci, F. The Evolution of Molecular Recognition: From Antibodies to Molecularly Imprinted Polymers (MIPs) as Artificial Counterpart. J. Funct. Biomater. 2022, 13, 12. [Google Scholar] [CrossRef]
- Belbruno, J.J. Molecularly Imprinted Polymers. Chem. Rev. 2019, 119, 94–119. [Google Scholar] [CrossRef]
- López, R.; Khan, S.; Torres, S.E.; Wong, A.; Sotomayor, M.D.P.T.; Picasso, G. Synthesis and Characterization of Magnetic Molecularly Imprinted Polymer for the Monitoring of Amoxicillin in Real Samples Using the Chromatographic Method. Magnetochemistry 2023, 9, 92. [Google Scholar] [CrossRef]
- Barhate, C.L.; Donnell, A.F.; Davies, M.; Li, L.; Zhang, Y.; Yang, F.; Black, R.; Zipp, G.; Zhang, Y.; Cavallaro, C.L.; et al. Microscale purification in support of high-throughput medicinal chemistry. Chem. Commun. 2021, 57, 11037–11040. [Google Scholar] [CrossRef]
- Srivastava, N.; Singh, A.; Kumari, P.; Nishad, J.H.; Gautam, V.S.; Yadav, M.; Bharti, R.; Kumar, D.; Kharwar, R.N. Advances in extraction technologies: Isolation and purification of bioactive compounds from biological materials. Nat. Bioact. Compd. Technol. Adv. 2021, 409–433. [Google Scholar] [CrossRef]
- Li, X.; Wan, J.; Wang, Y.; Yan, Z.; Chi, H.; Ding, S. Mechanism of accurate recognition and catalysis of diethyl phthalate (DEP) in wastewater by novel MIL100 molecularly imprinted materials. Appl. Catal. B Environ. 2020, 266, 118591. [Google Scholar] [CrossRef]
- Cui, B.; Liu, P.; Liu, X.; Liu, S.; Zhang, Z. Molecularly imprinted polymers for electrochemical detection and analysis: Progress and perspectives. J. Mater. Res. Technol. 2020, 9, 12568–12584. [Google Scholar] [CrossRef]
- Cengiz, N.; Guclu, G.; Kelebek, H.; Capanoglu, E.; Selli, S. Application of Molecularly Imprinted Polymers for the Detection of Volatile and Off-Odor Compounds in Food Matrices. ACS Omega 2021, 7, 15258–15266. [Google Scholar] [CrossRef] [PubMed]
- Arshad, U.; Mujahid, A.; Lieberzeit, P.; Afzal, A.; Bajwa, S.Z.; Iqbal, N.; Roshan, S. Molecularly imprinted polymeric coatings for sensitive and selective gravimetric detection of artemether. RSC Adv. 2020, 10, 34355–34363. [Google Scholar] [CrossRef] [PubMed]
- López, R.; Khan, S.; Wong, A.; del Pilar Taboada Sotomayor, M.; Picasso, G. Development of a New Electrochemical Sensor Based on Mag-MIP Selective Toward Amoxicillin in Different Samples. Front. Chem. 2021, 9, 146. [Google Scholar] [CrossRef] [PubMed]
- Mortari, B.; Khan, S.; Wong, A.; Sotomayor, M.D.P.T. A spot test for direct quantification of acid green 16 adsorbed on a molecularly imprinted polymer through diffuse reflectance measurements. Anal. Methods 2021, 13, 453–461. [Google Scholar] [CrossRef] [PubMed]
- Foguel, M.V.; Pedro, N.T.B.; Wong, A.; Khan, S.; Zanoni, M.V.B.; Sotomayor, M.D.P.T. Synthesis and evaluation of a molecularly imprinted polymer for selective adsorption and quantification of Acid Green 16 textile dye in water samples. Talanta 2017, 170, 244–251. [Google Scholar] [CrossRef]
- Foguel, M.V.; Pedro, N.T.B.; Zanoni, M.V.B.; Sotomayor, M.D.P.T. Molecularly Imprinted Polymer (MIP): A Promising Recognition System for Development of Optical Sensor for Textile Dyes. Procedia Technol. 2017, 27, 299–300. [Google Scholar] [CrossRef]
- Mortari, B.; Khan, S.; Wong, A.; Fireman Dutra, R.A.; Taboada Sotomayor, M.D.P.T. Next generation of optodes coupling plastic antibody with optical fibers for selective quantification of Acid Green 16. Sens. Actuators B Chem. 2020, 305, 127553. [Google Scholar] [CrossRef]
- George, A.; Rose Cherian, A.; Jacob, B.; Varghese, A.; Maiyalagan, T. Design optimisation and fabrication of amino acid based molecularly imprinted sensor for the selective determination of food additive tartrazine. Food Chem. 2023, 404, 134673. [Google Scholar] [CrossRef]
- Ruiz-Córdova, G.A.; Villa, J.E.L.; Khan, S.; Picasso, G.; Del Pilar Taboada Sotomayor, M. Surface molecularly imprinted core-shell nanoparticles and reflectance spectroscopy for direct determination of tartrazine in soft drinks. Anal. Chim. Acta 2021, 1159, 338443. [Google Scholar] [CrossRef]
- Mohammadinejad, A.; Abouzari-Lotf, E.; Aleyaghoob, G.; Rezayi, M.; Kazemi Oskuee, R. Application of a transition metal oxide/carbon-based nanocomposite for designing a molecularly imprinted poly (l-cysteine) electrochemical sensor for curcumin. Food Chem. 2022, 386, 132845. [Google Scholar] [CrossRef]
- Saadati, M. Smartphone-Based Digital Image Analysis for Determination of Some Food Dyes in Commercial Products. Food Anal. Methods 2021, 14, 2367–2374. [Google Scholar] [CrossRef]
- Liu, J.; Geng, Z.; Fan, Z.; Liu, J.; Chen, H. Point-of-care testing based on smartphone: The current state-of-the-art (2017–2018). Biosens. Bioelectron. 2019, 132, 17–37. [Google Scholar] [CrossRef]
- Fan, Y.; Li, J.; Guo, Y.; Xie, L.; Zhang, G. Digital image colorimetry on smartphone for chemical analysis: A review. Measurement 2021, 171, 108829. [Google Scholar] [CrossRef]
- Böck, F.C.; Helfer, G.A.; da Costa, A.B.; Dessuy, M.B.; Ferrão, M.F. PhotoMetrix and colorimetric image analysis using smartphones. J. Chemom. 2020, 34, e3251. [Google Scholar] [CrossRef]
- Hassanijalilian, O.; Igathinathane, C.; Doetkott, C.; Bajwa, S.; Nowatzki, J.; Haji Esmaeili, S.A. Chlorophyll estimation in soybean leaves infield with smartphone digital imaging and machine learning. Comput. Electron. Agric. 2020, 174, 105433. [Google Scholar] [CrossRef]
- Xing, G.; Ai, J.; Wang, N.; Pu, Q. Recent progress of smartphone-assisted microfluidic sensors for point of care testing. TrAC Trends Anal. Chem. 2022, 157, 116792. [Google Scholar] [CrossRef]
- Zhang, S.; Li, Z.; Wei, Q. Smartphone-based cytometric biosensors for point-of-care cellular diagnostics. Nanotechnol. Precis. Eng. 2020, 3, 32. [Google Scholar] [CrossRef]
- Saddique, Z.; Faheem, M.; Habib, A.; UlHasan, I.; Mujahid, A.; Afzal, A. Electrochemical Creatinine (Bio)Sensors for Point-of-Care Diagnosis of Renal Malfunction and Chronic Kidney Disorders. Diagnostics 2023, 13, 1737. [Google Scholar] [CrossRef]
- Lin, B.; Yu, Y.; Cao, Y.; Guo, M.; Zhu, D.; Dai, J.; Zheng, M. Point-of-care testing for streptomycin based on aptamer recognizing and digital image colorimetry by smartphone. Biosens. Bioelectron. 2018, 100, 482–489. [Google Scholar] [CrossRef]
- Guo, L.; Zhao, D.M.; Chen, S.; Yu, Y.L.; Wang, J.H. Smartphone-Integrated Photoacoustic Analytical Device for Point-of-Care Testing of Food Contaminant Azodicarbonamide. Anal. Chem. 2022, 94, 14004–14011. [Google Scholar] [CrossRef]
- Yadav, P.; Yadav, L.; Laddha, H.; Agarwal, M.; Gupta, R. Upsurgence of smartphone as an economical, portable, and consumer-friendly analytical device/interface platform for digital sensing of hazardous environmental ions. Trends Environ. Anal. Chem. 2022, 36, e00177. [Google Scholar] [CrossRef]
- Lyu, Z.; Ding, S.; Tieu, P.; Fang, L.; Li, X.; Li, T.; Pan, X.; Engelhard, M.H.; Ruan, X.; Du, D.; et al. Single-Atomic Site Catalyst Enhanced Lateral Flow Immunoassay for Point-of-Care Detection of Herbicide. Research 2022, 2022, 9823290. [Google Scholar] [CrossRef] [PubMed]
- Tao, D.; Xiao, X.; Lan, X.; Xu, B.; Wang, Y.; Khazalwa, E.M.; Pan, W.; Ruan, J.; Jiang, Y.; Liu, X.; et al. An Inexpensive CRISPR-Based Point-of-Care Test for the Identification of Meat Species and Meat Products. Genes 2022, 13, 912. [Google Scholar] [CrossRef] [PubMed]
- Suan Ng, S.; Ling Lee, H.; Bothi Raja, P.; Doong, R. an Recent Advances in Nanomaterial-based Optical Biosensors as Potential Point-of-Care Testing (PoCT) Probes in Carcinoembryonic Antigen Detection. Chem. An Asian J. 2022, 17, e202200287. [Google Scholar] [CrossRef] [PubMed]
- Arabzadeh, N.; Khosravi, A.; Mohammadi, A.; Mahmoodi, N.M.; Khorasani, M. Synthesis, characterization, and application of nano-molecularly imprinted polymer for fast solid-phase extraction of tartrazine from water environment. Desalin. Water Treat. 2015, 54, 2452–2460. [Google Scholar] [CrossRef]
- Lamaoui, A.; Karrat, A.; Amine, A. Molecularly imprinted polymer integrated into paper-based analytical device for smartphone-based detection: Application for sulfamethoxazole. Sens. Actuators B Chem. 2022, 368, 132122. [Google Scholar] [CrossRef]
- Sergeyeva, T.; Yarynka, D.; Piletska, E.; Linnik, R.; Zaporozhets, O.; Brovko, O.; Piletsky, S.; El, A. Development of a smartphone-based biomimetic sensor for aflatoxin B1 detection using molecularly imprinted polymer membranes. Talanta 2019, 201, 204–210. [Google Scholar] [CrossRef]
- Lowdon, J.W.; Diliën, H.; van Grinsven, B.; Eersels, K.; Cleij, T.J. Colorimetric Sensing of Amoxicillin Facilitated by Molecularly Imprinted Polymers. Polymer 2021, 13, 2221. [Google Scholar] [CrossRef]
- Kaymaz, C.; Güner, H.; Akbulut, M.; Güven, O. A smartphone-based colorimetric PET sensor platform with molecular recognition via thermally initiated RAFT-mediated graft copolymerization. Sens. Actuators B Chem. 2019, 296, 126653. [Google Scholar] [CrossRef]
- Elfadil, D.; Della Pelle, F.; Compagnone, D.; Amine, A. Green Synthesis of Molecularly Imprinted Polymers for Dispersive Magnetic Solid-Phase Extraction of Erythrosine B Associated with Smartphone Detection in Food Samples. Materials 2022, 15, 7653. [Google Scholar] [CrossRef]
- Al-Degs, Y.S.; Abu-Surrah, A.S.; Ibrahim, K.A. Preparation of highly selective solid-phase extractants for Cibacron reactive dyes using molecularly imprinted polymers. Anal. Bioanal. Chem. 2009, 393, 1055–1062. [Google Scholar] [CrossRef]
- García, A.; Erenas, M.M.; Marinetto, E.D.; Abad, C.A.; De Orbe-Paya, I.; Palma, A.J.; Capitán-Vallvey, L.F. Mobile phone platform as portable chemical analyzer. Sens. Actuators B Chem. 2011, 156, 350–359. [Google Scholar] [CrossRef]
- John, C.R.; Russ, J.C. Introduction to Image Processing and Analysis; CRC Press: Boca Raton, FL, USA, 2017. [Google Scholar]
- Ostra, M.; Ubide, C.; Vidal, M.; Zuriarrain, J. Detection limit estimator for multivariate calibration by an extension of the IUPAC recommendations for univariate methods. Analyst 2008, 133, 532–539. [Google Scholar] [CrossRef]


| Sample | R | G | B | I | H | S | V | L |
|---|---|---|---|---|---|---|---|---|
| 1 ppm | 194.5 ± 2.4 | 174.7 ± 2.1 | 28.9 ± 23.4 | 139.1 ± 5.4 | 52.3 ± 0.6 | 84.3 ± 12.3 | 76.0 ± 1.0 | 43.3 ± 4.0 |
| 5 ppm | 208.1 ± 1.2 | 172.5 ± 2.8 | 3.1 ± 0.1 | 128.0 ± 1.2 | 49.3 ± 0.6 | 98.0 ± 0.0 | 81.0 ± 0.0 | 41.0 ± 0.0 |
| 10 ppm | 206.5 ± 1.3 | 151.8 ± 0.7 | 1.9 ± 0.1 | 120.0 ± 0.1 | 43.7 ± 0.6 | 99.0 ± 0.0 | 80.3 ± 0.6 | 40.3 ± 0.6 |
| 15 ppm | 198.9 ± 0.8 | 140.8 ± 1.3 | 2.0 ± 0.0 | 114.0 ± 0.7 | 42.3 ± 0.6 | 98.0 ± 0.0 | 77.3 ± 0.6 | 39.0 ± 0.0 |
| 20 ppm | 187.0 ± 1.0 | 132.7 ± 0.6 | 0.9 ± 0.1 | 106.9 ± 0.2 | 42.0 ± 0.0 | 99.0 ± 0.0 | 72.7 ± 0.6 | 36.3 ± 0.6 |
| 25 ppm | 186.0 ± 1.0 | 130.0 ± 1.0 | 1.3 ± 0.6 | 105.8 ± 0.2 | 41.3 ± 0.6 | 98.7 ± 0.6 | 72.3 ± 0.6 | 36.3 ± 0.6 |
| 30 ppm | 181.0 ± 1.0 | 125.0 ± 1.0 | 1.7 ± 0.6 | 102.6 ± 0.7 | 41.0 ± 0.0 | 98.3 ± 0.6 | 70.3 ± 0.6 | 36.7 ± 0.6 |
| M1 | 203.8 ± 1.7 | 148.0 ± 1.8 | 1.9 ± 0.1 | 116.4 ± 1.6 | 42.5 ± 1.4 | 97.8 ± 1.6 | 78.4 ± 2.2 | 40.5 ± 1.3 |
| M2 | 192.3 ± 2.0 | 136.2 ± 1.1 | 1.5 ± 0.1 | 111.2 ± 1.6 | 41.5 ± 1.3 | 97.3 ± 2.0 | 74.5 ± 1.3 | 37.2 ± 1.0 |
| M3 | 192.4 ± 1.2 | 137.4 ± 1.5 | 1.6 ± 0.5 | 111.1 ± 0.8 | 40.8 ± 0.8 | 94.4 ± 1.5 | 75.4 ± 1.4 | 37.1 ± 1.0 |
| M4 | 193.9 ± 1.7 | 136.9 ± 1.7 | 1.4 ± 0.3 | 110.8 ± 0.9 | 42.9 ± 1.0 | 97.6 ± 1.4 | 75.2 ± 1.1 | 36.3 ± 1.5 |
| M5 | 205.0 ± 1.1 | 150.4 ± 1.6 | 1.6 ± 0.5 | 117.6 ± 1.4 | 43.4 ± 0.5 | 97.3 ± 1.4 | 80.6 ± 1.3 | 40.8 ± 1.1 |
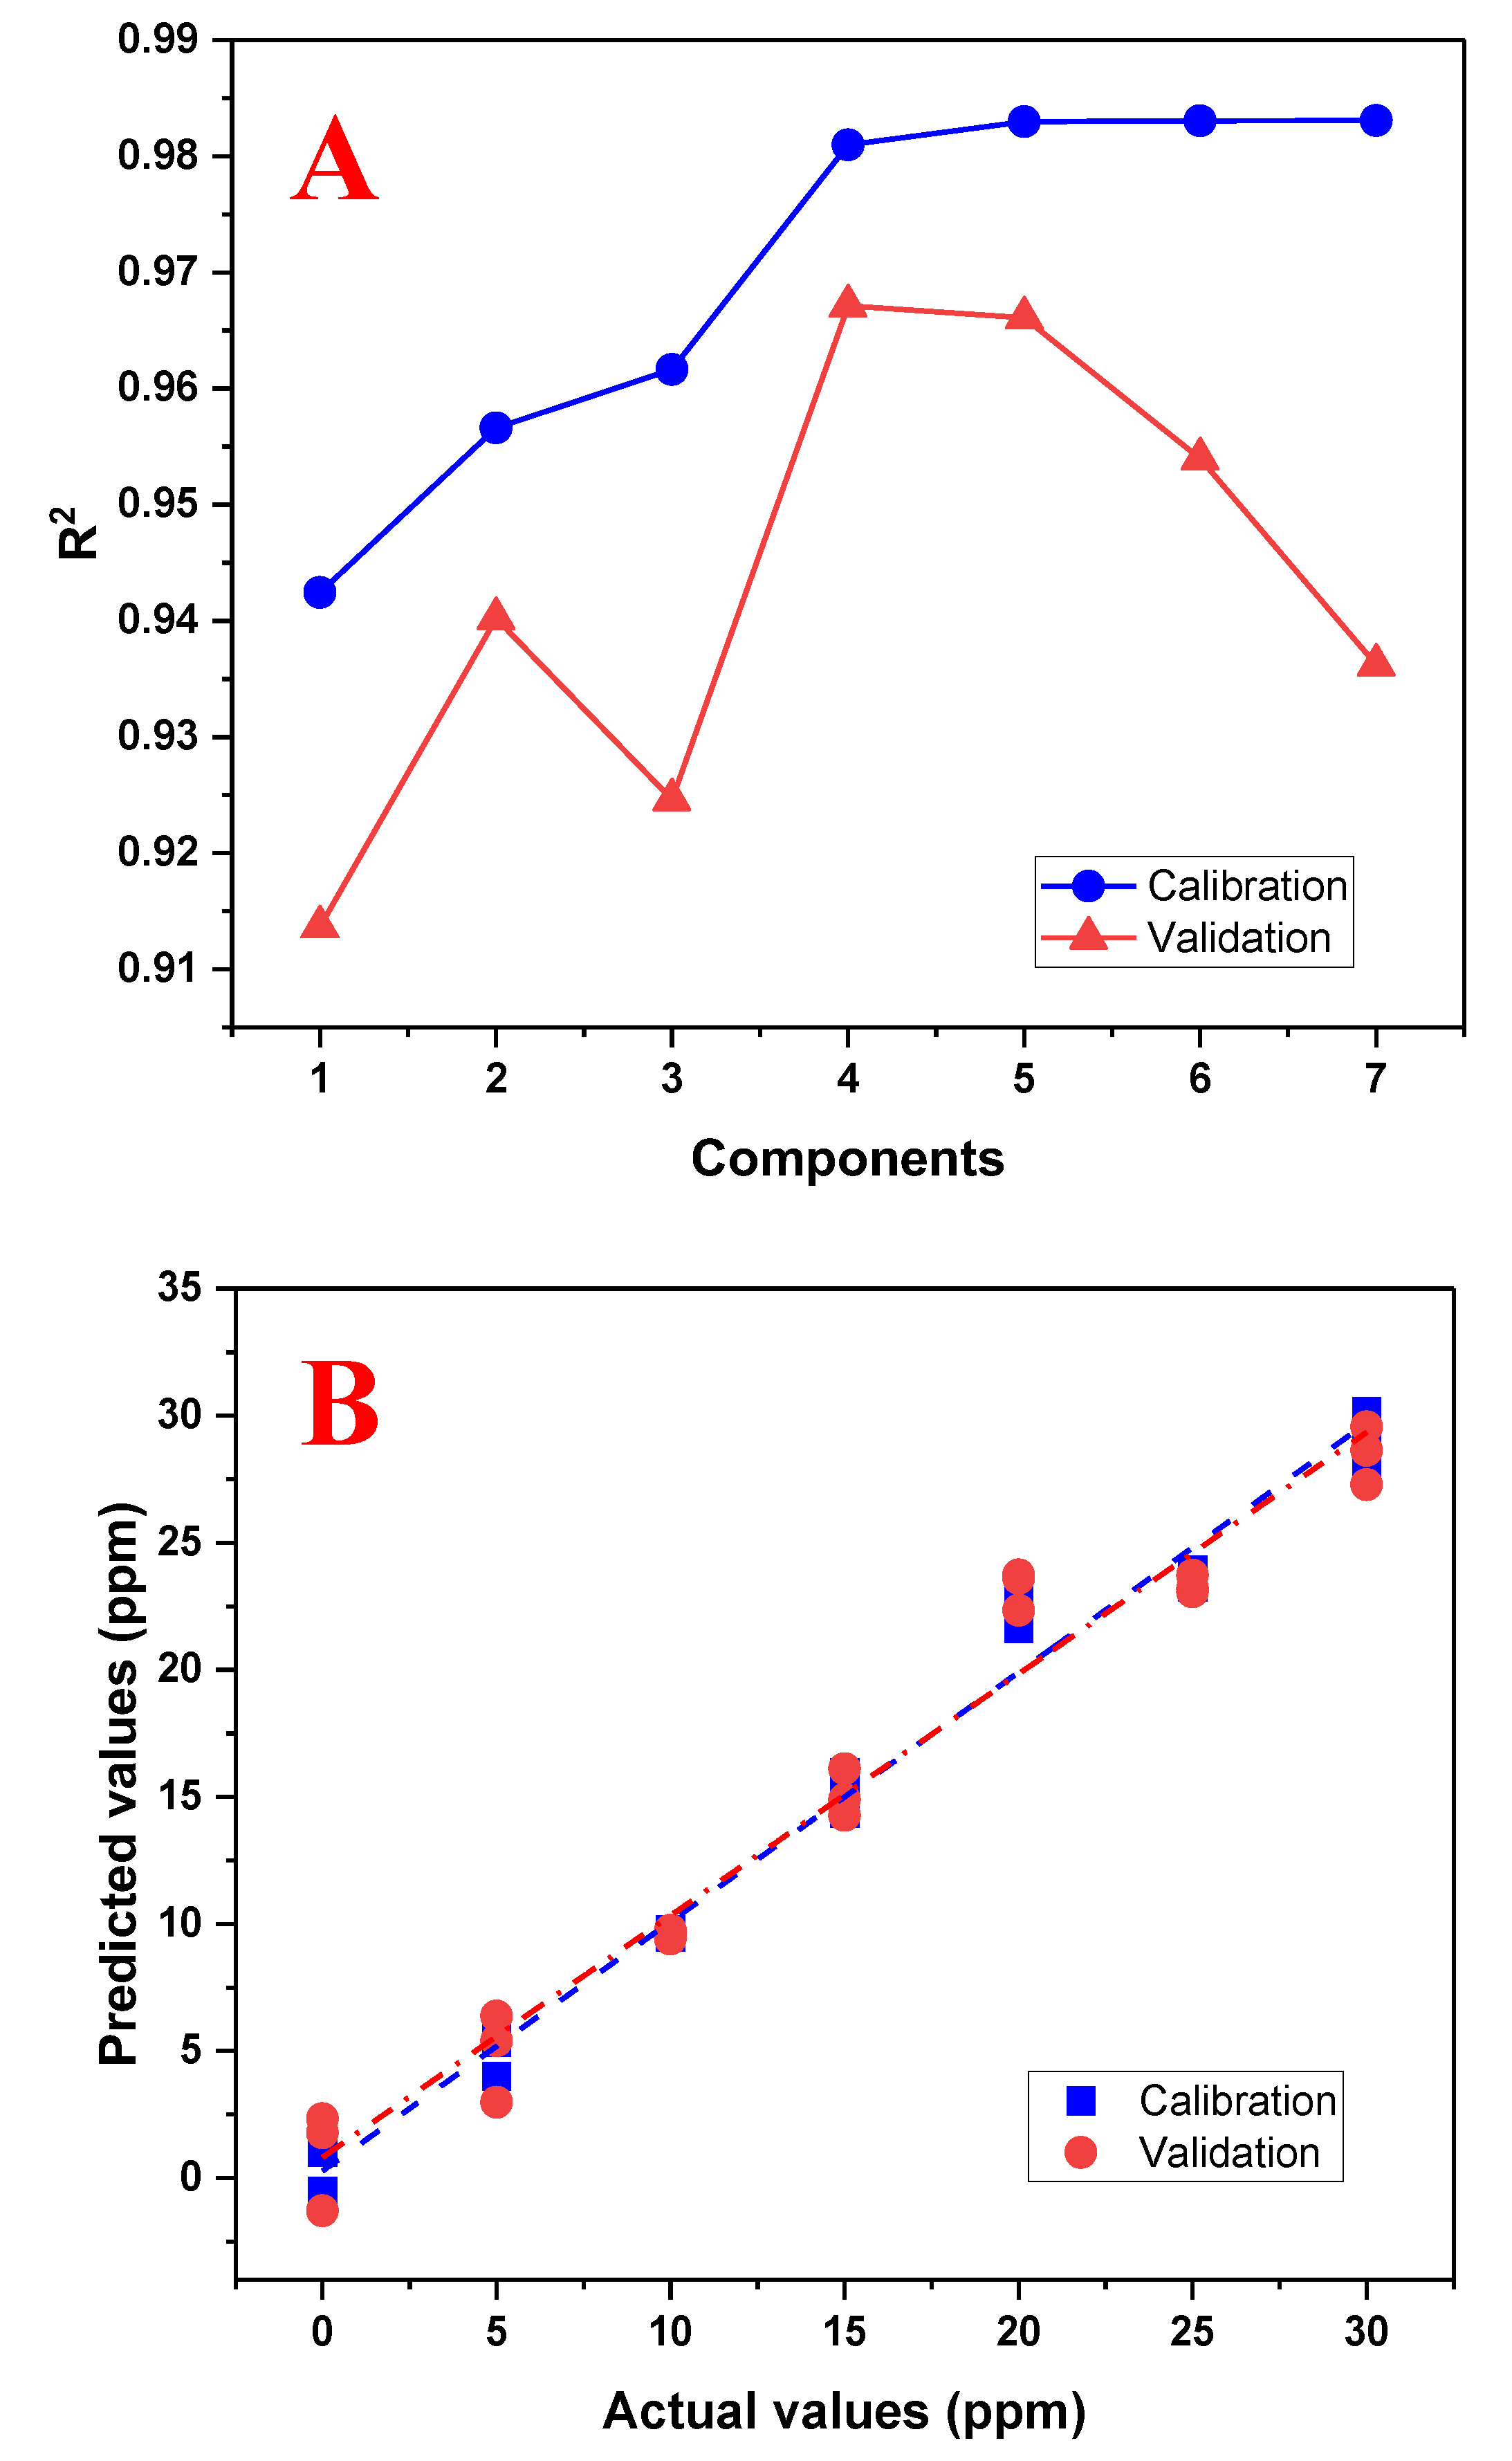
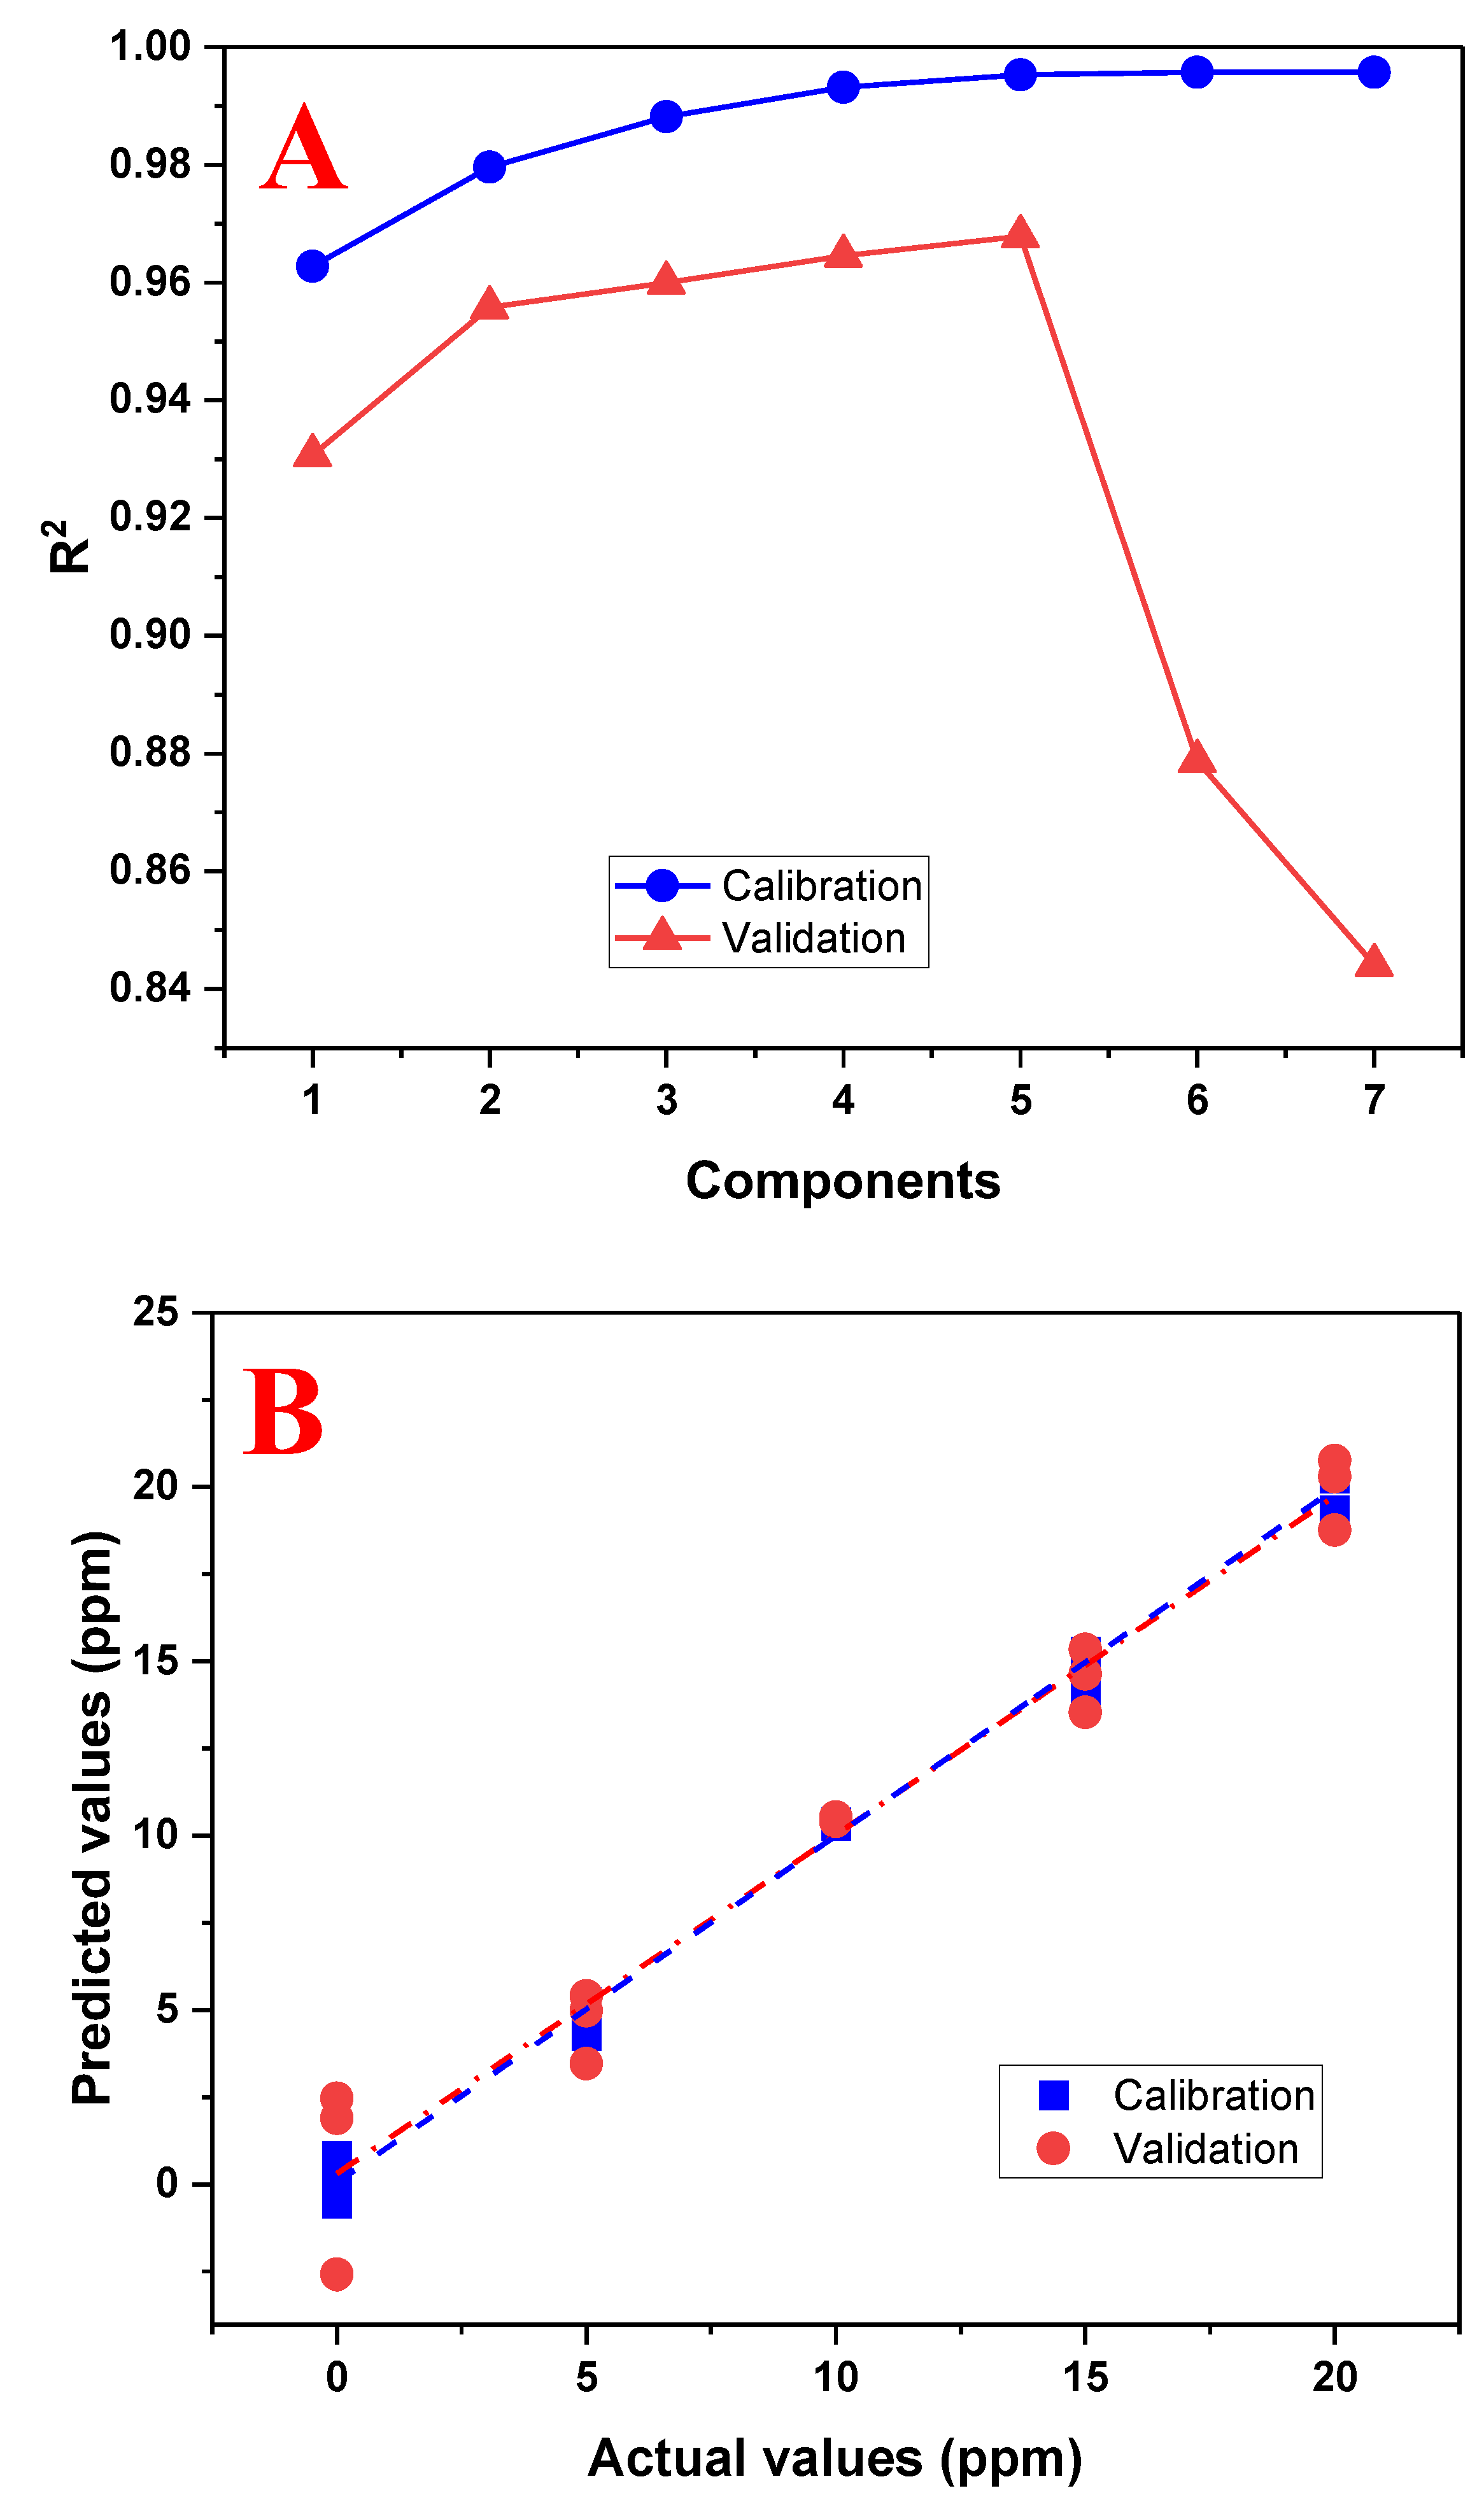
| Range (mg/L) | Number of Components | R2 (Calibration) | R2 (Validation) |
|---|---|---|---|
| 0–30 | 4 | 0.980973 | 0.967121 |
| 0–20 | 5 | 0.995304 | 0.967887 |
| Range (mg/L) | Number of Components | Repeatability (n = 10) | Limit of Detection (LOD) (mg/L) | ||
|---|---|---|---|---|---|
| mg/L | Found (mg/L) | % RSD | |||
| 0–20 | 4 | 4 | 4.6 | 5.3 | 1.2 |
| 8 | 7.2 | 3.3 | |||
| 15 | 14.5 | 4.6 | |||
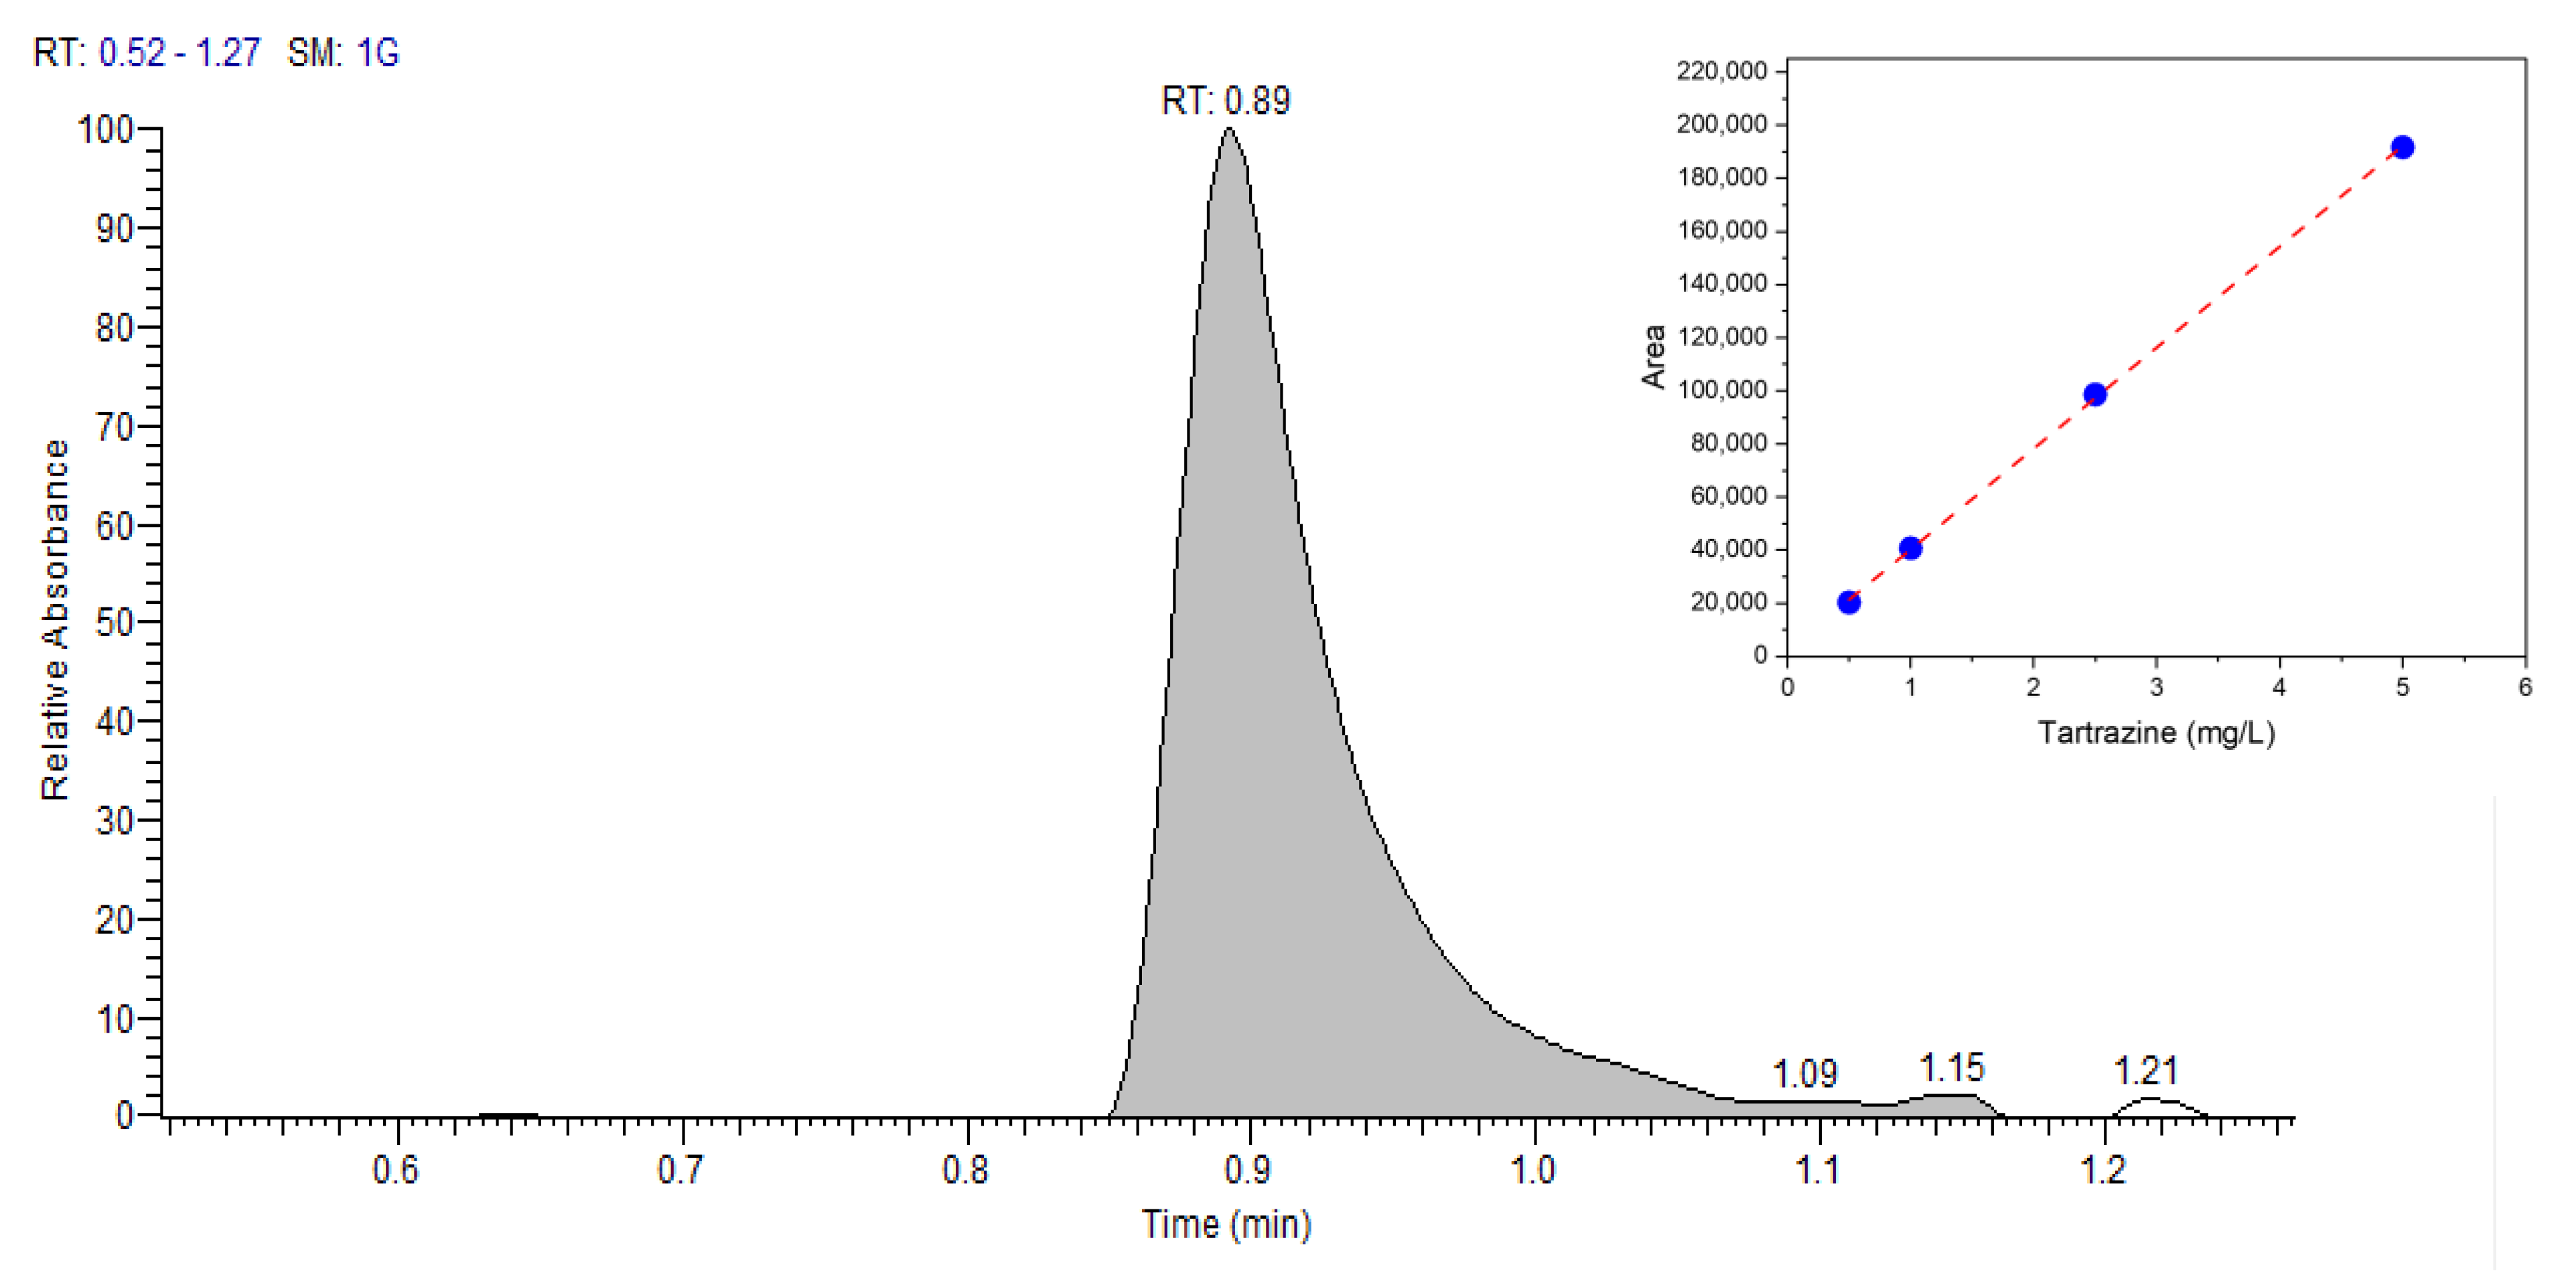
| Amount of Tartrazine Found (mg/L, n = 3) | ||||
|---|---|---|---|---|
| Sample | RadesPhone | UHPLC | Relative Error (%) | RSD (%) |
| M1 | 13.6 ± 0.8 | 12.8 ± 0.2 | 6.3 | 5.9 |
| M2 | 17.4 ± 0.6 | 19.4 ± 0.3 | −10.3 | 3.5 |
| M3 | 11.2 ± 0.7 | 9.6 ± 0.2 | 16.7 | 6.3 |
| M4 | 18.1 ± 0.7 | 16.8 ± 0.1 | 7.7 | 4.6 |
| M5 | 14.0 ± 0.6 | 12.6 ± 0.3 | 15.9 | 4.3 |
Disclaimer/Publisher’s Note: The statements, opinions and data contained in all publications are solely those of the individual author(s) and contributor(s) and not of MDPI and/or the editor(s). MDPI and/or the editor(s) disclaim responsibility for any injury to people or property resulting from any ideas, methods, instructions or products referred to in the content. |
© 2023 by the authors. Licensee MDPI, Basel, Switzerland. This article is an open access article distributed under the terms and conditions of the Creative Commons Attribution (CC BY) license (https://creativecommons.org/licenses/by/4.0/).
Share and Cite
Jacinto, C.; Maza Mejía, I.; Khan, S.; López, R.; Sotomayor, M.D.P.T.; Picasso, G. Using a Smartphone-Based Colorimetric Device with Molecularly Imprinted Polymer for the Quantification of Tartrazine in Soda Drinks. Biosensors 2023, 13, 639. https://doi.org/10.3390/bios13060639
Jacinto C, Maza Mejía I, Khan S, López R, Sotomayor MDPT, Picasso G. Using a Smartphone-Based Colorimetric Device with Molecularly Imprinted Polymer for the Quantification of Tartrazine in Soda Drinks. Biosensors. 2023; 13(6):639. https://doi.org/10.3390/bios13060639
Chicago/Turabian StyleJacinto, Christian, Ily Maza Mejía, Sabir Khan, Rosario López, Maria D. P. T. Sotomayor, and Gino Picasso. 2023. "Using a Smartphone-Based Colorimetric Device with Molecularly Imprinted Polymer for the Quantification of Tartrazine in Soda Drinks" Biosensors 13, no. 6: 639. https://doi.org/10.3390/bios13060639
APA StyleJacinto, C., Maza Mejía, I., Khan, S., López, R., Sotomayor, M. D. P. T., & Picasso, G. (2023). Using a Smartphone-Based Colorimetric Device with Molecularly Imprinted Polymer for the Quantification of Tartrazine in Soda Drinks. Biosensors, 13(6), 639. https://doi.org/10.3390/bios13060639