1. Introduction
Over the years, the study of complete blood count (CBC) disorders has served as a paradigm for gaining insight into a variety of diseases. To date, more than 1000 disorders of the synthesis and/or structure of CBC and its concentration in the blood have been identified and characterized. As an example, (i) hemoglobin disorders are associated to sickle cell disease (SCD), beta thalassemia, and diverse hemoglobinopathies; (ii) leukocyte disorders can be linked to inflammatory disease; and (iii) platelet thrombocythemia, reactive thrombocytosis, and thrombocytopenia. On the other hand, marked increases or decreases in blood cell counts could result not only when a genetic disease occurs but also because of treatments for certain diseases, such as cancer. According to the World Health Organization (WHO), the global cancer burden increased in 2018 to 18.1 million new cases, 9.6 million cancer deaths, and 43.8 million people living with cancer [
1]. This increase in the number of cancer patients puts enormous pressure on the health system, not just in economic terms. Although hematological malignancies represent the majority of pediatric cancers, central nervous system cancers, neuroblastoma and sarcomas are also represented and all require chemotherapy as a first-line treatment, resulting in bone marrow suppression. If we exclude acute myelogenous leukemias, for which children need to be hospitalized until marrow recovery, almost all other cancers can receive treatment as an outpatient regimen, with periodic cell count monitoring.
Besides cancer, variations in the hematological indices can be strictly associated with several other pathological states, including autoimmune rheumatic diseases, systemic inflammation, arthritis, or SARS-CoV-2 infection among others. In this scenario, changing home care plays a key role in bringing the concept of laboratory settings analysis to routine testing before, during, and after treatment.
The increase in new diagnoses reflects a greater number of people requiring inpatient or outpatient hospitalization. This pressure affects the quality of treatment, the number of patients who can be treated, and the presence and distribution of highly qualified personnel. The COVID-19 pandemic has further exacerbated that burden.
The availability of portable devices as point-of-care (POC) for on-site monitoring has fueled the adoption of out-of-center diagnostics [
2,
3,
4]. The perceived benefits of such home tests are time efficiency, resources, and low costs, which make them a particularly attractive health services for daily home testing, as well as for high-throughput screening of developing countries’ populations with limited access to fully equipped laboratories. Home-based POC diagnostics could not only save valuable time for patients and health care systems, but also protect patients from the risk of inadequate treatment. For this reason, new devices that enable chronic disease patients to monitor and report results to healthcare professionals continue to be developed and adopted by healthcare consumers.
According to a recent report, “The global POC diagnostics market is expected to reach USD 72.0 billion by 2027 from an estimated USD 43.2 billion in 2022, at a CAGR of 10.8% from 2022 to 2027” [
5]. The current POC market is dominated by glucose, cardiac, and pregnancy testing, and represents a very rapid-growing segment of a worldwide clinical diagnostic market. The COVID-19 outbreak has further accelerated the global demand for diagnostic kits to rapidly detect the disease [
6,
7,
8]. In recent years, the design of hematological indices in patients under home care has gained momentum. Actually, complete blood counts (CBC) can include many hematological indices, such as mean corpuscular hemoglobin (MCH), lymphocytes (LYM), hematocrit, mean corpuscular hemoglobin concentration (MCHC), hemoglobin (HB), red blood cells (RBC) and subsets, immature granulocytes, immature platelet fraction, and reticulocyte hemoglobin, among others. While conventional methods entail time-consuming and costly laboratory tests and necessitate accompanying the patient to the laboratory for analysis, the latest requirements for home care involve the use of POC diagnostics to evaluate hematological indices through fast, cheap, and disposable tests. These technologies could bring diagnostics to bedside and home testing, minimizing the workload in centralized laboratories. POCs blood tests typically performed during the treatment of diverse diseases are intended for main targets as hemoglobin, leukocytes, hematocrit, and platelet, among others. However, complete blood count (CBC) analysis was not available as a POC test until recently. The newly FDA-approved HemoScreen [
9] could fill this gap, being a central example of a small, easy-to-use device that uses disposable cartridges [
10]. However, HemoScreen entails laboratory setup instrumentations and is not suitable for home testing.
The following section reports the POC diagnostics available in the literature for the detection of such blood indices, with their pros and cons and integration into telemedicine.
2. Point-of-Care Diagnostics for CBC Detection
2.1. Point-of-Care Diagnostics for Hemoglobin
Hemoglobin (Hb) monitoring in patients undergoing home therapies is fundamental to increase overall quality of life and to prevent pathologies such as anemia, which may further exacerbate the overall clinical situation. To date, most of the POC solutions available in the literature and on the market aim to quantify hemoglobin in its glycated form [
11,
12,
13,
14,
15] as a novel tool for diabetes early monitoring in a home setting. The gold standard for Hb quantification in patients is based on diverse methods, such as visual methods (Sahli’s, Dare, Haden, Wintrobe, Tallqvist), spectrophotometric methods (oxyhemoglobin, cyanmethemoglobin, gasometric, automated hemoglobinometry), or other methods (Alkaline-hematin, specific gravity, Lovibond comparator, copper-sulfate, HemoCue and automated hematology analyzers) [
16]. These methods, each with its own operating principles, need for a significant amount of blood drawn from the patient and require specialized personnel and high-end instrumentations to be performed.
The escalation of the COVID-19 pandemic has made such a testing approach impractical, because it requires frequent visits to hospitals or other highly specialized testing facilities. Therefore, with a view to increased home care, novel tools for Hb monitoring that can be used by patients themselves with minimal or no invasive sampling have become very demanding. To this aim, Singh et al. [
17] developed an innovative method for spectrophotometric quantification of Hb, which led to an easy implementation in POC devices: a complex matrix was produced employing carbon dots, Nafion and reduced methylene blue, the latter being colorless in reduced form and bright blue in oxidized form. The matrix has a specific redox reaction with Hb present in blood, causing an overall color shift of the solution, which can be quantified using UV–VIS spectroscopy. After the optimization of carbon dots size and exiting light wavelength, the authors assembled a prototype device capable of quantifying Hb in 15 µL of sample, with a limit of detection (LOD) of 1.2 mM and a linear range from 2.4 to 11.2 mM.
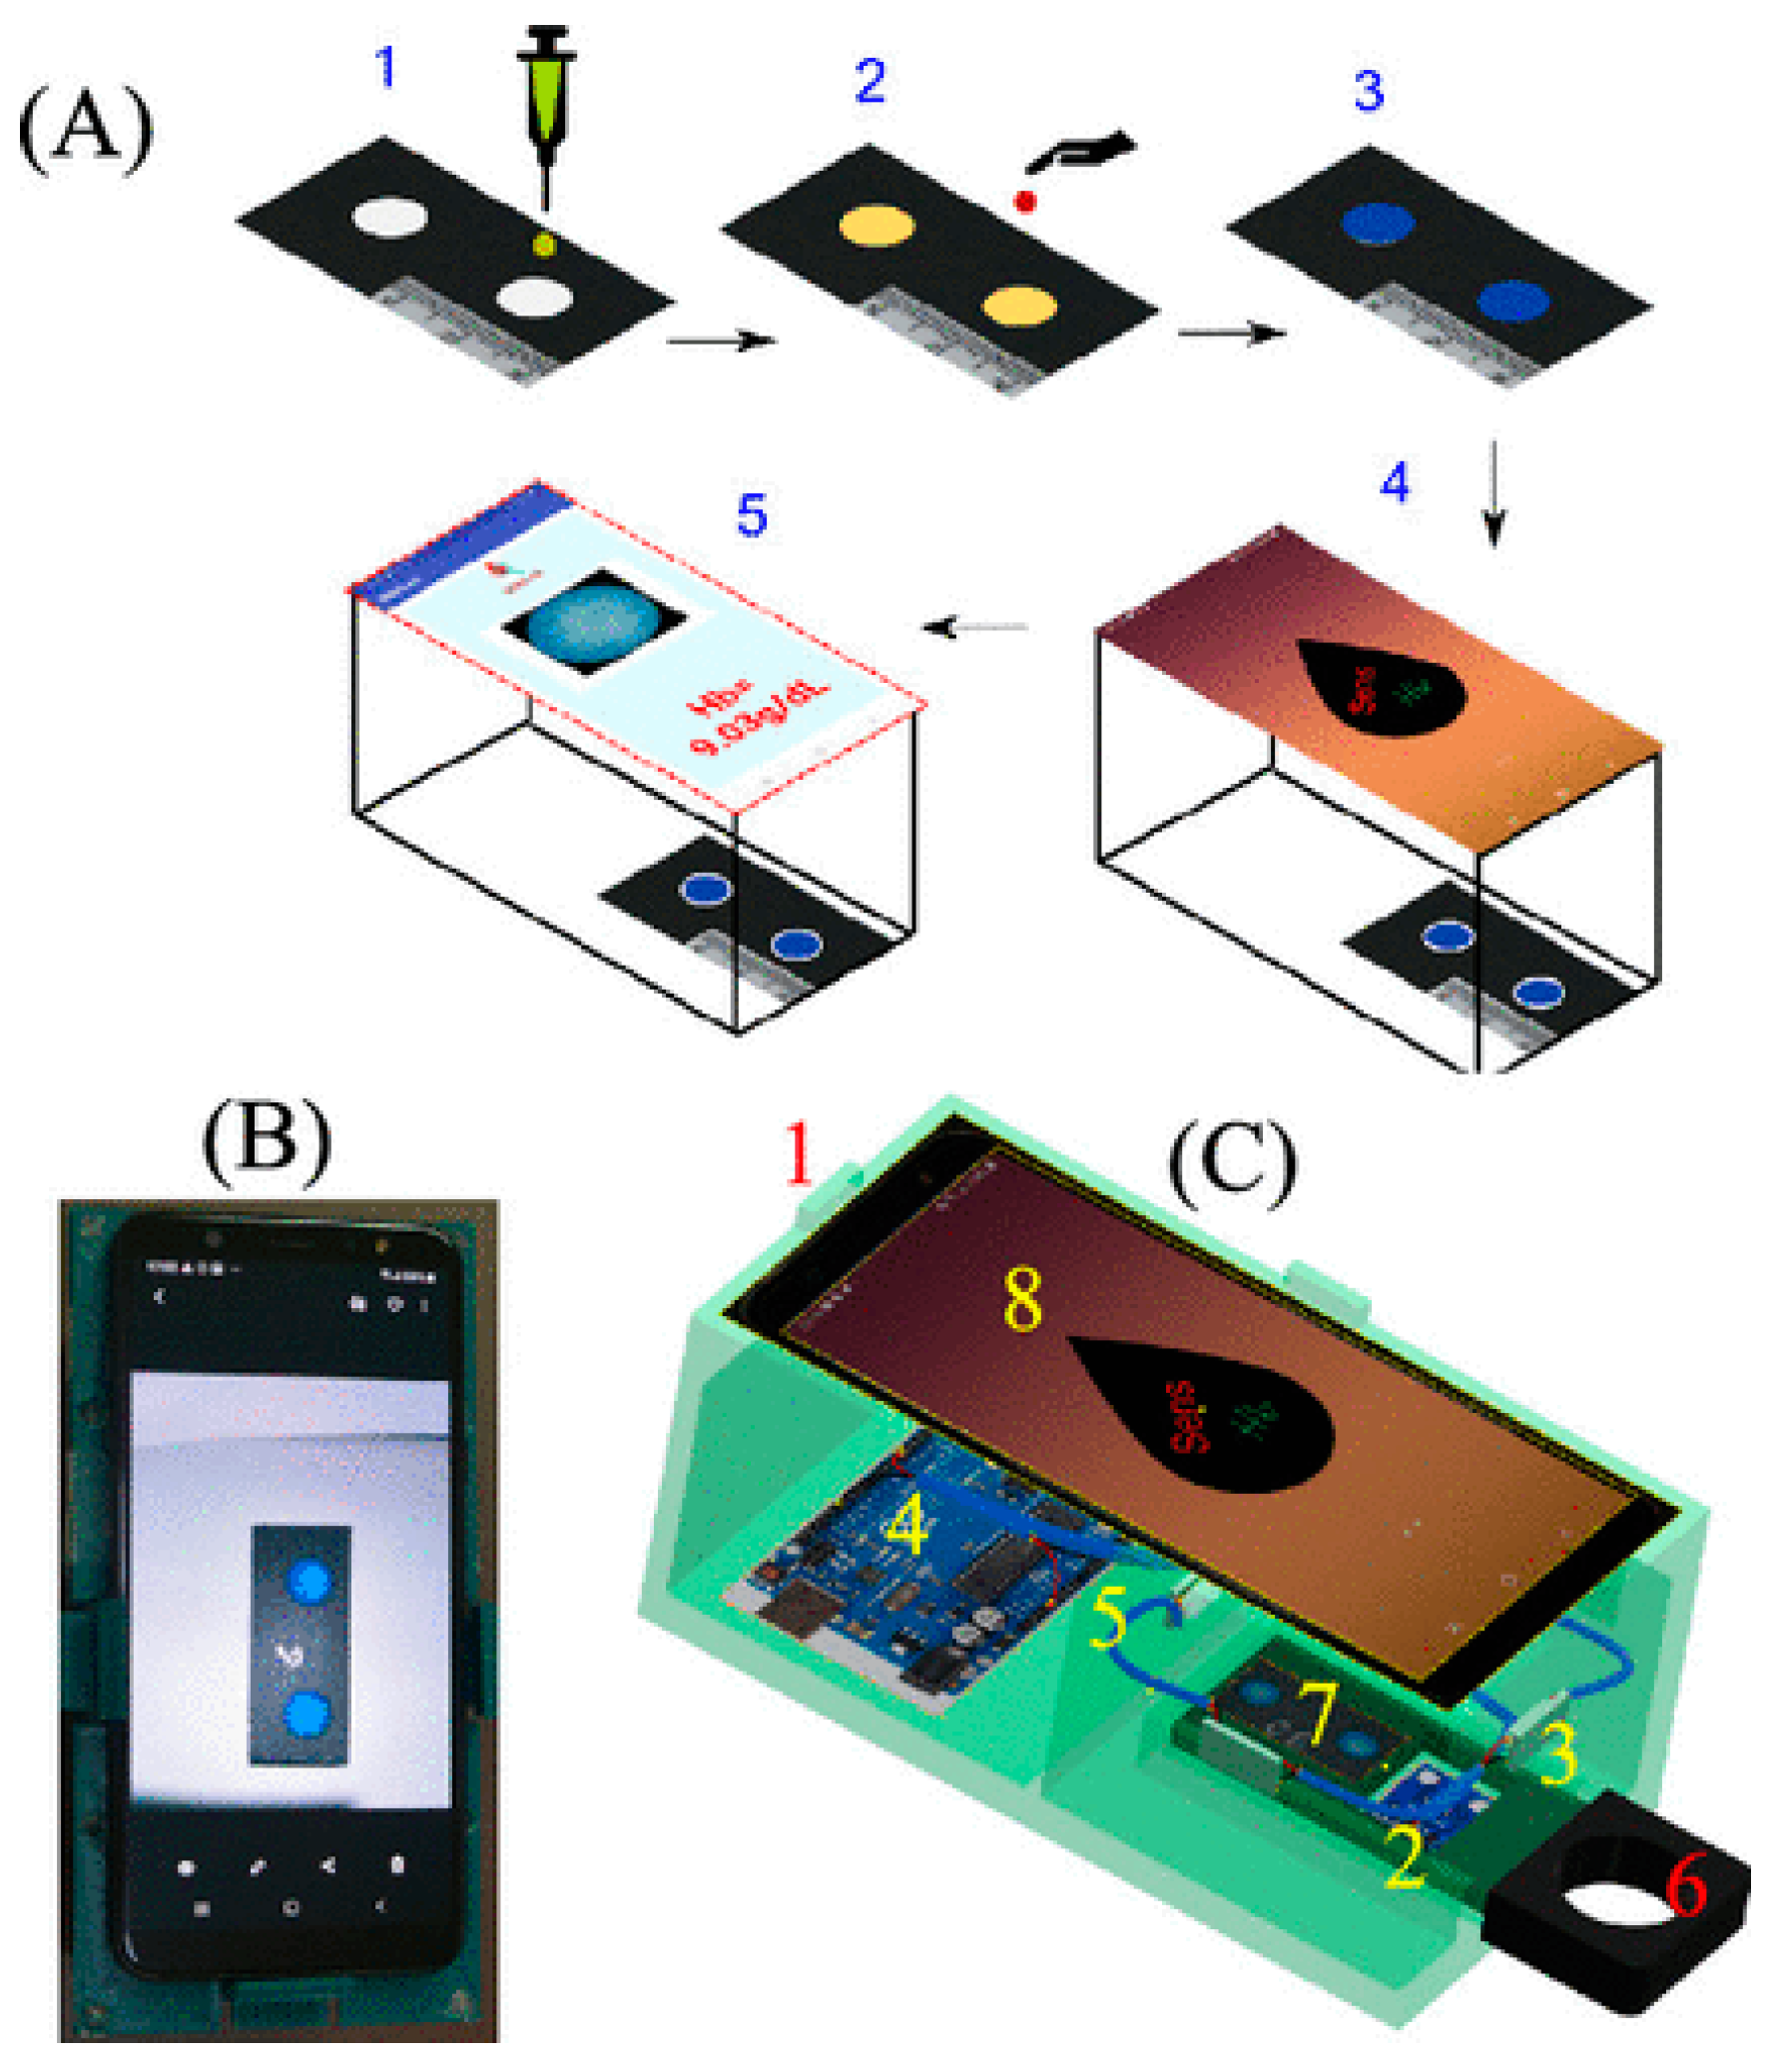
A similar principle was developed by Biswas et al. [
18]. In this case, 10 µL of blood, obtained by finger pinprick, are mixed with Drabkin’s solution and are then deposited on a cartridge pre-modified with o-tolidine. Hb in blood catalyzes the reaction between Drabkin’s solution and o-tolidine, causing the formation of a greenish-blue product (
Figure 1). The color is captured using a standard smartphone camera and is processed by an Android app (named “Sens-Hb”), which analyzes the RGB components of the picture taken and extrapolates the Hb amount in the blood sample. The system was reported to have a very low cost (≈0.02 USD/test), fast response time (total analysis time of 5 min), and a LOD of 2.5 g dL
−1, with linear response up to 20 g dL
−1.
Anemia and hemoglobin variant testing together have also become possible due to the system described by An et al. [
19], which assembled a system capable of both quantifying the Hb concentration in blood and discriminating between different forms of Hb to identify patients having genetic variants that may lead to sickle cell disease. The system needs 25 µL of blood sample and employs a cartridge in which blood components are electrophoretically separated. The colored bands resulting from the electrophoretic separation are analyzed by a trained artificial neural network, which in a total time of 8 min, extrapolates the Hb amount and forms present in the blood sample. The developed instrument has a linear response range for Hb concentrations from 6.0 to 15.3 g dL
−1 and a high Pearson correlation coefficient (PCC) of 0.95,
p < 0.001 compared with the CBC official methodology.
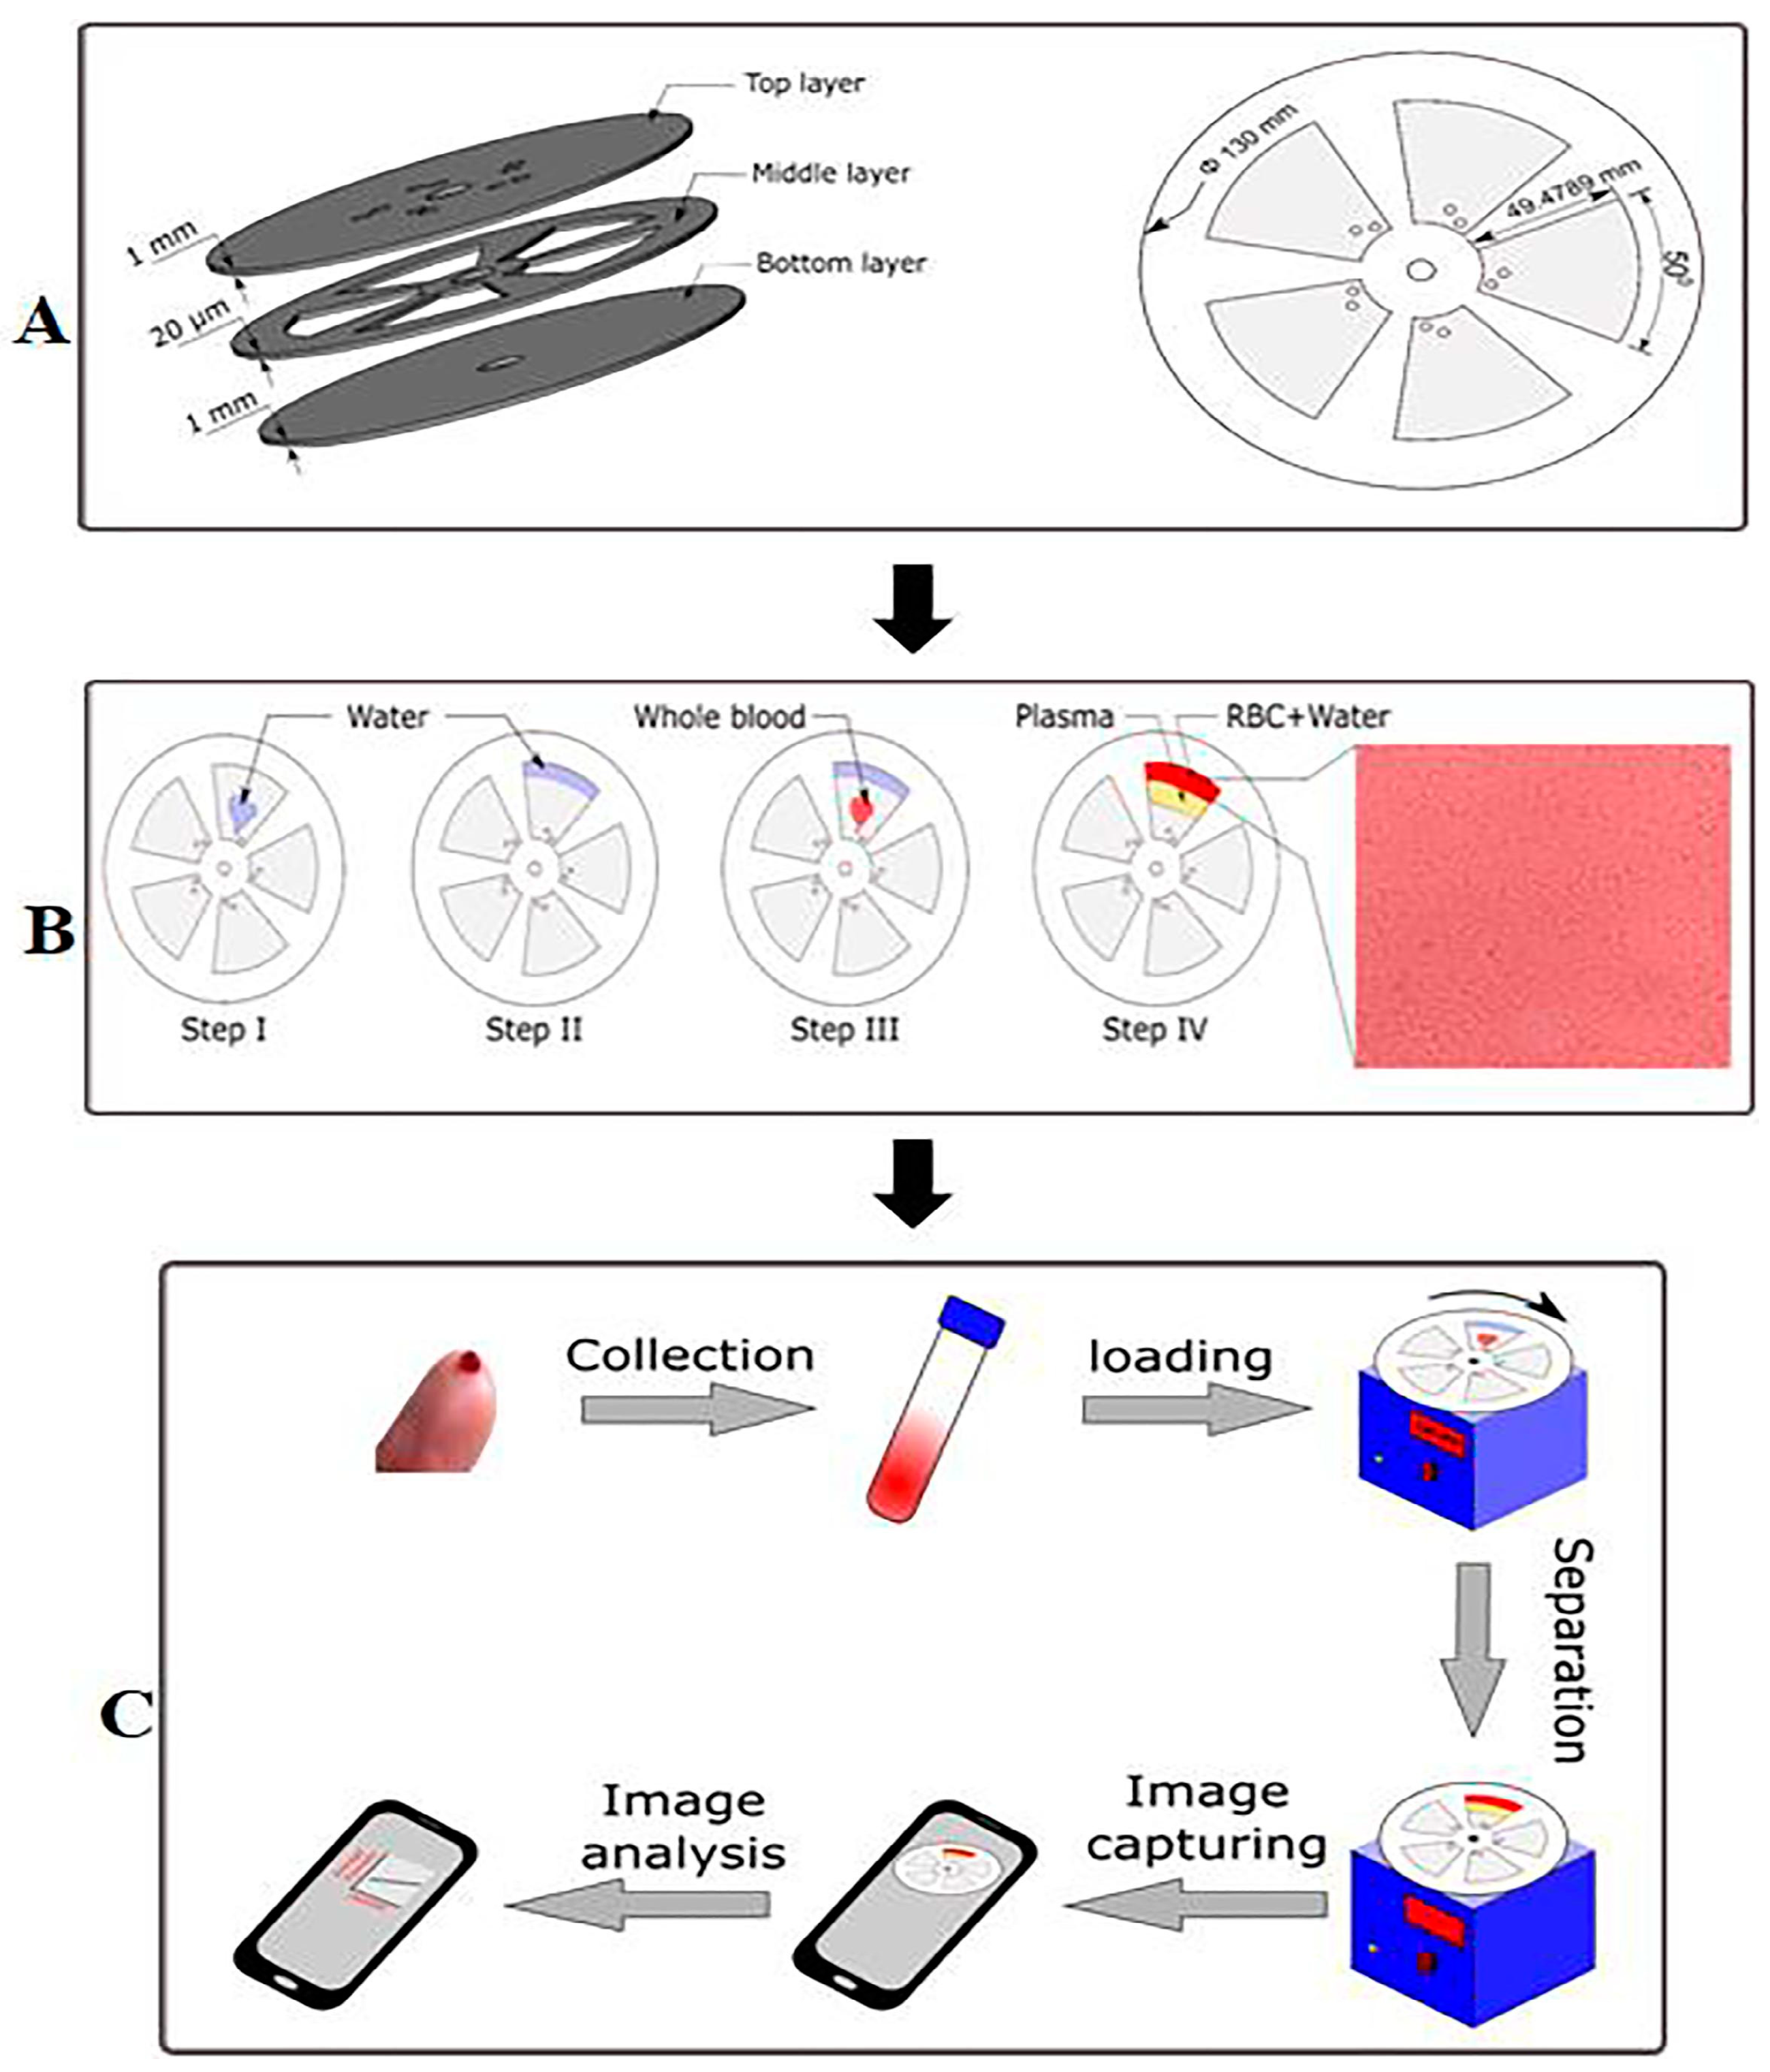
An interesting, reagent-free tool for Hb quantification was proposed in the work of Chattopadhyay et al. [
20]. Here, Hb separation from whole blood is obtained by applying the principles of osmotic lysis and centrifugal separation. In the study, a disk composed of three thin plates and integrating a microfluidic system is described. The disk is divided into sections, each filled with deionized water. A blood sample of 10 µL is collected and added with anticoagulant agent (to prevent occlusion of the microfluidic system) and inserted into the disk (
Figure 2). Here, the difference in osmosis forces between blood and deionized water causes hemolysis of the erythrocytes. The disk is then subjected to spinning, making a colored band appear in the external part of the disk, due to hemoglobin accumulation. A picture is taken of the disk after spinning using a common cellphone camera, and the color of the external band is converted to numerical values using an ad hoc developed app, which compared to a calibration curve, gives the hemoglobin concentration. The resulting instrument is reported to have a linear response in the range from 1 to 17 g/dL and is in good agreement with the reference CBC official methodology.
2.2. Point-of-Care Diagnostics for Leukocytes
As important immune cells in the human body, white blood cells play a very significant role in the auxiliary diagnosis of many major diseases. Variations of white blood cells number and morphology are predictive of important and serious diseases, with cancer as a crucial example. In the latter case, neutrophil numbers in the blood are markedly abnormal or show signs of immaturity, requiring further blood cell and/or bone marrow examinations. As an example, in patients diagnosed with acute myeloid leukemia, an increase in the number of circulating immature cells in the bone marrow as well as in the proportion of immature cells (i.e., myeloblasts) occur during treatment. For this reason, it is essential to monitor leukocytes during oncological therapies, as they can alter the patient’s physiological state, including the number of lymphocytes and neutrophils. Current methods to measure white blood cells and neutrophil counts, including flow cytometry analysis with laser scattering or impedance detection, scattering of single cells or manual microscopy counts among others, are difficult to perform at the point of care, being cost or labor prohibitive. Trying to overcome this drawback, Majors and colleagues [
21] developed an imaging-based system to measure white blood cell and neutrophil counts from a drop of blood called LeukoScope. This device was exploited for the analysis of 136 pediatric subjects at a central hospital in Malawi, with good accuracy on 95.4, 66.7, and 80.0% of samples with normal, low, and high white blood cells counts, and 88.6, 100.0, and 89.3% of samples with normal, low, and high neutrophil counts, respectively. These results highlight that the LeukoScope can help meet the need for POC diagnostics in pediatric patients. However, this instrument, although considered portable by the authors, still has a laboratory setup not suitable for home analysis.
An alternative way of counting the number of blood neutrophils was proposed by Venge and colleagues [
22], which described the development of a novel technology for the accurate, rapid, and simplified counting of neutrophils numbers by means of the measurements of one of the major granule constituents in extracted whole blood, myeloperoxidase (MPO). MPO is produced in the bone marrow through the very early stages of development of neutrophils, i.e., myeloblasts. In addition, the concurrent analysis of lactoferrin (LF) in whole blood extracts and the formation of a ratio of MPO to LF could reflect circulating myeloid cell maturity and/or bone marrow activity, since LF is formed in the bone marrow during the later stages of the development of neutrophils, i.e., myelocytes [
23]. Due to these results, new rapid and simple point-of-care analytical tools could benefit from this technology, especially when neutrophil counts are associated with inflammatory diseases and blood disorders. To this aim, Barroso et al. [
24] exploited the scattering properties of whole blood to determine correlations with red blood cell (RBC) and white blood cell (WBC) counts. In particular, the scattering correction coefficients of visible–nearinfrared (Vis-NIR) of 320–850 nm dog blood absorption spectra were observed to obtain direct correlations of RBC and WBC counts using multivariate linear regression (MLR). This approach allowed for the discrimination of high and low values of both RBC and WBC and their quantification. In detail, a correlation of 0.5739 and a standard error of 1.33 log10 (cells/L) was obtained for RBC, with a correlation of 0.5900 and a standard error of 7.70 log10 (cells/L) for WBC.
In this scenario, it is evident that such systems cannot be considered for point-of-care testing, as they still entail laboratory setup instrumentations and skilled personnel. Despite the efforts made and the new technologies developed, research is still very far from developing POC tests that can be used by patients undergoing home therapy and who need portable, fast and affordable devices to effectively follow variations in leukocyte indices due to diverse therapy. This can be due to several reasons, including the need to process the blood sample before testing. Further research in microfluidics could help overcome this drawback and could enable the design of POC devices for leukocyte analysis, through the use of functional materials (e.g., paper) that allow for separation of blood components without slow and time-consuming pretreatment procedures.
2.3. Point-of-Care Diagnostics for Hematocrit
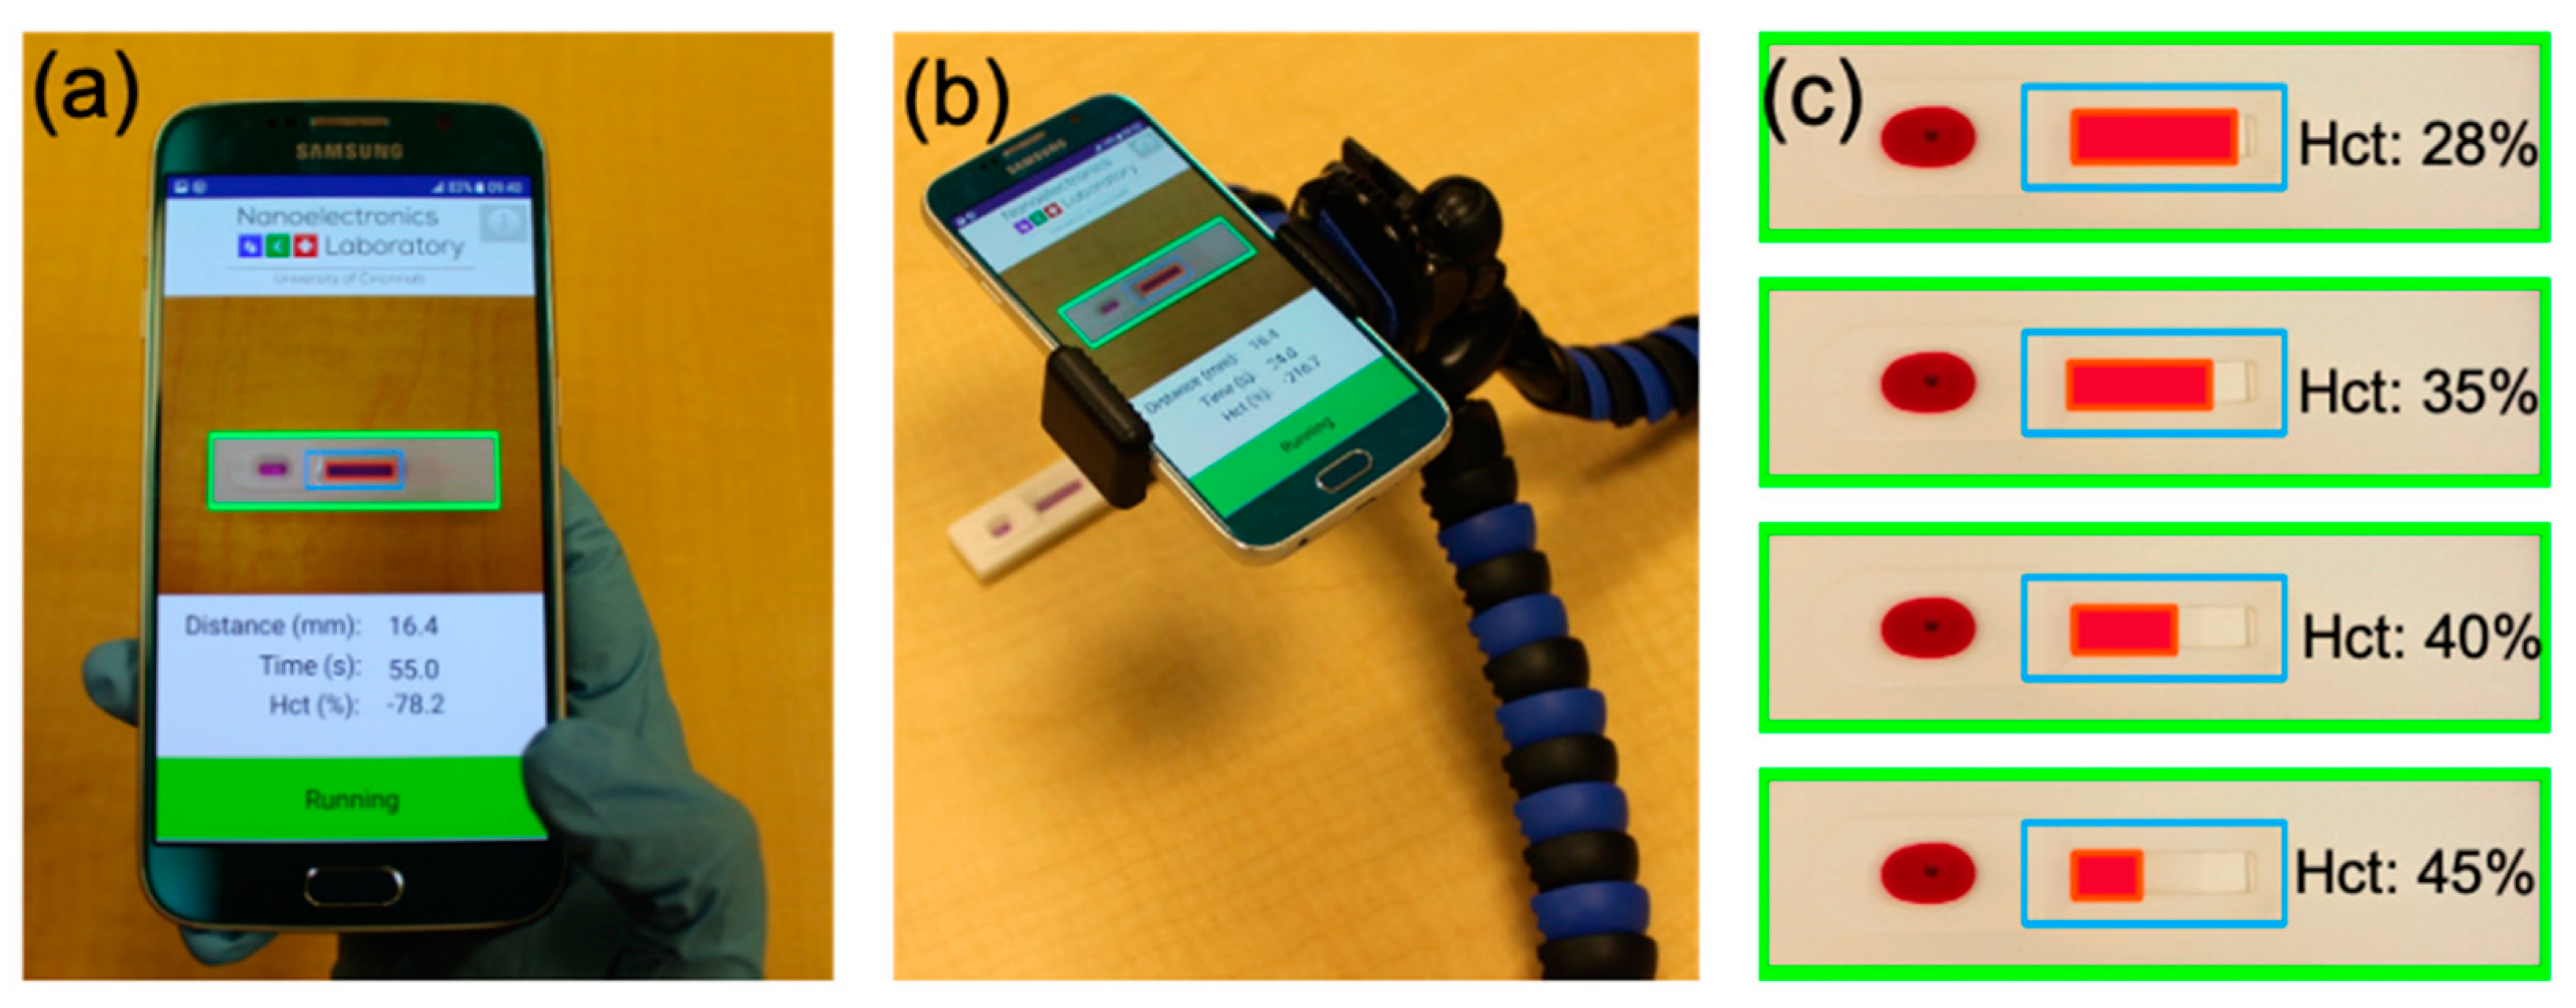
Counting blood hematocrit numbers is one of the most common laboratory tests in modern clinical medicine. The hematocrit (Hct), together with the deformability of red blood cells, are the main determinants of the viscosity of whole blood, the alteration of which can be caused by home anticancer therapies that cause related cardiovascular diseases. For this reason, daily hematocrit analysis is crucial to prevent such problems. Frantz et al. [
25] presented a rapid POC system based on a smartphone application capable of accurately tracking red blood cell (RBC) flow through a no-reaction lateral flow (nrLFA) assay (
Figure 3). Using the smartphone camera, RBC flow is recorded without the need for hardware, and hematocrit is calculated measuring the blood flow distance and time as soon as it is detected in the observation window. This POC system was able to accurately measure (within 1% Hct of nominal values) whole blood Hct in ~10–20 s after sample dispensing.
Hematocrit analysis revealed to be crucial to tackle inaccuracies in glucose measurement, as described by Rao and co-workers [
26], who evaluated the accuracy of a glucometer capable of simultaneous measurement of patient’s hematocrit with algorithmic adjustment of glucose results. Venous whole blood samples from healthy volunteers were pooled and reconstituted to produce five different hematocrit (30–60%) concentrations. Each hematocrit specimen was spiked to obtain four glucose concentrations (50–500 mg/dL). This system exhibited good correlation (r = 0.998) with a slope of 0.989 and intercept of 0.827, displaying good agreement with reference methods and existing parameters present on the market, i.e., YSI 2300 whole blood/plasma analyzer (Yellow Springs Instruments, Yellow Springs, OH, USA). Moreover, this system was able not only to measure the hematocrit but also to provide automated correction for the hematocrit effect, thus eliminating the need for a separate hematocrit measurement and saving time.
2.4. Point-of-Care Diagnostics for Platelet
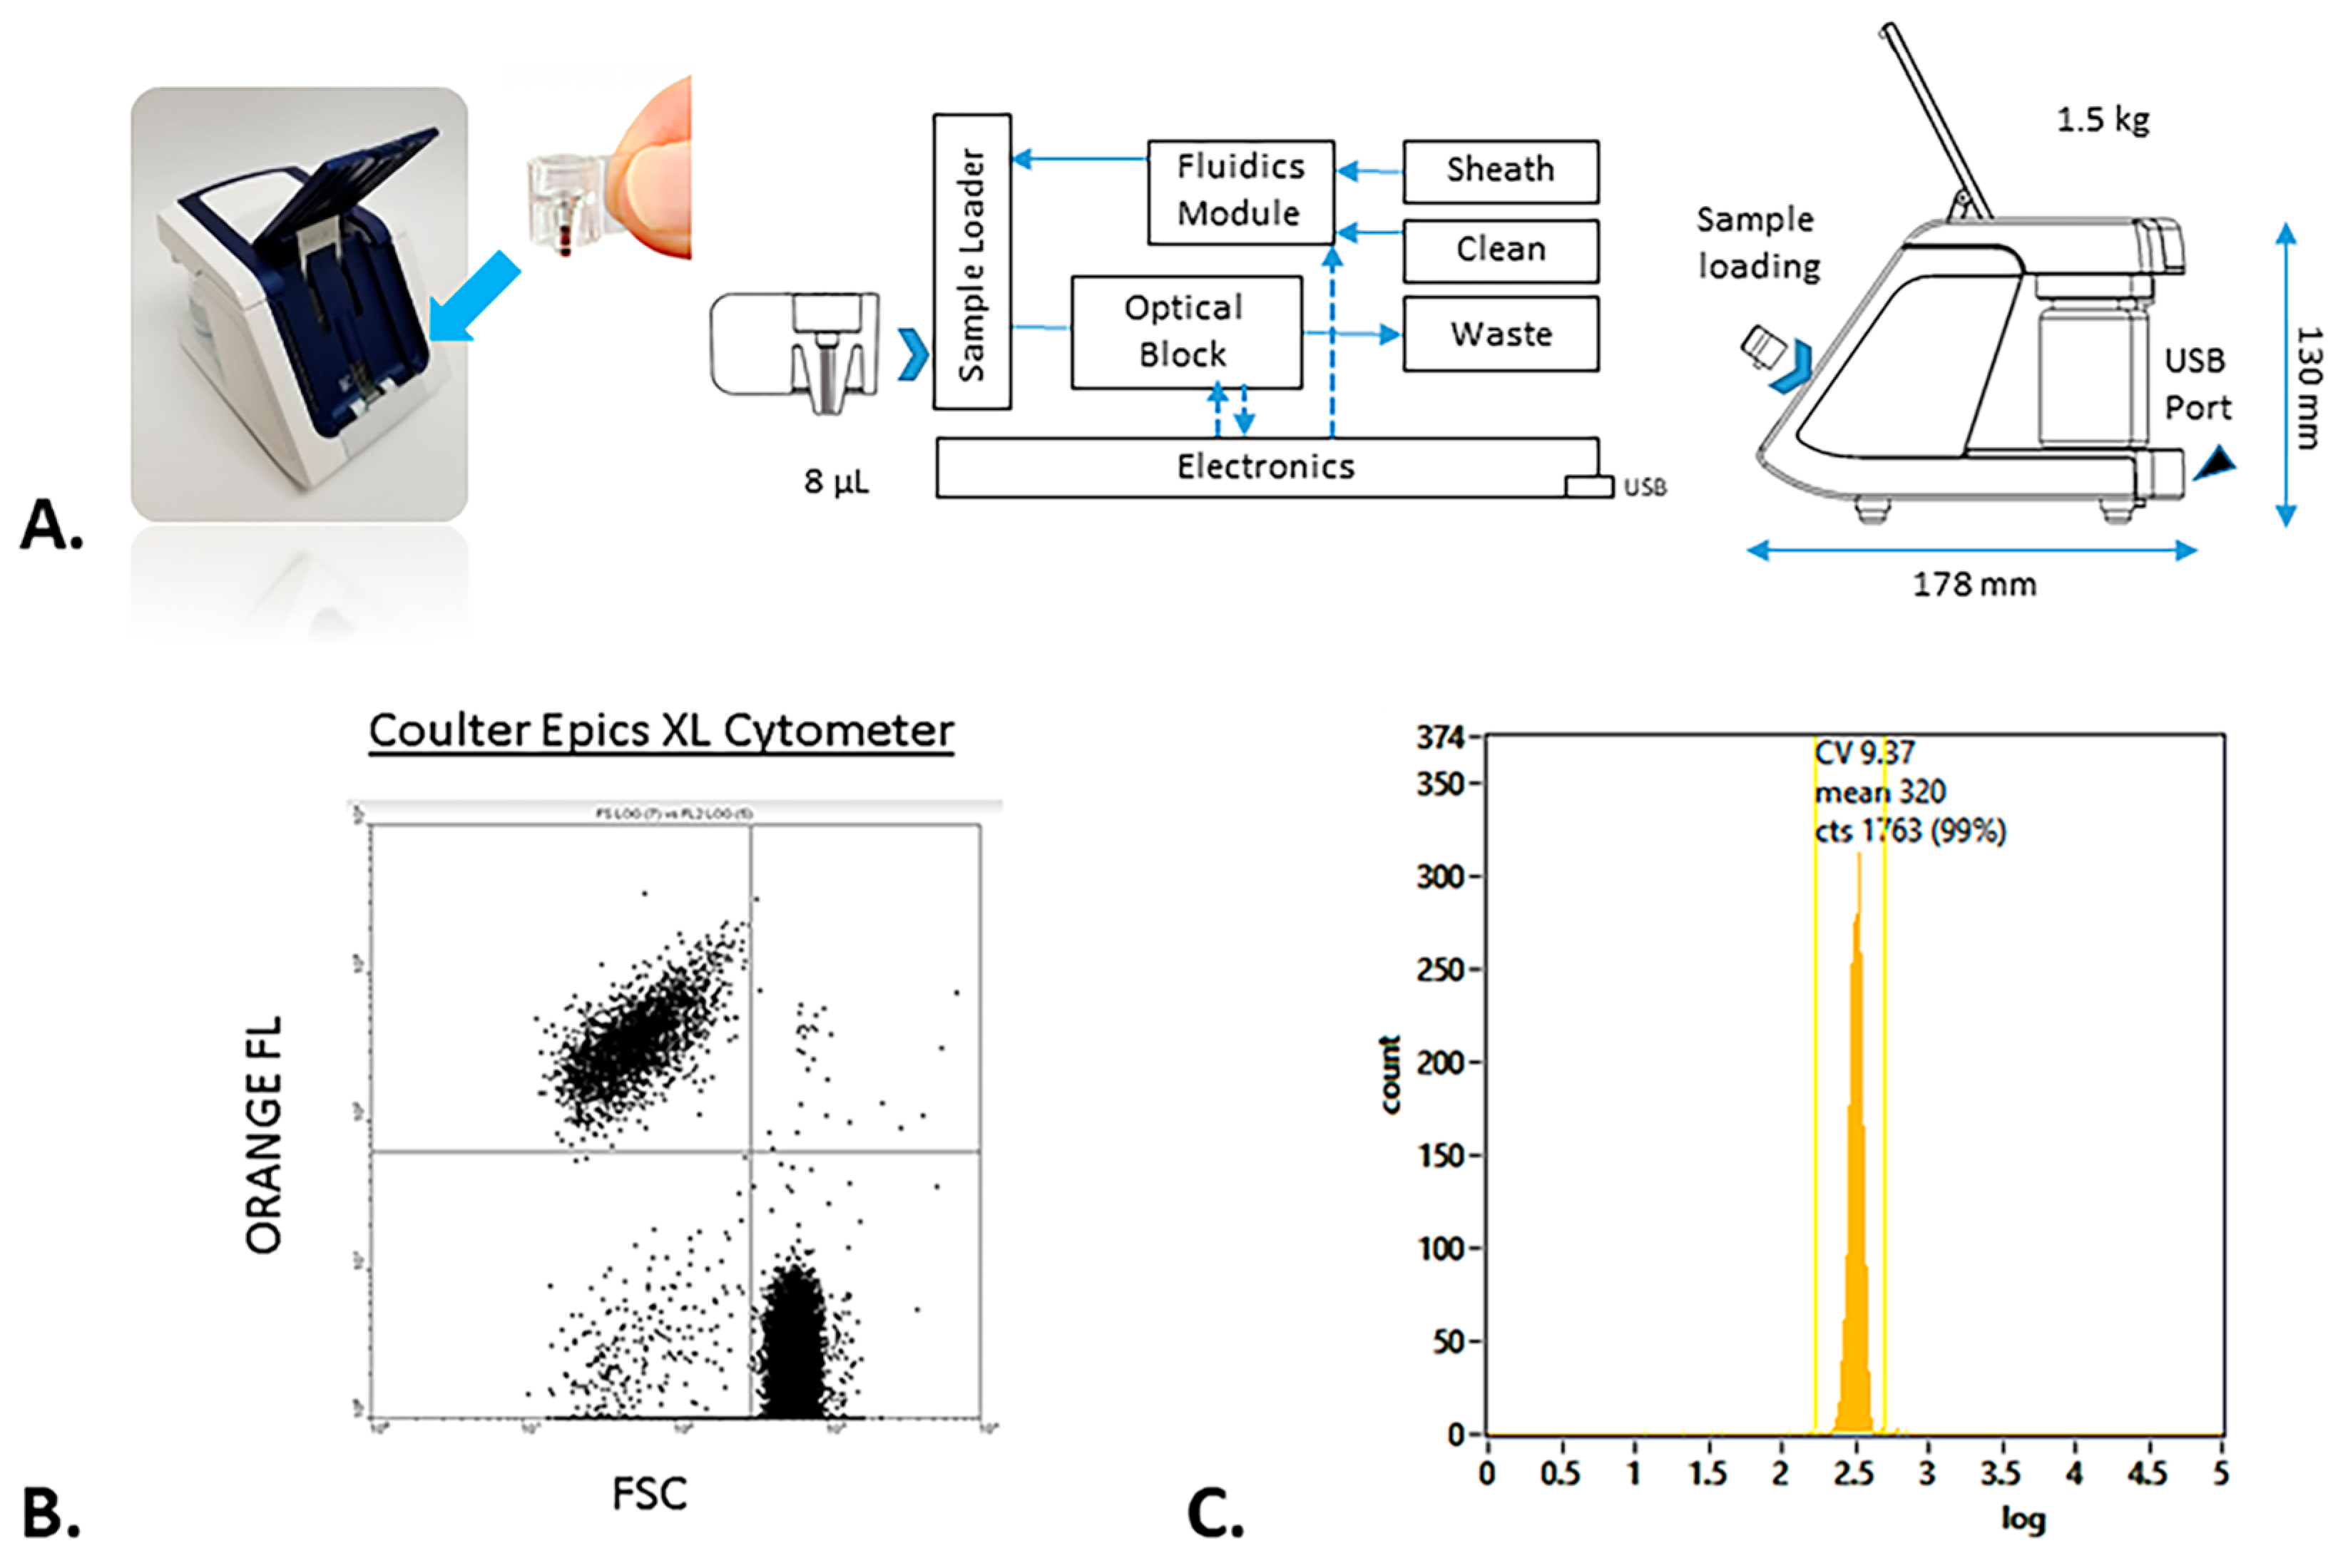
Complete blood counts, blood film examination, and aggregation are the tests most commonly used to quantify platelets and to determine whether there is thrombocytopenia and/or defective platelet function due to various causes. Conventional assays, with the light transmission aggregometry as the gold standard, are typically not bedside, with detection methods varying from optical to mechanical and electrical transduction. POC testing of platelet count provides real-time data for rapid decision making in many diseases, especially in the case of home cancer treatment. A number of POC platelet function tests have been developed in recent years with different configurations. Several microfluidic devices for whole blood analysis have been also developed, utilizing varied geometries and wetted materials for different purposes. As an example, Dickerson et al. [
27] evaluated the accuracy and precision of platelet counting using a new cytometry-based blood analyzer, the rHEALTH ONE (rHEALTH) (
Figure 4). This system showed a correlation between capillary and venous blood samples with a slope of 0.9514 and an R
2 of 0.9684. Moreover, a precision was achieved ranging from 3.1 to 8.0%, in comparison with the International Society of Laboratory Hematology (ISLH) method based on a cytometer/impedance analyzer, which provides a precision of 1.0–10.5%.
Several paper-based microfluidic devices have been also realized for coagulation screening, due to the low cost, hydrophilicity, and ubiquity of paper that is a frontline-used substrate for microfluidics [
28]. Li and co-workers [
29] described a simple approach for evaluating blood coagulation, developing a microfluidic paper-based lateral flow (LFA) assay for POC self-monitoring screening. This system, based on Millipore C048 cellulose paper, was able to analyze whole blood without any sample pretreatment for the separation of plasma from red blood cells. Blood samples were distributed onto the paper LFA device consisting of a sample pad, an analytical membrane, and a wicking pad. The aqueous component of the plasma is separated from the large blood cells due to the porous nature of the cellulose membrane. As the blood viscosity changes with its ability to clot, the distance RCBs travel in the membrane in a given time may be related to the clotting time of the blood. This distance was found to linearly decrease with a travel rate decreasing from 3.25 to 2.2 mm min
−1. Compared to conventional plasma clotting analyzers, the described LFA device proved to be much simpler and able to provide a significantly larger linear range of measurement.
3. Sample Pretreatment
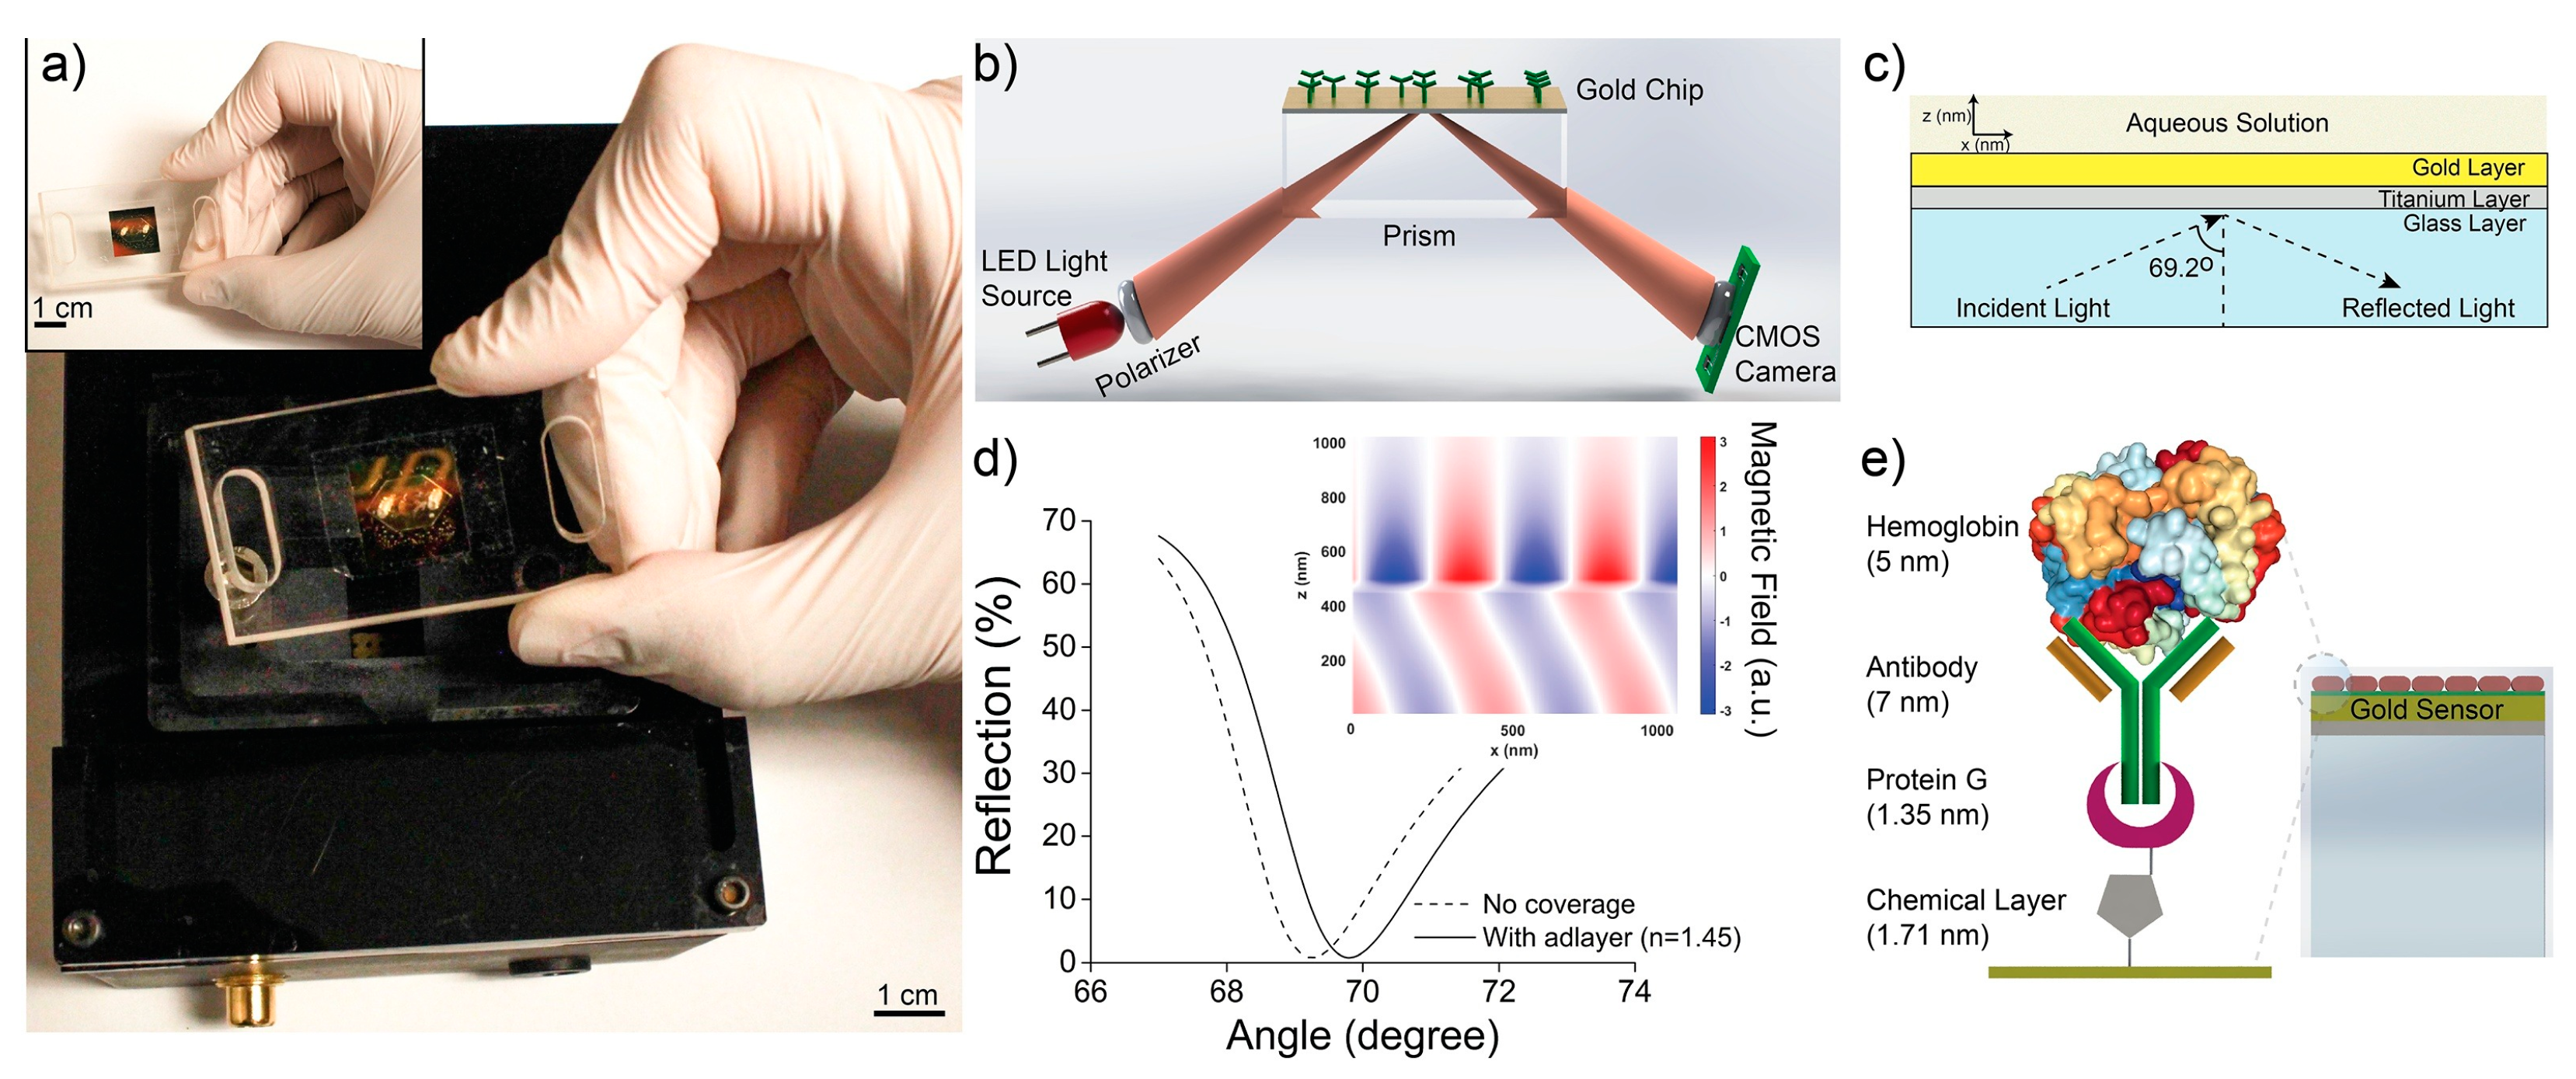
Sample pretreatment is a crucial procedure in many biomedical tests for further analysis of blood counts, as this step can efficiently increase the detection limit. With the aim of improving the performance of a biosensor, it is necessary to consider many concerns related to real samples (e.g., blood, serum and plasma), being factors that hinder an efficient analysis of complex matrices, among which the matrix effect, cross-reactivity problems, and the presence of potential interference. Analytical instruments in laboratory settings address these concerns by providing sample pretreatment, with great influence on the quality and quantity of isolated component analysis. These processing methods entail sample collection, cell lysis, the use of anticoagulants (e.g., ethylenediaminetetraacetic acid (EDTA), heparin, citrate), components separation, and storing at various temperatures (4, 22, 37 °C). These procedures should be fast and automatable in the case of POC testing. To this aim, microfluidics demonstrated its capability to avoid sample pretreatment, as these systems are able to separate the blood components enabling the target analytes to reach the detection zone to be analyzed. This can be possible due to the availability of several functional materials (polydimethylsiloxane (PDMS), paper, or Teflon) as well as their modification approaches that can tune the physicochemical features of such materials, including chemical groups, surface charge, hydrophilicity/hydrophobicity, wet strength, and hydrophobic patterns/barriers. To report an example, Inci et al. [
30] developed a hand-held, disposable, easy-to-use microfluidic chip able to analyze hemoglobin without sample pretreatment or the introduction of additional reagents after the clinical specimen is loaded. This platform, made with diverse materials such as Pyrex, titanium, and plasmonic gold, consisted of (i) a 705 nm LED with proper lens and polarizer for illuminating the surface, (ii) a glass prism, (iii) a CMOS sensor for measuring the amount of reflection from the surface, and (iv) a TV card for the connection between the platform and computer interface (
Figure 5).
A different microfluidic device was described by Ulum et al. [
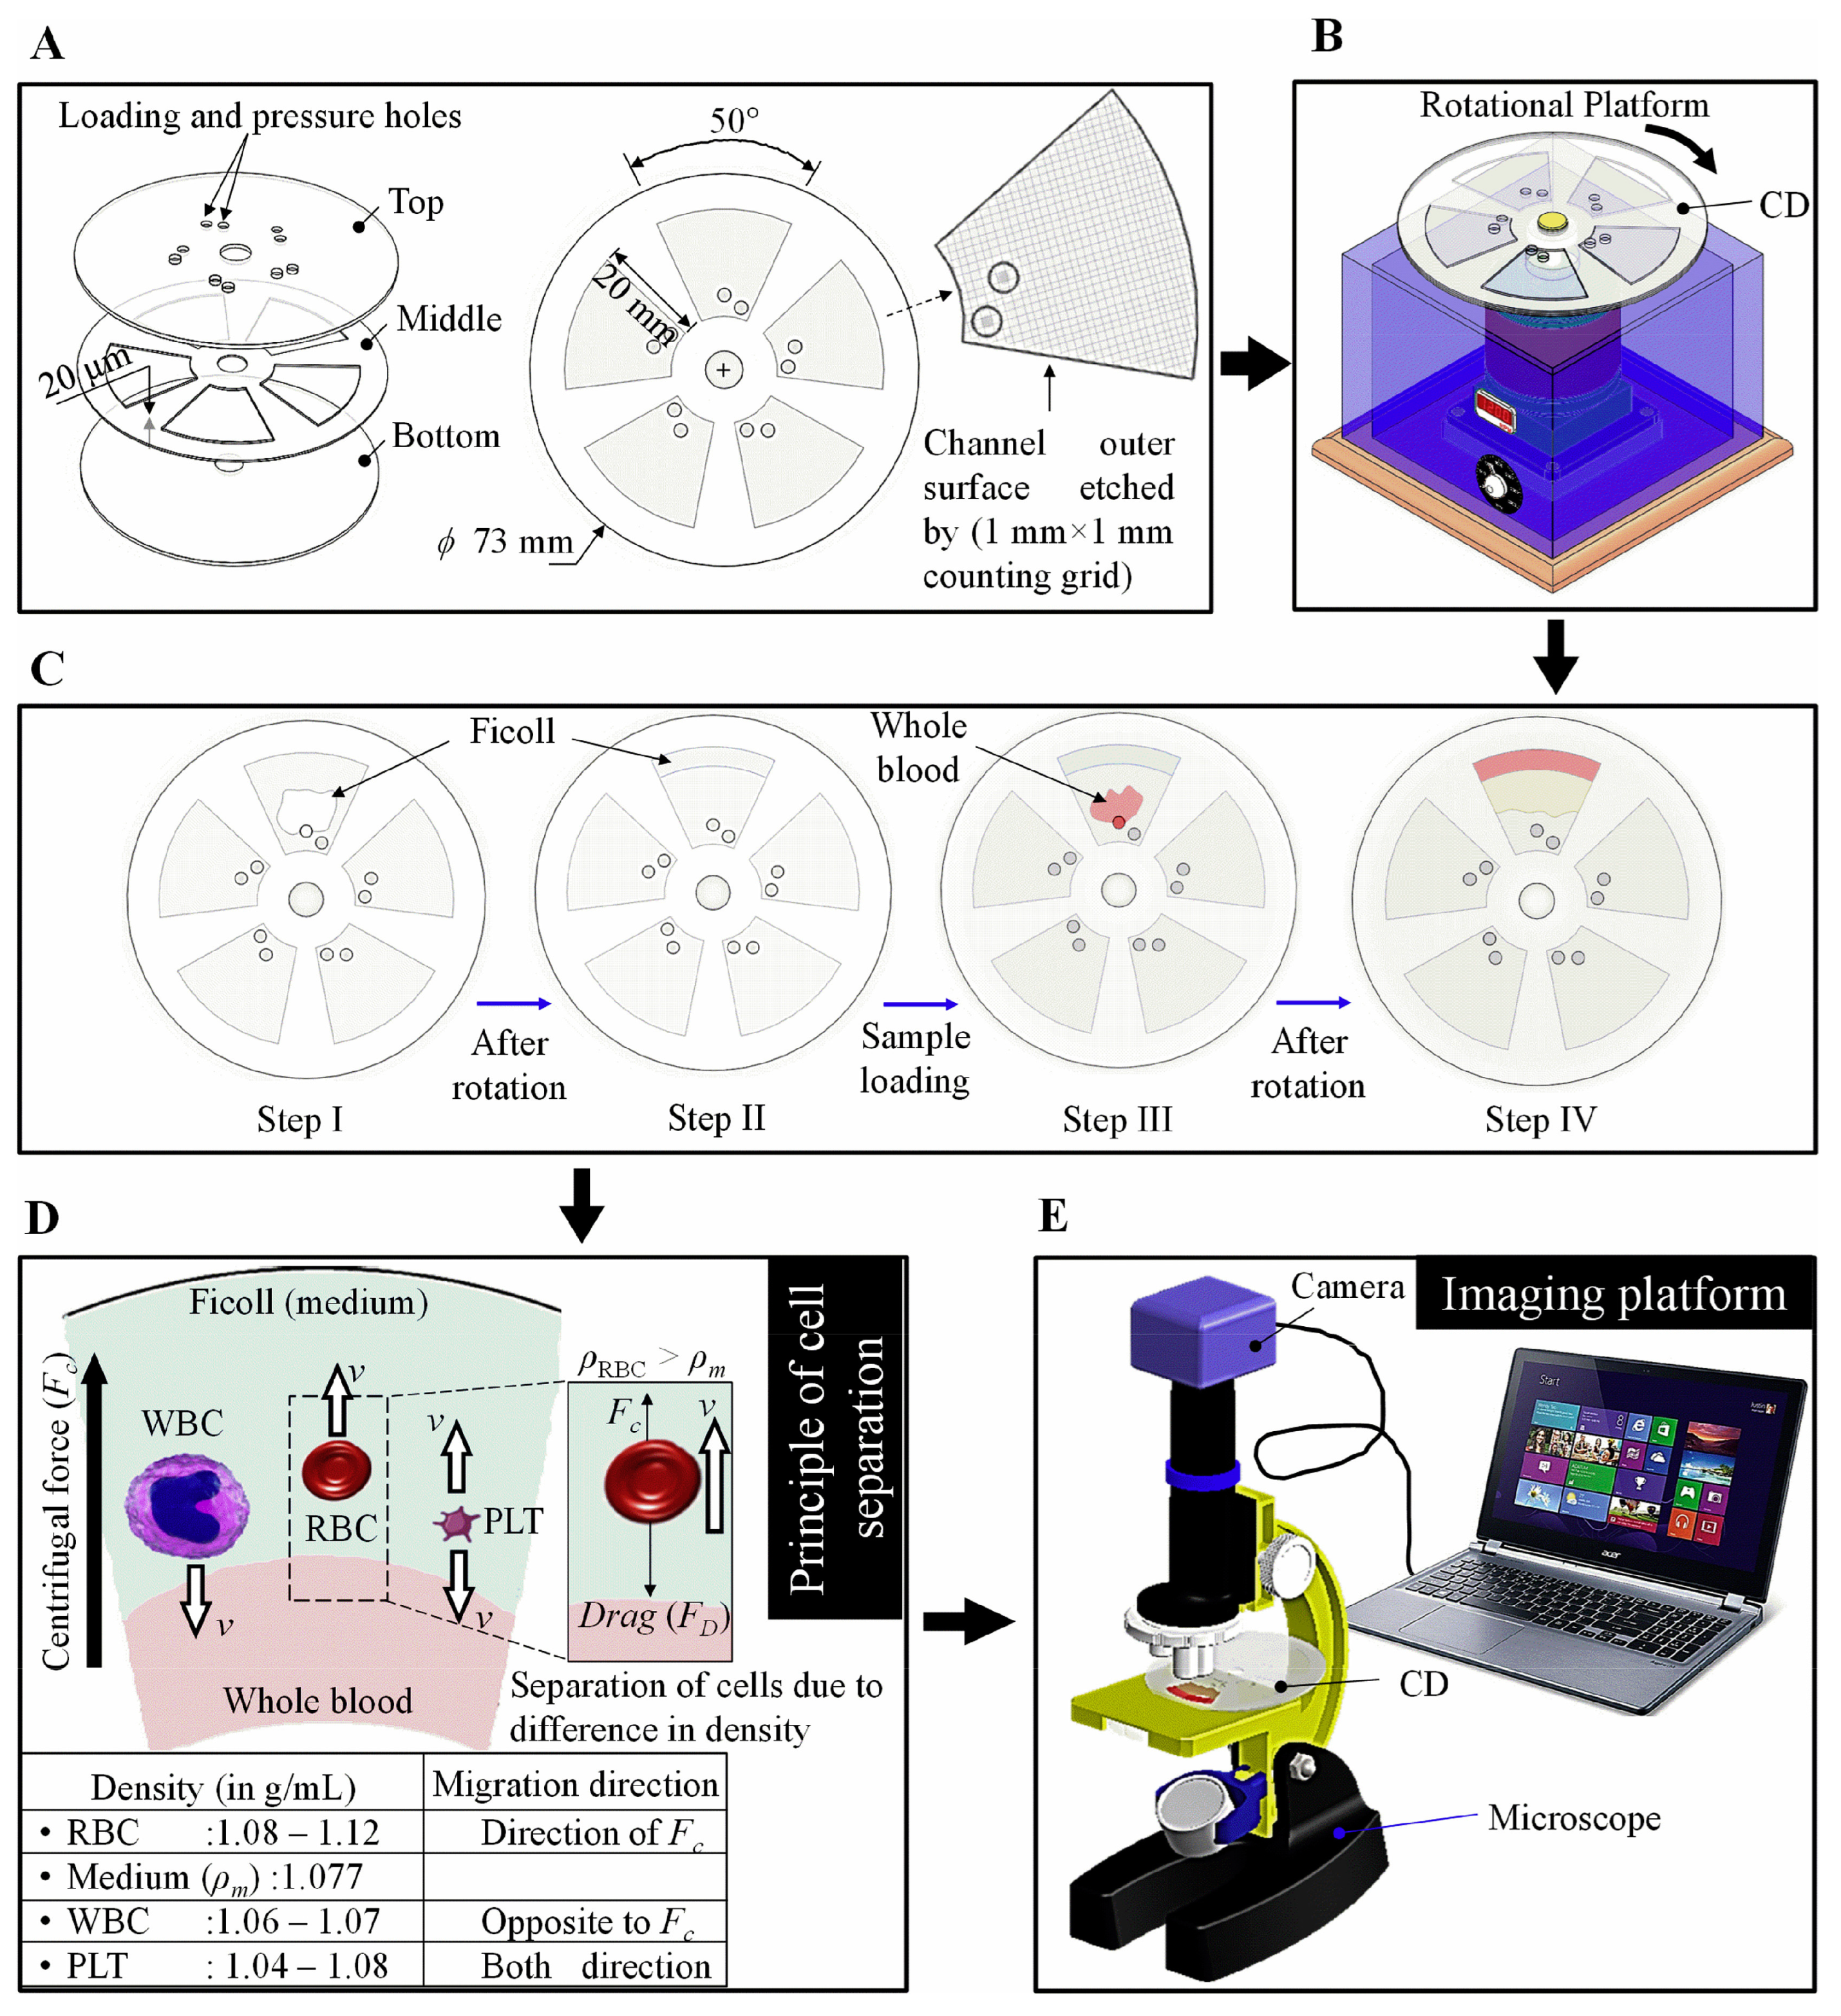
31] that introduced the use of cotton-thread treatment methods based on EDTA anticoagulant solution for wicking whole blood samples and separating its plasma. This study demonstrated that the deposition of EDTA anticoagulant followed by its drying on the thread at room temperature for 10 s could provide the longest blood wicking with gradual blood plasma separation. This separation occurred through the synergy of cotton fiber, EDTA anticoagulant, and blood platelets, which induce the formation of a fibrin filter via a partial coagulation process in the EDTA-treated microfluidic chip. More recently, Agarwal et al. [
32] projected a spinning disc to estimate the content of hematocrit, hemoglobin, RBC, WBC, and platelet with an accuracy of >95%, exploiting the difference in cell densities for their separation into the microfluidic channels (
Figure 6). This very simple system enabled multiple sample testing within a single biodegradable disc, eliminating the need for blood downstream processing.
4. Integration of Point-of-Care Diagnostics in Telemedicine
Telemedicine can be defined, according to the European Commission, as the provision of healthcare services, through the use of Information and Communication Technology (ICT), in situations where health professionals and the patient are not in the same location. It has become an increasingly valuable and viable method of health service delivery, communication, information transfer, and education. Especially after the COVID-19 emergency, there has been a widespread use of telemedicine for consultations and appointments with clinicians using ICT facilities. These facilities are officially included in many clinical workflow and standards. Particularly, there is a shift to oncologic workflow offering an amount of services in telemedicine (videoconference, teleconsultation, follow up visit, remote monitoring) [
33].
Another aspect of telemedicine that is becoming even more established is the integration of home patient monitoring in clinical workflow. Thus, telemedicine can include remote monitoring of parameters useful for follow up such as that from CBC. ICT and medical procedures are available for different homecare monitoring. However, very few examples are available for CBC analysis in oncology. This is because many disease therapies require rigorous measurement and documentations of patient status, and [
34] the ability of patient and the clinical reliability of self-reporting in this clinical field is still being debated.
As telemedicine platforms can already be implemented with patient-monitoring systems whose results can be used to intervene in therapy [
35], the integration with CBC is poor. In the clinical course of systemic cancer care, the therapies are decided from time to time on CBC evaluation, particularly on white cells or platelet count whose measurement is required before each administration. Auto-diagnosis at home using POC devices as the terminal of larger telemedicine systems is essential in the personalization and humanization of care for these frail patients that move periodically from home to the hospital for single administration. A search on Scopus or Google Scholar for “complete blood counts and telemedicine” reveals very few article in the field (February 2023). Few studies in the literature describe the design of analytical devices for the monitoring of hematological indices assisted by remote sensing [
36] or machine learning [
37], with future possible integration into telemedicine. However, such systems are not in the form of a POC device, and their real integration into telemedicine is at an early stage. On the other hand, such studies pave the way to a wider use of home screening systems for POC blood testing and telemedicine with lab-on-chip platforms. In this scenario, further research on new reliable, patient-oriented, and specific home care devices based on innovative technologies can solve this lack of solutions [
38]. This is because it is emerging that patient remote monitoring in oncology still requires the intervention of medical doctors and the carrying out of more reliable clinical investigations.
5. Commercial CBC Count at Home
CBC count devices for POC analysis are only recently gaining traction as market products. This may be correlated to different factors, because a simple blood test, which can be performed even in small testing labs, gives complete, precise and detailed results concerning blood composition, even regarding the different types of cells present (number of erythrocytes, number and type of leukocytes, platelets count and various minor compound presence and quantification).
Recently, with the rise of the COVID-19 pandemic, the necessity to minimize the crowding of people who, undergoing their therapies, may be in a state of weakened immune system, making them prone to severe COVID-19 forms, has emerged. On the other hand, treatment of several diseases, including cancer, often has a severely negative impact on bone marrow cell production, resulting in patients suffering from pathologies attributable to severe anemia, an overall weakened immune system, and reduced coagulation factors due to reduced amounts of platelets in the blood (thrombocytopenia). These two factors have pushed for the development of systems allowing patients under home care to monitor important parameters of their blood composition, such as hemoglobin concentration, number and type of leukocytes, platelets concentration, and so on.
POC instrumentation for the quantification of hemoglobin seems to be focused on two main methods of signal transduction: optical and electrochemical. Three out of the four systems reported in
Table 1 use optical transduction, however with significantly different signal processing. Two systems (HemoCue Hb 801 System and DiaSpect Tm) perform a direct spectroscopic quantification of the hemoglobin present in a blood sample, without the need for additional reagents. The third system (HemoScreen Hematology Analyzer) employs viscoelastic focusing on the blood sample to align all blood components on a single plane. Then, an image is captured and processed using machine vision algorithms, providing an accurate determination of various blood parameters, including hemoglobin concentration, which is calculated based on the optical density measured on individual intact cells.
This demonstrates that a number of instruments are reaching the market, but most of them are not yet in the form of a home test because they still do not own crucial features such as portability, simplicity, and accuracy for bedside analysis. Such systems have serious flaws in terms of speed, timeliness, communication of results, and cannot be handled by non-laboratory personnel, thus showing multiple challenges that constrain their market penetration. For these reasons, further research is required to provide vanguard technologies with increased innate robustness and better diagnostic performance to become benchmark products with a better probability of penetrating the market.
6. Conclusions and Future Perspectives
Through the technological advances of the last decade, the process of diagnosing hematological indices is gradually entering a new era in the field of diagnostic medicine. However, the current healthcare laboratory system and the resistance to the penetration of molecular diagnostics challenge the need for speed in diagnosis. In the context where the health of a patient in home care is highly dependent on obtaining a diagnostic response within 6 h, ideally less than 1 h, molecular diagnostic testing capability at the point of care is required. In this scenario, POC diagnostics are becoming a manifest reality due to timely results, ease of use, low cost, and portability, with an evident improvement in the health service. Although POC testing can be performed in specialized laboratories or in hospitals, many challenges still need to be overcome. Due to the convergence of crosscutting technologies such as nanotechnology, microfluidics, and materials science, we expect the obtainment of further knowledge for the design of real POC tests as well as their entrance into integrated disposable devices for bedside and home use to occur within a few years.
Author Contributions
Conceptualization, V.S.; writing—original draft preparation, V.S.; writing—review and editing, F.C., A.A., M.T.G., V.F. and F.P.T.; supervision, V.S.; project administration, V.S.; funding acquisition, V.S. All authors have read and agreed to the published version of the manuscript.
Funding
This work was supported by the Project POR FESR PdR Lazio E-CROME.
Institutional Review Board Statement
Not applicable.
Informed Consent Statement
Not applicable.
Data Availability Statement
As this is a review article, no data are present.
Conflicts of Interest
The authors declare no conflict of interest.
References
- World Health Organization (WHO). Latest Global Cancer Data. Available online: https://www.iarc.who.int/wp-content/uploads/2018/09/pr263_E.pdf (accessed on 1 March 2023).
- Harpaldas, H.; Arumugam, S.; Rodriguez, C.C.; Kumar, B.A.; Shi, V.; Sia, S.K. Point-of-care diagnostics: Recent developments in a pandemic age. Lab A Chip 2021, 21, 4517–4548. [Google Scholar] [CrossRef]
- Yang, S.M.; Lv, S.; Zhang, W.; Cui, Y. Microfluidic point-of-care (POC) devices in early diagnosis: A review of opportunities and challenges. Sensors 2022, 22, 1620. [Google Scholar] [CrossRef] [PubMed]
- Syedmoradi, L.; Norton, M.L.; Omidfar, K. Point-of-care cancer diagnostic devices: From academic research to clinical translation. Talanta 2021, 225, 122002. [Google Scholar] [CrossRef]
- Point of Care & Rapid Diagnostics Market by Product (Glucose, Infectious Disease(HIV, Hepatitis C), Pregnancy Test), Platform (Microfluidics, Dipsticks), Mode of Purchase (OTC, Prescription), End User (Pharmacy, Hospital, Home)—Global Forecast to 2027. Available online: https://www.marketsandmarkets.com/Market-Reports/point-of-care-diagnostic-market-106829185.html?gclid=Cj0KCQjw3IqSBhCoARIsAMBkTb2yxWqyCtbHFTmrh671ct2TvC-Z_N3Lw_SC_oMaEyEP2bEO8lxR5YgaArCGEALw_wcB (accessed on 1 March 2023).
- Peeling, R.W.; Heymann, D.L.; Teo, Y.Y.; Garcia, P.J. Diagnostics for COVID-19: Moving from pandemic response to control. Lancet 2021, 399, 757–768. [Google Scholar] [CrossRef] [PubMed]
- Valera, E.; Jankelow, A.; Lim, J.; Kindratenko, V.; Ganguli, A.; White, K.; Bashir, R. COVID-19 point-of-care diagnostics: Present and future. ACS Nano 2021, 15, 7899–7906. [Google Scholar] [CrossRef] [PubMed]
- De Felice, M.; De Falco, M.; Zappi, D.; Antonacci, A.; Scognamiglio, V. Isothermal amplification-assisted diagnostics for COVID-19. Biosens. Bioelectron. 2022, 205, 114101. [Google Scholar] [CrossRef] [PubMed]
- HemoScreen™. Available online: https://www.pixcell-medical.com/hemoscreen/ (accessed on 1 March 2023).
- Bransky, A.; Larsson, A.; Aardal, E.; Ben-Yosef, Y.; Christenson, R.H. A novel approach to hematology testing at the point of care. JALM 2021, 6, 532–542. [Google Scholar] [CrossRef] [PubMed]
- Mayega, R.W.; Guwatudde, D.; Makumbi, F.E.; Nakwagala, F.N.; Peterson, S.; Tomson, G.; Östenson, C.G. Comparison of fasting plasma glucose and haemoglobin A1c point-of-care tests in screening for diabetes and abnormal glucose regulation in a rural low income setting. Diabetes Res. Clin. Pract. 2014, 104, 112–120. [Google Scholar] [CrossRef] [PubMed]
- Pohanka, M. Glycated Hemoglobin and Methods for Its Point of Care Testing. Biosensors 2021, 11, 70. [Google Scholar] [CrossRef]
- Spaeth, B.A.; Shephard, M.D.; Schatz, S. Point-of-care testing for haemoglobin A1c in remote Australian Indigenous communities improves timeliness of diabetes care. Rural Remote Health 2014, 14, 136–140. [Google Scholar] [CrossRef]
- Li, D.; Chen, H.; Ren, S.; Zhang, Y.; Yang, Y.; Chang, H. Portable liquid chromatography for point-of-care testing of glycated haemoglobin. Sens. Actuators B Chem. 2020, 305, 127484. [Google Scholar] [CrossRef]
- Plüddemann, A.; Price, C.P.; Thompson, M.; Wolstenholme, J.; Heneghan, C. Primary care diagnostic technology update: Point-of-care testing for glycosylated haemoglobin. Br. J. Gen. Pract. 2011, 61, 139. [Google Scholar] [CrossRef] [PubMed]
- Srivastava, T.; Negandhi, H.; Neogi, S.B.; Sharma, J.; Saxena, R. Methods for hemoglobin estimation: A review of” what works. J. Hematol. Transfus. 2014, 2, 1028. [Google Scholar]
- Singh, S.K.; Srinivasan, A.; Mitra, S.; Pattader, P.S.G. Carbon dots and Methylene blue facilitated photometric quantification of Hemoglobin. Spectrochim. Acta Part A Mol. Biomol. Spectrosc. 2022, 271, 120906. [Google Scholar] [CrossRef]
- Biswas, S.K.; Chatterjee, S.; Bandyopadhyay, S.; Kar, S.; Som, N.K.; Saha, S.; Chakraborty, S. Smartphone-enabled paper-based hemoglobin sensor for extreme point-of-care diagnostics. ACS Sens. 2021, 6, 1077–1085. [Google Scholar] [CrossRef]
- An, R.; Man, Y.; Iram, S.; Kucukal, E.; Hasan, M.N.; Huang, Y.; Gurkan, U.A. Point-of-care microchip electrophoresis for integrated anemia and hemoglobin variant testing. Lab A Chip 2021, 21, 3863–3875. [Google Scholar] [CrossRef] [PubMed]
- Chattopadhyay, S.; Ram, R.; Sarkar, A.; Dutta, G.; Chakraborty, S. Reagent-free hemoglobin estimation on a spinning disc. Microchem. J. 2021, 168, 106463. [Google Scholar] [CrossRef]
- Majors, C.E.; Pawlowski, M.E.; Tkaczyk, T.S.; Dube, Q.; Richards-Kortum, R. Evaluation of the LeukoScope for Point-of-Care Measurement of White Blood Cell and Neutrophil Counts in Malawi. Ann. Biomed. Eng. 2021, 49, 2566–2578. [Google Scholar] [CrossRef] [PubMed]
- Venge, P.; Eriksson, A.K.; Moberg, L.; Peterson, C.; Xu, S.; Hamberg, K.; Höglund, M. Estimation of numbers of mature and immature neutrophils in blood by a novel, rapid and simple technology. Scand. J. Clin. Lab. Investig. 2021, 81, 307–311. [Google Scholar] [CrossRef]
- Cramer, E.M.; Beesley, J.E.; Pulford, K.A.; Breton-Gorius, J.; Mason, D.Y. Colocalization of elastase and myeloperoxidase in human blood and bone marrow neutrophils using a monoclonal antibody and immunogold. Am. J. Pathol. 1989, 134, 1275. [Google Scholar]
- Barroso, T.; Ribeiro, L.; Gregório, H.; Santos, F.; Martins, R.C. Quantification of Red and White Blood Cells using Scattering Information Extraction from Vis-NIR Spectrum: Towards Spectroscopy Point-of-Care Hemogram Cell Counts. In Proceedings of the CSAC2021: 1st International Electronic Conference on Chemical Sensors and Analytical Chemistry Session Biosensors, Online, 1–15 July 2021; pp. 1–5. [Google Scholar]
- Frantz, E.; Li, H.; Steckl, A.J. Quantitative hematocrit measurement of whole blood in a point-of-care lateral flow device using a smartphone flow tracking app. Biosens. Bioelectron. 2020, 163, 112300. [Google Scholar] [CrossRef] [PubMed]
- Rao, L.V.; Jakubiak, F.; Sidwell, J.S.; Winkelman, J.W.; Snyder, M.L. Accuracy evaluation of a new glucometer with automated hematocrit measurement and correction. Clin. Chim. Acta 2005, 356, 178–183. [Google Scholar] [CrossRef]
- Dickerson, W.M.; Yu, R.; Westergren, H.U.; Paraskos, J.; Schatz, P.; Tigerstrom, A.; Chan, E.Y. Point-of-care microvolume cytometer measures platelet counts with high accuracy from capillary blood. PLoS ONE 2021, 16, e0256423. [Google Scholar] [CrossRef]
- Colozza, N.; Caratelli, V.; Moscone, D.; Arduini, F. Origami Paper-Based Electrochemical (Bio) Sensors: State of the Art and Perspective. Biosensors 2021, 11, 328. [Google Scholar] [CrossRef]
- Li, H.; Han, D.; Pauletti, G.M.; Steckl, A.J. Blood coagulation screening using a paper-based microfluidic lateral flow device. Lab A Chip 2014, 14, 4035–4041. [Google Scholar] [CrossRef]
- Inci, F.; Saylan, Y.; Kojouri, A.M.; Ogut, M.G.; Denizli, A.; Demirci, U. A disposable microfluidic-integrated hand-held plasmonic platform for protein detection. Appl. Mater. Today 2020, 18, 100478. [Google Scholar] [CrossRef]
- Ulum, M.F.; Maylina, L.; Noviana, D.; Wicaksono, D.H.B. EDTA-treated cotton-thread microfluidic device used for one-step whole blood plasma separation and assay. Lab A Chip 2016, 16, 1492–1504. [Google Scholar] [CrossRef] [PubMed]
- Agarwal, R.; Sarkar, A.; Bhowmik, A.; Mukherjee, D.; Chakraborty, S. A portable spinning disc for complete blood count (CBC). Biosens. Bioelectron. 2020, 150, 111935. [Google Scholar] [CrossRef] [PubMed]
- Zon, R.T.; Kennedy, E.B.; Adelson, K.; Blau, S.; Dickson, N.; Gill, D.; Page, R.D. Telehealth in oncology: ASCO standards and practice recommendations. JCO Oncol. Pract. 2021, 17, 546–564. [Google Scholar] [CrossRef]
- Curigliano, G.; Banerjee, S.; Cervantes, A.; Garassino, M.C.; Garrido, P.; Girard, N.; Yang, J. Managing cancer patients during the COVID-19 pandemic: An ESMO multidisciplinary expert consensus. Ann. Oncol. 2020, 31, 1320–1335. [Google Scholar] [CrossRef]
- Dolcini, A.; Iuppariello, L.; Calderone, D.; Cesarelli, M.; Clemente, F. Guardian Angel 2.0: A telemedicine service for children with home mechanical ventilation. Rev. Roum. Des Sci. Technol. Ser. Electrotech. Energetique 2022, 67, 355–358. [Google Scholar]
- Stephens, L.; Bevins, N.J.; Bengtsson, H.-I.; Elizabeth Broome, H. Comparison of different small clinical hematology laboratory configurations with focus on remote smear imaging. Arch. Pathol. Lab. Med. 2019, 143, 1234–1245. [Google Scholar] [CrossRef] [PubMed]
- Memmolo, P.; Aprea, G.; Bianco, V.; Russo, R.; Andolfo, I.; Mugnano, M.; Merola, F.; Miccio, L.; Iolascon, A.; Ferraro, P. Differential diagnosis of hereditary anemias from a fraction of blood drop by digital holography and hierarchical machine learning. Biosens. Bioelectron. 2022, 201, 113945. [Google Scholar] [CrossRef] [PubMed]
- An, R.; Huang, Y.; Man, Y.; Valentine, R.W.; Kucukal, E.; Goreke, U.; Gurkan, U.A. Emerging point-of-care technologies for anemia detection. Lab A Chip 2021, 21, 1843–1865. [Google Scholar] [CrossRef] [PubMed]
| Disclaimer/Publisher’s Note: The statements, opinions and data contained in all publications are solely those of the individual author(s) and contributor(s) and not of MDPI and/or the editor(s). MDPI and/or the editor(s) disclaim responsibility for any injury to people or property resulting from any ideas, methods, instructions or products referred to in the content. |
© 2023 by the authors. Licensee MDPI, Basel, Switzerland. This article is an open access article distributed under the terms and conditions of the Creative Commons Attribution (CC BY) license (https://creativecommons.org/licenses/by/4.0/).


