Abstract
Lysozyme (LYS) applications encompass anti-bacterial activity, analgesic, and anti-inflammatory effects. In this work, a porous framework that was based on the polymerization of pyrrole (PPy) in the presence of multi-functional graphene oxide/iron oxide composite (GO@Fe3O4) has been developed. Oxygen-containing and amine groups that were present in the nanocomposite were availed to assembly LYS as the molecularly imprinted polymer (MIP) template. The synthesized material (MIPPy/GO@Fe3O4) was electrodeposited on top of a gold microelectrode array. Transmission electron microscopy (TEM) and X-ray photoelectron spectroscopy (XPS) were used to confirm the adequate preparation of GO@Fe3O4, and the characterization of the resulting molecularly imprinted electrochemical sensor (MIECS) was carried out by electrochemical impedance spectrometry (EIS), FT-IR analysis, and scanning electron microscopy (SEM). The impedimetric responses were analyzed mathematically by fitting to a Q(Q(RW)) equivalent circuit and quantitative determination of LYS was obtained in a linear range from 1 pg/mL to 0.1 µg/mL, presenting good precision (RSD ≈ 10%, n = 5) and low limit of detection (LOD = 0.009 pg/mL). The fabrication of this device is relatively simple, scalable, rapid, and economical, and the sensor can be used up to nine times without disintegration. The MIECS was successfully applied to the determination of LYS in fresh chicken egg white sample and in a commercial drug, resulting in a straightforward platform for the routine monitoring of LYS.
1. Introduction
Lysozyme (LYS) is a globular protein of relatively low molecular weight (14 kDa) that can be found in biological fluids such as tears, saliva, and milk []. The structure of this protein consists of two regions, an external hydrophilic surface and an internal hydrophobic core. LYS has been considered as a potential biomarker for the diagnosis of leukemia and other diseases that cause damage in human cells, tissues, and organs []. Moreover, due to its anti-bacterial activity, analgesic, and anti-inflammatory effects, thermotolerance, and chemical stability, LYS is used in pharmacology as a functional ingredient for medical treatments and in the food industry as a preservative [,].
LYS determination has been performed through high-performance liquid chromatography (HPLC), mass spectrometry (MS), enzyme-linked immunosorbent assay (ELISA), fluorescence, and electrophoresis [,,,,]. However, in most cases, long processing times, complex sample pre-treatments, and expensive equipment are required. As an alternative, biosensors are “ready to use” devices that are designed to be simple analytical methods with increased sensitivity, rapid response, and real-time analysis [,,]. It should be noted that electrochemical biosensors feature electronic components with miniaturization and automation that are defined by the electronic sensitivity of the transducer technique.
Molecular imprinting technology is a technique for the preparation of polymer-based sensors. In this type of synthesis, the functional monomer is polymerized in the presence of the target molecule (template). After polymerization, the polymeric functional groups are correctly oriented to allow interactions with the template molecule which remains adsorbed to the material. Finally, the template is extracted using the necessary electrochemical or chemical conditions to break the existing interactions between the template and the polymer. As a result, specific three-dimensional sites with a similar size and shape to the template are created [] and used as specific detection sites for the analyte. Molecularly imprinted polymers (MIPs) are usually applied for the development of selective analytical methods [,]. The detection of viruses, proteins, cells, nucleic acids, drugs, and inorganic ions has been successfully performed [,,]. The use of molecular imprinting technology has been extended to numerous research fields because of its advantages. Frequently, high porous surface structures are wanted to increase the surface to volume ratio and thus, achieve increased recognition []. The nature and number of interactions between the monomer and the molecular template during the polymerization process are essential factors in the performance of MIPs because the formation of stable complexes results in more efficient imprinted sites. The capacity to establish hydrogen bonds and dipole interactions through functional groups containing oxygen and nitrogen is highly desired for protein detection applications []. On the other hand, employing MIPs as transducers requires the transduction of the capturing event into a quantifiable electronic output signal. In this regard, polypyrrole (PPy) presents high electron-transfer capacity, stability, and low toxicity. Ppy interacts with organic and inorganic molecules by hydrophobic interactions via its extended aromatic structure and dipole moment []. However, the electrons of the imine group are not available to establish efficient hydrogen bonds. Consequently, many authors usually propose the use of Ppy in combination with alternative polymers and additives such as o-phenylenediamine [], chitosan [], and carboxylic acids [] to increase the number and diversity of interactions between the imprinted polymer and the template.
Some well-known nanomaterials such as gold nanoparticles, iron oxide nanoparticles (Fe3O4-NPs), graphene, and graphene oxide (GO) have been used to improve the sensitivity and selectivity of electrochemical sensors [,,]. Of note, GO is an interesting 2D aromatic structure material with high specific surface area (2.630 m2/g), and numerous oxygen-containing functional groups on the basal plane and the sheet edge, including epoxy, carboxylic acid, carbonyl, and hydroxyl groups []. Despite the presence of the π-π domain, a hydrophilic character is provided, resulting in high adsorption capacity for the retention and preconcentration of polar species and metal ions. In recent years, researchers have proposed the coupling of Fe3O4-NPs and GO, combining their biocompatibility, degradability, physiological and chemical stability, and excellent adsorbent properties for the preparation of decorated graphene oxide (GO@Fe3O4) [,]. For this reason, in this work, GO@Fe3O4 nanocomposite was selected, presenting amine groups and oxygen-containing functional groups that are compatible to interact with the template through dipole interactions and hydrogen bonds, and used to produce microporous polypyrrole (MIPPy/GO@Fe3O4) imprinted with lysozyme. Pyrrole is interesting for scaling up production because of its low cost and easy polymerization reaction [,,]. The inclusion of a multi-functional composite for the routine monitoring of lysozyme resulted in extraordinary sensitivity and selectivity. In this MIECS, the complex interactions with the template are originated from the hydrophobic interactions and dipole moment of PPy as well as from the oxygen- and nitrogen-containing functional groups of GO@Fe3O4 which are crucial to create the specific sites. The MIECS was successfully applied for the monitoring of LYS in chicken egg and commercial drugs. Thus, in this work, the synthesized MIECS is presented as an easy to use and reliable alternative methodology for the determination of lysozyme in the pharmaceutical industry.
2. Materials and Methods
2.1. Reagents and Samples
All the aqueous solutions were prepared with analytical grade reagents and doubly deionized water (DDW) that was purified with an ELGA Purelab Classic Ultrapure Water System (High Wycombe, Bucks, UK) that reaches a resistivity of 18.2 MΩ·cm at 25 °C. Ferrous chloride tetrahydrate (FeCl2·4H2O), ferric chloride hexahydrate (FeCl3·6H2O), hydrochloric acid 37%, ammonium hydroxide 30%, hydrogen peroxide 30%, graphite powder, methanol, ethanol, sodium chloride, potassium permanganate, tetraethyl orthosilicate ≥98%, 3-aminopropyltriethoxysilane (AP) ≥ 99%, and sulfuric acid ≥ 99% from Merck (Darmstadt, Germany) were used. N,N’-dicyclohexylcarbodiimide (DCC), pyrrole ≥ 98%, hexadecyl trimethyl ammonium bromide (HTMA) ≥ 99%, sodium dodecyl sulphate (SDS) ≥ 98%, phosphate-buffered saline (PBS), lysozyme from chicken egg white, bovine serum albumine (BSA), and peroxidase were purchased from Sigma Aldrich (St. Louis, MO, USA).
2.2. Instrumentation
Electrochemical experiments were performed using a multichannel potentiostat analyzer PalmSens4 multiplexer MUX8 acquired from PalmSens BV (Houten, The Netherlands). The microelectrodes, fabricated at the National Center for Microelectronics (CNM, CSIC, Sevilla, Spain), were designed over a silicon chip to produce an array of four gold working electrodes (WE, 0.64 mm2/unit), two Ag/AgCl reference microelectrodes (RE, 1.37 mm2/unit) and one counter microelectrode (CE, 0.13 mm2). Prior to use, the surfaces of the microelectrodes were cleaned in an air-plasma treatment at 0.2 mBar and 30 s of application.
X-ray photoelectron spectroscopy (XPS) analysis were performed with a Physical Electronics ESCA 5701 instrument (Chanhassen, Minnesota, USA); the binding energies (BE) were observed considering the position of the C1s peak at 284.8 eV. The residual pressure in the analysis chamber was maintained below 3 × 10⁻⁹ torr during data acquisition.
The microstructures of GO and GO@Fe3O4 were characterized by transmission electron microscopy (TEM) JEOL, JEM-1400 (Peabody, MA, USA). The surface morphology of the modified electrodes were observed by scanning electron microscopy (SEM) VEGA TESCAN SEM from Leica Microsystems (Wetzlar, Germany) at 15 kV. SEM analyses were carried out with gold metallization.
FT-IR NEXUS from ThermoFisher Scientific (Waltham, MA, USA) with the accessory Microscope Continuµm was used for the study of the surface composition of the modified microelectrodes in the 500–3200 cm−1 range and 256 scans.
2.3. Synthesis of GO@Fe3O4
FeCl3·6H2O (11.68 g) and FeCl2·4H2O (4.30 g) were mixed in 200 mL of DDW at 80 °C, and then 50 mL of 30% ammonia solution was added quickly in N2 atmosphere. In this moment, Fe3O4 nanoparticles were coprecipitated and the resulting black suspension was stirred for 75 min with reflux. The Fe3O4 nanoparticles were cooled to room temperature and washed with DDW. The synthesis of MNPs was optimized by González Moreno et al. [], and the resulting Fe3O4 nanoparticles were coated with the following procedure. First, Fe3O4 nanoparticles were mixed with 8 mL of TEOS and 60 mL of glycerol in 200 mL of ethanol at 60 °C and stirred for 2 h in N2 atmosphere. The resultant suspension was cooled at room temperature and washed with DDW and ethanol. Then, the product was suspended in 150 mL of AP 1% prepared in ethanol 95%, and the pH was adjusted to 4.5. The mixture was stirred at 60 °C for 2 h in N2 atmosphere. Later, the suspension was cooled at room temperature and washed with DDW and methanol. All the washing steps were carried out with the aid of an external permanent magnet to separate the nanoparticles from the matrix thanks to the magnetic properties of Fe3O4. On the other hand, GO was prepared from natural graphite following the process that was described by Diagboya et al., being purified by centrifugation cycles []. Finally, 500 mg of GO was suspended in 50 mL of ethanol, containing 500 mg of coated Fe3O4 and 0.25 g of DCC in a 100 mL round-bottom flask. The mixture was sonicated for 10 min and kept at reflux at 50 °C for 48 h.
2.4. Synthesis of MIPPy/GO@Fe3O4
First, the polymerization solution was prepared as follows: 20 mg of SDS were dissolved in 8.3 mL of DDW. Then, 1 mg of GO@Fe3O4 was added to the prepared solution and the mixture was sonicated for 20 min. Next, 1 mL of the LYS 1 mg/mL solution was added to the resulting suspension, maintaining stirring for 20 min. Finally, 0.7 mL of pyrrole was added to the mix, maintaining stirring for 20 min. The addition of SDS in the polymerization solution presented a double function. (1) The presence of a surfactant contributed to the stabilization of the GO@Fe3O4 suspension, and (2) pyrrole is insoluble in aqueous solutions, so the surfactant was necessary for the preparation of pyrrole micelles. The final SDS concentration in the prepared solution was 2 mg/mL. Then, the microelectrodes were introduced in the polymerization solution, and the electrodeposition of polypyrrole was carried out by cyclic voltammetry (CV) between −0.6 V and 1.2 V, 1 scan with a scan rate of 100 mV/s at 5 °C. After electrodeposition, the microelectrodes were rinsed with DDW and dried under a weak nitrogen flow. In this work, SDS has been used during the synthesis process of MIPPy/GO@Fe3O4, which is a negatively charged surfactant. As a result, the surface of the prepared material could present residual negative charges due to the presence of SDS that was embedded in the polymerized structure. These negative charges and the dipole moment of PPy that are located on the surface could contribute to establish undesirable interactions with other proteins and molecules. For these reasons, a passivation step was necessary, for which a positively charged surfactant was selected. Thus, the modified surface was passivated by introducing the microelectrodes in HTMA 1 mg/mL, prepared in PBS, for 1 h. Finally, the last step for MIECS preparation consisted of the removal of the LYS template by incubating the microelectrodes in a 0.5 M H2SO4 solution for 1 h. The synthesis process can be observed in Figure 1 (the passivation step was omitted in order to simplify the scheme). There were two modifications that were carried out as a reference: the corresponding non-imprinted (NIPPy/GO@Fe3O4) modified microsensors were prepared analogously except for the absence of LYS template, and the imprinted polypyrrole (MIPPy) microsensors were prepared following an identical protocol without GO@Fe3O4.
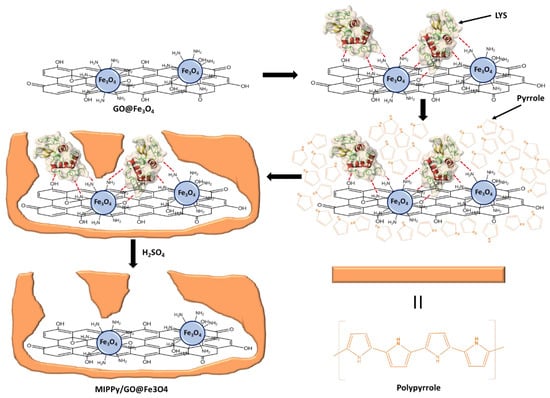
Figure 1.
Synthesis process of MIPPy/GO@Fe3O4.
2.5. Electrochemical Measurements
EIS (Higher Freq = 100 kHz, Lower Freq = 1 Hz, Eac = 0.05 V, Edc = 0.05 V) was used to characterize the microelectrode modification and perform the analysis of real samples. The MIP-modified microelectrodes were introduced in PBS solution containing LYS (from 0.01 to 1 105 pg/mL) for 30 min to study their analytical performance and the equivalent circuit of the system. A washing step with water was performed before measurements to eliminate the excess non-attached LYS on the surface. The influence of possible interferences in the signal (BSA and peroxidase) was studied under the same experimental conditions and concentration range. Finally, the value of the impedance at 1050 Hz was selected as the analytical signal for the determination of LYS in fresh chicken egg white and in a commercial drug.
3. Results and Discussion
3.1. Morphological Characterization and Composition
TEM images were used to study the morphology of GO and GO@Fe3O4. In Figure S1A (Supplementary Material), the 2D structure of GO can be clearly observed, according to the information that was found in bibliography. Besides, Figure S1B shows the presence of Fe3O4 nanoparticles scattered over the GO layer, indicating that both materials were adequately coupled. The XPS spectrum of GO@Fe3O4 is shown in Figure S2, where the peaks of Fe, O, N, C, and Si were assigned. The presence of N, Fe, and Si in the material resulted from the silica-coated Fe3O4 nanoparticles, while the presence of C was related to the composition of GO. The high O content was justified by the composition of both GO and Fe3O4 nanoparticles. Therefore, TEM and XPS analysis indicated that GO@Fe3O4 was adequately prepared.
SEM was performed to investigate the morphology of the microelectrodes modifications. As can be seen in Figure 2A, the non-imprinted film presented a more compact structure in comparison with the imprinted film, which presented more roughness and wrinkles (Figure 2B). Moreover, nanoholes can be observed in the structure of MIPPy/GO@Fe3O4. FT-IR analysis was carried out to confirm the passivation step in the preparation of MIPs, and the LYS retention on the surface of the modified microelectrodes after 30 min of incubation. In the LYS spectrum (Figure 3A), a strong peak at 1670 cm−1 can be attributed to the stretching vibration C = O of amino acids. From FT-IR spectra of HTMA (Figure 3B), several characteristic bands can be seen in the 2800–3000 cm−1 range that were assigned to C-H stretching, usually found in alkylammonium cations []. As can be observed in Figure 3C,D, NIPPy/GO@Fe3O4 and MIPPy/GO@Fe3O4 presented the same infrared profile (number of bands, position, and intensity), indicating that the chemical composition of both materials is very similar. The bands at 950 cm−1 were assigned to aromatic C-H from GO, and the signals at 1050 cm−1 and 2100 cm−1 were assigned to νC-N and νSi-H [], according to the presence of aliphatic amines and silicon species from the coated Fe3O4 nanoparticles. In NIPPy/GO@Fe3O4 and MIPPy/GO@Fe3O4 spectra, characteristic bands of HTMA appeared in the 2800–3000 cm−1 range, so the passivation step was adequately performed when imprinted and non-imprinted materials were prepared. Moreover, characteristic bands of PPy were observed at 1550 cm−1 (pyrrole ring), and 1300 cm−1 (plane = C–H) []. Besides, when the MIECS was incubated in LYS 1 105 pg/mL solution for 30 min, an additional band appeared at 1670 cm−1 corresponding to the presence of LYS on the surface (Figure 3E).
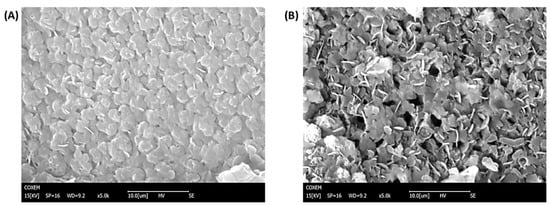
Figure 2.
SEM images of (A) NIPPy/GO@Fe3O4 (B) MIPPy/GO@Fe3O4.
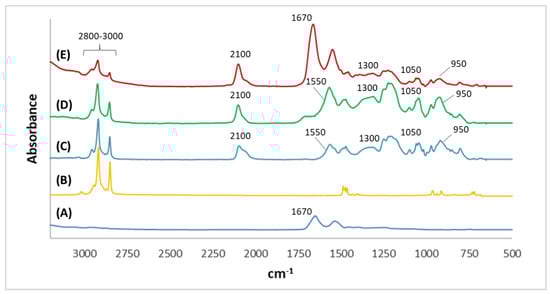
Figure 3.
Infrared spectra in the 3200–500 cm−1 range of (A) LYS, (B) HTMA, (C) NIPPy/GO@Fe3O4, (D) MIPPy/GO@Fe3O4, and (E) MIPPy/GO@Fe3O4 incubated in LYS.
3.2. Fabrication Optimization
During pyrrole electrodeposition, the scan rate (V/s) and the final concentration of SDS (mg/mL) were considered as important synthesis parameters to be optimized due to their influence on the morphology and stability of the modified surface. The selected parameters were optimized by using a univariant strategy, changing one parameter and keeping the other constant. For scan rate optimization purposes, the SEM images were observed to ensure the most homogeneous modified electrode surface as possible. The synthesis of the modified microelectrodes was performed in the 0.01–0.15 V/s scan rate range. As can be observed in Figure S3, the modified surfaces with non-homogeneous structures were obtained when the scan rate was lower than 0.15 V/s (Figure S3A), while a more homogeneous surface was obtained with the maximum scan rate value (Figure S3B). So, 0.15 V/s was selected as the optimum scan rate. The SDS concentration that was used during MIPPy/GO@Fe3O4 synthesis was varied between 0.5 and 5 mg/mL, and it was observed that the MIPPy film was easily detached from gold microelectrode surfaces during the washing steps when the SDS concentration was higher than 2 mg/mL. Therefore, 2 mg/mL was selected as the optimum SDS concentration in order to avoid instability problems of the MIPPy film. In this work, the acronym MIECS is used to refer to the modified microelectrodes with MIPPy/GO@Fe3O4 under optimum conditions.
3.3. Impedimetric Characterization
For the impedimetric measurements, a small AC/DC signal was applied to reduce the signal noise and both parameters were studied in the 0–0.1 V potential range. To perform these experiments, gold microelectrodes were modified with MIPPy/GO@Fe3O4, introducing the prepared MIECS in PBS solution. The signal noise of EIS graphs was reduced when the AC/DC values increased from 0 to 0.1 V. However, when 0.1 V was used, the integrity of the sensors was negatively affected due to the excess voltage. Therefore, medium values were finally selected (Eac = 0.05 V, Edc = 0.05 V) to avoid serious damage in the electronic system.
Gold microelectrodes were modified with MIPPy/GO@Fe3O4, and the LYS concentration was determined by performing EIS measurements in PBS 10 mM, pH 7.4. Standard LYS solutions from 1 × 10⁻² to 1 × 10⁵ pg/mL were measured. The resultant admittance spectra were plotted as the susceptance (imaginary part of admittance) vs. the conductance (real part of the admittance) and are shown in Figure 4. In the graphics (Figure 4A), a clear tendency of decreasing susceptance can be observed in relation to the increment of LYS concentrations. In these graphics, a first semicircle can be observed (from left to right) corresponding to a relaxation at lower frequencies and a second relaxation (on the right) corresponding to high frequencies. Molecular movements at lower frequencies are characterized by the ionic diffusion time of the redox probe, while the response that was obtained at higher frequencies is associated with the accumulation of target molecules over the biosensor surface. MIPPy/GO@Fe3O4 (Figure 4A) demonstrated a good correlation between the LYS concentration and the variation of the admittance signal in the studied concentration range. For comparison, experiments were performed under the same conditions but using two alternative modifications: the same preparation process but eliminating the GO@Fe3O4 from the synthesis process (MIPPy) and maintaining the synthesis process without the template (NIPPy/GO@Fe3O4). The EIS spectra corresponding to the experiments that were performed with NIPPy/GO@Fe3O4 and MIPPy (without modifiers) are observed in Figure 4B,C, respectively. At first, susceptance decreased with the increment of LYS concentrations, but rapidly saturated when the LYS concentration exceeded 10 pg/mL. This fact indicated that the presence of GO@Fe3O4 during the synthesis process greatly improved the performance of the sensor. Moreover, it can be concluded that the response of the NIPPy/GO@Fe3O4 microsensor toward LYS is very weak in comparison with the response of the MIPPy/GO@Fe3O4, demonstrating that MIP was successfully prepared.
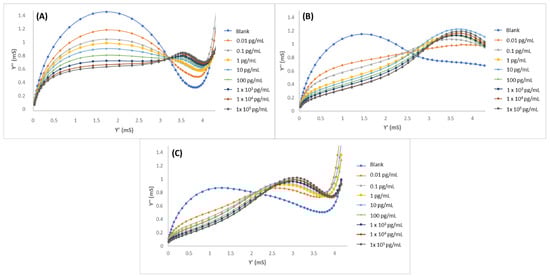
Figure 4.
Admittance spectra of (A) MIPPy/GO@Fe3O, (B) NIPPy/GO@Fe3O4, and (C) MIPPy, after incubation with LYS in 0.01–1 × 10⁵ pg/mL range.
Selectivity was evaluated towards the potential protein interferences by using MIPPy/GO@Fe3O4 as previously described for MIECS fabrication. All the measurements were performed by the EIS technique after 30 min incubation under optimized experimental conditions. Peroxidase and BSA were selected as interferences, and solutions of both proteins were prepared in PBS with three different concentrations: 100 fg/mL, 10 pg/mL, and 10 ng/mL. The admittance spectra of peroxidase and BSA solutions are shown in Figure 5A,B, respectively. No tendency was observed in the graphics, and no correlation could be stablished between the interference concentration and the signal. This indicated that BSA or peroxidase were not adsorbed on the MIECS surface, demonstrating that the system is very selective towards the target molecule.
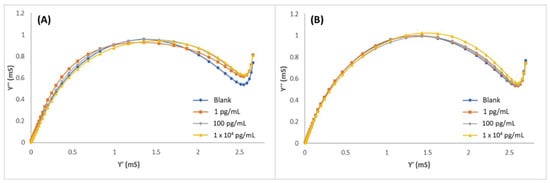
Figure 5.
Admittance spectra of MIPPy/GO@Fe3O after incubation with (A) peroxidase and (B) BSA in 1–1 × 10⁴ pg/mL range.
3.4. Equivalent Circuit Model Analysis and Analytical Performance
The LYS solutions were prepared in PBS in the 0.01 to 105 pg/mL range and analyzed by EIS. Impedance spectroscopy was used to evaluate the charging behavior of the electrical double layer and interfacial relationships between lysozyme and the transducer. Nyquist impedance plots were recorded to inspect the fabrication process and performance of the MIEC. The impedimetric responses were mathematically fitted to an equivalent circuit consisting of the solution resistance (RS) in series with a constant phase element (CPE) in parallel with a charge transfer resistance (RCT) and a Warburg impedance (W). The interactions occurring at the electrode surface hinder or favor electronic transfer and/or increase the impedance. For this reason, CPE and RCT depend on the dielectric and isolating aspects of the interface of the biosensor. These analytical signals and respective RCT values were directly proportional to the concentration of the targeted lysozyme. In supplementary Table S1, the average results that were obtained through the equivalent circuit for three different electrodes are shown, including MIECS with LYS, BSA, and peroxidase. A good correlation when MIECS was subjected to LYS-positive control samples was observed, where the ΔRC values increased gradually in a linear relation to the concentration of LYS present in the sample (Figure 6). However, in the case of negative controls samples (without LYS), it can be observed that no correlation is achieved attending to the concentration increase. This effect can be explained considering the small size of LYS in comparison to the other proteins. It should be noted that the extraction of the template promotes a heterogeneous porous surface as can be observed in the morphological characterization. This new morphology in combination to the size of the other proteins (around 40K) promotes the unspecific binding and layer sorption and desorption that was observed by impedance spectroscopy (Figure 6). There were two different linear ranges that were observed before and after the concentration of 1 pg/mL. The calibration curve was defined as y = a + b·log(x), where the parameter “b” was the slope of the calibration curve, “a” was the intercept, and Sa was the intercept uncertainty (considered as the standard deviation of the blank). The first region, from 10 fg to 1 pg was adjusted to the following equation ΔRCT = 9.635 + 0.797 log(CLYS) with r2 = 0.99, with an instrumental limit of detection, LOD = 2 fg (where Sa = 0.07). The second linear region was fitted to the following equation ΔRCT = 9.509 + 0.315 log(CLYS) with r2 = 0.91. From this study was also concluded that the sensor can be used up to nine times without disintegration.
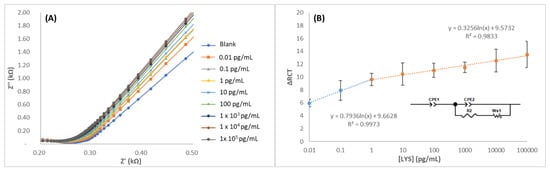
Figure 6.
(A) Nyquist spectra of MIPPy/GO@Fe3O after incubation with LYS in 1–1 × 10⁵ pg/mL range and (B) the equivalent circuit and calibration curve that was obtained from the fitting process.
In order to develop a routine analytical method for LYS monitoring according to the usual working range of portable potentiostats that are available on the market (>1000 Hz), the Bode plots were analyzed (Figure 7A). As can be observed in Figure 7A, the rates of phase angle shifts between 100,000 and 46 Hz have greater variation rate in the range from 0 to 100 pg/mL, than in the 103 to 105 pg/mL concentration range, where the rate rapidly decreases; this phenomenon can be better understood from the admittance graphics (Figure 4). At these frequencies, the diffusion process of the redox probe is largely hindered by the captured biomolecules and, therefore, after concentrations of 100 pg/mL, the diffusion of the redox probe becomes irrelevant, and the response appears to be driven by the capacitive accumulation. In Figure 7B, the developed MIP transducer presented a good distinguishable response at frequencies from 1 to 1050 Hz; where 1050 Hz was finally selected, and its corresponding impedance values were used as an analytical signal. Supported in Rct values, the Bode data were normalized by calculating ΔR/R as ΔR/R = (Rct LYS − Rct blank)/Rct blank), presenting the following linear calibration: y = 0.0117 × Ln (CLYS) + 0.1408 with r2 = 0.983. The blank signal corresponds to the negative control without LYS. LOD and LOQ were defined as the concentration value corresponding with a signal 3.3 and 10 times the uncertainty of the blank, respectively. The calibration curve was defined as y = a + b·ln(x), where the parameter “b” was the slope of the calibration curve, “a” was the intercept, and Sa was the intercept uncertainty (considered as the standard deviation of the blank). For the impedimetric microsensor that was based on MIPPy/GO@Fe3O4, LOD = 0.009 pg/mL and LOQ = 0.9 pg/mL (Sa = 0.008) were obtained.
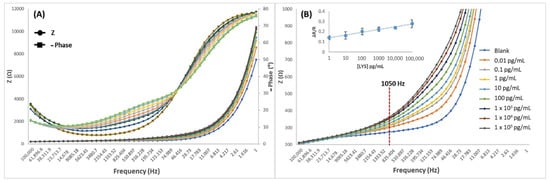
Figure 7.
Bode spectra of MIPPy/GO@Fe3O after incubation with LYS in the 1–1 × 10⁵ pg/mL range. X axis: frequency 1–100,000 Hz and Y axis: Z (A) 0–12,000 Ω and (B) 200–1000 Ω. (B) includes the resulting calibration curve that was obtained after representation of the 1050 Hz data.
Attending to the reusability of the system, an additional wash step with H2SO4 was performed after the LYS 10 pg/mL measurement in order to remove the excess protein from the surface of the MIECS. Then, the incubation and the measurement of LYS was performed and this cycle was repeated two more times. The measurements were obtained adequately but the original impedance value was not achieved, decreasing by 50% and remaining constant (Figure S4). Therefore, it can be concluded that the sensor can be reused, but the sensitivity of the method is compromised.
For the evaluation of the reproducibility of the method in a wide linear range, three gold microelectrodes were used to measure two standard LYS solutions (1 pg/mL and 1000 pg/mL), employing the remaining third as a NIP blank control. The relative standard deviations (RSDs) for both concentrations were calculated, providing a 7% (n = 5) and 11% (n = 5), respectively.
In Table 1, a comparative study of the analytical performance of the proposed microsensor and that of previous electrochemical methods that were reported in the bibliography for the determination of LYS can be observed [,,,,]. To the best of our knowledge, the proposed MIEC demonstrated a more extended linear range (five orders of magnitude) and a very lower LOD than the reported sensors, presenting the best analytical performance. In a previous work, our group showed the feasibility of using a chitosan-based MIP to detect lysozyme. At the time, PPy was used as a supporting layer to attach the electrodeposited MIP chitosan film and the attained LOD was 70 pg/mL.

Table 1.
Comparison of the analytical performance of the fabricated MIPPy/GO@Fe3O4-based microsensor with previously published sensors for LYS detection.
Molecular imprinted polymers (MIPs) require the polymerization of monomers with appropriate functional groups to favor the complexation of a given template. In the present work, the MIP was prepared directly over the PPy layer in the presence of a multifunctional composite which presents diverse functional groups to bind lysozyme. Other works have reported to improve lysozyme detection in differential pulse voltammetry sensors by including CuFe2O4 magnetic nanospheres in glassy carbon to improve its capacitance characteristics and conductivity. However, despite its good selectivity, its working detection range is of 50–800 ng/mL and a detection limit of 1.5 ng/mL. To the best of our knowledge, the enhancement that was found in the present PPy/GO@Fe3O4 MIP arises from the interactions between the imprinted composite and the template, the synergy occurring between PPy π-electron conjugated framework and semiconducting GO@Fe3O4.
3.5. Application
To validate the proposed microsensor for its potential application, MIECS was used for the determination of LYS in a fresh chicken egg white sample and commercial drug. The impedance value that was obtained under optimum conditions at 1050 Hz was used as an analytical signal, and the accuracy of the method was studied using spike tests in the real samples. A tablet of commercial drug was dissolved in 10 mL of DDW, and both the commercial drug solution and fresh chicken egg white sample were diluted ten million times prior to analysis. The samples were analyzed by standard addition calibration in the 10–100 pg/mL range. As can be observed in Table 2, the preparation and initial samples dilution were considered, and all the recoveries were close to 100% for all the spiked samples. Moreover, the LYS concentration that was found in the fresh chicken egg white sample and commercial drug were 4.8 ± 0.8 mg/mL and 23 ± 4 mg/tablet, according to the expected concentration of LYS in chicken egg white (about 3.5 mg/mL) [] and the LYS concentration value that was indicated on the label of the commercial drug (20 mg/tablet), respectively.
Table 2.
Analysis that was performed for the determination of LYS in real samples.
4. Conclusions
A novel sensitive impedimetric microsensor has been developed for lysozyme determination by using a novel molecularly imprinted polymer that was based on PPy/decorated graphene oxide (MIPPy/GO@Fe3O4) composite. The adequate preparation of the material was verified by several analytical techniques: TEM and XPS were applied for the study of the composition and morphology of GO@Fe3O4, while SEM and FT-IR were used to characterize the modified microelectrode surface. EIS was used to investigate the electrochemical behavior of the system, obtaining an equivalent circuit to analyze each component of the modified microsensors. The electrochemical characterization of the sensors indicated that GO@Fe3O4 was adequately deposited on the microsensor surface, and the presence of this material during the synthesis process greatly improved the performance of the system. The MIECS showed an extended linear range with a very low detection limit, good reproducibility, and suitable precision. This sensor has proven to be not susceptible to interferences versus other proteins thanks to the specific recognition sites that were generated. Besides, several synthesis and measurement parameters were adequately optimized by following a univariant strategy. In this work, the analytical performance was studied under optimum conditions and compared with that of other electrochemical methods that were previously reported in the bibliography, presenting one of the best analytical performances for the routine monitoring of LYS. Although the LYS concentration ranges are usually high and out of the working range of the sensor, biological samples present complex matrices that can contribute to the non-suitable performance of an electrochemical biosensor due to matrix effects and the presence of interferents. In this work, the use of more diluted samples in order to avoid matrix effects is possible, improving the performance of the sensor even in complex matrices. The prepared MIECS have been successfully applied for the detection of LYS in fresh chicken egg white and commercial drugs, obtaining high recovery values.
Supplementary Materials
The following supporting information can be downloaded at: https://www.mdpi.com/article/10.3390/bios12090727/s1, Figure S1: TEM images of (A) GO (scale of 200 nm), and GO@Fe3O4 with a scale of (B) 200 nm, (C) 100 nm, and (D) 50 nm; Figure S2: XPS spectra of GO@Fe3O4 and atomic composition; Figure S3: SEM images of PPy that was synthesized by electropolymerization (A) prior to scan-rate optimization and (B) under scan-rate optimized conditions (0.15 V/s); Figure S4: Reusability study results after three LYS 10 pg/mL incubation cycles; Table S1: Average data for equivalent circuit of MIPPy/GO@Fe3O4 impedimetric responses.
Author Contributions
N.J.-R.: Supervision, project administration, funding acquisition, writing—review and editing. A.E.: Supervision, project administration, funding acquisition, writing—review and editing. E.V.A.: Methodology, writing—review and editing. I.A.M.F.: Investigation, conceptualization, methodology, writing—original draft. P.M.-L.: Investigation, conceptualization, validation, writing—original draft. All authors have read and agreed to the published version of the manuscript.
Funding
The Spanish Ministry of Science and Innovation for funding this work with Fellowship FPU18/05371, the funding that was obtained by Project UMA18FEDERJA060 from the Junta de Andalucía and the “Plan Propio, University of Málaga”. Finally, the financial support of the EU H2020 WIDESPREAD Program entitled Bionanosens grant agreement # 951887. Funding for open access charge: Universidad de Málaga/CBUA.
Institutional Review Board Statement
Not applicable.
Informed Consent Statement
Not applicable.
Conflicts of Interest
The authors declare no conflict of interest.
References
- Oliver, W.T.; Wells, J.E. Lysozyme as an Alternative to Growth Promoting Antibiotics in Swine Production. J. Anim. Sci. Biotechnol. 2015, 6, 35. [Google Scholar] [CrossRef] [PubMed]
- Liang, A.; Tang, B.; Hou, H.P.; Sun, L.; Luo, A.Q. A Novel CuFe2O4 Nanospheres Molecularly Imprinted Polymers Modified Electrochemical Sensor for Lysozyme Determination. J. Electroanal. Chem. 2019, 853, 113465. [Google Scholar] [CrossRef]
- Wei, X.; Wang, Y.; Chen, J.; Ni, R.; Meng, J.; Liu, Z.; Xu, F.; Zhou, Y. Ionic Liquids Skeleton Typed Magnetic Core-Shell Molecularly Imprinted Polymers for the Specific Recognition of Lysozyme. Anal. Chim. Acta 2019, 1081, 81–92. [Google Scholar] [CrossRef]
- Hashemi, M.M.; Aminlari, M.; Moosavinasab, M. Preparation of and Studies on the Functional Properties and Bactericidal Activity of the Lysozyme-Xanthan Gum Conjugate. Food Sci. Technol. 2014, 57, 594–602. [Google Scholar] [CrossRef]
- Ruan, E.D.; Wang, H.; Ruan, Y.; Juárez, M. Characteristics of Glycation and Glycation Sites of Lysozyme by Matrix-Assisted Laser Desorption/Ionization Time of Flight/Timeof-Flight Mass Spectrometry and Liquid Chromatography-Electrospray Ionization Tandem Mass Spectrometry. Eur. J. Mass Spectrom. 2014, 20, 327–336. [Google Scholar] [CrossRef]
- Yang, M.W.; Wu, W.H.; Ruan, Y.J.; Huang, L.M.; Wu, Z.; Cai, Y.; Fu, F.F. Ultra-Sensitive Quantification of Lysozyme Based on Element Chelate Labeling and Capillary Electrophoresis-Inductively Coupled Plasma Mass Spectrometry. Anal. Chim. Acta 2014, 812, 12–17. [Google Scholar] [CrossRef]
- Kerkaert, B.; Mestdagh, F.; de Meulenaer, B. Detection of Hen’s Egg White Lysozyme in Food: Comparison between a Sensitive HPLC and a Commercial ELISA Method. Food Chem. 2010, 120, 580–584. [Google Scholar] [CrossRef]
- Carstens, C.; Deckwart, M.; Webber-Witt, M.; Schäfer, V.; Eichhorn, L.; Brockow, K.; Fischer, M.; Christmann, M.; Paschke-Kratzin, A. Evaluation of the Efficiency of Enological Procedures on Lysozyme Depletion in Wine by an Indirect ELISA Method. J. Agric. Food Chem. 2014, 62, 6247–6253. [Google Scholar] [CrossRef]
- Zhang, F.; Zhao, Y.-Y.; Chen, H.; Wang, X.-H.; Chen, Q.; He, P.-G. Sensitive Fluorescence Detection of Lysozyme Using a Tris(Bipyridine)Ruthenium(II) Complex Containing Multiple Cyclodextrins. Chem. Commun. 2015, 51, 52. [Google Scholar] [CrossRef]
- Zhang, X.; Yang, S.; Jiang, R.; Sun, L.; Pang, S.; Luo, A. Fluorescent Molecularly Imprinted Membranes as Biosensor for the Detection of Target Protein. Sens. Actuators B Chem. 2018, 254, 1078–1086. [Google Scholar] [CrossRef]
- Chen, Z.; Xu, Q.; Tang, G.; Liu, S.; Xu, S.; Zhang, X. A Facile Electrochemical Aptasensor for Lysozyme Detection Based on Target-Induced Turn-off of Photosensitization. Biosens. Bioelectron. 2019, 126, 412–417. [Google Scholar] [CrossRef] [PubMed]
- Huang, L.; Lu, Y.; Wu, Z.; Li, M.; Xiang, S.; Ma, X.; Zhang, Z. A Facile Approach to Preparing Molecularly Imprinted Chitosan for Detecting 2,4,6-Tribromophenol with a Widely Linear Range. Environments 2017, 4, 30. [Google Scholar] [CrossRef]
- Arshad, R.; Rhouati, A.; Hayat, A.; Nawaz, M.H.; Yameen, M.A.; Mujahid, A.; Latif, U. MIP-Based Impedimetric Sensor for Detecting Dengue Fever Biomarker. Appl. Biochem. Biotechnol. 2020, 191, 1384–1394. [Google Scholar] [CrossRef] [PubMed]
- Selvolini, G.; Marrazza, G. MIP-Based Sensors: Promising New Tools for Cancer Biomarker Determination. Sensors 2017, 17, 718. [Google Scholar] [CrossRef]
- Xing, R.; Wang, S.; Bie, Z.; He, H.; Liu, Z. Preparation of Molecularly Imprinted Polymers Specific to Glycoproteins, Glycans and Monosaccharides via Boronate Affinity Controllable-Oriented Surface Imprinting. Nat. Protoc. 2017, 12, 964–987. [Google Scholar] [CrossRef]
- Menon, S.; Jesny, S.; Girish Kumar, K. A Voltammetric Sensor for Acetaminophen Based on Electropolymerized-Molecularly Imprinted Poly(o-Aminophenol) Modified Gold Electrode. Talanta 2018, 179, 668–675. [Google Scholar] [CrossRef]
- Prasad, B.B.; Singh, R.; Kumar, A. Synthesis of Fullerene (C60-Monoadduct)-Based Water-Compatible Imprinted Micelles for Electrochemical Determination of Chlorambucil. Biosens. Bioelectron. 2017, 94, 115–123. [Google Scholar] [CrossRef]
- Cui, B.; Liu, P.; Liu, X.; Liu, S.; Zhang, Z. Molecularly Imprinted Polymers for Electrochemical Detection and Analysis: Progress and Perspectives. J. Mater. Res. Technol. 2020, 9, 12568–12584. [Google Scholar] [CrossRef]
- Stevenson, D.; El-Sharif, H.F.; Reddy, S.M. Selective Extraction of Proteins and Other Macromolecules from Biological Samples Using Molecular Imprinted Polymers. Bioanalysis 2016, 8, 2255–2263. [Google Scholar] [CrossRef]
- Peña, I.; Cabezas, C. Rotational Spectra of van Der Waals Complexes: Pyrrole-Ne and Pyrrole-Ne2. Phys. Chem. Chem. Phys. 2020, 22, 25652–25660. [Google Scholar] [CrossRef]
- Yan, C.; Liu, X.; Zhang, R.; Chen, Y.; Wang, G. A Selective Strategy for Determination of Ascorbic Acid Based on Molecular Imprinted Copolymer of O-Phenylenediamine and Pyrrole. J. Electroanal. Chem. 2016, 780, 276–281. [Google Scholar] [CrossRef]
- Zouaoui, F.; Bourouina-Bacha, S.; Bourouina, M.; Alcacer, A.; Bausells, J.; Martin, M.; Bessueille, F.; Minot, S.; Jaffrezic-Renault, N.; Zine, N.; et al. Theoretical Study and Analytical Performance of a Lysozyme Impedimetric Microsensor Based on a Molecularly Imprinted Chitosan Film. Sens. Actuators B Chem. 2021, 339, 129903. [Google Scholar] [CrossRef]
- Ertuğrul Uygun, H.D.; Demir, M.N. A Novel Fullerene-Pyrrole-Pyrrole-3-Carboxylic Acid Nanocomposite Modified Molecularly Imprinted Impedimetric Sensor for Dopamine Determination in Urine. Electroanalysis 2020, 32, 1971–1976. [Google Scholar] [CrossRef]
- Fadillah, G.; Wicaksono, W.P.; Fatimah, I.; Saleh, T.A. A Sensitive Electrochemical Sensor Based on Functionalized Graphene Oxide/SnO2 for the Determination of Eugenol. Microchem. J. 2020, 159, 105353. [Google Scholar] [CrossRef]
- Panraksa, Y.; Siangproh, W.; Khampieng, T.; Chailapakul, O.; Apilux, A. Paper-Based Amperometric Sensor for Determination of Acetylcholinesterase Using Screen-Printed Graphene Electrode. Talanta 2018, 178, 1017–1023. [Google Scholar] [CrossRef]
- Ziyatdinova, G.; Gimadutdinova, L. Cerium(IV) and Iron(III) Oxides Nanoparticles Based Voltammetric Sensor for the Sensitive and Selective Determination of Lipoic Acid. Sensors 2021, 21, 7639. [Google Scholar] [CrossRef]
- Gao, B.; Hu, C.; Fu, H.; Sun, Y.; Li, K.; Hu, L. Preparation of Single-Layer Graphene Based on a Wet Chemical Synthesis Route and the Effect on Electrochemical Properties by Double Layering Surface Functional Groups to Modify Graphene Oxide. Electrochim. Acta 2020, 361, 137053. [Google Scholar] [CrossRef]
- Montoro-Leal, P.; García-Mesa, J.C.; Morales-Benítez, I.; García de Torres, A.; Vereda Alonso, E. Semiautomatic Method for the Ultra-Trace Arsenic Speciation in Environmental and Biological Samples via Magnetic Solid Phase Extraction Prior to HPLC-ICP-MS Determination. Talanta 2021, 235, 122769. [Google Scholar] [CrossRef]
- Montoro-Leal, P.; García-Mesa, J.C.; Lopez Guerrero, M.d.M.; Vereda Alonso, E. Comparative Study of Synthesis Methods to Prepare New Functionalized Adsorbent Materials Based on MNPs–GO Coupling. Nanomaterials 2020, 10, 304. [Google Scholar] [CrossRef]
- Do Nascimento, T.A.; de Oliveira, H.L.; Borges, K.B. Magnetic Molecularly Imprinted Polypyrrole as a New Selective Adsorbent for Pharmaceutically Active Compounds. J. Environ. Chem. Eng. 2019, 7, 103371. [Google Scholar] [CrossRef]
- Li, G.; Qi, X.; Wu, J.; Xu, L.; Wan, X.; Liu, Y.; Chen, Y.; Li, Q. Ultrasensitive, label-free voltammetric determination of norfloxacin based on molecularly imprinted polymers and Au nanoparticle-functionalized black phosphorus nanosheet nanocomposite. J. Hazard. Mater. 2022, 436, 129107. [Google Scholar] [CrossRef] [PubMed]
- Li, G.; Wu, J.; Qi, X.; Wan, X.; Liu, Y.; Chen, Y.; Xu, L. Molecularly imprinted polypyrrole film-coated poly(3,4-ethylenedioxythiophene): Polystyrene sulfonate-functionalized black phosphorene for the selective and robust detection of norfloxacin. Mater. Today Chem. 2022, 26, 101043. [Google Scholar] [CrossRef]
- González Moreno, A.; López Guerrero, M.M.; Vereda Alonso, E.; García de Torres, A.; Pavón, J.M.C. Development of a New FT-IR Method for the Determination of Iron Oxide. Optimization of the Synthesis of Suitable Magnetic Nanoparticles as Sorbent in Magnetic Solid Phase Extraction. New J. Chem. 2017, 41, 8804–8811. [Google Scholar] [CrossRef]
- Diagboya, P.N.; Olu-Owolabi, B.I.; Zhou, D.; Han, B.-H. Graphene Oxide–Tripolyphosphate Hybrid Used as a Potent Sorbent for Cationic Dyes. Carbon 2014, 79, 174–182. [Google Scholar] [CrossRef]
- Kozak, M.; Domka, L. Adsorption of the Quaternary Ammonium Salts on Montmorillonite. J. Phys. Chem. Solids 2004, 65, 441–445. [Google Scholar] [CrossRef]
- Dasog, M.; Kraus, S.; Sinelnikov, R.; Veinot, J.G.C.; Rieger, B. CO2 to Methanol Conversion Using Hydride Terminated Porous Silicon Nanoparticles. Chem. Commun. 2017, 53, 3114–3117. [Google Scholar] [CrossRef]
- Dallas, P.; Niarchos, D.; Vrbanic, D.; Boukos, N.; Pejovnik, S.; Trapalis, C.; Petridis, D. Interfacial Polymerization of Pyrrole and in Situ Synthesis of Polypyrrole/Silver Nanocomposites. Polymer 2007, 48, 2007–2013. [Google Scholar] [CrossRef]
- Lim, G.W.; Lim, J.K.; Ahmad, A.L.; Chan, D.J.C. Fluorescent Molecularly Imprinted Polymer Based on Navicula Sp. Frustules for Optical Detection of Lysozyme. Anal. Bioanal. Chem. 2016, 408, 2083–2093. [Google Scholar] [CrossRef]
- Fang, M.; Zhuo, K.; Chen, Y.; Zhao, Y.; Bai, G.; Wang, J. Fluorescent Probe Based on Carbon Dots/Silica/Molecularly Imprinted Polymer for Lysozyme Detection and Cell Imaging. Anal. Bioanal. Chem. 2019, 411, 5799–5807. [Google Scholar] [CrossRef]
- Bai, Y.; Zhao, R.; Feng, F.; He, X. Determination of Lysozyme by Thiol-Terminated Aptamer-Based Surface Plasmon Resonance. Anal. Lett. 2017, 50, 682–689. [Google Scholar] [CrossRef]
- Cheng, C.-Y.; Wang, M.-Y.; Suen, S.-Y. Eco-Friendly Polylactic Acid/Rice Husk Ash Mixed Matrix Membrane for Efficient Purification of Lysozyme from Chicken Egg White. J. Taiwan Inst. Chem. Eng. 2020, 111, 11–23. [Google Scholar] [CrossRef]
Publisher’s Note: MDPI stays neutral with regard to jurisdictional claims in published maps and institutional affiliations. |
© 2022 by the authors. Licensee MDPI, Basel, Switzerland. This article is an open access article distributed under the terms and conditions of the Creative Commons Attribution (CC BY) license (https://creativecommons.org/licenses/by/4.0/).