Communication

A Smartphone Integrated Platform for Ratiometric Fluorescent Sensitive and Selective Determination of Dipicolinic Acid

1
School of Marine and Biological Engineering, Yancheng Teachers University (YCTU), Yancheng 224002, China
2
Department of Basic Medical Science, Jiangsu Vocational College of Medicine, Yancheng 224005, China
*
Authors to whom correspondence should be addressed.
Biosensors 2022, 12(8), 668; https://doi.org/10.3390/bios12080668
Submission received: 5 July 2022 / Revised: 2 August 2022 / Accepted: 17 August 2022 / Published: 22 August 2022

Abstract

:
A desirable lanthanide-based ratiometric fluorescence probe was designed as a multifunctional nanoplatform for the determination of dipicolinic acid (DPA), a unique bacterial endospore biomarker, with high selectivity and sensitivity. The carbon dots (CDs) with blue emission wavelengths at 470 nm are developed with europium ion (Eu3+) to form Eu3+/CDs fluorescent probes. DPA can specifically combine with Eu3+ and then transfer energy from DPA to Eu3+ sequentially through the antenna effect, resulting in a distinct increase in the red fluorescence emission peak at 615 nm. The fluorescence intensity ratio of Eu3+/CDs (fluorescence intensity at 615 nm/fluorescence intensity at 470 nm) showed good linearity and low detection limit. The developed ratiometric nanoplatform possesses great potential for application in complex matrices owing to its specificity for DPA. In addition, the integration of a smartphone with the Color Picker APP installed enabled point-of-care testing (POCT) with quantitative measurement capabilities, confirming the great potential of the as-prepared measurement platform for on-site testing.

1. Introduction

Inhalation of 104 or more concentration of Bacillus anthracis (B. anthracis) spores can lead to a mortality of as high as 75%, even within 24 to 48 h of drug treatment [1,2], indicating that B. anthracis spores poses a serious threat to human health and public safety [3,4]. Therefore, sensitive and selective determination of B. anthracis spores had a critical role to play in early clinical diagnosis and preventing disease outbreaks [5,6]. Dipicolinic acid (DPA), making up approximately 5–15% of the dry weight of anthrax spores, was an extremely important component and major biomarker of anthrax spores [7,8,9,10]. Consequently, the level of anthrax spores could be detected and evaluated through the concentration of DPA. Recently, although considerable strategies for the determination of DPA had been constructed, including electrochemical assays, Surface-enhanced Raman spectroscopy (SERS), mass spectrometry (MS), colorimetric methods, etc. [11,12]. These strategies are usually cumbersome, time-consuming and require large instruments, which may not be suitable for on-site rapid detection of DPA. In general, fluorescence-based sensing was a promising optical candidate for addressing the above-mentioned problems in DPA determination [13,14,15]. However, the further application of fluorescent probes was greatly restricted by the shortcomings of their used currently, such as complicated synthesis processes, poor fluorescence stability and low sensitivity [16].
Lanthanide-based fluorescence nanoprobes had been constructed and employed to the determination of targeting on account of that special optical properties such as large Stokes shifts, long fluorescent lifetimes and high fluorescence stability [17,18,19,20]. In fluorescence measurements, DPA acted as a single ligand coordinated with Eu3+ or terbium ions (Tb3+) and then sensitized lanthanide ions emission by transferring excitation energy to the lanthanide ions by an “antenna effect”, a strategy that can be employed to sensing of DPA levels [21,22]. Ratiometric fluorescence detection strategies, recording fluorescence emission at two different wavelengths, had attracted increasing attention and interest from researchers because of the increased accuracy and reproducibility of target assays as well as the reduction of false positive or false negative signal results compared to strategies with a single emission signal [23,24,25,26,27].
Herein, a desirable ratiometric fluorescence platform was fabricated for the highly sensitive and selective detection of the B. anthracis biomarker DPA by integrating Eu3+ and CDs (Eu3+/CDs) in Scheme 1. Taking into consideration fully the coordination binding of DPA to Eu3+ in the complex of Eu3+/CDs, the formed complex of Eu3+/DPA then emitted a red fluorescence while the blue fluorescence of CDs was not changed. Therefore, the fluorescence ratio (F615/F470) of red fluorescence to blue fluorescence as a signal can be augmented with increasing concentrations of DPA. Furthermore, the developed strategy was further utilized for the sensitivity detection of DPA in real samples by integrating a smartphone with Color Picker APP. The ratiometric fluorescence sensing platform based on Eu3+/CDs fluorescent probes has the ability to rapidly detect DPA in the field and thus assess the infection level of anthrax spores, which has great potential in food safety and healthcare.

2. Materials and Methods

2.1. Materials and Reagents

Chemicals including Eu(NO3)3⋅6H2O, dipicolinic acid (DPA) were purchased from Aladdin Reagent Co., Ltd. (Shanghai, China). Polyethylenimine was purchased from Sigma-Aldrich. Citric acid, glutamic acid (Glu), cysteine (Cys), glutathione (GSH), adenosine triphosphate (ATP), sodium chloride (KCl), ferric chloride hexahydrate (FeCl3·6H2O), zinc nitrate (ZnNO3) and nickel chloride hexahydrate (NiCl2·6H2O) were purchased from Sinopharm Group Chemical Reagent Co., Ltd. Milk was purchased from the local supermarket.

2.2. Preparation of CDs

CDs were synthesized according to reported work [28]. First, the citric acid and polyethylenimine was dissolved in 10 mL DI water under stirring. Then, the mixture solution was poured into a poly(p-phenol)-lined stainless-steel autoclave and heated at 200 °C for 5 h. After that, the obtained solution was dialyzed to remove unreacted impurities.

2.3. Determination of DPA with Eu3+/CDs Sensing System

To determine the optimal incubation time, the DPA (100 μM) was incubated and stirred with Eu3+/CDs in Phosphate Buffer (PB) (10 mM, pH = 7.5) for different minutes (1–20 min) at 25 °C. Then, the fluorescence intensity of the sensing system was recorded by fluorescence spectrometry at 285 nm excitation. Similarly, only the incubation temperature (25–55 °C) was changed in above sensing system to determine the optimal incubation temperature. After adding Eu3+/CDs into PB, the DPA with different concentrations (0–200 μM) was added above the solution and stirred for 10 min at 25 °C. Then, the fluorescence intensity of the sensing system was recorded by fluorescence spectrometry at 285 nm excitation. For interference experiments, the DPA, GSH, Cys, Glu, ATP, Cl, Zn2+, Ni2+ and Fe3+ were added to Eu3+/CDs solution, respectively. The final concentration of DPA and other interfering substances was 50 μM. Finally, the emission spectra at 285 nm excitation of these reaction solutions were recorded.

2.4. DPA Sensing in Real Samples

As for DPA detection in real samples, milk was selected as samples. The purchased milk was treated in the same way as previously reported [29]. In order to remove proteins, the purchased milk was sonicated for 30 min with trichloroacetic acid and then the mixture was centrifuged for 5 min. The filter paper was used to filter the supernatant to remove the lipids. DPA with various concentrations (0, 10, 20 and 50 μM) was spiked into the treated milk for further analysis, which then were added into the Eu3+/CDs sensing system. The fluorescence responses were measured under the excitation at 285 nm after incubating for 10 min.

2.5. The Smartphone-Integrated Assay for DPA Detection

For the smartphone-based assay for DPA detection, the samples were incubated with Eu3+/CDs and stirred for 10 min. Then, the fluorescent image was recorded and analyzed using the Color Picker APP on the smartphone to access its RGB intensity for analysis. It is worth noting that the samples were placed in a dark lamphouse to avoid environmental interference.

3. Results

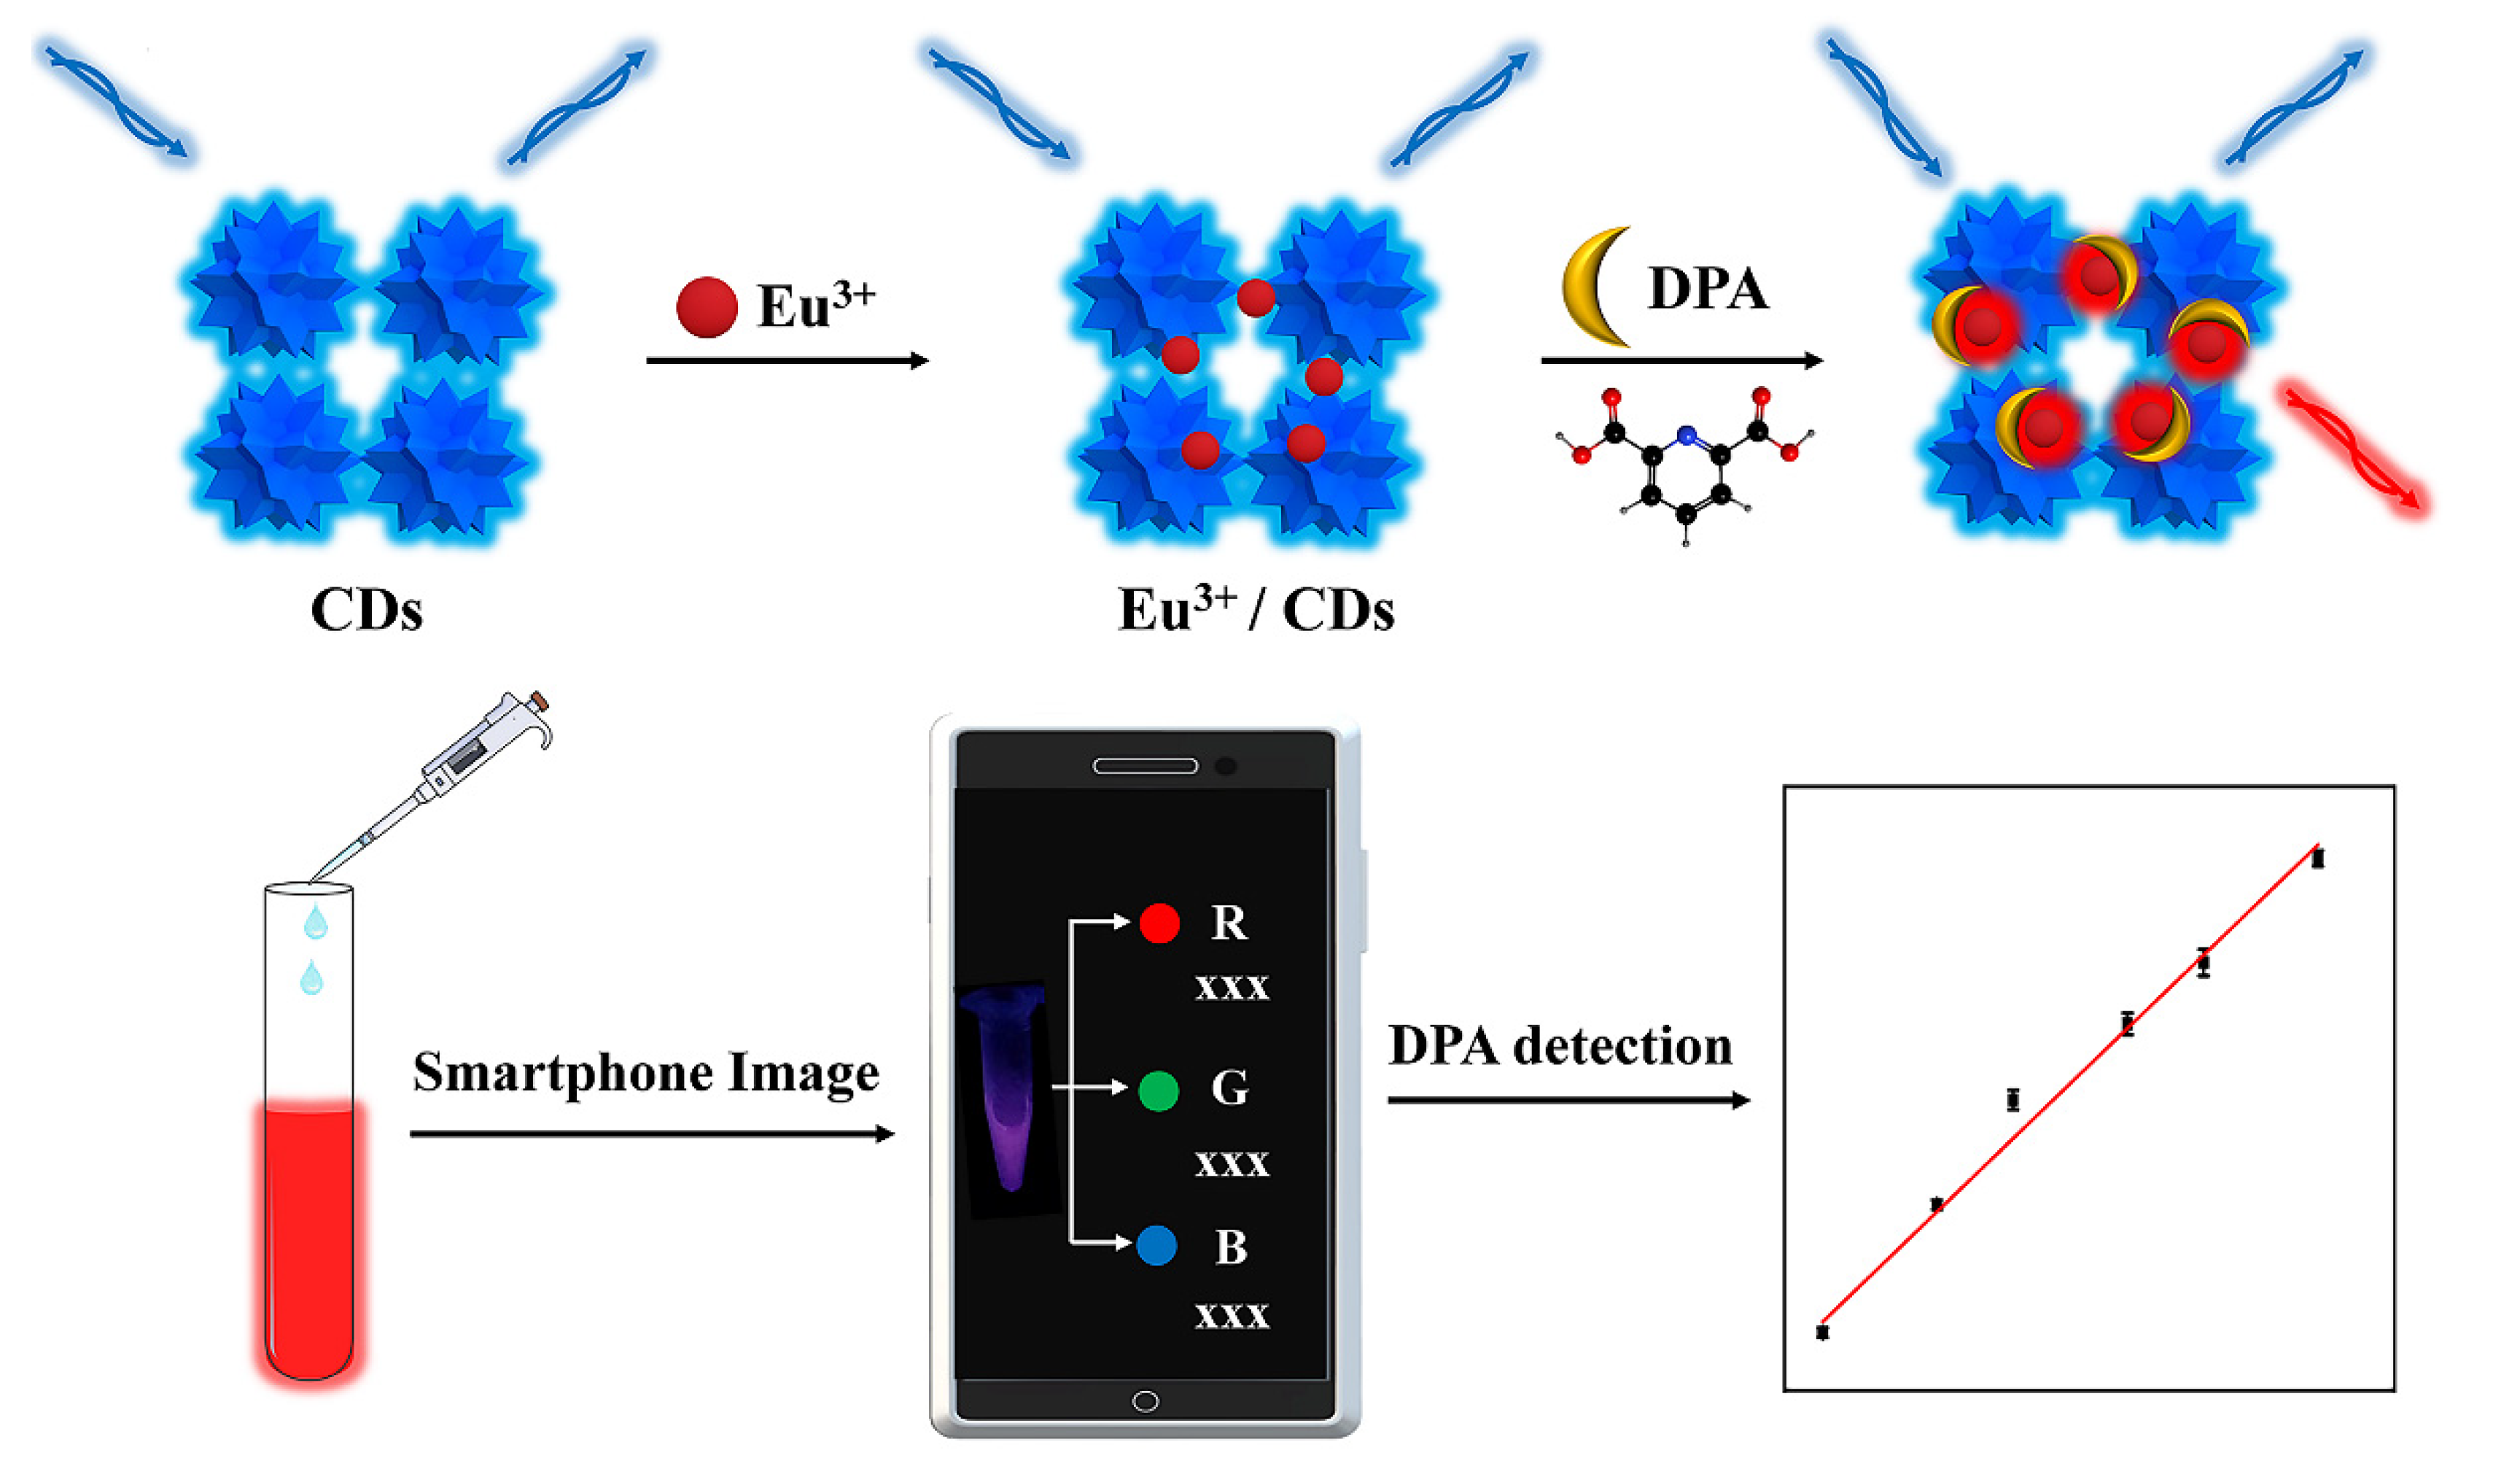
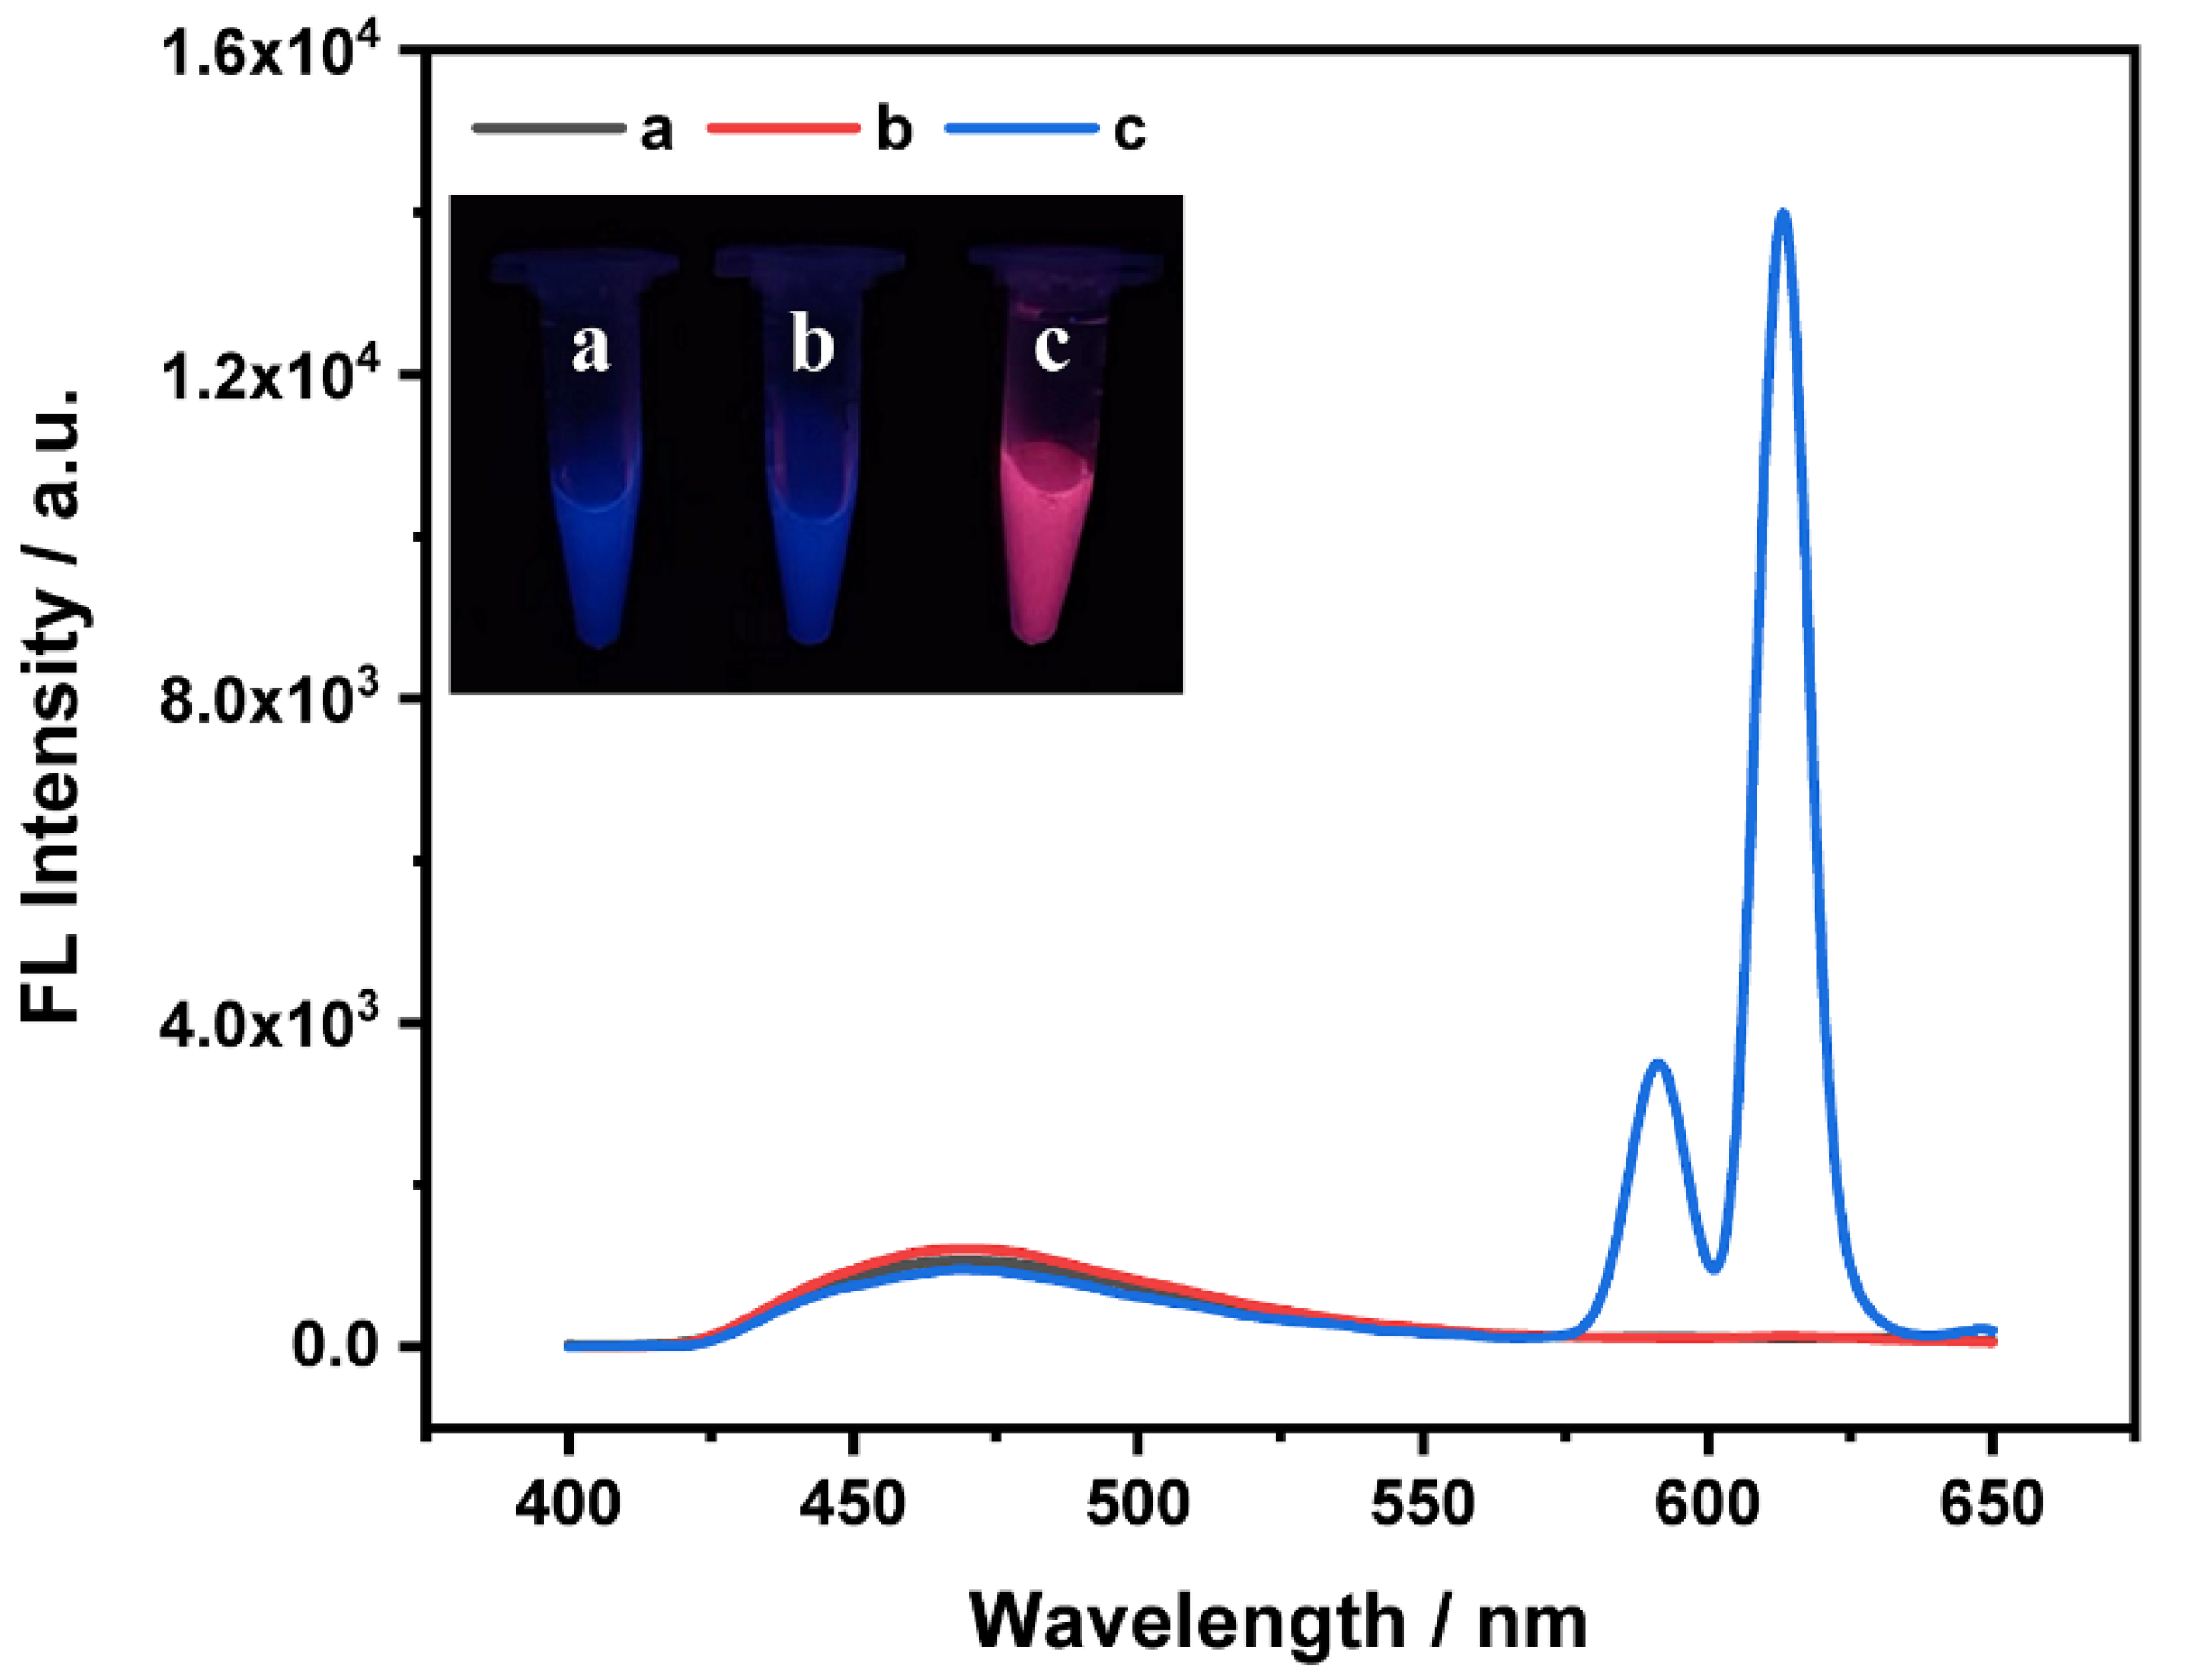
3.1. The Principle of Ratiometric Fluorescence Strategy for DPA Determination

The ligand-containing DPA coordinated with Eu3+ and the triplet excited state of the ligand transferred energy to the emitting state of Eu3+ to enhance the fluorescence intensity (Figure S1 in Supplementary), which then directly detect DPA [30,31]. Considering that a single variation in signal was susceptible to environmental interference, a ratiometric fluorescent sensor was constructed to overcome these problems and improve the sensitivity and selectivity. As shown in Figure 1, the CDs emitted bright blue fluorescence at 470 nm (curve a), and its fluorescence intensity was not compromised when adding Eu3+ (curve b). The blue fluorescence can be obviously observed under the UV irradiation, seen in the insert photos. In the presence of DPA, the combined with the complex of Eu3+/CDs can obviously enhance the fluorescence at 615 nm due to the occurrence of antenna effect, while the blue fluorescence kept stability (curve c). The red fluorescence was easily found, seen in the insert photo. Therefore, the ratiometric strategy was established to sense the target based on the ratio of F615/F470 against increasing concentrations of DPA, which also provided the basis for intelligent detection using the smartphone with Color Picker APP. Here, the F615 and F470 were the fluorescence emission intensity of Eu3+/DPA at 615 nm and the CDs fluorescence emission intensity at 470 nm, respectively.

3.2. Optimization of Detection Experimental Conditions

To guarantee the high sensitivity and stability of the Eu3+/CDs nanoplatform for target monitoring, several important factors were investigated and optimized, including the concentration of Eu3+, reaction temperature and incubation time. The concentration of Eu3+ was a key factor in the sensitivity of the assays. It can be seen that the blue fluorescent CDs maintains a stable fluorescence intensity with increasing the concentration of Eu3+ from 0 to 500 μM, which indicates that CDs can be used as an internal parameter (Figure 2A). Due to the energy transfer from DPA to Eu3+, the red fluorescence intensity increased significantly after adding different concentrations of Eu3+ (Figure 2B). The fluorescence ratio of F615/F470 was augmented with concentration of Eu3+ and reached a plateau at 50 μM. Here, the F615 and F470 were the emitted fluorescence intensity of Eu3+/DPA at 615 nm and the CDs at 470 nm, respectively. Thus, Eu3+ at 50 μM was selected for the detection of DPA in the following experiments. In order to investigate whether the experiment can be performed in the field for rapid detection, the temperature and reaction time of testing were crucial. Learn from Figure 2C,D, the reaction of Eu3+ and DPA can be carried out rapidly at room temperature and takes only 10 min, indicating that the system had the capability of detecting DPA in a short time and with high stability, providing an important guarantee for subsequent field testing.

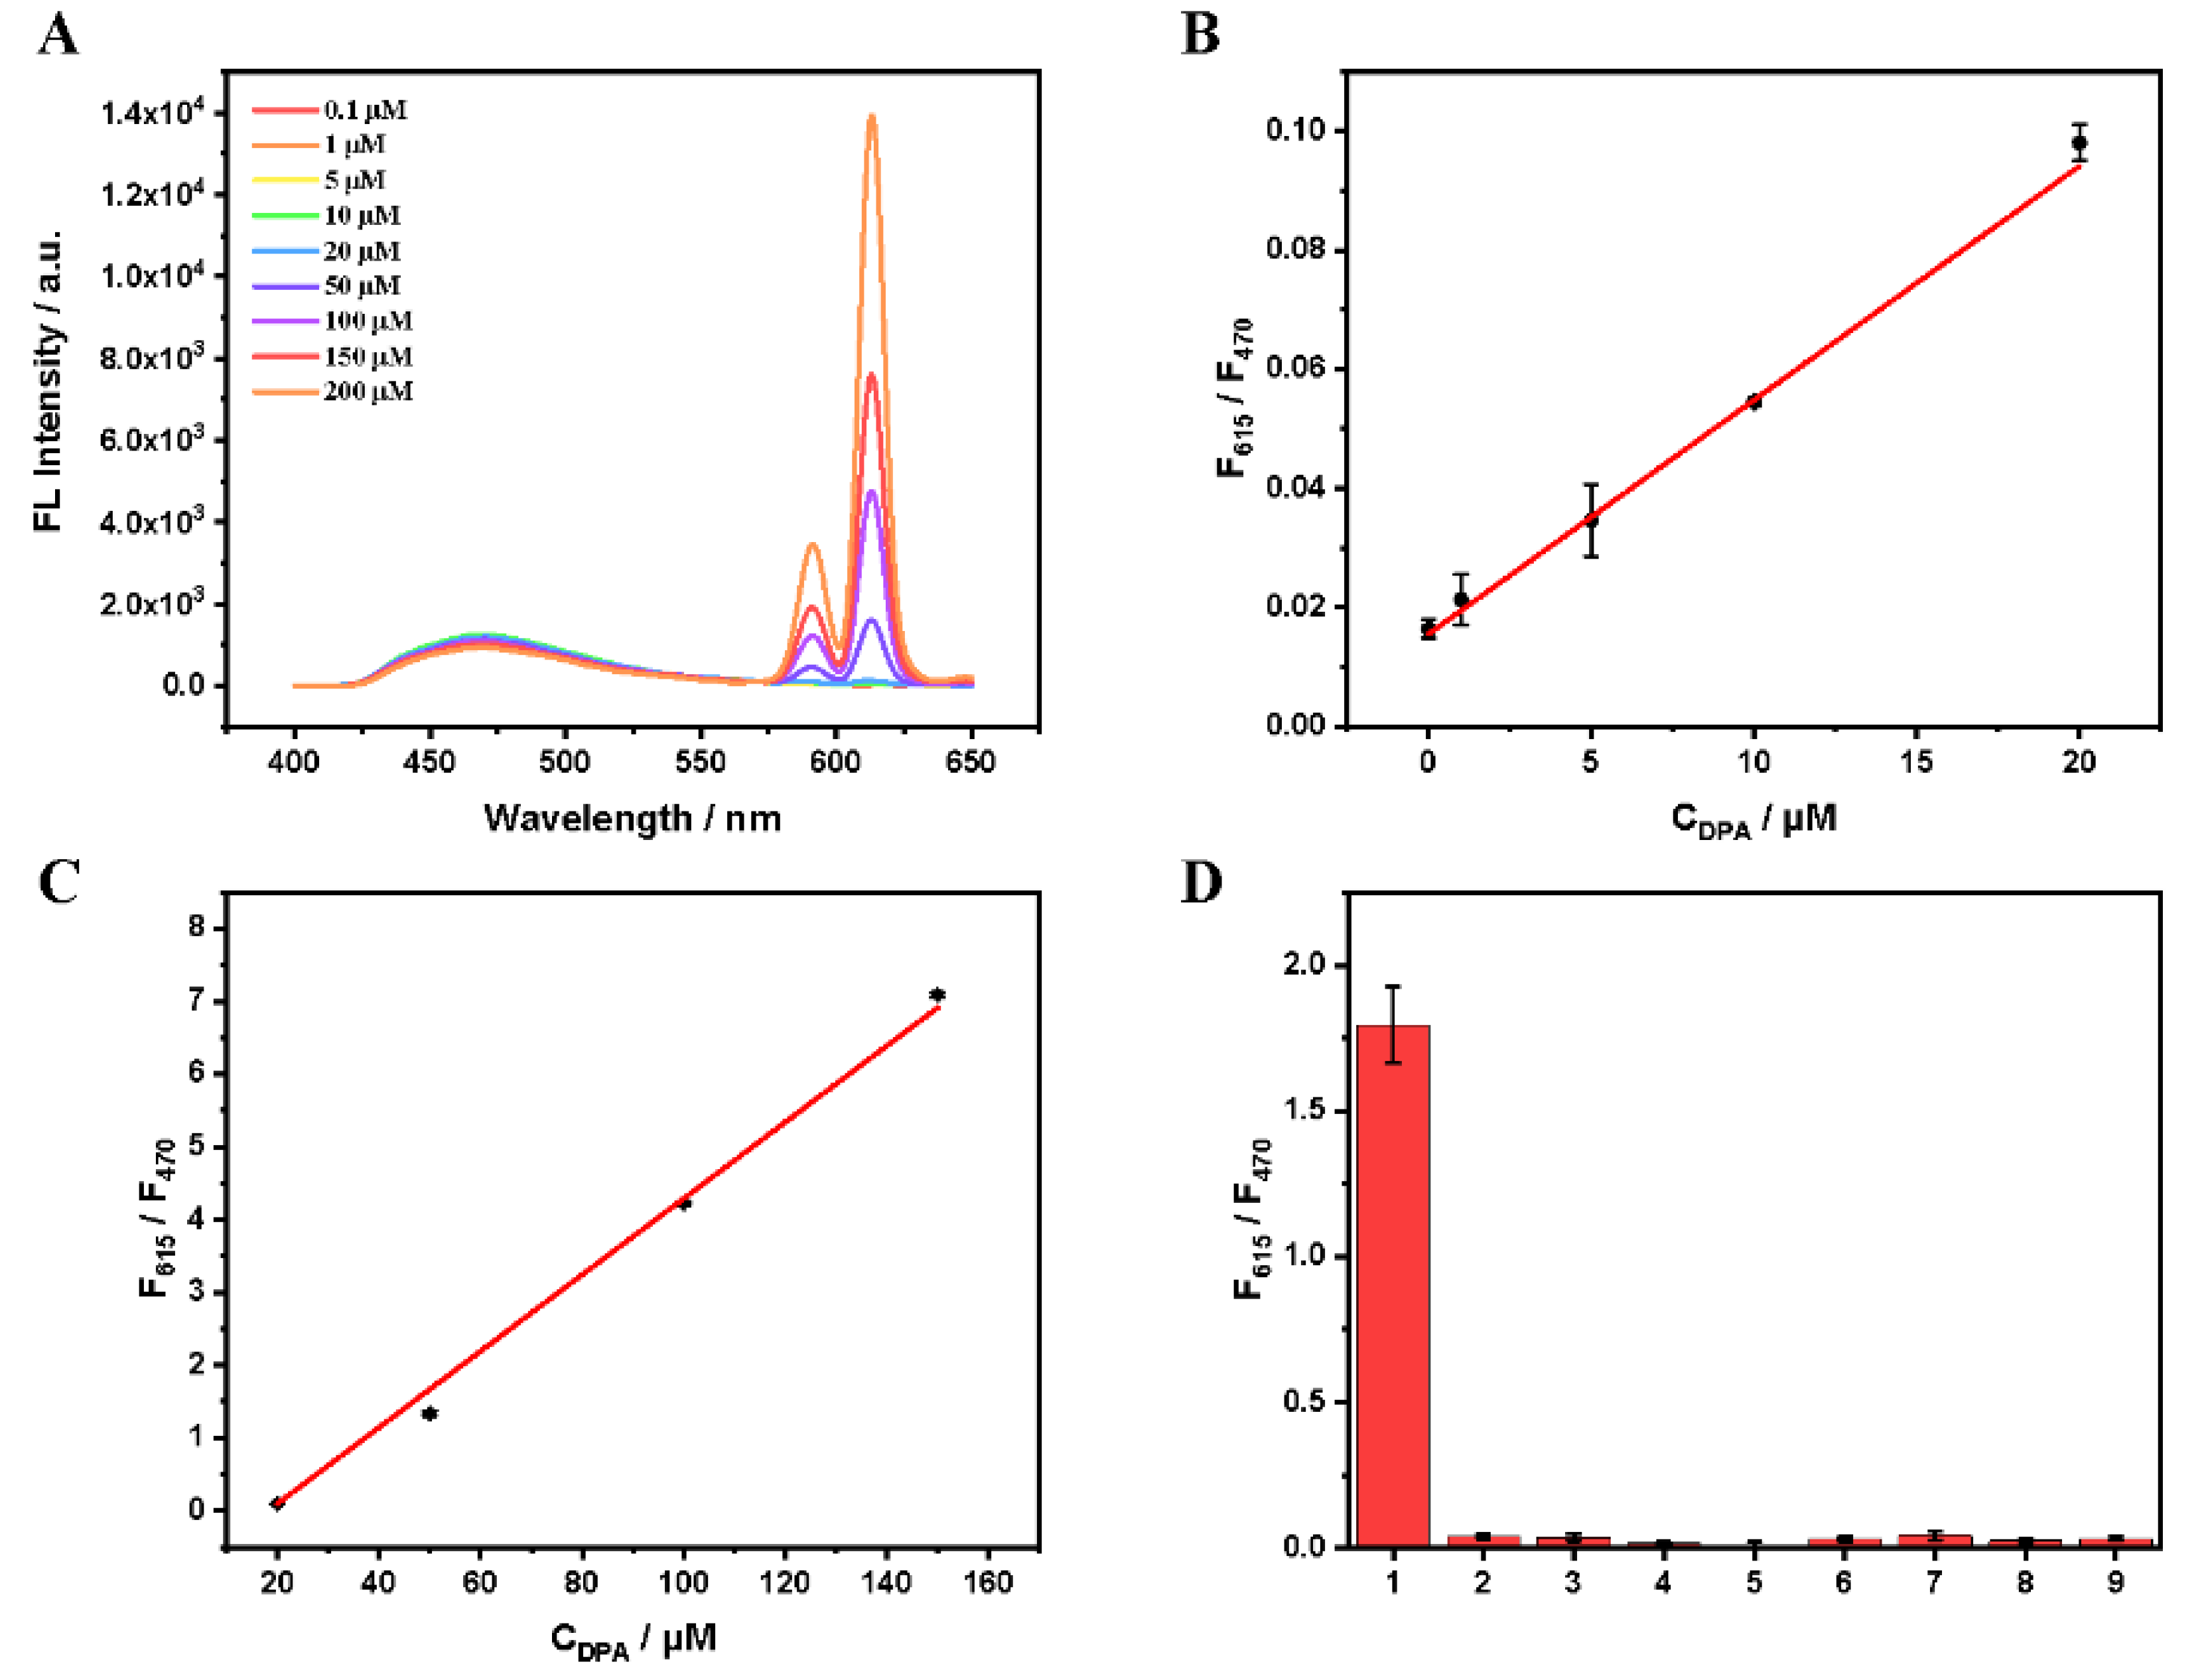
3.3. The DPA Detection with Eu3+/CDs Probe

Under the optimal reaction conditions, the detection sensitivity of the as-prepared Eu3+/CDs probe was examined by monitoring the ratio fluorescence response of the detection system as a function of different concentrations of DPA in Figure 3A. As the concentration of DPA increased from 0 to 200 μM, the coordination complex Eu3+/DPA was formed, resulting in augmented red fluorescence, while the blue emission fluorescence remained relatively constant. To evaluate the sensitivity of the ratiometric fluorescence platform, the ratio of F615/F470 was plotted against different concentrations of DPA, and the variation of ratio in Figure 3B,C was linear over the concentration range of 0–20 μM with a correlation coefficient R2 of 0.9961 and 20–150 μM with a correlation coefficient R2 of 0.9971. The limit of detection (LOD) was calculated to be as low as 1.18 μM according to the three times of signal-to-noise ratio, which confirmed the feasibility of the developed platform. The selectivity was further examined by measuring the fluorescence ratio of the system against other potential interfering analytes. As illustrated in Figure 3D, the fluorescence ratio of the target analyte DPA (50 μM) can be obviously monitored, which was significantly higher than that of other analytes, which proves that only DPA target can cause the change of sensor signal. Therefore, the developed strategy was specific and selective for the detection of DPA and can greatly reduce the influence of other interferents.

3.4. Sensitive Detection of DPA in Real Samples

To further explore the practicality of the proposed strategy, the milk samples with spiking a certain concentration of DPA were selected for the experiment. As displayed in Table 1, no DPA was detected in real samples. Then, the DPA with different concentrations (0, 10, 20, 50 μM) was spiked into the samples and then the same procedure was followed for quantification by the developed platform. The results showed satisfactory recoveries (97–99%) and accuracy (RSD < 4.05%) for detection of DPA, suggesting that the proposed platform can be used to determination the DPA in real food samples.

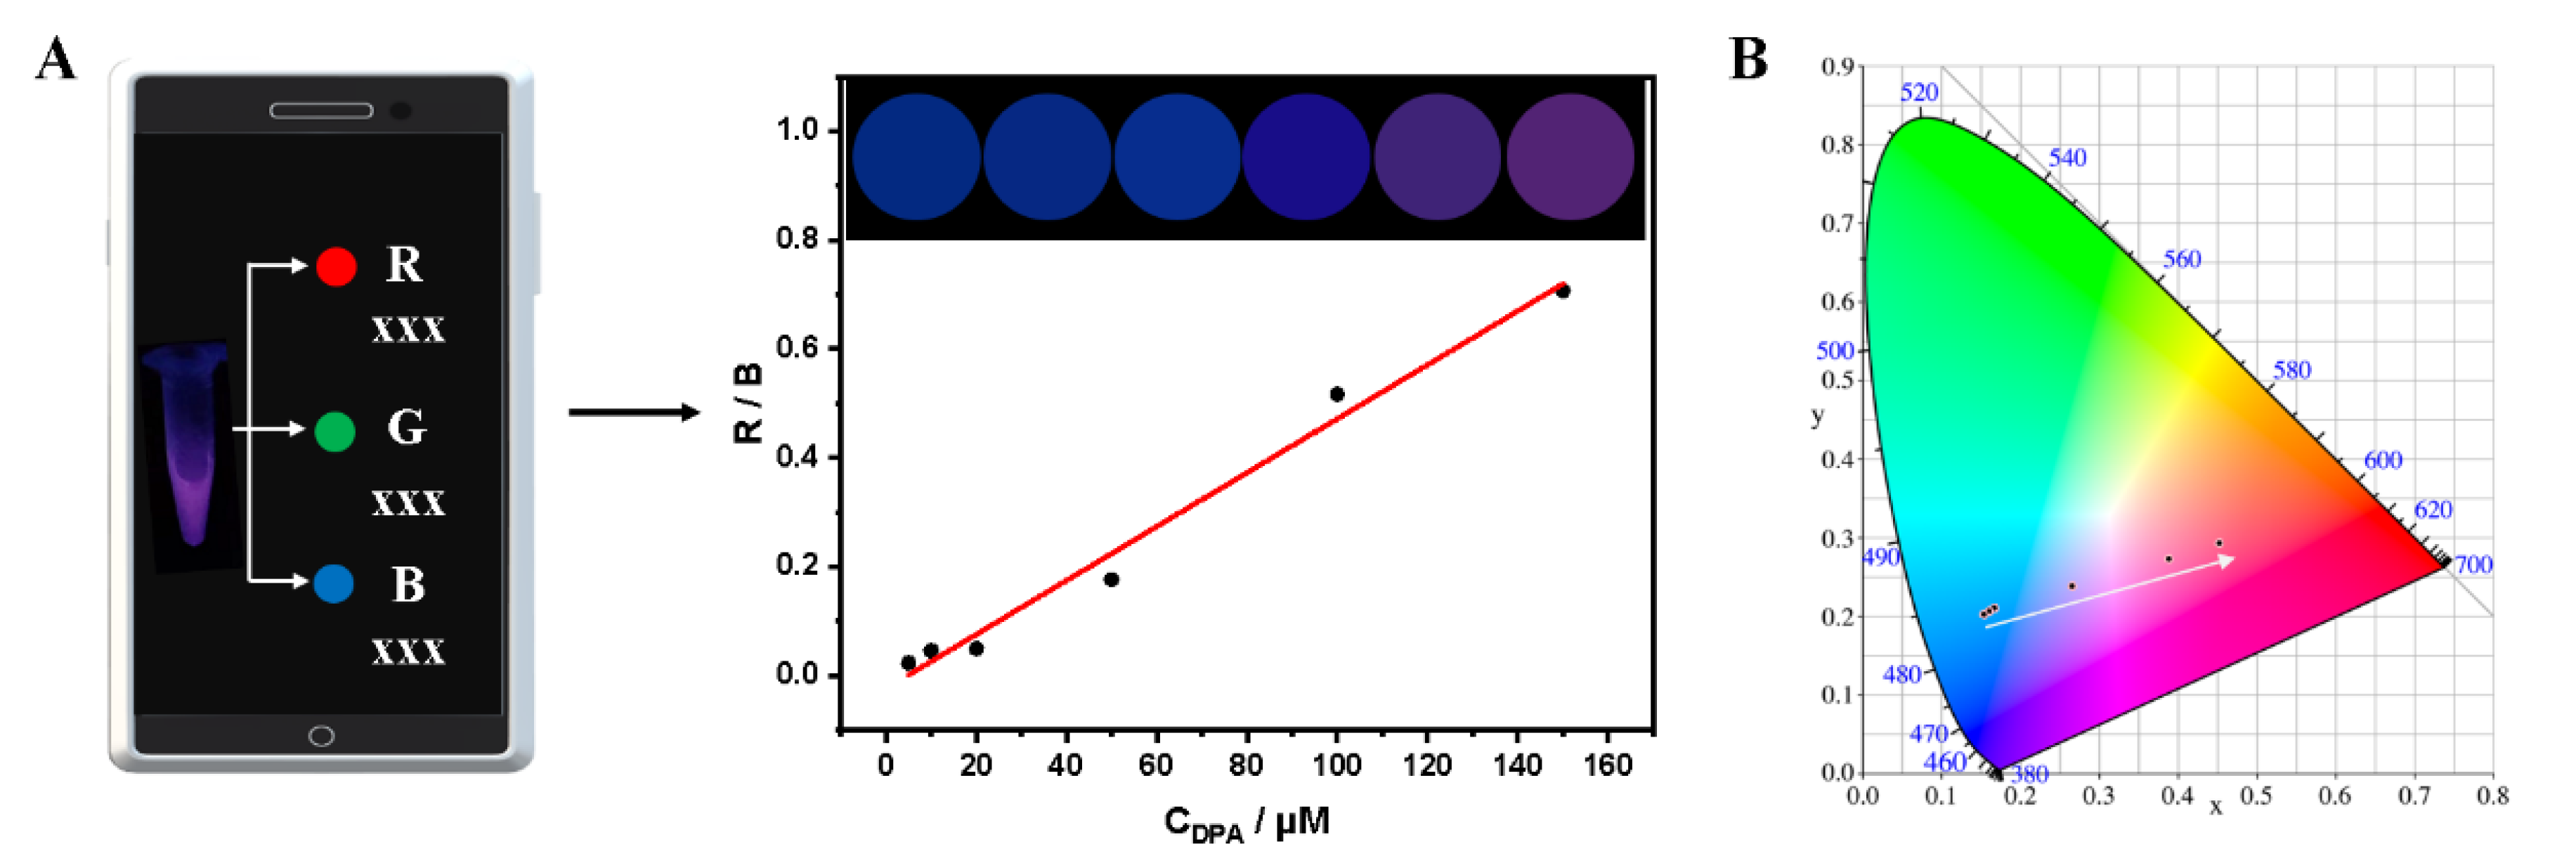
3.5. Smartphone-Integrated DPA Detection in Real Samples

The current fluorescence assays usually require fluorescence spectrometer and specialized researchers, which is not suitable in on-site analysis [32,33,34,35,36,37]. In this research, a smartphone installed a Color Picker APP is used as a signal reader to detect the DPA by integrating with the as-prepared ratiometric fluorescent sensing, Figure 4A. The color of sample-triggered fluorescence photograph can be converted to digital values representing the blue (B), green (G) and red (R) color channels. The blue fluorescence (Blue channel) can gradually convert red fluorescence (Red channel) with increasing concentration of DPA range from 5 to 150 μM under UV light irradiation. Meanwhile, CIE coordinates can also prove the color changes from blue to red in Figure 4B. As shown in Figure 4A, the ration of red (G) to blue (B) channel (R/B) was linearly related in the range of 5 to 150 μM.

4. Conclusions

In summary, a ratiometric fluorescence strategy has been developed for sensitive and selective determination of DPA based on lanthanides-based Eu3+/CDs fluorescent sensor. In addition, the developed strategy can significantly reduce the interface from the complex matrixes and environments and that also improve the practicality and reliability. The determination of DPA is then qualified in real samples, showing the satisfactory recoveries from 97 to 99%. The obtained results of solution fluorescence within increasing concentration of DPA can be quantitatively analyzed by a smartphone loaded Color Picker APP, which can be applied to the POCT with accuracy and stability, exhibiting potential promising application in situ for DPA monitoring.

Supplementary Materials

The following supporting information can be downloaded at: https://www.mdpi.com/article/10.3390/bios12080668/s1, Figure S1: The fluorescence spectra of (a) Eu3+, (b) DPA, and (c) Eu3+/DPA.

Author Contributions

X.L. Conceptualization, Methodology, Supervision, Funding acquisition, Writing—Review & Editing. J.W. (Junsong Wu) Methodology, Validation. H.H. Methodology, Investigation. F.L. Validation, Investigation, Writing—Original Draft. J.W. (Jialian Wang) Methodology, Supervision, Writing—Review & Editing. All authors have read and agreed to the published version of the manuscript.

Funding

This work was supported by the Research on the Open Project program of the Beijing Laboratory of Food Quality and Safety, Beijing Technology and Business University (FQS-202007).

Institutional Review Board Statement

Not applicable.

Data Availability Statement

Not applicable.

Conflicts of Interest

The authors declare no conflict of interest.

References

  1. King, D.; Luna, V.; Cannons, A.; Cattani, J.; Amuso, P. Performance Assessment of Three Commercial Assays for Direct Detection of Bacillus anthracis Spores. J. Clin. Microbiol. 2003, 41, 3454–3455. [Google Scholar] [CrossRef] [PubMed] [Green Version]
  2. Hurtle, W.; Bode, E.; Kulesh, D.A.; Kaplan, R.S.; Garrison, J.; Bridge, D.; House, M.; Frye, M.S.; Loveless, B.; Norwood, D. Detection of the Bacillus anthracis gyrA Gene by Using a Minor Groove Binder Probe. J. Clin. Microbiol. 2004, 42, 179–185. [Google Scholar] [CrossRef] [PubMed] [Green Version]
  3. Enserink, M. This Time it was Real: Knowledge of Anthrax Put to the Test. Science 2001, 294, 490–491. [Google Scholar] [CrossRef] [PubMed]
  4. Zhang, X.Y.; Zhao, J.; Whitney, A.V.; Elam, J.W.; Duyne, R.P.V. Ultrastable Substrates for Surface-Enhanced Raman Spectroscopy:  Al2O3 Overlayers Fabricated by Atomic Layer Deposition Yield Improved Anthrax Biomarker Detection. J. Am. Chem. Soc. 2006, 128, 10304–10309. [Google Scholar] [CrossRef]
  5. Liu, M.L.; Chen, B.B.; He, J.H.; Li, C.M.; Li, Y.F.; Huang, C.Z. Anthrax biomarker: An ultrasensitive fluorescent ratiometry of dipicolinic acid by using terbium (III)-modified carbon dots. Talanta 2019, 191, 443–448. [Google Scholar] [CrossRef]
  6. Cheng, H.W.; Huan, S.Y.; Yu, R.Q. Nanoparticle-based substrates for surface-enhanced Raman scattering detection of bacterial spores. Analyst 2012, 137, 3601–3608. [Google Scholar] [CrossRef]
  7. Bailey, G.F.; Karp, S.; Sacks, L.E. Ultraviolet-Absorption Spectra of Dry Bacterial Spores. J. Bacteriol. 1965, 89, 984–987. [Google Scholar] [CrossRef] [Green Version]
  8. Cable, M.L.; Kirby, J.P.; Sorasaenee, K.; Gray, H.B.; Ponce, A. Bacterial Spore Detection by [Tb3+(macrocycle)(dipicolinate)] Luminescence. J. Am. Chem. Soc. 2007, 129, 1474–1475. [Google Scholar] [CrossRef] [Green Version]
  9. Rode, L.J.; Foster, J.W. Germination of Bacterial Spores by Long-Chain Alkyl Amines. Nature 1960, 188, 1132–1134. [Google Scholar] [CrossRef]
  10. Ratiu, I.A.; Bocos-Bintintan, V.; Patrut, A.; Moll, V.H.; Turner, M.; Thomasd, C.L.P. Discrimination of bacteria by rapid sensing their metabolic volatiles using an aspiration-type ion mobility spectrometer (a-IMS) and gas chromatography-mass spectrometry GC-MS. Anal. Chim. Acta 2017, 982, 209–217. [Google Scholar] [CrossRef]
  11. Li, D.; Truong, T.V.; Bills, T.M.; Holt, B.C.; VanDerwerken, D.N.; Williams, J.R.; Acharya, A.; Robison, R.A.; Tolley, H.D.; Milton, L.; et al. GC/MS Method for Positive Detection of Bacillus anthracis Endospores. Anal. Chem. 2012, 84, 1637–1644. [Google Scholar] [CrossRef]
  12. Shen, M.L.; Liu, B.; Xu, L.; Jiao, H. Ratiometric fluorescence detection of anthrax biomarker 2,6-dipicolinic acid using hetero MOF sensors through ligand regulation. J. Mater. Chem. C 2020, 8, 4392–4400. [Google Scholar] [CrossRef]
  13. Yin, S.N.; Tong, C.L. Europium (III)-Modified Silver Nanoparticles as Ratiometric Colorimetric and Fluorescent Dual-Mode Probes for Selective Detection of Dipicolinic Acid in Bacterial Spores and Lake Waters. ACS Appl. Nano Mater. 2021, 4, 5469–5477. [Google Scholar] [CrossRef]
  14. Donmez, M.; Yilmaz, M.D.; Kilbas, B. Fluorescent detection of dipicolinic acid as a biomarker of bacterial spores using lanthanide-chelated gold nanoparticles. J. Hazard. Mater. 2017, 324, 593–598. [Google Scholar] [CrossRef]
  15. Xu, J.; Shen, X.K.; Jia, L.; Zhang, M.M.; Zhou, T.; Wei, Y.K. Facile ratiometric fluorapatite nanoprobes for rapid and sensitive bacterial spore biomarker detection. Biosens. Bioelectron. 2017, 87, 991–997. [Google Scholar] [CrossRef]
  16. Xiu, L.F.; Huang, K.Y.; Zhu, C.T.; Zhang, Q.; Peng, H.P.; Xia, X.H.; Chen, W.; Deng, H.H. Rare-Earth Eu3+/Gold Nanocluster Ensemble-Based Fluorescent Photoinduced Electron Transfer Sensor for Biomarker Dipicolinic Acid Detection. Langmuir 2021, 37, 949–956. [Google Scholar] [CrossRef]
  17. Donmez, M.; Oktem, H.A.; Yilmaz, M.D. Ratiometric fluorescence detection of an anthrax biomarker with Eu3+-chelated chitosan biopolymers. Carbohydr. Polym. 2018, 180, 226–230. [Google Scholar] [CrossRef]
  18. Yang, Z.R.; Wang, M.M.; Wang, X.S.; Yin, X.B. Boric-Acid-Functional Lanthanide Metal-Organic Frameworks for Selective Ratiometric Fluorescence Detection of Fluoride Ions. Anal. Chem. 2017, 89, 1930–1936. [Google Scholar] [CrossRef]
  19. Rong, M.C.; Deng, X.Z.; Chi, S.T.; Huang, L.Z.; Zhou, Y.B.; Shen, Y.N.; Chen, X. Ratiometric fluorometric determination of the anthrax biomarker 2, 6-dipicolinic acid by using europium (III)-doped carbon dots in a test stripe. Microchim. Acta 2018, 185, 201. [Google Scholar] [CrossRef]
  20. Yilmaz, M.D.; Oktem, H.A. Eriochrome Black T-Eu3+ Complex as a Ratiometric Colorimetric and Fluorescent Probe for the Detection of Dipicolinic Acid, a Biomarker of Bacterial Spores. Anal. Chem. 2018, 90, 4221–4225. [Google Scholar] [CrossRef]
  21. Zhang, X.Y.; Young, M.A.; Lyandres, O.; Duyne, R.P.V. Rapid Detection of an Anthrax Biomarker by Surface-Enhanced Raman Spectroscopy. J. Am. Chem. Soc. 2005, 127, 4484–4489. [Google Scholar] [CrossRef]
  22. Ai, K.; Zhang, B.H.; Lu, L.H. Europium-based fluorescence nanoparticle sensor for rapid and ultrasensitive detection of an anthrax biomarker. Angew. Chem. Int. Ed. 2009, 48, 304–308. [Google Scholar] [CrossRef]
  23. Lee, M.H.; Kim, J.S.; Sessler, J.L. Small molecule-based ratiometric fluorescence probes for cations, anions, and biomolecules. Chem. Soc. Rev. 2015, 44, 4185–4191. [Google Scholar] [CrossRef] [Green Version]
  24. Li, Y.Y.; Du, Q.Q.; Zhang, X.D.; Huang, Y.M. Ratiometric detection of tetracycline based on gold nanocluster enhanced Eu3+ fluorescence. Talanta 2020, 206, 120202. [Google Scholar] [CrossRef]
  25. Yan, X.; Li, H.X.; Zheng, W.S.; Su, X.G. Visual and Fluorescent Detection of Tyrosinase Activity by Using a Dual-Emission Ratiometric Fluorescence Probe. Anal. Chem. 2015, 87, 904–8909. [Google Scholar] [CrossRef]
  26. Wen, J.L.; Li, N.; Li, D.; Zhang, M.M.; Lin, Y.W.; Liu, Z.; Lin, X.; Shui, L. Cesium-Doped Graphene Quantum Dots as Ratiometric Fluorescence Sensors for Blood Glucose Detection. ACS Appl. Nano Mater. 2021, 4, 8437–8446. [Google Scholar] [CrossRef]
  27. Zhan, Y.J.; Yang, S.T.; Chen, L.F.; Zeng, Y.B.; Li, L.; Lin, Z.Y.; Guo, L.H.; Xu, W. Ultrahigh Efficient FRET Ratiometric Fluorescence Biosensor for Visual Detection of Alkaline Phosphatase Activity and Its Inhibitor. ACS Sustain. Chem. Eng. 2021, 9, 12922–12929. [Google Scholar] [CrossRef]
  28. Hao, T.; Wei, X.; Nie, Y.; Xu, Y.; Yan, Y.; Zhou, J. An eco-friendly molecularly imprinted fluorescence composite material based on carbon dots for fluorescent detection of 4-nitrophenol. Microchim. Acta 2016, 183, 2197–2203. [Google Scholar] [CrossRef]
  29. Wang, T.L.; Mei, Q.S.; Tao, Z.H.; Wu, H.T.; Zhao, M.Y.; Wang, S.; Liu, Y.Q. A smartphone-integrated ratiometric fluorescence sensing platform for visual and quantitative point-of-care testing of tetracycline. Biosens. Bioelectron. 2020, 148, 111791. [Google Scholar] [CrossRef]
  30. Li, X.Q.; Luo, J.J.; Deng, L.; Ma, F.H.; Yang, M.H. In situ incorporation of fluorophores in zeolitic imidazolate framework-8 (ZIF-8) for ratio-dependent detecting a biomarker of anthrax spores. Anal. Chem. 2020, 92, 7114–7122. [Google Scholar] [CrossRef]
  31. Zhao, J.H.; Wang, S.; Lu, S.S.; Sun, J.; Yang, X.R. A luminescent europium-dipicolinic acid nanohybrid for the rapid and selective sensing of pyrophosphate and alkaline phosphatase activity. Nanoscale 2018, 10, 7163–7170. [Google Scholar] [CrossRef]
  32. Wang, T.L.; Ji, X.Y.; Tao, Z.H.; Zhou, X.; Hao, Z.; Wang, X.K.; Gao, X.; Wang, S.; Liu, Y.Q. Dual stimuli-responsive lanthanide-based phosphors for an advanced full-color anti-counterfeiting system. RSC Adv. 2020, 10, 15573–15578. [Google Scholar] [CrossRef] [Green Version]
  33. Liu, X.W.; Li, X.; Xu, S.L.; Guo, S.J.; Xue, Q.W.; Wang, H.S. Efficient ratiometric fluorescence probe based on dual-emission luminescent lanthanide coordination polymer for amyloid β-peptide detection. Sens. Actuators B Chem. 2021, 352, 131052. [Google Scholar] [CrossRef]
  34. Hussain, S.; Chen, X.; Wang, C.F.; Hao, Y.; Tian, X.M.; He, Y.L.; Li, J.; Shahid, M.; Iyer, P.K.; Gao, R.X. Aggregation and Binding-Directed FRET Modulation of Conjugated Polymer Materials for Selective and Point-of-Care Monitoring of Serum Albumins. Anal. Chem. 2022, 94, 10685–10694. [Google Scholar] [CrossRef]
  35. Hussain, S.; Malika, A.H.; Iyer, P.K. FRET-assisted selective detection of flavins via cationic conjugated polyelectrolyte under physiological conditions. J. Mater. Chem. B 2016, 4, 4439–4446. [Google Scholar] [CrossRef]
  36. Malik, A.K.; Hussain, S.; Iyer, P.K. Aggregation-Induced FRET via Polymer-Surfactant Complexation: A New Strategy for the Detection of Spermine. Anal. Chem. 2016, 88, 7358–7364. [Google Scholar] [CrossRef]
  37. Mondal, S.; Zehra, N.; Choudhury, A.; Iyer, P.K. Wearable Sensing Devices for Point of Care Diagnostics. ACS Appl. Bio Mater. 2021, 4, 47–70. [Google Scholar] [CrossRef]
Scheme 1. Llustration of the ratiometric fluorescence sensing for DPA detection.
Biosensors 12 00668 sch001
Figure 1. The fluorescence spectra and the corresponding photographs of CDs (a), CDs with Eu3+ (b), and Eu3+/CDs with DPA (c).
Biosensors 12 00668 g001
Figure 2. (A) The normalized fluorescence intensity of CDs against different concentrations of Eu3+. (B) The ratio of F615/F470 against different concentrations of Eu3+ in CDs with DPA. The reaction times (C) and different temperature (D) of the Eu3+/CDs system in the presence of DPA.
Biosensors 12 00668 g002
Figure 3. (A) The fluorescence spectra of Eu3+/CDs in the presence of different concentrations of DPA. The standard curves of DPA detection in the range from 0–20 μM (B) and 20–150 μM (C). (D) Selectivity sensing of the ratiometric fluorescence platform in the presence of each interferential substance and DPA target (1: DPA, 2: Cys, 3: GSH, 4: ATP, 5: Glu, 6: Cl, 7: Fe3+, 8: Zn2+, 9: Ni2+).
Biosensors 12 00668 g003
Figure 4. The smartphone-based sensor calibration plot based on ratio of R/B (A) and the CIE chromaticity coordinates of Eu3+/CDs (B) against concentrations of DPA range from 5 to 150 μM (Illustration: converted photos of Eu3+/CDs with different concentrations of DPA).
Biosensors 12 00668 g004
Table 1. Determination of spiked samples of DPA in real samples by the developed strategy.
SampleSpiked (μM)FoundRecovery (%)RSD (%)
Milk0---
109.9991.65
2019.8994.05
5048.5972.9
Publisher’s Note: MDPI stays neutral with regard to jurisdictional claims in published maps and institutional affiliations.

