Classification of Dysphonic Voices in Parkinson’s Disease with Semi-Supervised Competitive Learning Algorithm


Abstract
:1. Introduction
2. Materials
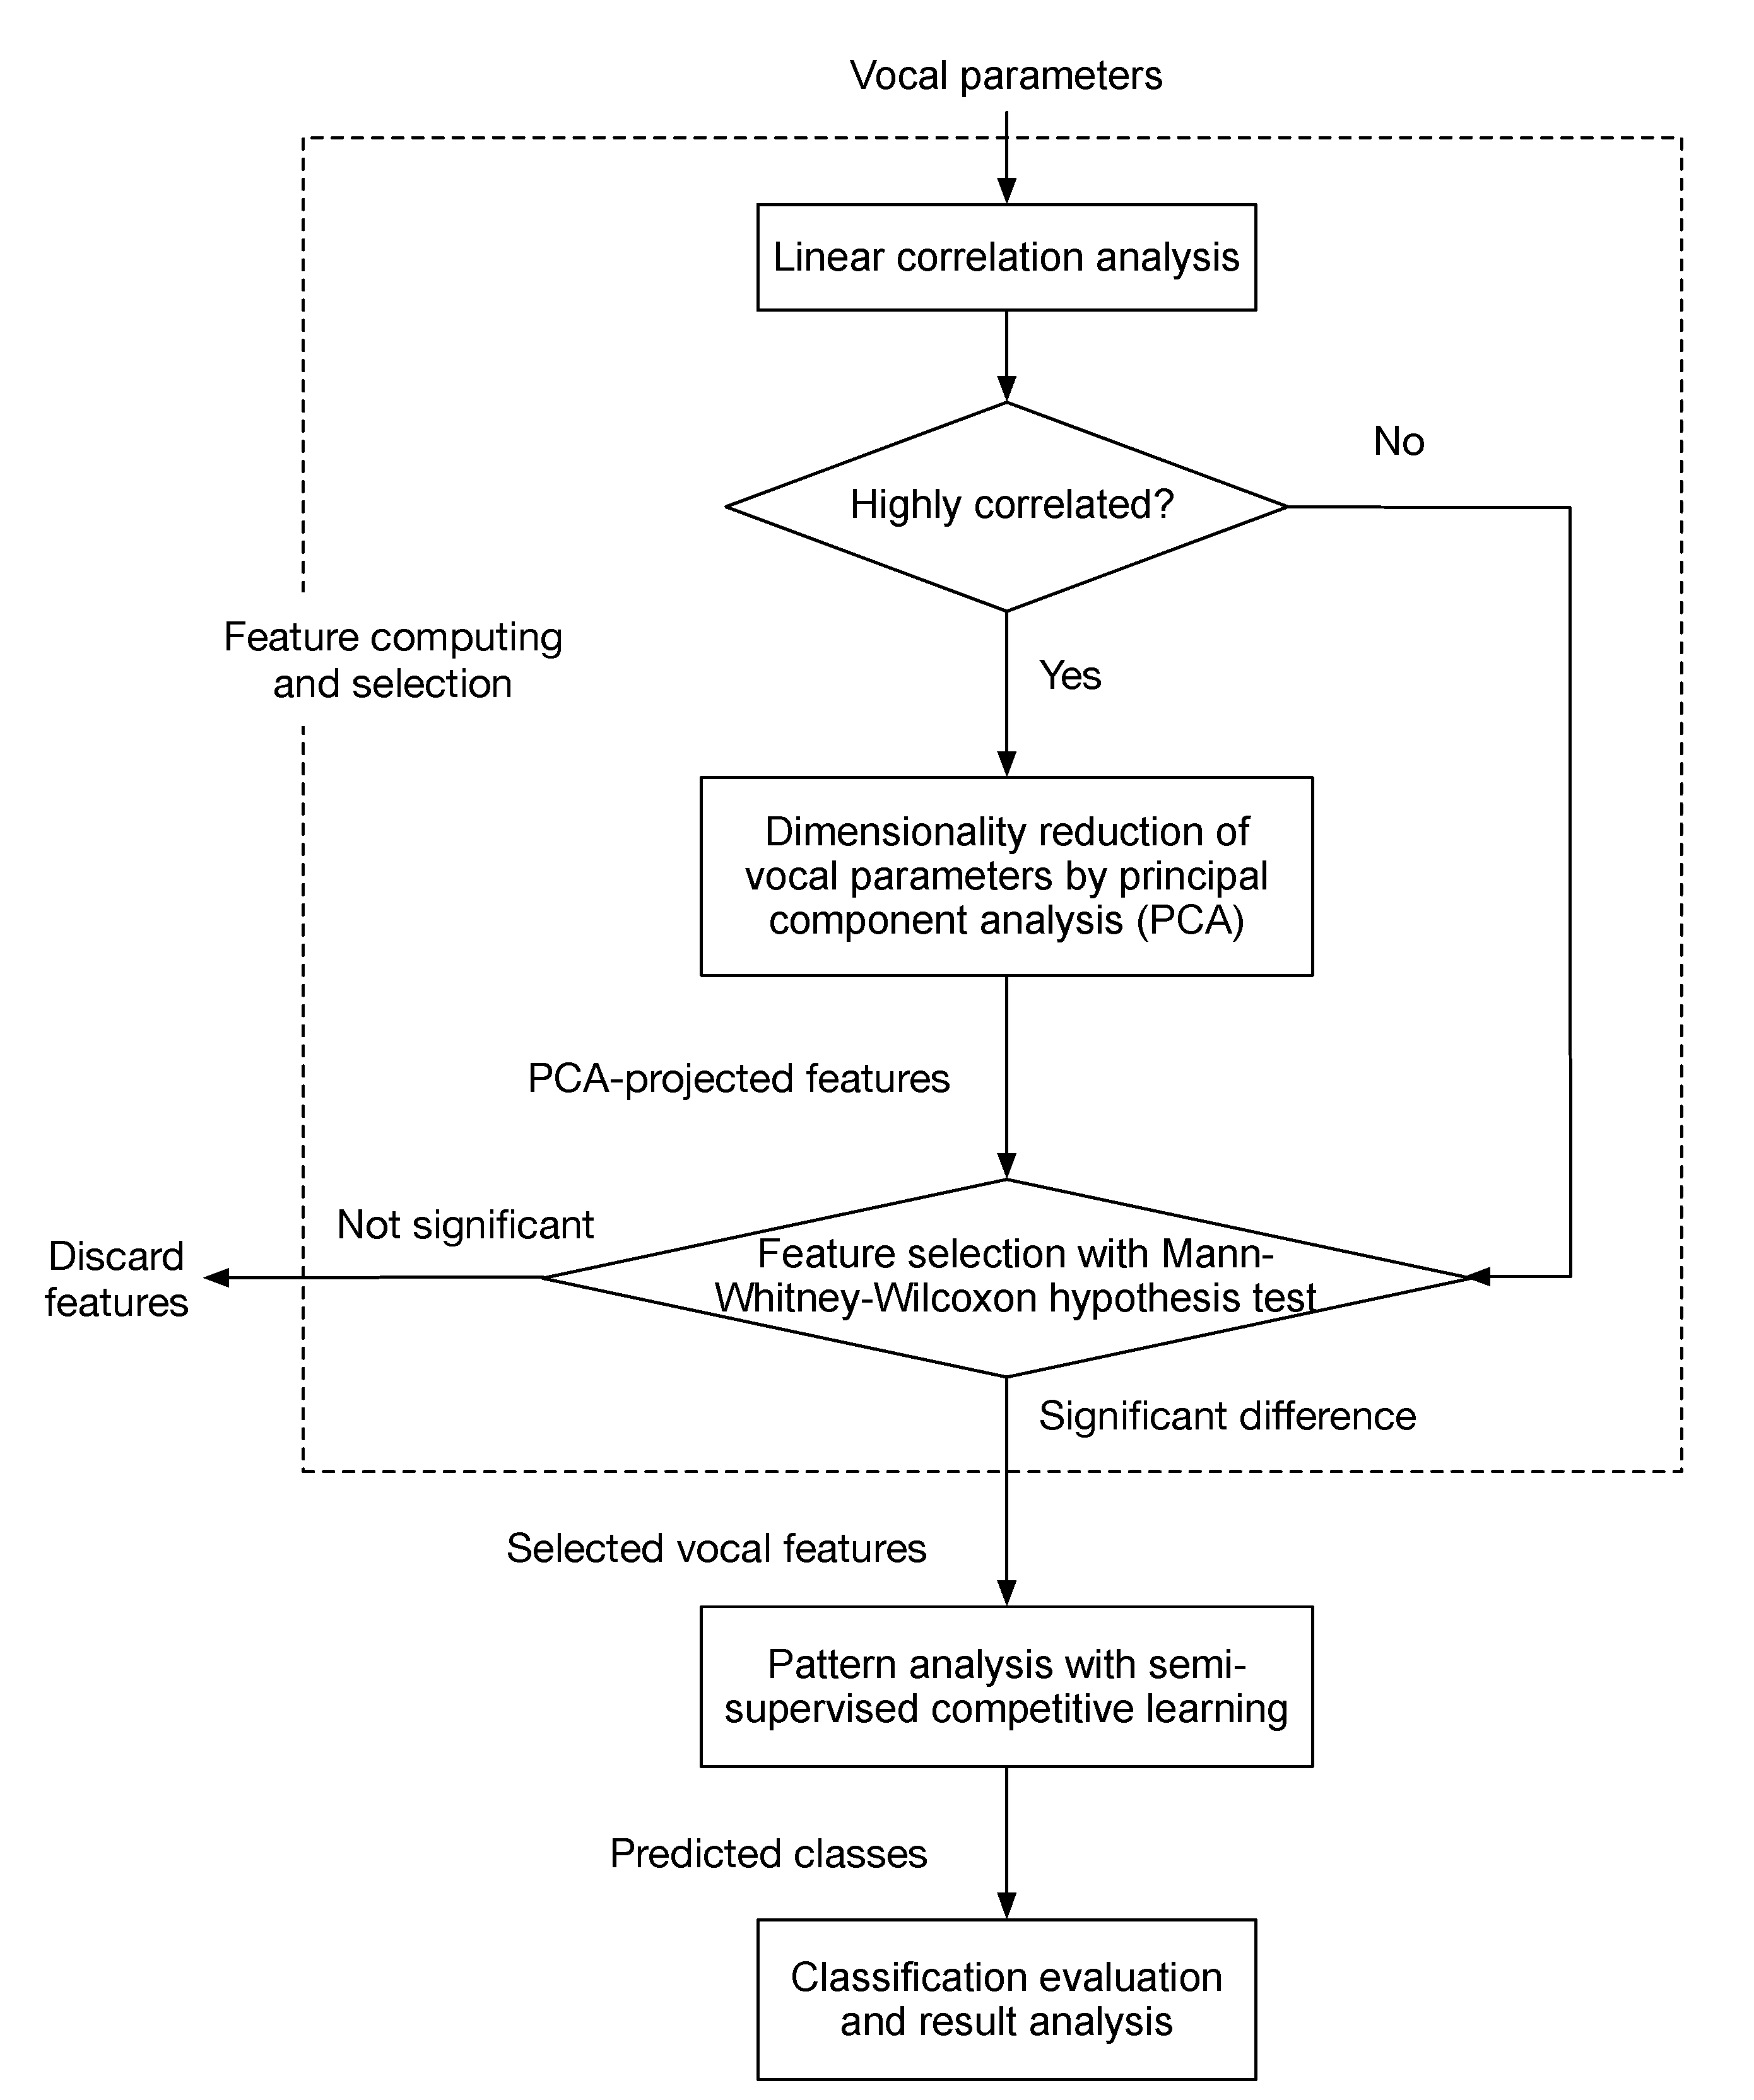
3. Methods
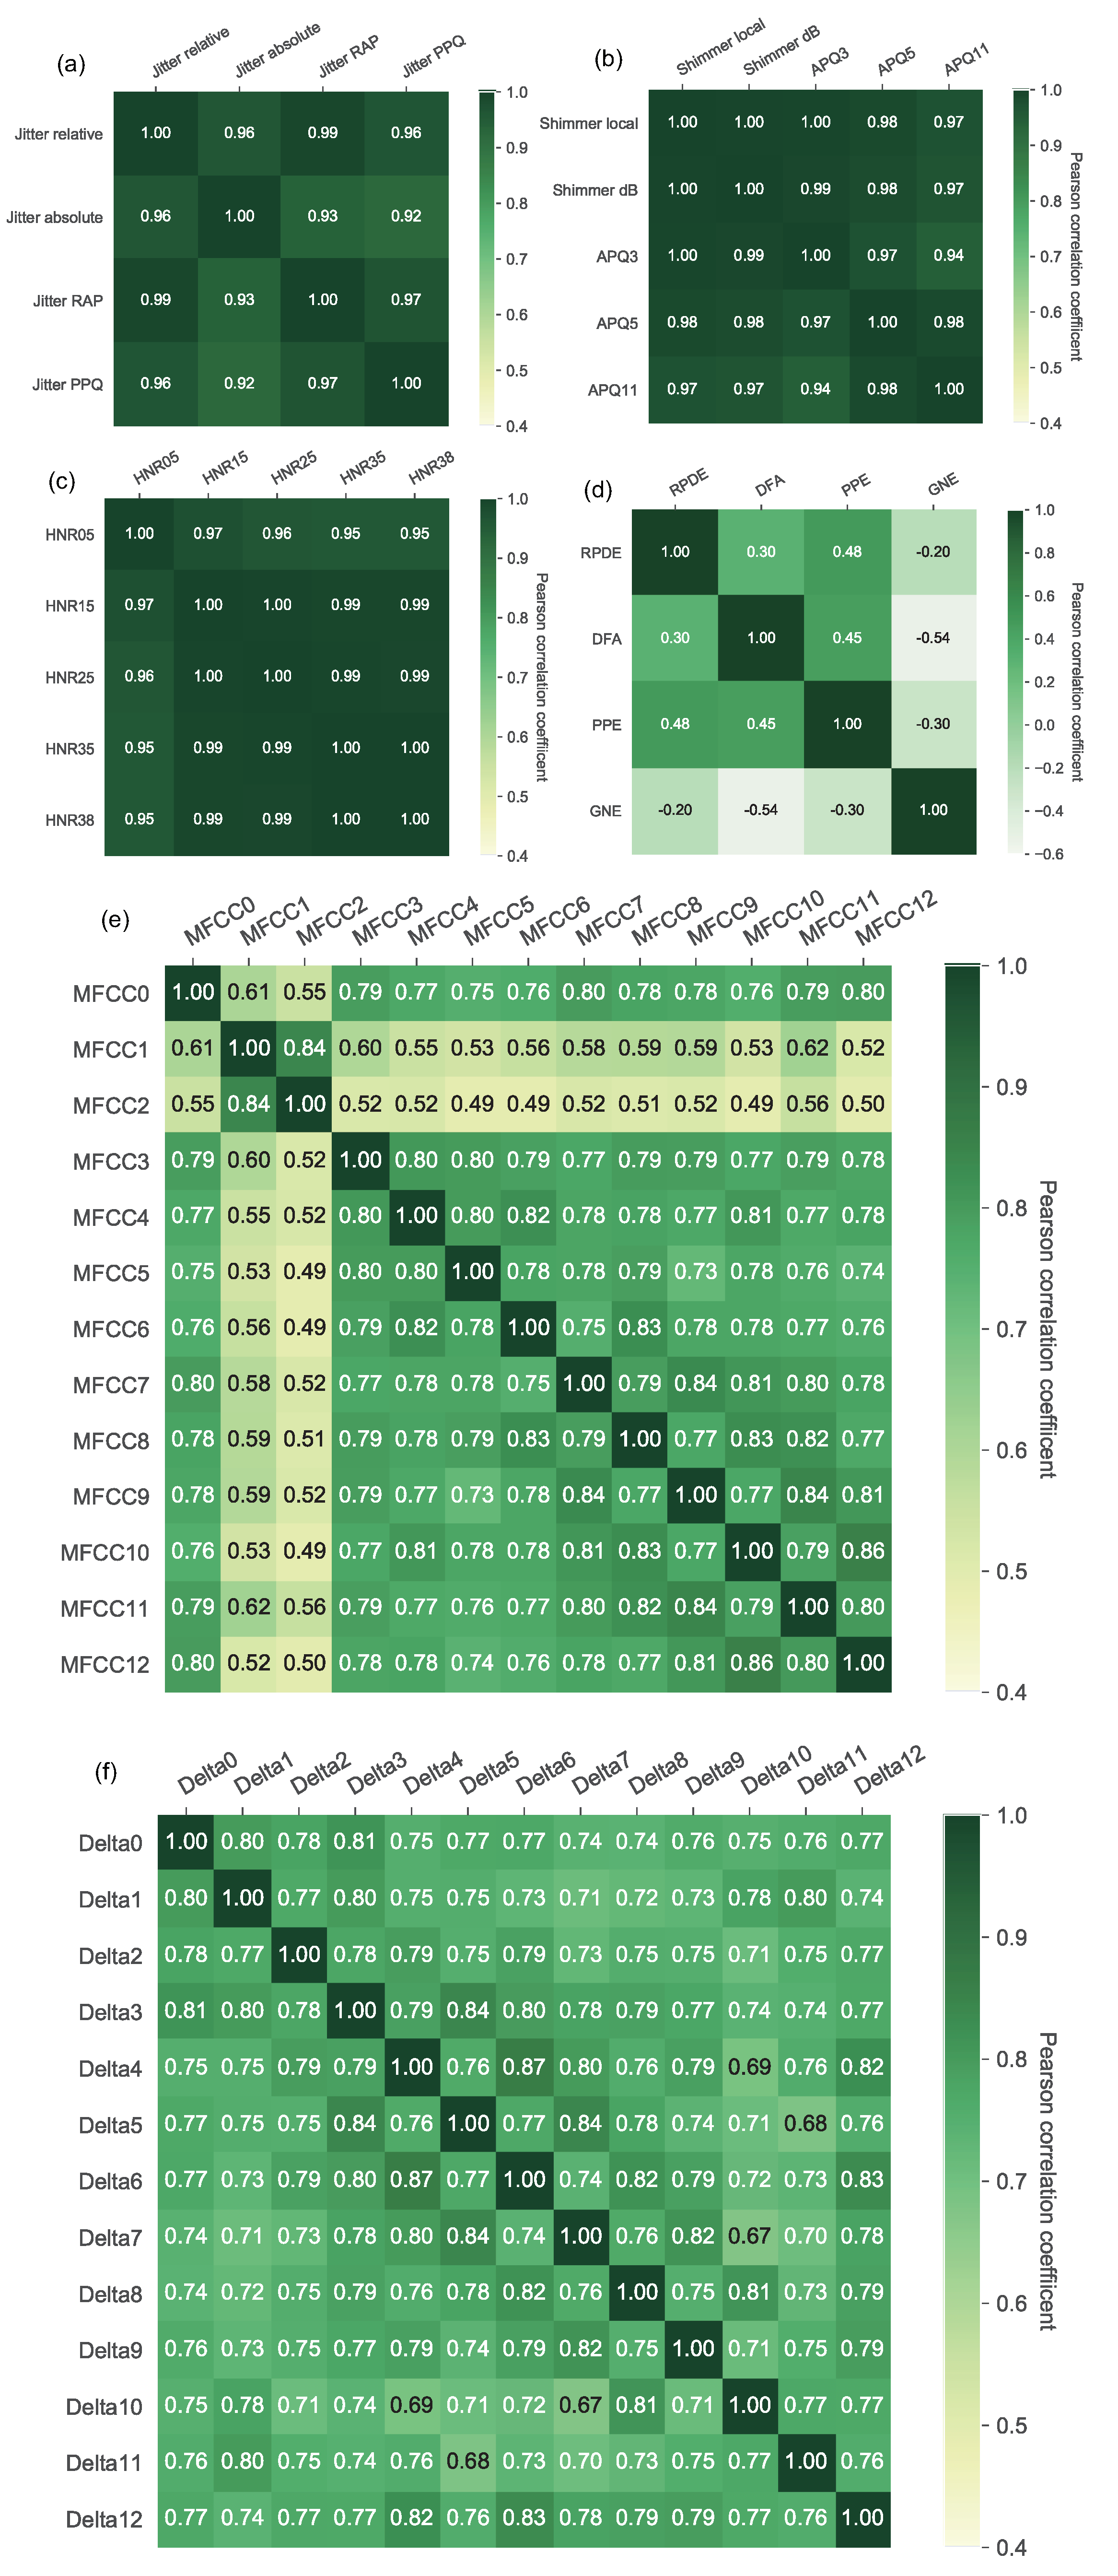
3.1. Feature Computing and Selection
3.2. Pattern Analysis with Semi-Supervised Competitive Learning
3.2.1. Competitive Selection of Initial Prototype Seeds
3.2.2. K-Means Optimization Algorithm
3.2.3. Nearest Neighbor Classification
3.3. Benchmark Classifiers for Comparison
3.4. Classification Performance Evaluation Metrics
3.4.1. Accuracy
3.4.2. Recall
3.4.3. Specificity
3.4.4. Precision
3.4.5. F-Score
3.4.6. Matthews Correlation Coefficient
3.4.7. Area under ROC Curve
3.4.8. Kappa Coefficient
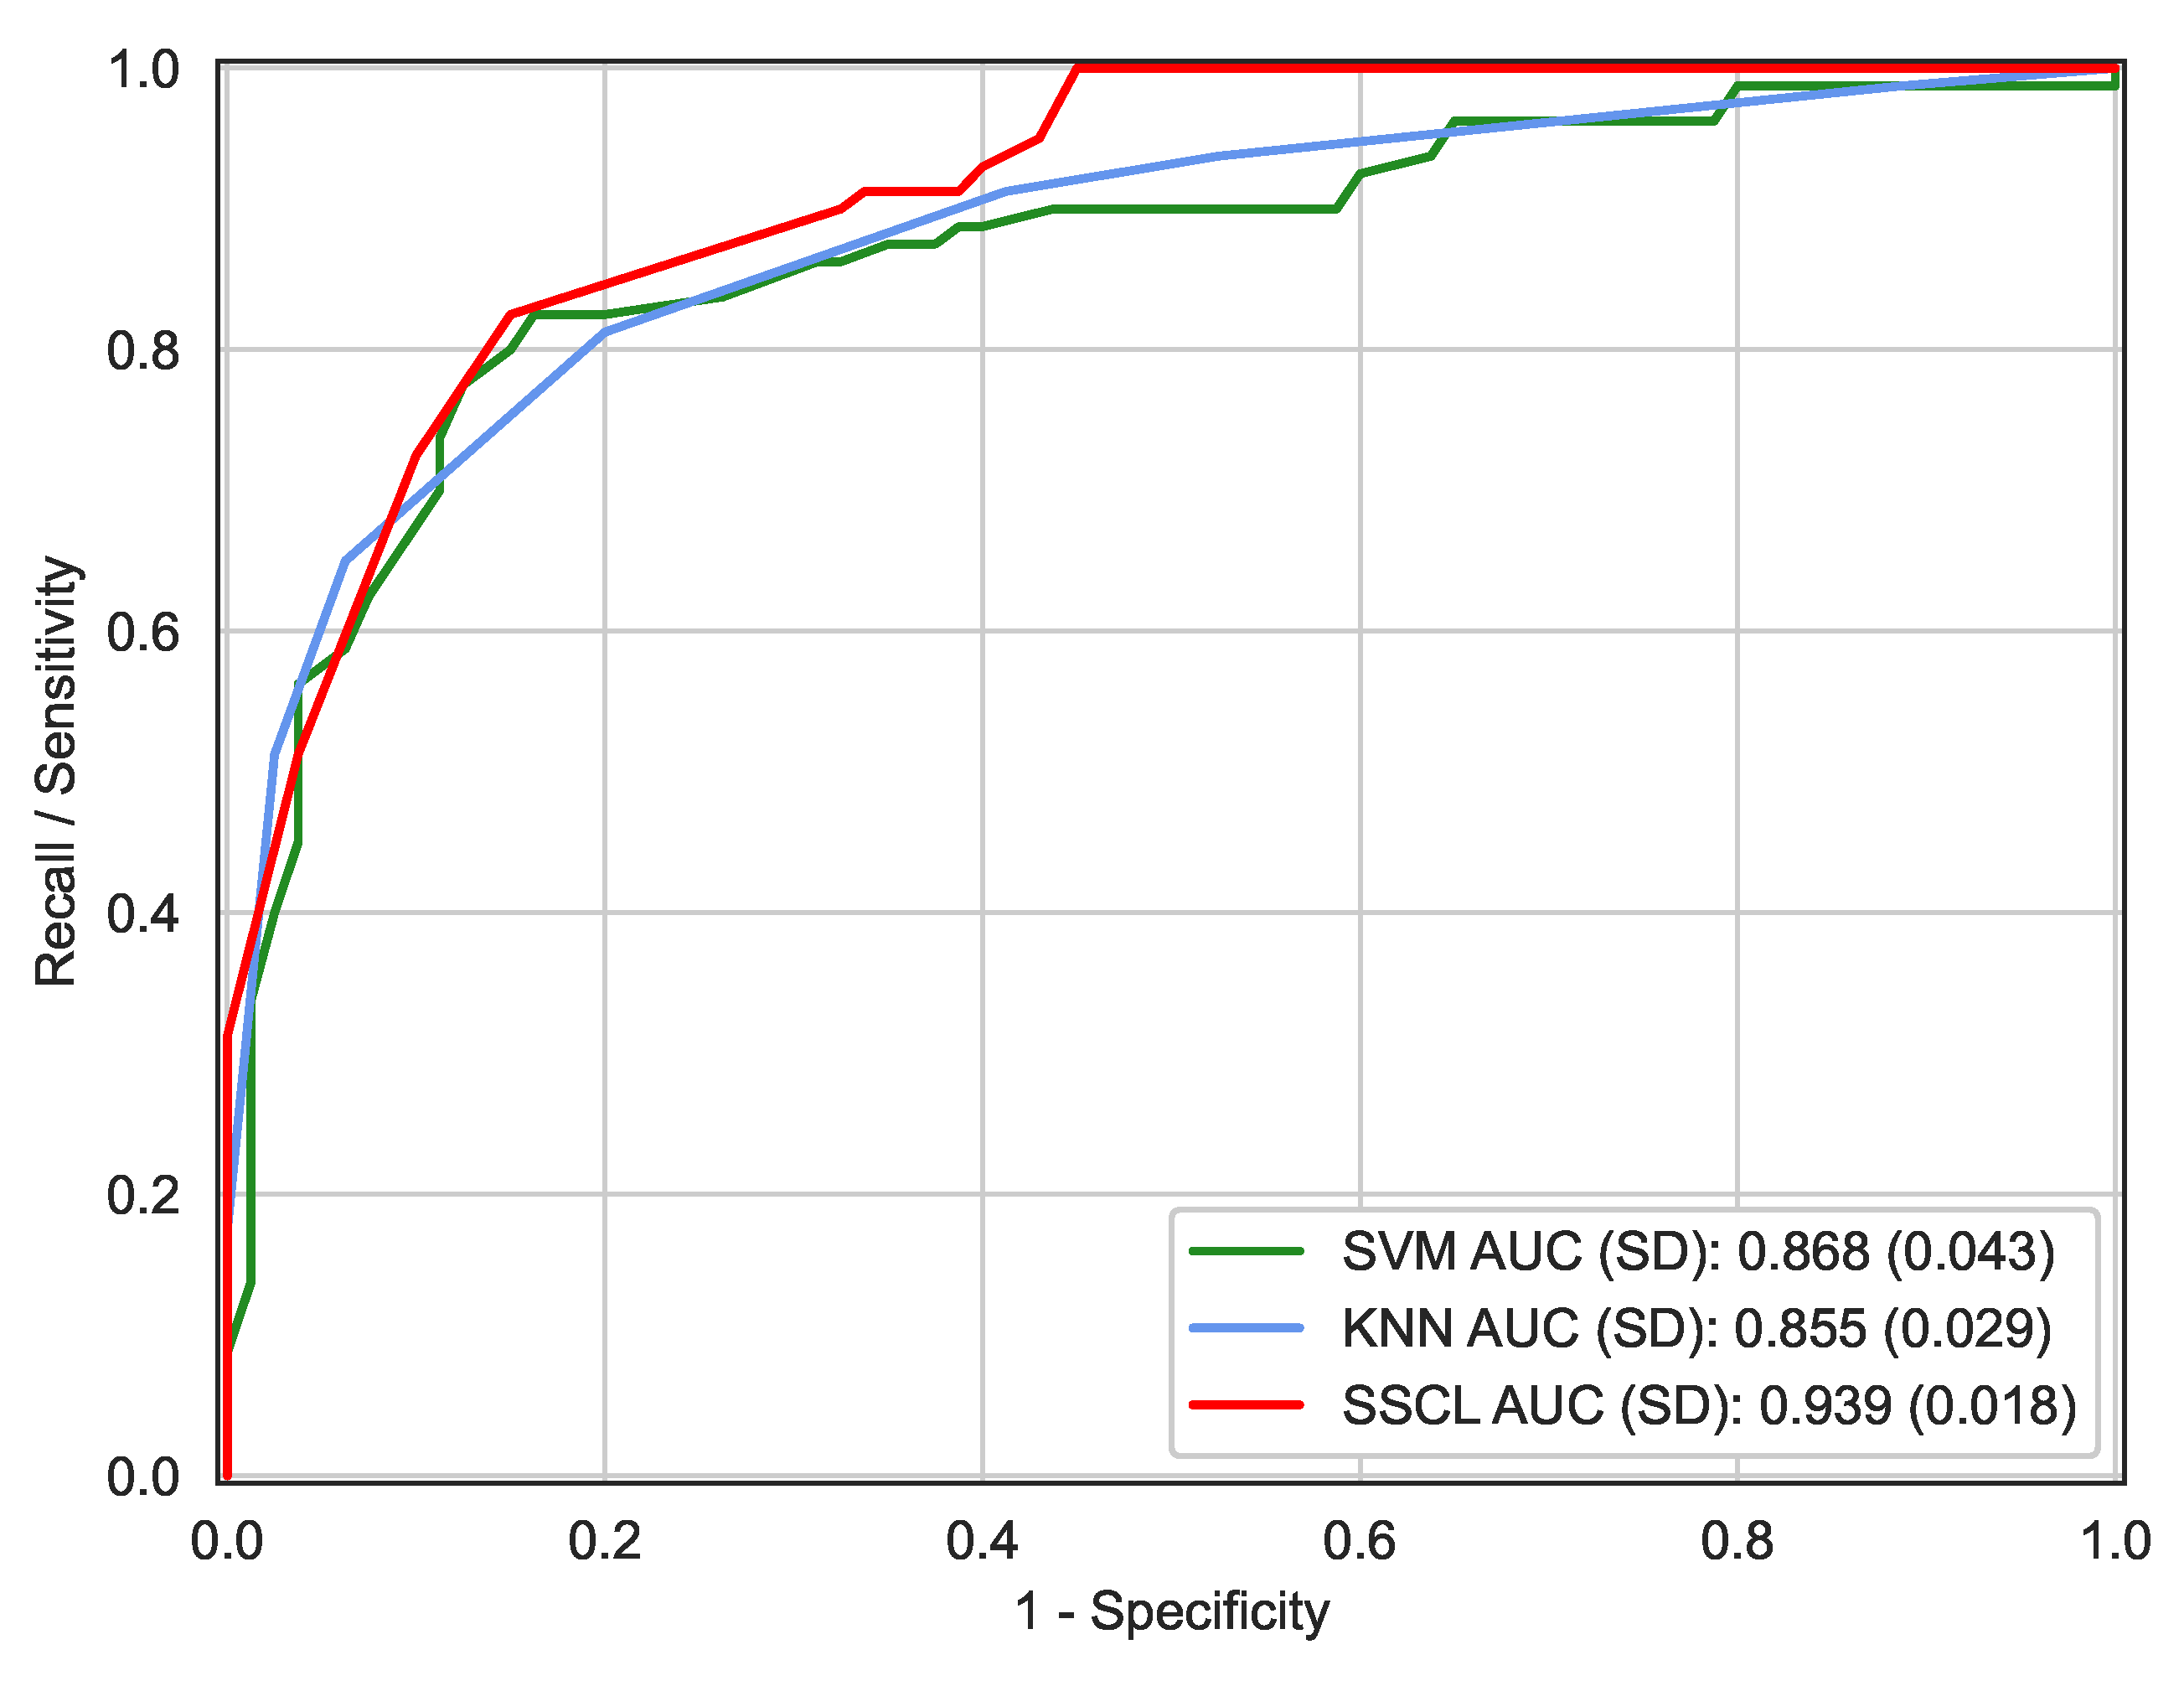
4. Results and Discussions
4.1. Feature Analysis Results
4.2. Classification Results and Discussions
5. Conclusions
Author Contributions
Funding
Institutional Review Board Statement
Informed Consent Statement
Data Availability Statement
Acknowledgments
Conflicts of Interest
Abbreviations
| APQ | Amplitude Perturbation Quotient |
| AUC | Area Under the receiver operating characteristic Curve |
| DFA | Detrended Fluctuation Analysis |
| KNN | K-Nearest Neighbor |
| GNE | Glottal-to-Noise excitation Ratio |
| HC | Healthy controls |
| HNR | Harmonic-to-Noise Ratio |
| MCC | Matthews Correlation Coefficient |
| MFCC | Mel-Frequency Cepstral Coefficient |
| PCA | Principal Component Analysis |
| PD | Parkinson’s Disease |
| PPE | Pitch Period Entropy |
| ROC | Receiver Operating Characteristic curve |
| RPDE | Recurrence Period Density Entropy |
| SE | Standard Error |
| SSCL | Semi-Supervised Competitive Learning algorithm |
| SVM | Support Vector Machine |
References
- Samii, A.; Nutt, J.G.; Ransom, B.R. Parkinson’s disease. Lancet 2004, 353, 1783–1793. [Google Scholar] [CrossRef] [Green Version]
- Yang, S.; Zheng, F.; Luo, X.; Cai, S.; Wu, Y.; Liu, K.; Wu, M.; Chen, J.; Krishnan, S. Effective dysphonia detection using feature dimension reduction and kernel density estimation for patients with Parkinson’s disease. PLoS ONE 2014, 9, e88825. [Google Scholar] [CrossRef] [PubMed] [Green Version]
- Roubeau, B.; Bruel, M.; de Crouy Chanel, O.; Perie, S. Reduction of Parkinson’s-related dysphonia by thyroplasty. Eur. Ann. Otorhinolaryngol. Head Neck Dis. 2016, 133, 437–439. [Google Scholar] [CrossRef]
- Wu, Y.; Chen, P.; Yao, Y.; Ye, X.; Xiao, Y.; Liao, L.; Wu, M.; Chen, J. Dysphonic voice pattern analysis of patients in Parkinson’s disease using minimum inter-class probability risk feature selection and Bagging ensemble learning methods. Comput. Math. Method Med. 2017, 2017, 4201984. [Google Scholar] [CrossRef] [PubMed]
- Galaz, Z.; Mekyska, J.; Zvoncak, V.; Mucha, J.; Kiska, T.; Smekal, Z.; Eliasova, I.; Mrackova, M.; Kostalova, M.; Rektorova, I.; et al. Changes in phonation and their relations with progress of Parkinson’s disease. Appl. Sci. 2018, 8, 2339. [Google Scholar] [CrossRef] [Green Version]
- Ma, A.; Lau, K.; Thyagarajan, D. Voice changes in Parkinson’s disease: What are they telling us? J. Clin. Neurosci. 2020, 72, 1–7. [Google Scholar] [CrossRef]
- Kowalska-Taczanowska, R.; Friedman, A.; Koziorowski, D. Parkinson’s disease or atypical parkinsonism? The importance of acoustic voice analysis in differential diagnosis of speech disorders. Brain Behav. 2020, 10, e01700. [Google Scholar] [CrossRef]
- Rohl, A.; Gutierrez, S.; Johari, K.; Greenlee, J.; Tjaden, K.; Roberts, A. Speech dysfunction, cognition, and Parkinson’s disease. Prog. Brain Res. 2022, 269, 153–173. [Google Scholar]
- Defazio, G.; Guerrieri, M.; Liuzzi, D.; Gigante, A.F.; di Nicola, V. Assessment of voice and speech symptoms in early Parkinson’s disease by the Robertson dysarthria profile. Neurol. Sci. 2016, 37, 443–449. [Google Scholar] [CrossRef]
- Rusz, J.; Cmejla, R.; Ruzickova, H.; Ruzicka, E. Quantitative acoustic measurements for characterization of speech and voice disorders in early untreated Parkinson’s disease. J. Acoust. Soc. Am. 2011, 129, 350–367. [Google Scholar] [CrossRef] [Green Version]
- Kaleem, M.; Ghoraani, B.; Guergachi, A.; Krishnan, S. Pathological speech signal analysis and classification using empirical mode decomposition. Med. Biol. Eng. Comput. 2013, 51, 811–821. [Google Scholar] [CrossRef]
- Harel, B.T.; Cannizaro, M.S.; Cohen, H.; Reilly, N.; Snyder, P.J. Acoustic characteristic of Parkinsonian speech: A potential biomarker of early disease progression and treatment. J. Neurolinguistics 2004, 17, 439–453. [Google Scholar] [CrossRef]
- Tracy, J.M.; Ozkanca, Y.; Atkins, D.C.; Ghomi, R.H. Investigating voice as a biomarker: Deep phenotyping methods for early detection of Parkinson’s disease. J. Biomed. Inform. 2020, 104, 103362. [Google Scholar] [CrossRef] [PubMed]
- Moro-Velazquez, L.; Gomez-Garcia, J.A.; Arias-Londono, J.D.; Dehak, N.; Godino-Llorente, J.I. Advances in Parkinson’s Disease detection and assessment using voice and speech: A review of the articulatory and phonatory aspects. Biomed. Signal Process. Control 2021, 66, 102418. [Google Scholar] [CrossRef]
- Vaziri, G.; Almasganj, F.; Behroozmand, R. Pathological assessment of patients’ speech signals using nonlinear dynamical analysis. Compt. Biol. Med. 2010, 40, 54–63. [Google Scholar] [CrossRef]
- Rahn, D.A.; Chou, M.; Jiang, J.J.; Zhang, Y. Phonatory impairment in Parkinson’s disease: Evidence from nonlinear dynamic analysis and perturbation analysis. J. Voice 2007, 21, 64–71. [Google Scholar] [CrossRef] [PubMed]
- Naranjo, L.; Perez, C.J.; Martin, J.; Campos-Roca, Y. A two-stage variable selection and classification approach for Parkinson’s disease detection by using voice recording replications. Comput. Meth. Programs Biomed. 2017, 142, 147–156. [Google Scholar] [CrossRef] [PubMed]
- Ferrand, C.T. Harmonics-to-noise ratio: An index of vocal aging. J. Voice 2002, 16, 480–487. [Google Scholar] [CrossRef]
- Little, M.A.; McSharry, P.E.; Hunter, E.J.; Spielman, J.; Ramig, L.O. Suitability of dysphonia measurements for telemonitoring of Parkinson’s disease. IEEE Trans. Biomed. Eng. 2009, 56, 1015–1022. [Google Scholar] [CrossRef] [Green Version]
- Tsanas, A.; Little, M.A.; Fox, C.; Ramig, L.O. Objective automatic assessment of rehabilitative speech treatment in Parkinson’s disease. IEEE Trans. Neural Syst. Rehabil. Eng. 2014, 22, 181–190. [Google Scholar] [CrossRef] [Green Version]
- Shu, Y.; Wang, F.; Yang, L.; Xu, F.; Luo, M.; Chen, X.; Feng, X.; Zou, X. The physical significance of acoustic parameters and its clinical significance of dysarthria in Parkinson’s disease. Sci. Rep. 2020, 10, 11776. [Google Scholar]
- Cnockaert, L.; Schoentgen, J.; Auzou, P.; Ozsancak, C.; Defebvre, L.; Grenez, F. Low-frequency vocal modulations in vowels produced by Parkinsonian subjects. Speech Commun. 2008, 50, 288–300. [Google Scholar] [CrossRef] [Green Version]
- Rodriguez-Perez, P.; Fraile, R.; Garcia-Escrig, M.; Saenz-Lechon, N.; Gutierrez-Arriola, J.M.; Osma-Ruiz, V. A transversal study of fundamental frequency contours in parkinsonian voices. Biomed. Signal Process. Control 2019, 51, 374–381. [Google Scholar] [CrossRef]
- Viswanathan, R.; Arjunan, S.P.; Bingham, A.; Jelfs, B.; Kempster, P.; Raghav, S.; Kumar, D.K. Complexity measures of voice recordings as a discriminative tool for Parkinson’s disease. Biosensors 2020, 10, 1. [Google Scholar] [CrossRef] [PubMed] [Green Version]
- Ali, L.; Zhu, C.; Zhou, M.; Liu, Y. Early diagnosis of Parkinson’s disease from multiple voice recordings by simultaneous sample and feature selection. Expert Syst. Appl. 2019, 137, 22–28. [Google Scholar] [CrossRef]
- Mohamadzadeh, S.; Pasban, S.; Zeraatkar-Moghadam, J.; Shafiei, A.K. Parkinson’s disease detection by using feature selection and sparse representation. J. Med. Biol. Eng. 2021, 41, 412–421. [Google Scholar] [CrossRef]
- Karabayir, I.; Goldman, S.M.; Pappu, S.; Akbilgic, O. Gradient boosting for Parkinson’s disease diagnosis from voice recordings. BMC Med. Inform. Decis. Mak. 2020, 20, 228. [Google Scholar] [CrossRef]
- Tsanas, A.; Little, M.A.; McSharry, P.E.; Spielman, J.L.; Ramig, L.O. Novel speech signal processing algorithms for high-accuracy classification of Parkinson’s Disease. IEEE Trans. Biomed. Eng. 2012, 59, 1264–1271. [Google Scholar] [CrossRef] [Green Version]
- Berus, L.; Klancnik, S.; Brezocnik, M.; Ficko, M. Classifying Parkinson’s disease based on acoustic measures using artificial neural networks. Sensors 2019, 19, 16. [Google Scholar] [CrossRef] [Green Version]
- Wojcik-Pedziwiatr, M.; Hemmerling, D.; Rudzinska-Bar, M. Estimation of Parkinson’s disease severity based on voice signal. Parkinsonsim Relat. Disord. 2020, 79, e46. [Google Scholar] [CrossRef]
- Hemmerling, D.; Wojcik-Pedziwiatr, M. Prediction and estimation of Parkinson’s Disease severity based on voice signal. J. Voice 2022, 36, 439.e9–439.e20. [Google Scholar] [CrossRef] [PubMed]
- Vaiciukynas, E.; Verikas, A.; Gelzinis, A.; Bacauskiene, M. Detecting Parkinson’s disease from sustained phonation and speech signals. PLoS ONE 2017, 12, e0185613. [Google Scholar] [CrossRef] [PubMed]
- Hires, M.; Gazda, M.; Drota, P.; Pah, N.D. Convolutional neural network ensemble for Parkinson’s disease detection from voice recordings. Compt. Biol. Med. 2022, 141, 105021. [Google Scholar] [CrossRef] [PubMed]
- Sheibani, R.; Nikookar, E.; Alavi, S.E. An ensemble method for diagnosis of Parkinson’s disease based on voice measurements. J. Med. Signals Sens. 2019, 9, 221–226. [Google Scholar]
- Lauraitis, A.; Maskeliunas, R.; Damasevicius, R.; Krilavicius, T. A mobile application for smart computer-aided self-administered testing of cognition, speech, and motor impairment. Sensors 2020, 20, 3236. [Google Scholar] [CrossRef]
- Naranjo, L.; Perez, C.J.; Campos-Roca, Y.; Martin, J. Addressing voice recording replications for Parkinson’s disease detection. Expert Syst. Appl. 2016, 46, 286–292. [Google Scholar] [CrossRef]
- Dua, D.; Graff, C. UCI Machine Learning Repository. 2019. Available online: http://archive.ics.uci.edu/ml (accessed on 9 June 2022).
- Wu, Y.; Liu, Y.; Hou, Y.; Chen, X.; Gao, T. Semi-supervised learning based on competitive prototype seeds selection for phonation detection of patients with Parkinson’s disease. In Proceedings of the 15th International Symposium on Medical Information and Communication Technology (ISMICT 2021), Xiamen, China, 14–16 April 2021; pp. 127–132. [Google Scholar]
- Vittinghoff, E.; Shiboski, S.C.; Glidden, D.V.; McCulloch, C.E. Regression Methods in Biostatistics: Linear, Logistic, Survival and Repeated Measures Models; Springer: New York, NY, USA, 2005. [Google Scholar]
- Noble, W.S. What is a support vector machine? Nat. Biotechnol. 2006, 24, 1565–1567. [Google Scholar] [CrossRef]
- Takahashi, K.; Yamamoto, K.; Kuchiba, A.; Koyama, T. Confidence interval for micro-averaged F1 and macro-averaged F1 scores. Appl. Intell. 2022, 52, 4961–4972. [Google Scholar] [CrossRef]
- Chicco, D.; Jurman, G. The advantages of the Matthews correlation coefficient (MCC) over F1 score and accuracy in binary classification evaluation. BMC Genomics 2020, 21, 6. [Google Scholar] [CrossRef] [Green Version]
- Kraemer, H.C.; Periyakoil, V.S.; Noda, A. Kappa coefficients in medical research. Stat. Med. 2002, 21, 2109–2129. [Google Scholar] [CrossRef]
- Rusz, J.; Tykalova, T.; Novotny, M.; Zogala, D.; Ruzicka, E.; Dusek, P. Automated speech analysis in early untreated Parkinson’s disease: Relation to gender and dopaminergic transporter imaging. Eur. J. Neurol. 2022, 29, 81–90. [Google Scholar] [CrossRef] [PubMed]


| Subject Groups | HC Group | PD Group | ||
|---|---|---|---|---|
| Gender | Male | Female | Male | Female |
| n (%) | 22 (55%) | 18 (45%) | 27 (67.5%) | 13 (32.5%) |
| Age (years old) | 66.38 ± 8.38 | 69.58 ± 7.82 | ||
| Parameter Family | Abbreviation | Parameter Description |
|---|---|---|
| Jitter | Jitter-Rel | Relative jitter |
| Jitter-Abs | Absolute jitter | |
| Jitter-RAP | Relative average perturbation | |
| Jitter-PPQ | Pitch perturbation quotient | |
| Shimmer | Shim-Loc | Local shimmer |
| Shim-dB | Shimmer in dB | |
| Shim-APQ3 | 3-point amplitude perturbation quotient | |
| Shim-APQ5 | 5-point amplitude perturbation quotient | |
| Shim-APQ11 | 11-point amplitude perturbation quotient | |
| Harmonic-to-noise | HNR05 | Harmonic-to-noise ratio in 0–500 Hz |
| HNR15 | Harmonic-to-noise ratio in 0–1500 Hz | |
| HNR25 | Harmonic-to-noise ratio in 0–2500 Hz | |
| HNR35 | Harmonic-to-noise ratio in 0–3500 Hz | |
| HNR38 | Harmonic-to-noise ratio in 0–3800 Hz | |
| Nonlinear | RPDE | Recurrence period density entropy |
| DFA | Detrended fluctuation analysis | |
| PPE | Pitch period entropy | |
| GNE | Glottal-to-noise excitation ratio | |
| Frequency | MFCC 0 to 12 | Mel-frequency cepstral coefficient-based spectral measures of order 0–12 |
| Delta 0 to 12 | The derivatives of mel-frequency cepstral coefficient measures of order 0–12 |
| Vocal Features | Null Hypothesis | p-Value |
|---|---|---|
| Jitter-PCA | 1 | 0.0036 * |
| Shimmer-PCA | 1 | 0.0007 * |
| HNR-PCA | 1 | 0.0001 * |
| Nonlinear-RPDE | 0 | 0.1779 |
| Nonlinear-DFA | 0 | 0.3233 |
| Nonlinear-PPE | 1 | 0.0476 * |
| Nonlinear-GNE | 1 | 0.0001 * |
| Frequency-MFCC-PCA1 | 1 | 0.0001 * |
| Frequency-MFCC-PCA2 | 0 | 0.2305 |
| Frequency-MFCC-PCA3 | 0 | 0.2926 |
| Frequency-MFCC-PCA4 | 0 | 0.4885 |
| Frequency-MFCC-PCA5 | 0 | 0.2856 |
| Frequency-MFCC-PCA6 | 0 | 0.2952 |
| Frequency-Delta-PCA1 | 1 | 0.0001 * |
| Frequency-Delta-PCA2 | 0 | 0.1530 |
| Frequency-Delta-PCA3 | 0 | 0.0579 |
| Frequency-Delta-PCA4 | 0 | 0.1624 |
| Frequency-Delta-PCA5 | 1 | 0.0369 * |
| Classification Metrics | Methods | ||||
|---|---|---|---|---|---|
| Bayesian Expert System [36] | Two-Stage Method [17] | KNN () | SVM | SSCL | |
| Accuracy ± SD | 0.752 ± 0.086 | 0.779 ± 0.08 | 0.806 ± 0.031 | 0.825 ± 0.03 | 0.838 ± 0.029 |
| Recall ± SD | 0.718 ± 0.132 | 0.765 ± 0.135 | 0.812 ± 0.044 | 0.8 ± 0.045 | 0.825 ± 0.042 |
| Specificity ± SD | 0.786 ± 0.135 | 0.792 ± 0.15 | 0.8 ± 0.045 | 0.85 ± 0.04 | 0.85 ± 0.04 |
| Precision ± SD | 0.785 ± 0.118 | 0.806 ± 0.115 | 0.802 ± 0.044 | 0.842 ± 0.042 | 0.846 ± 0.041 |
| F-score ± SD | 0.75 ± 0.024 | 0.785 ± 0.022 | 0.807 ± 0.012 | 0.821 ± 0.011 | 0.835 ± 0.011 |
| MCC ± SD | 0.505 ± 0.096 | 0.557 ± 0.089 | 0.613 ± 0.049 | 0.651 ± 0.046 | 0.675 ± 0.043 |
| AUC ± SD | N/A | 0.879 ± 0.067 | 0.855 ± 0.029 | 0.868 ± 0.043 | 0.939 ± 0.018 |
| Kappa ± SD | N/A | N/A | 0.613 ± 0.062 | 0.65 ± 0.06 | 0.675 ± 0.058 |
| Subject Group | KNN | SVM | SSCL | |||
|---|---|---|---|---|---|---|
| Male | Female | Male | Female | Male | Female | |
| HC | 25.8% | 25.8% | 25% | 17.9% | 30.8% | 15.4% |
| PD | 38.7% | 9.7% | 46.4% | 10.7% | 53.8% | 0% |
| Total | 64.5% | 35.5% | 71.4% | 28.6% | 84.6% | 15.4% |
| 100% | 100% | 100% | ||||
Publisher’s Note: MDPI stays neutral with regard to jurisdictional claims in published maps and institutional affiliations. |
© 2022 by the authors. Licensee MDPI, Basel, Switzerland. This article is an open access article distributed under the terms and conditions of the Creative Commons Attribution (CC BY) license (https://creativecommons.org/licenses/by/4.0/).
Share and Cite
Bao, G.; Lin, M.; Sang, X.; Hou, Y.; Liu, Y.; Wu, Y. Classification of Dysphonic Voices in Parkinson’s Disease with Semi-Supervised Competitive Learning Algorithm. Biosensors 2022, 12, 502. https://doi.org/10.3390/bios12070502
Bao G, Lin M, Sang X, Hou Y, Liu Y, Wu Y. Classification of Dysphonic Voices in Parkinson’s Disease with Semi-Supervised Competitive Learning Algorithm. Biosensors. 2022; 12(7):502. https://doi.org/10.3390/bios12070502
Chicago/Turabian StyleBao, Guidong, Mengchen Lin, Xiaoqian Sang, Yangcan Hou, Yixuan Liu, and Yunfeng Wu. 2022. "Classification of Dysphonic Voices in Parkinson’s Disease with Semi-Supervised Competitive Learning Algorithm" Biosensors 12, no. 7: 502. https://doi.org/10.3390/bios12070502
APA StyleBao, G., Lin, M., Sang, X., Hou, Y., Liu, Y., & Wu, Y. (2022). Classification of Dysphonic Voices in Parkinson’s Disease with Semi-Supervised Competitive Learning Algorithm. Biosensors, 12(7), 502. https://doi.org/10.3390/bios12070502