Electrochemical Biosensor Using Nitrogen-Doped Graphene/Au Nanoparticles/DNAzyme for Ca2+ Determination


Abstract
:1. Introduction
2. Materials and Methods
2.1. Materials and Reagents
2.2. Apparatus and Measurements
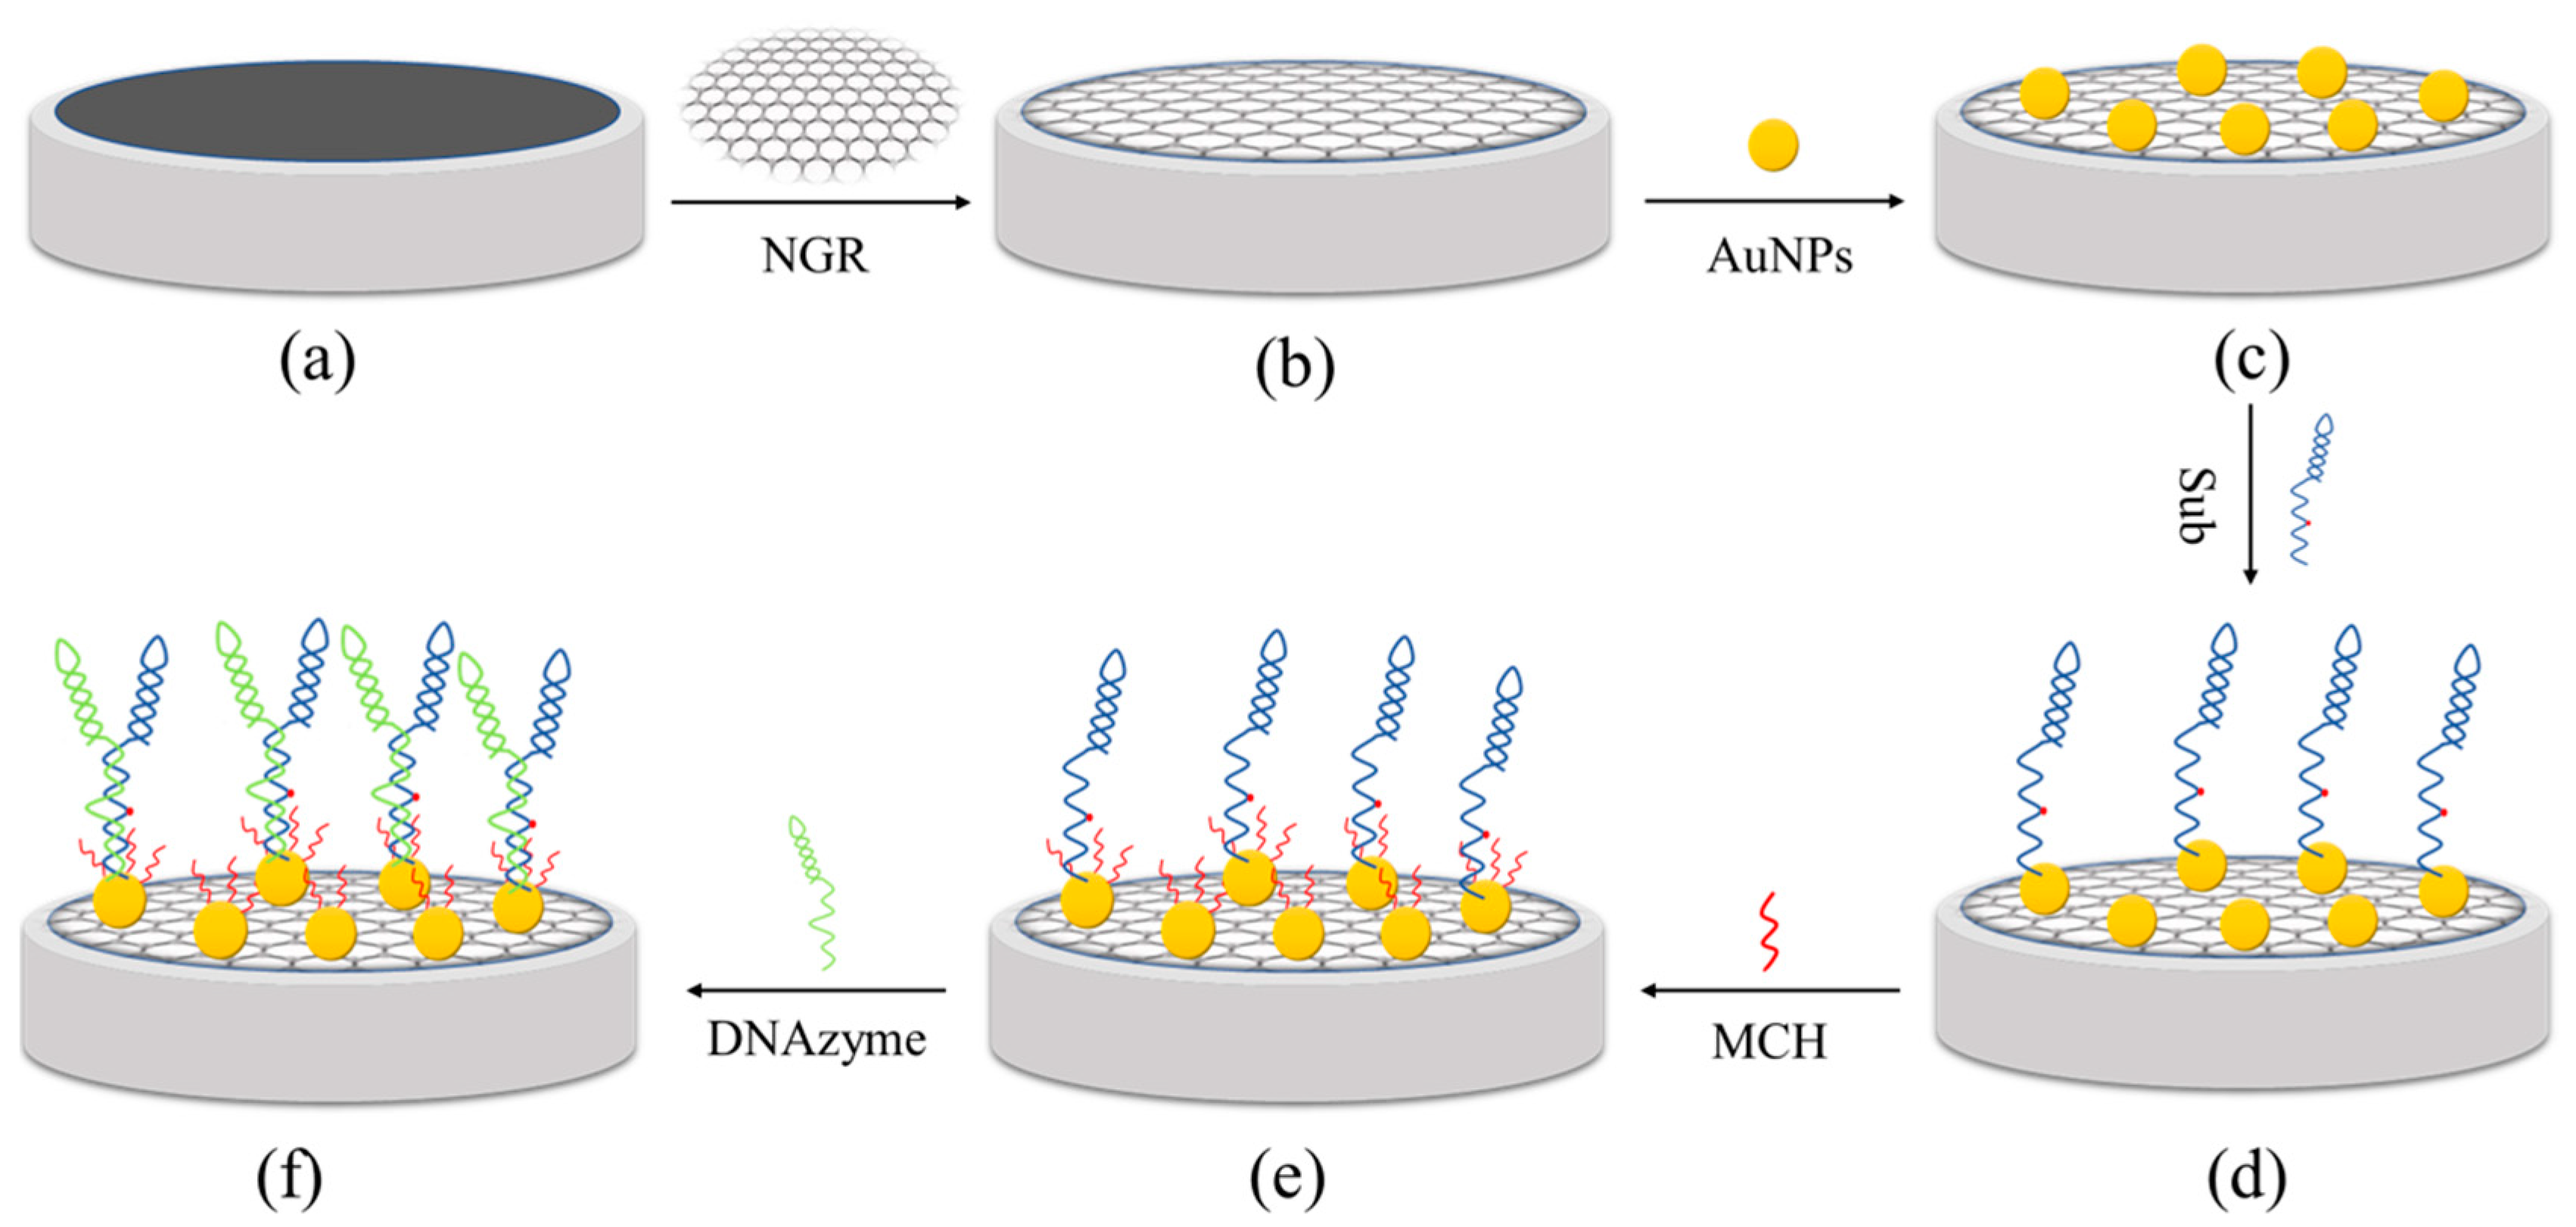
2.3. Fabrication
2.4. Method of Measurement
2.5. Measurement of Real Samples
3. Results
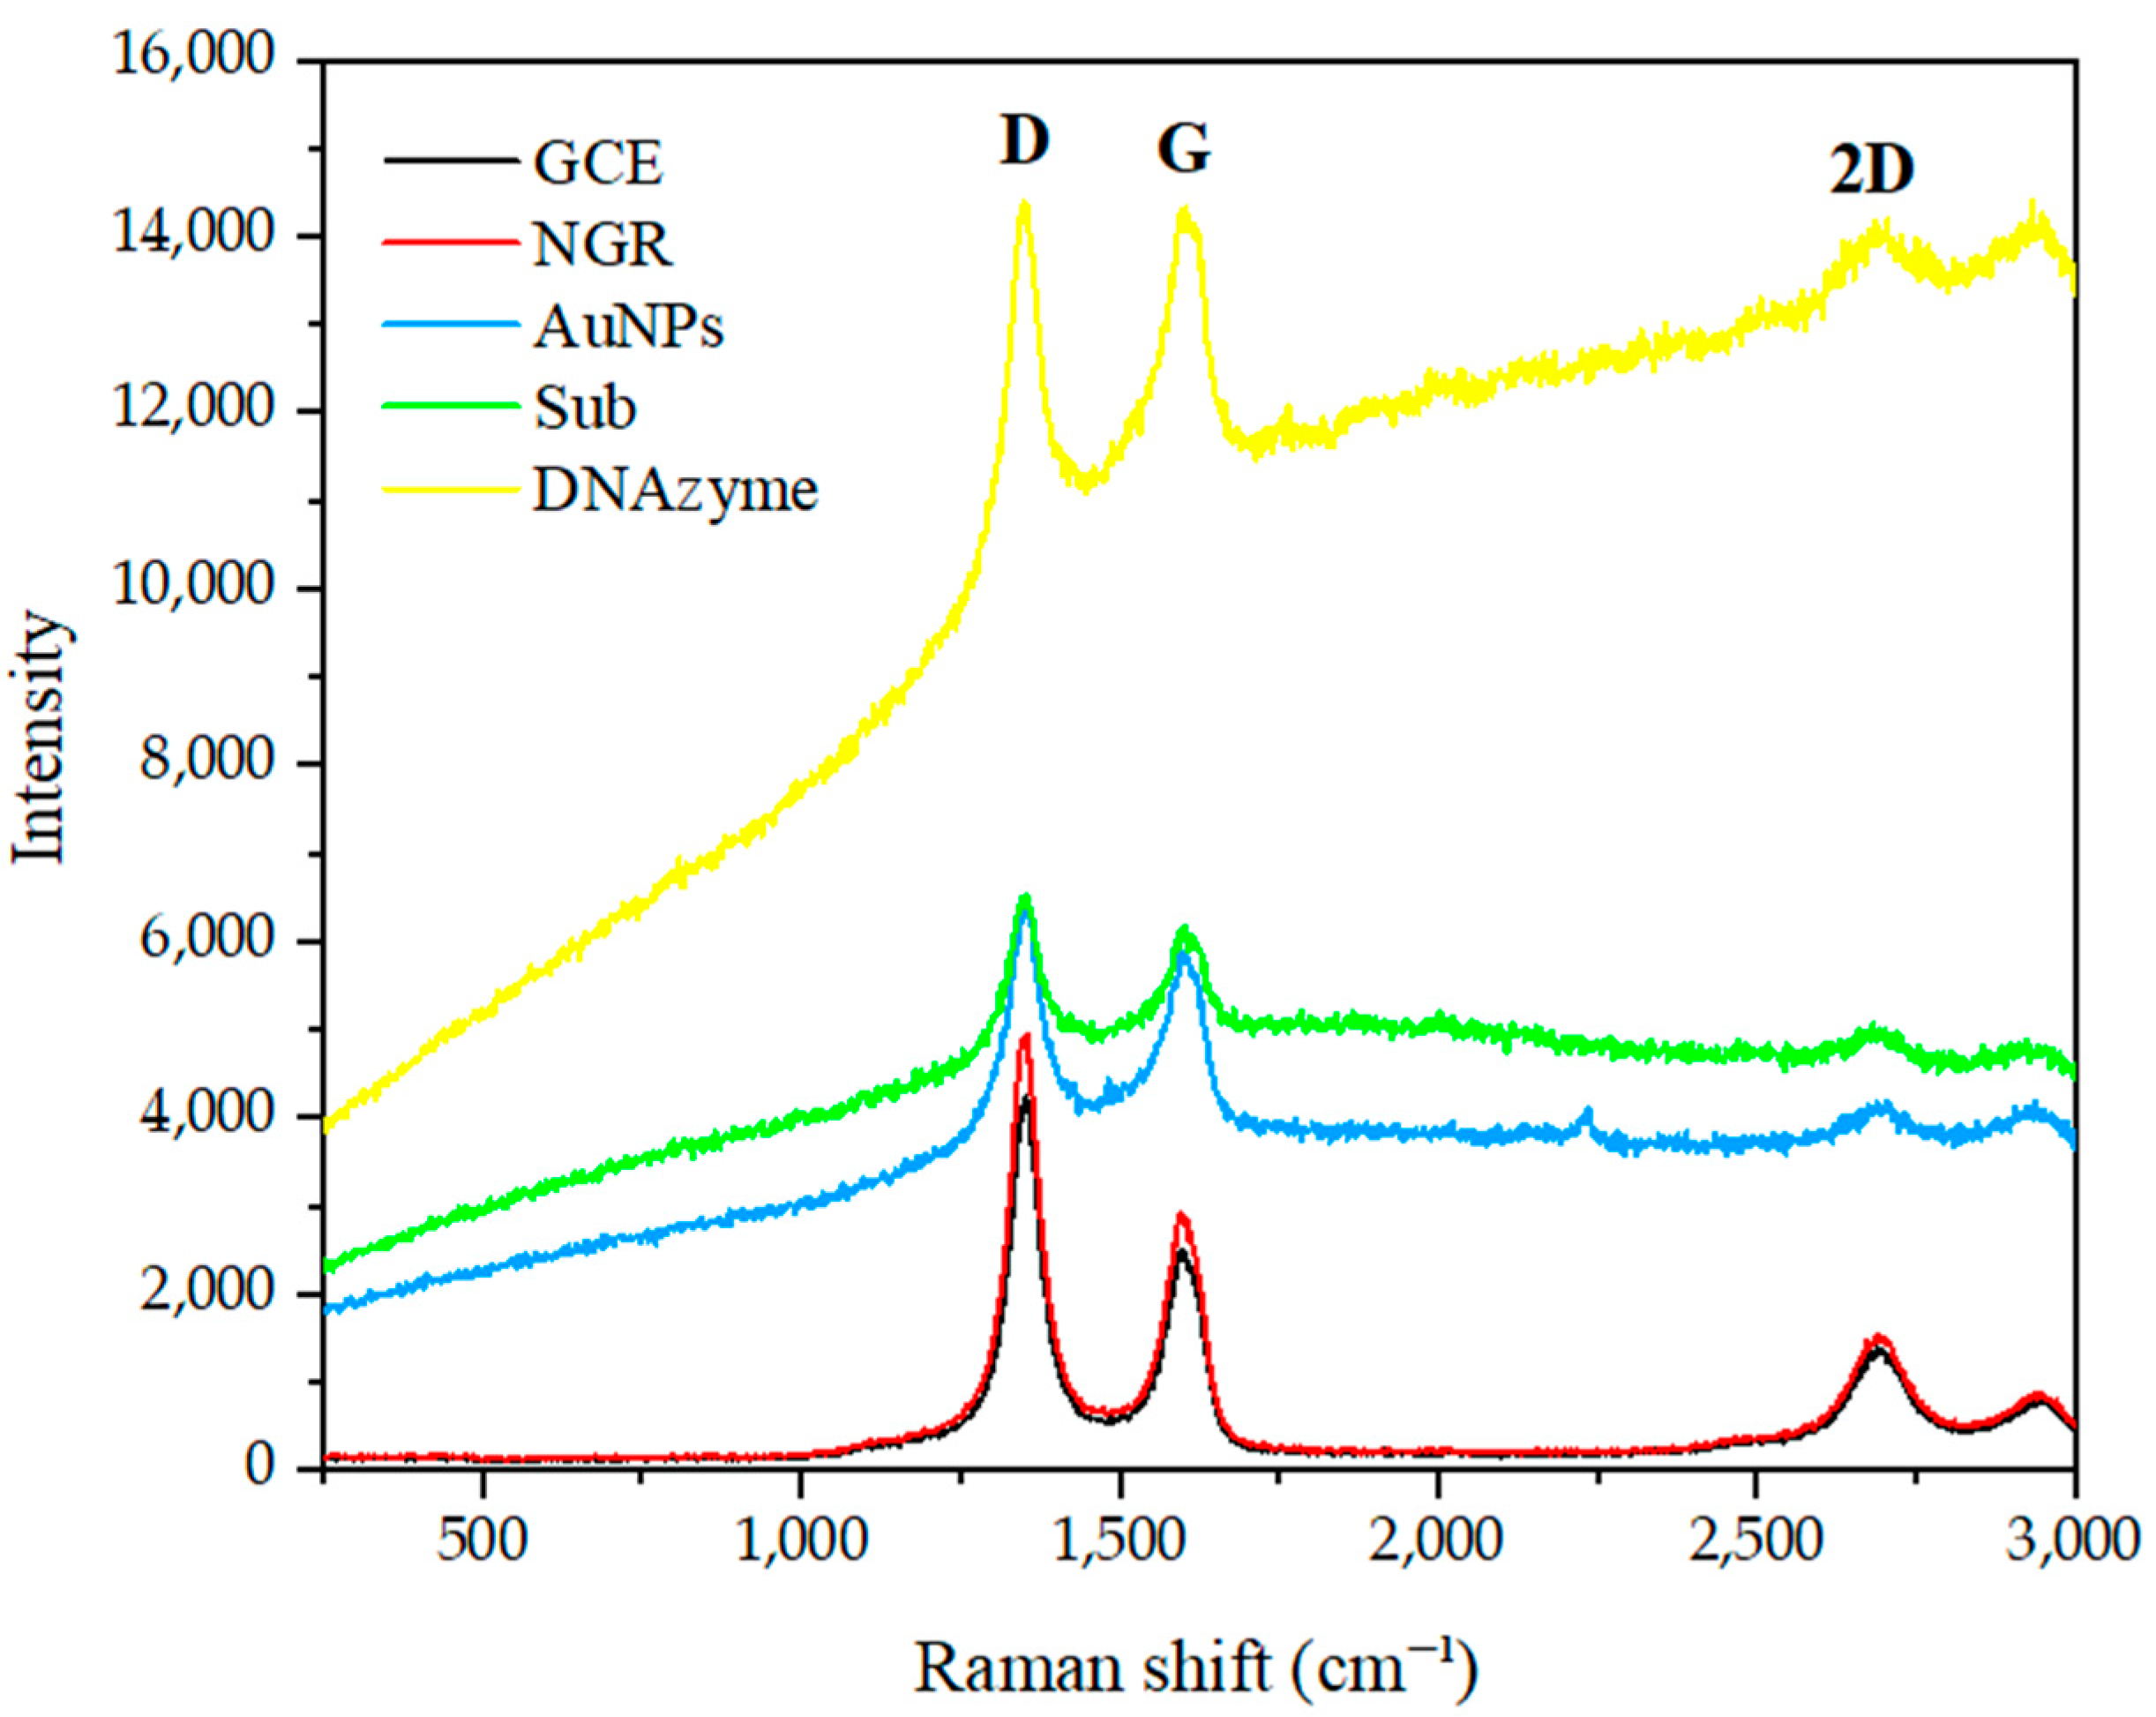
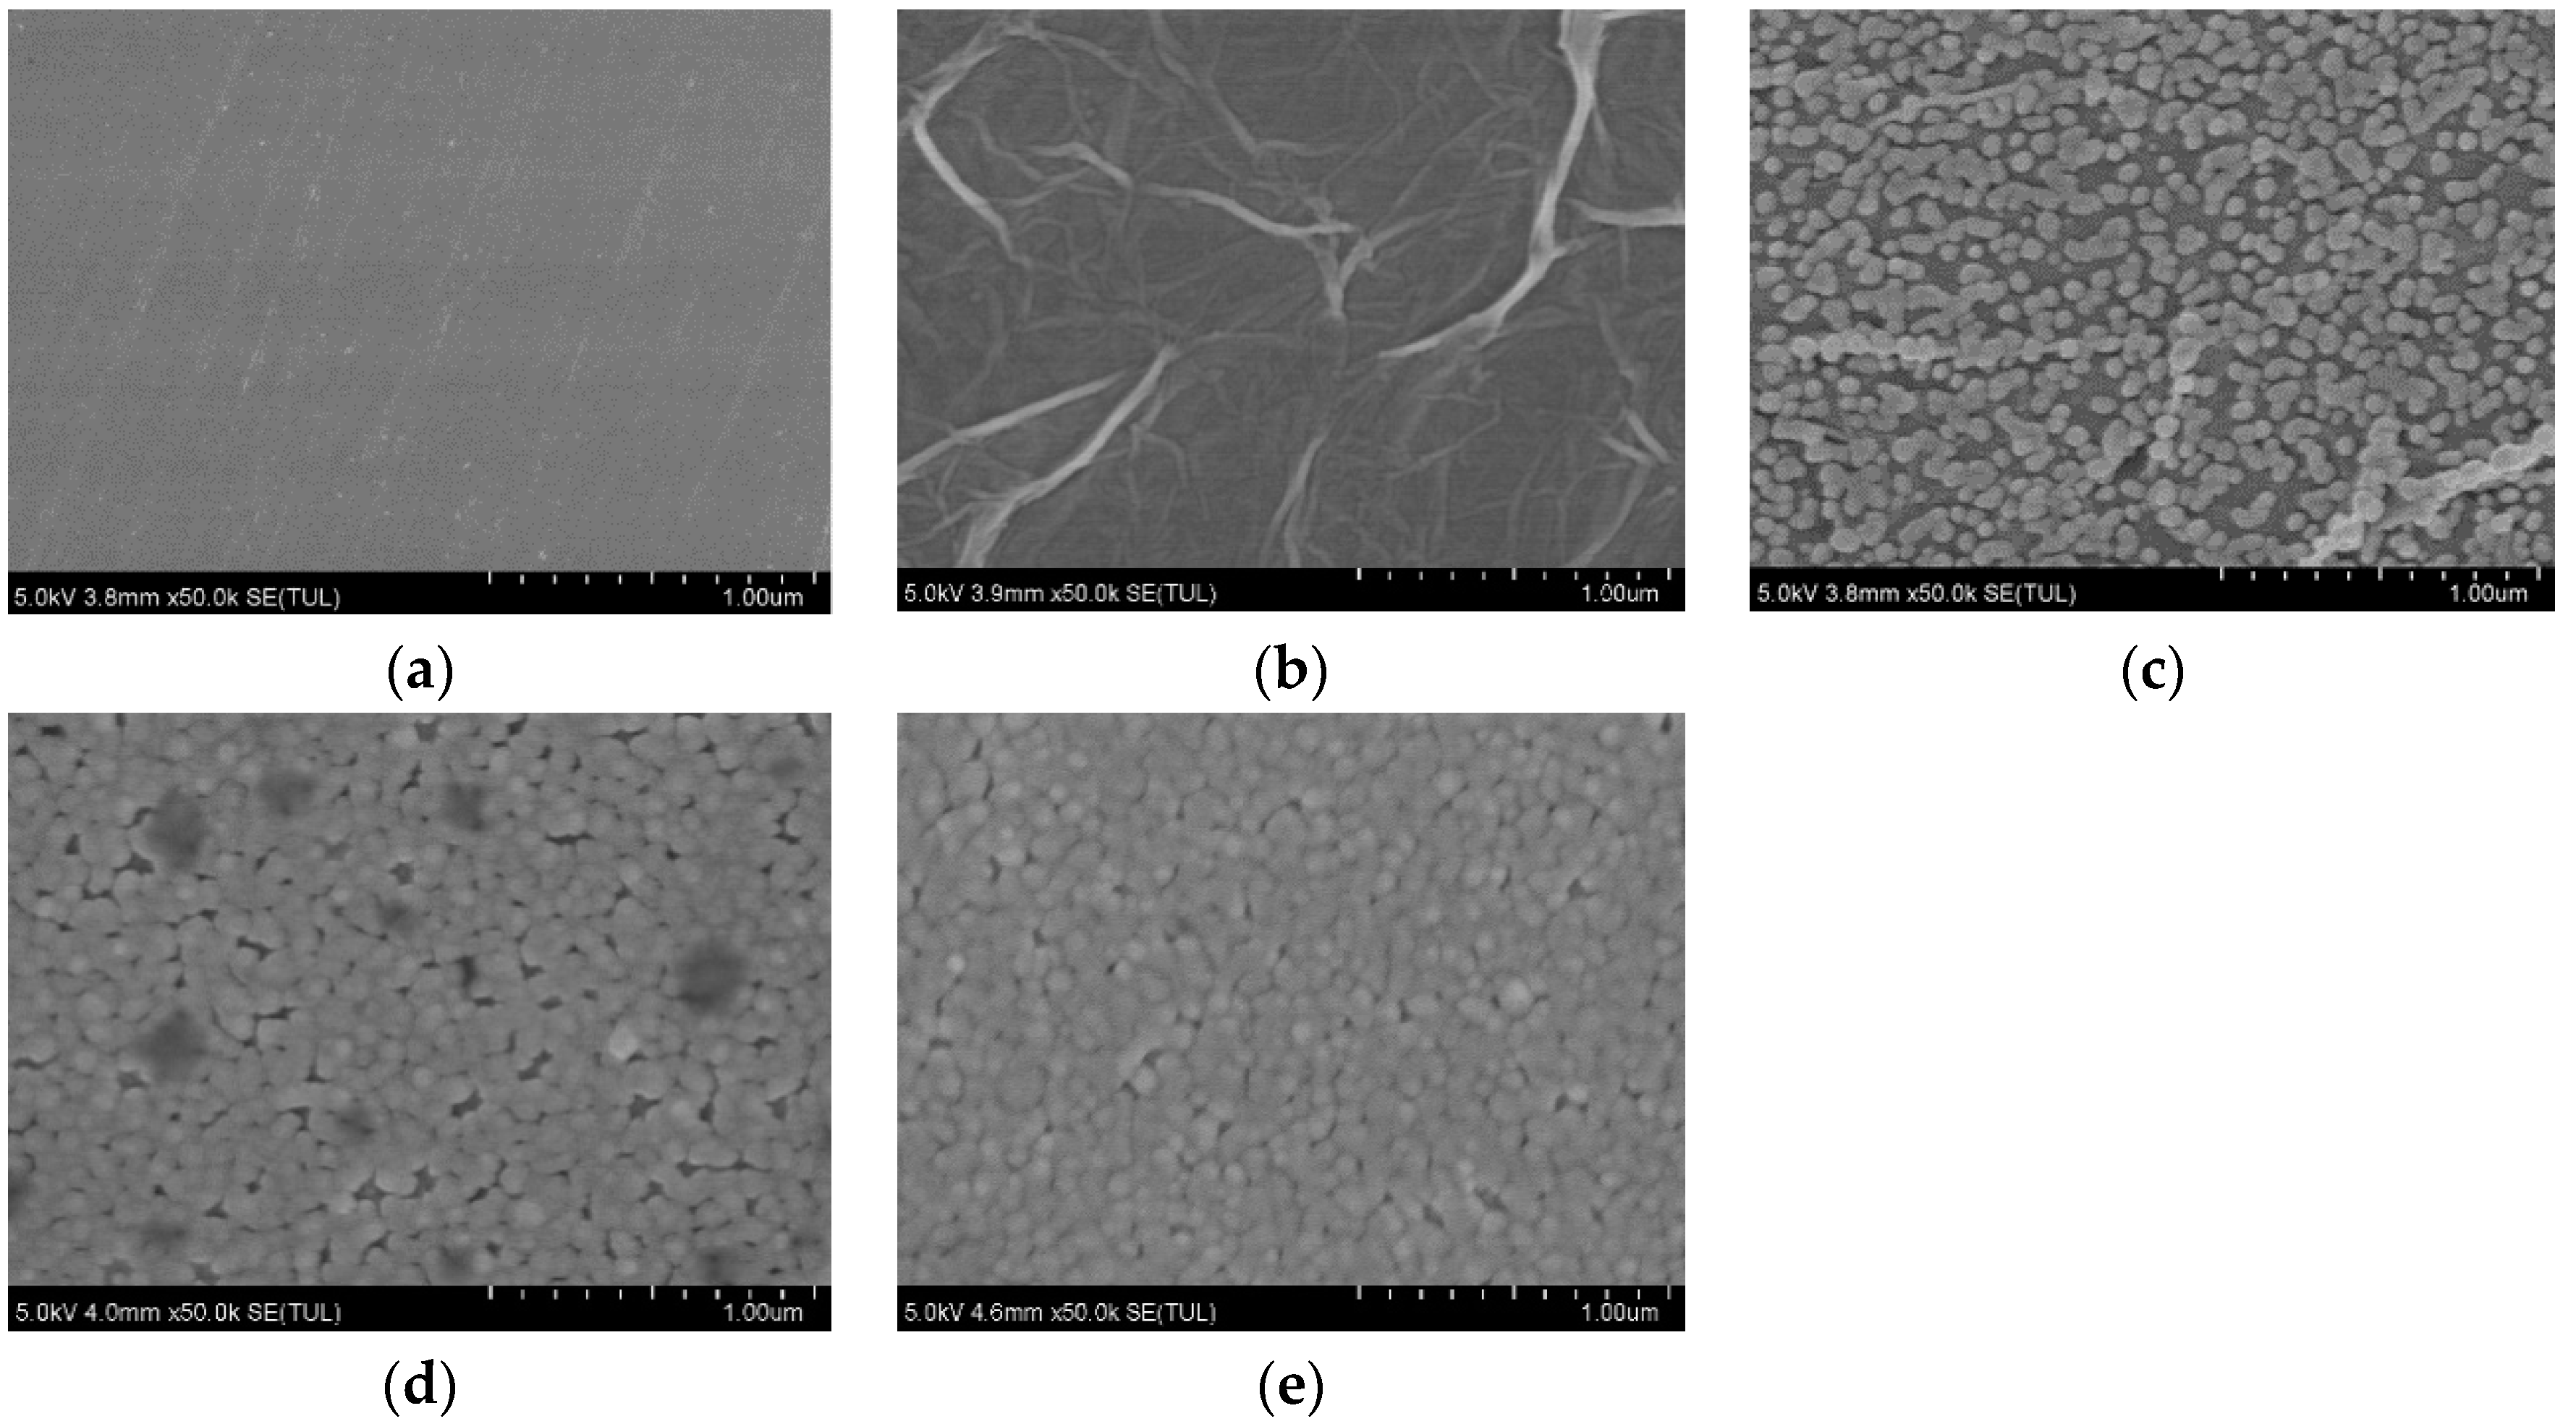
3.1. Characterization
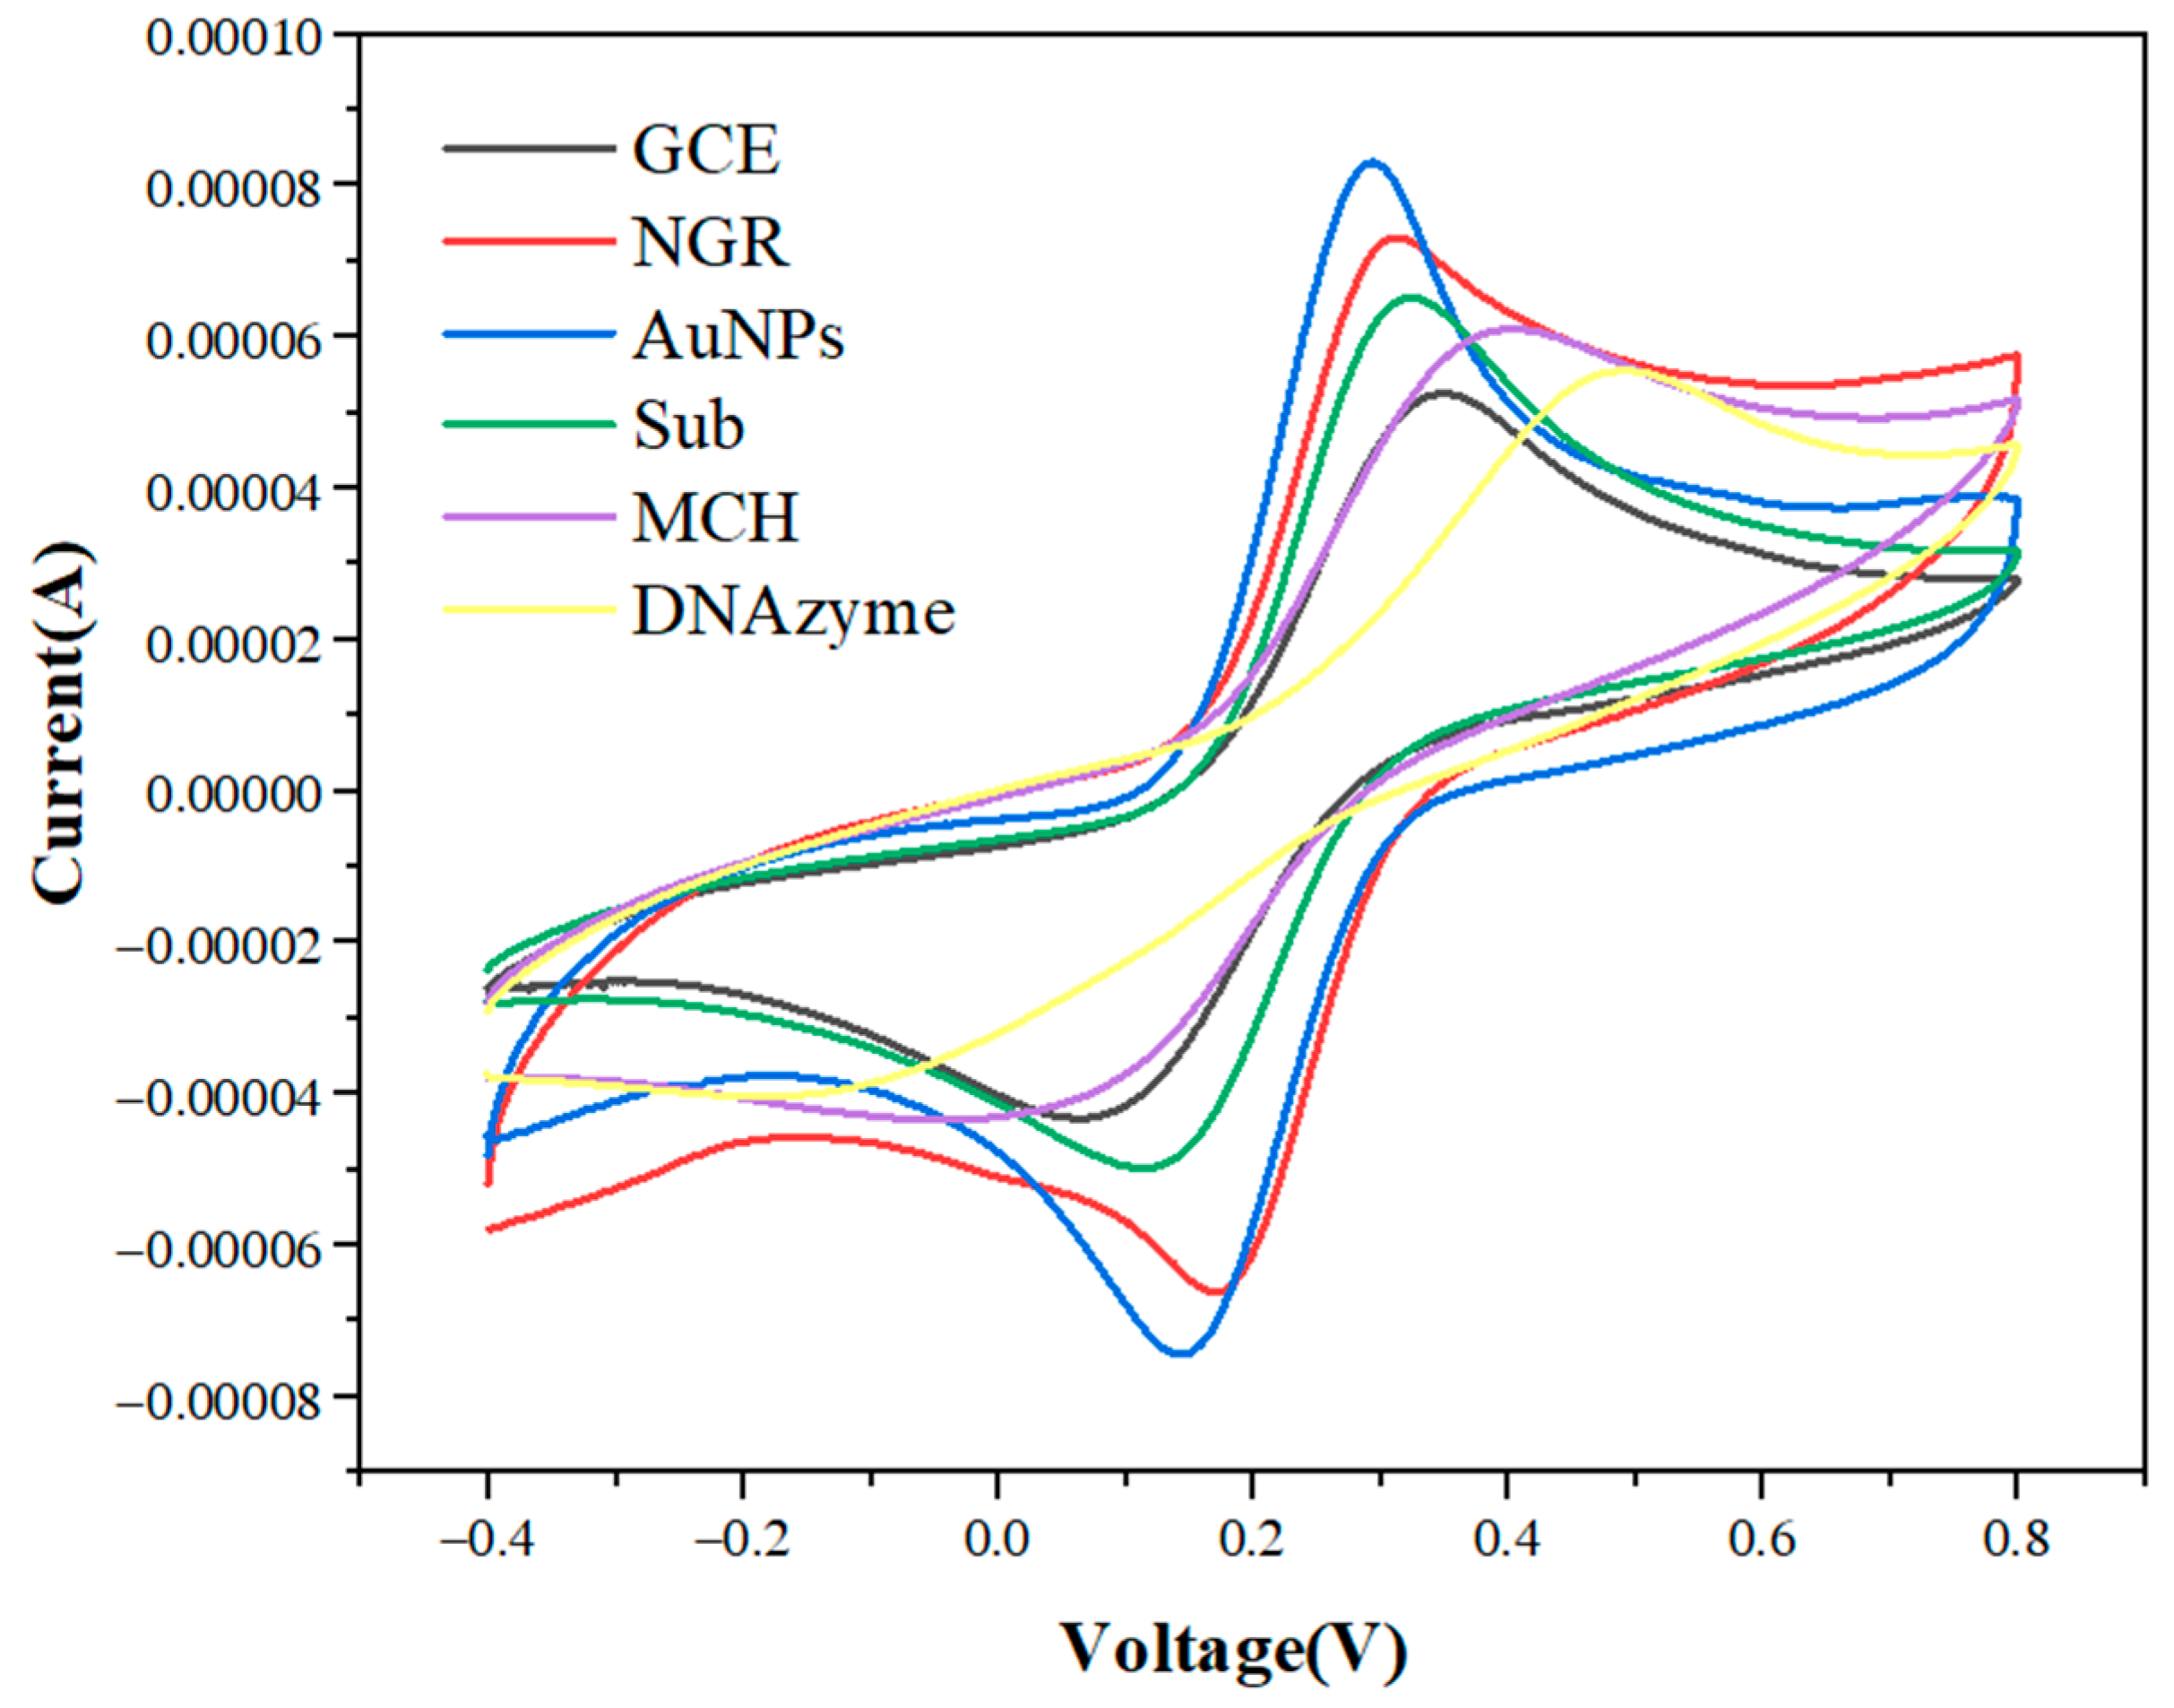
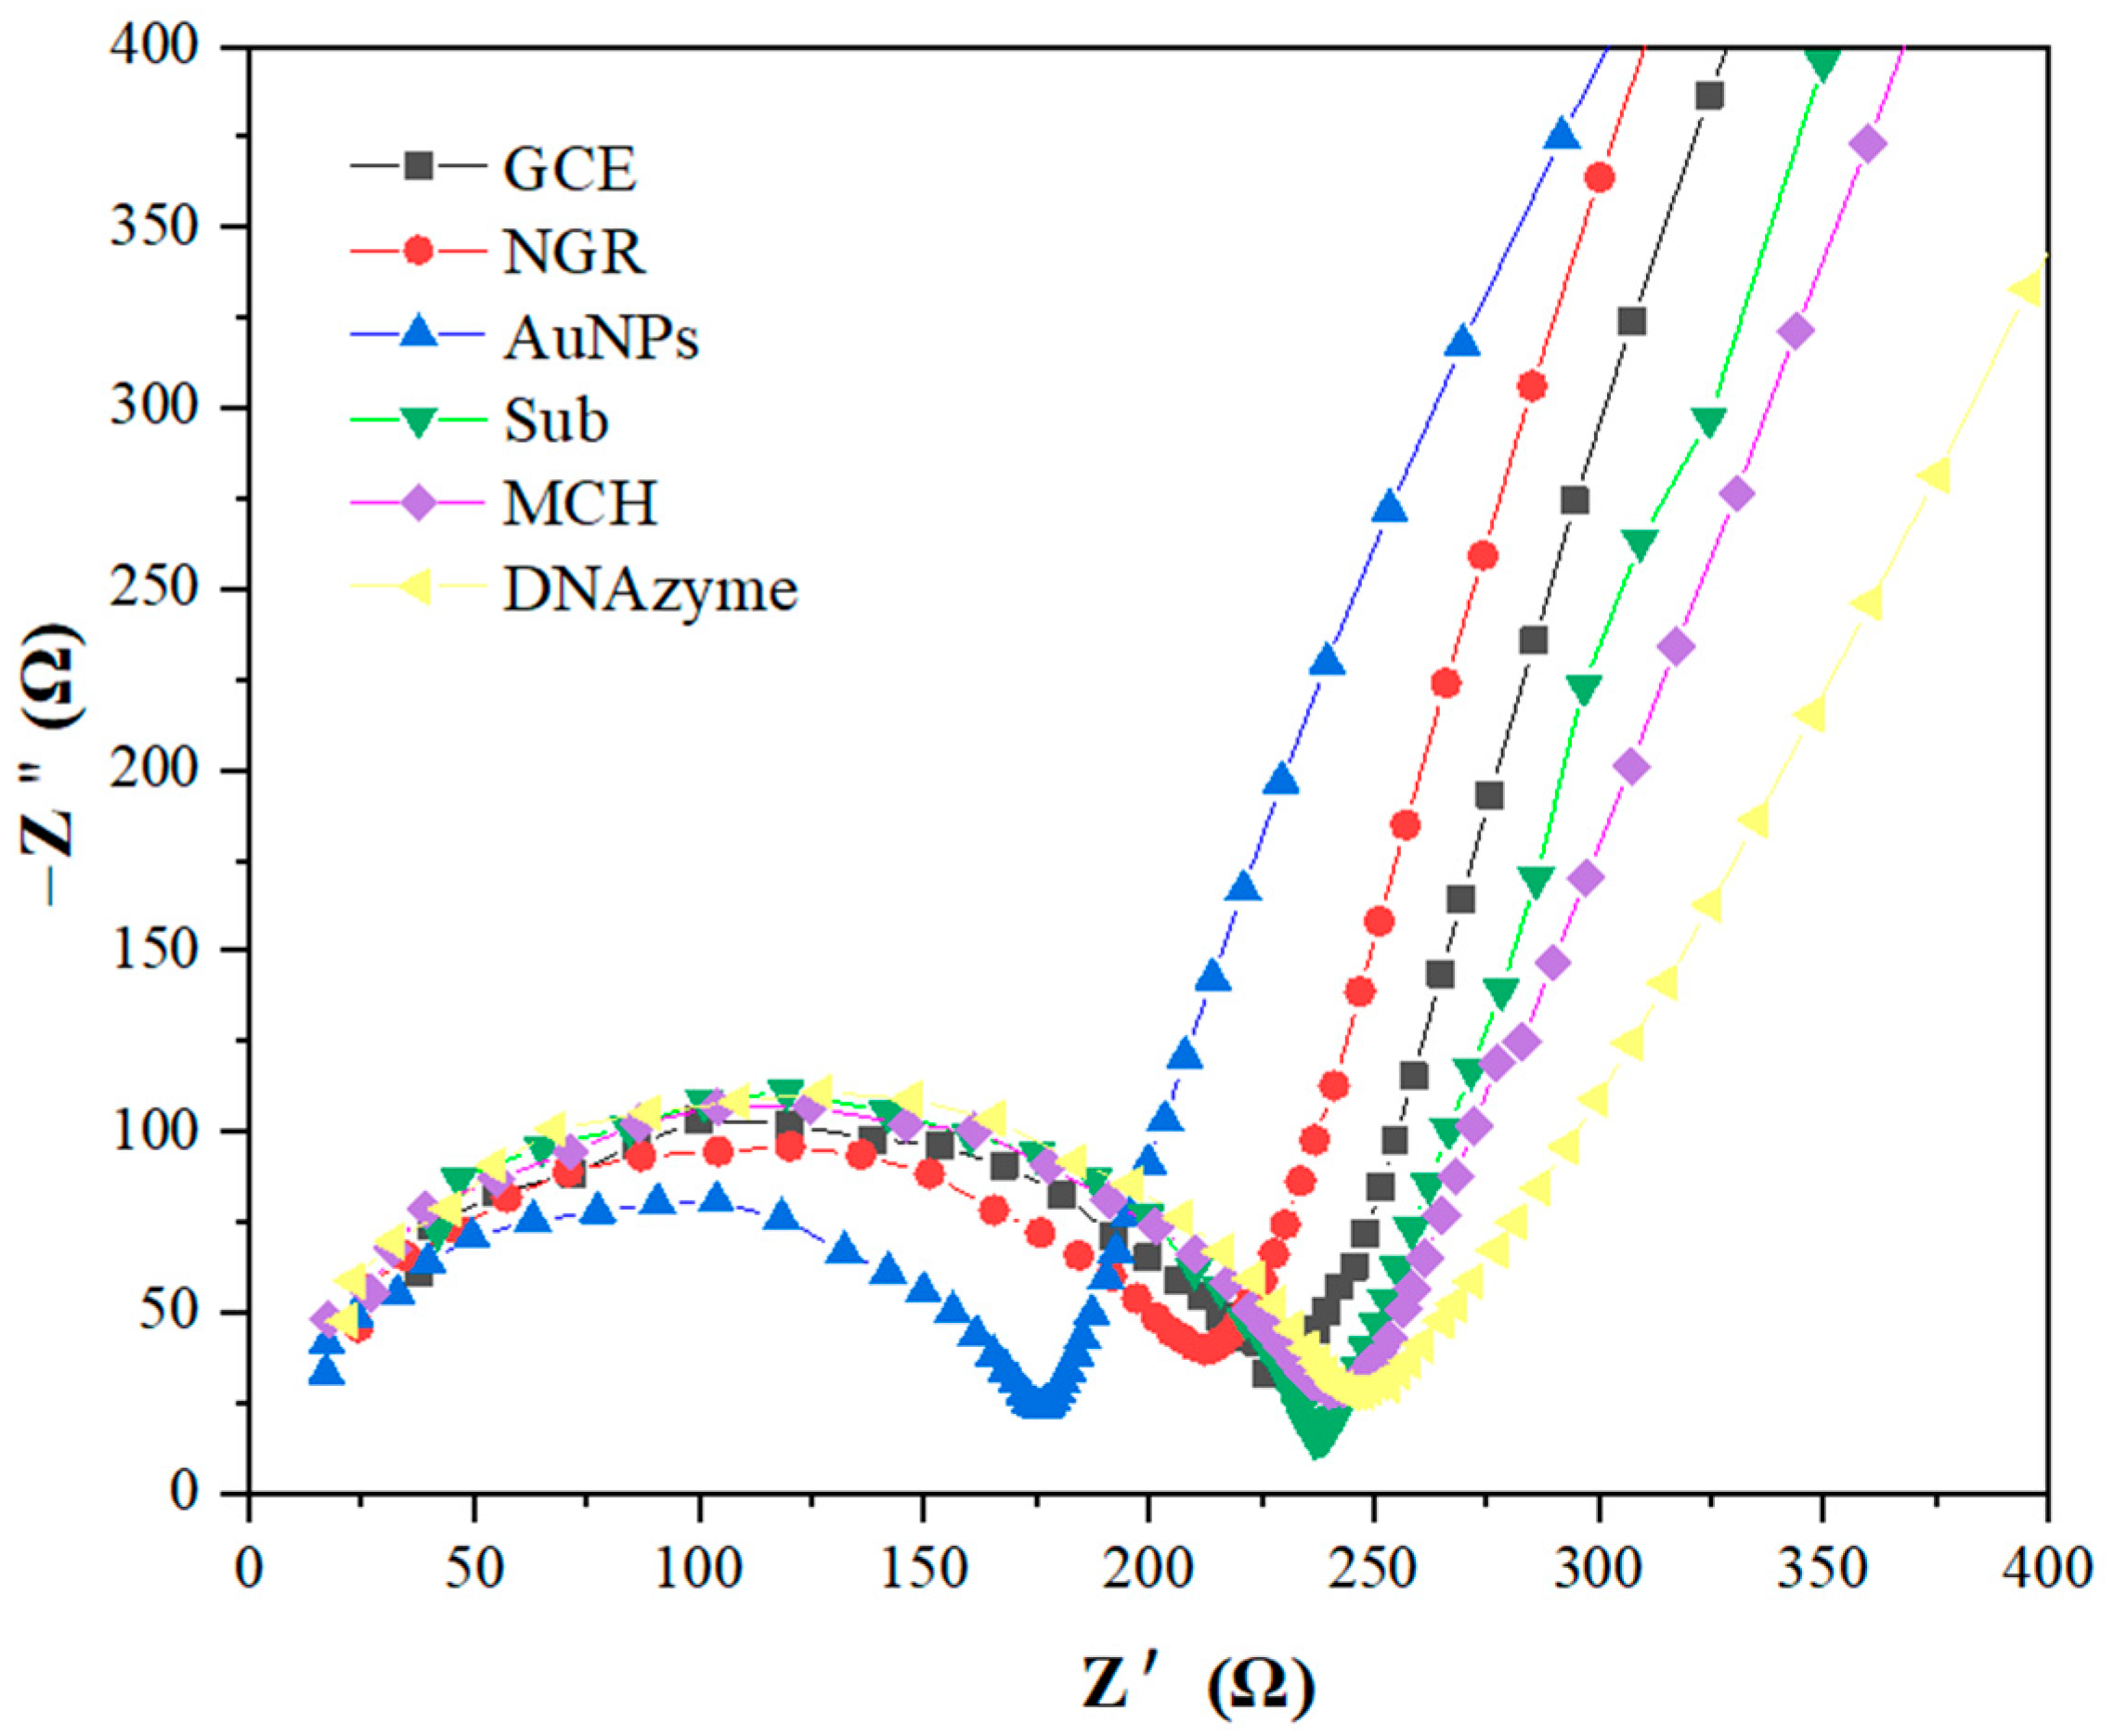
3.2. CV and EIS Characterization
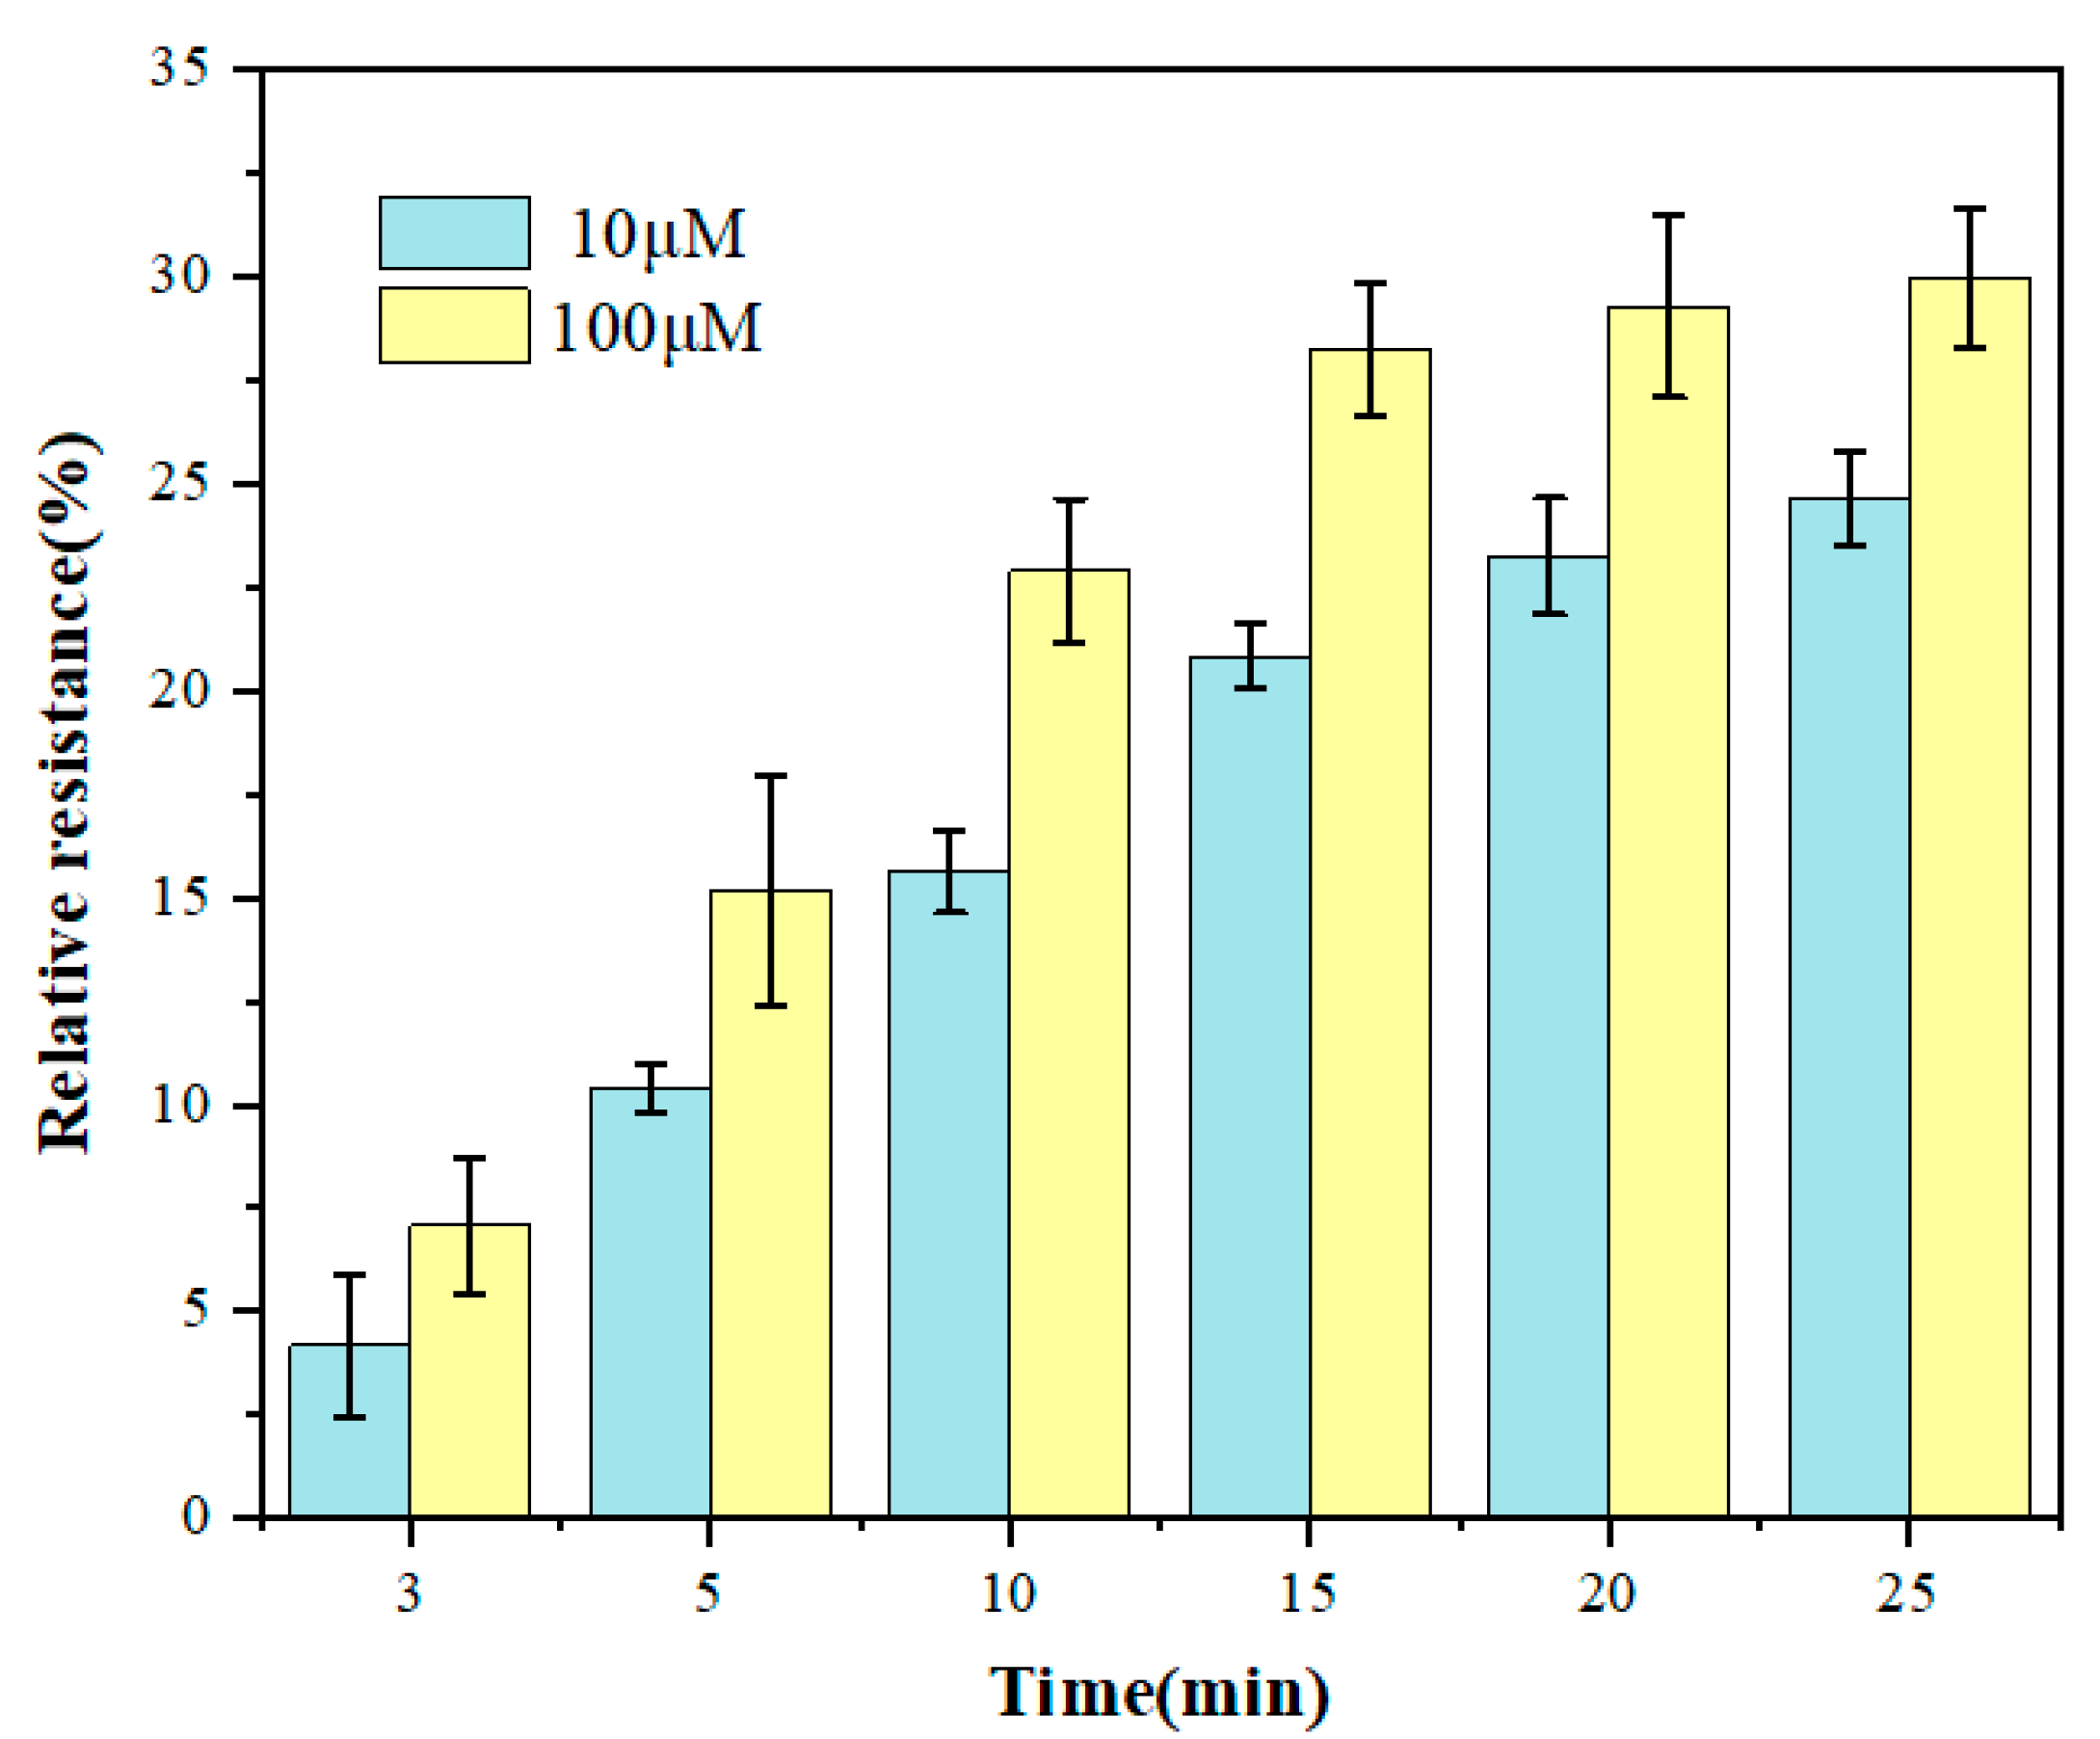
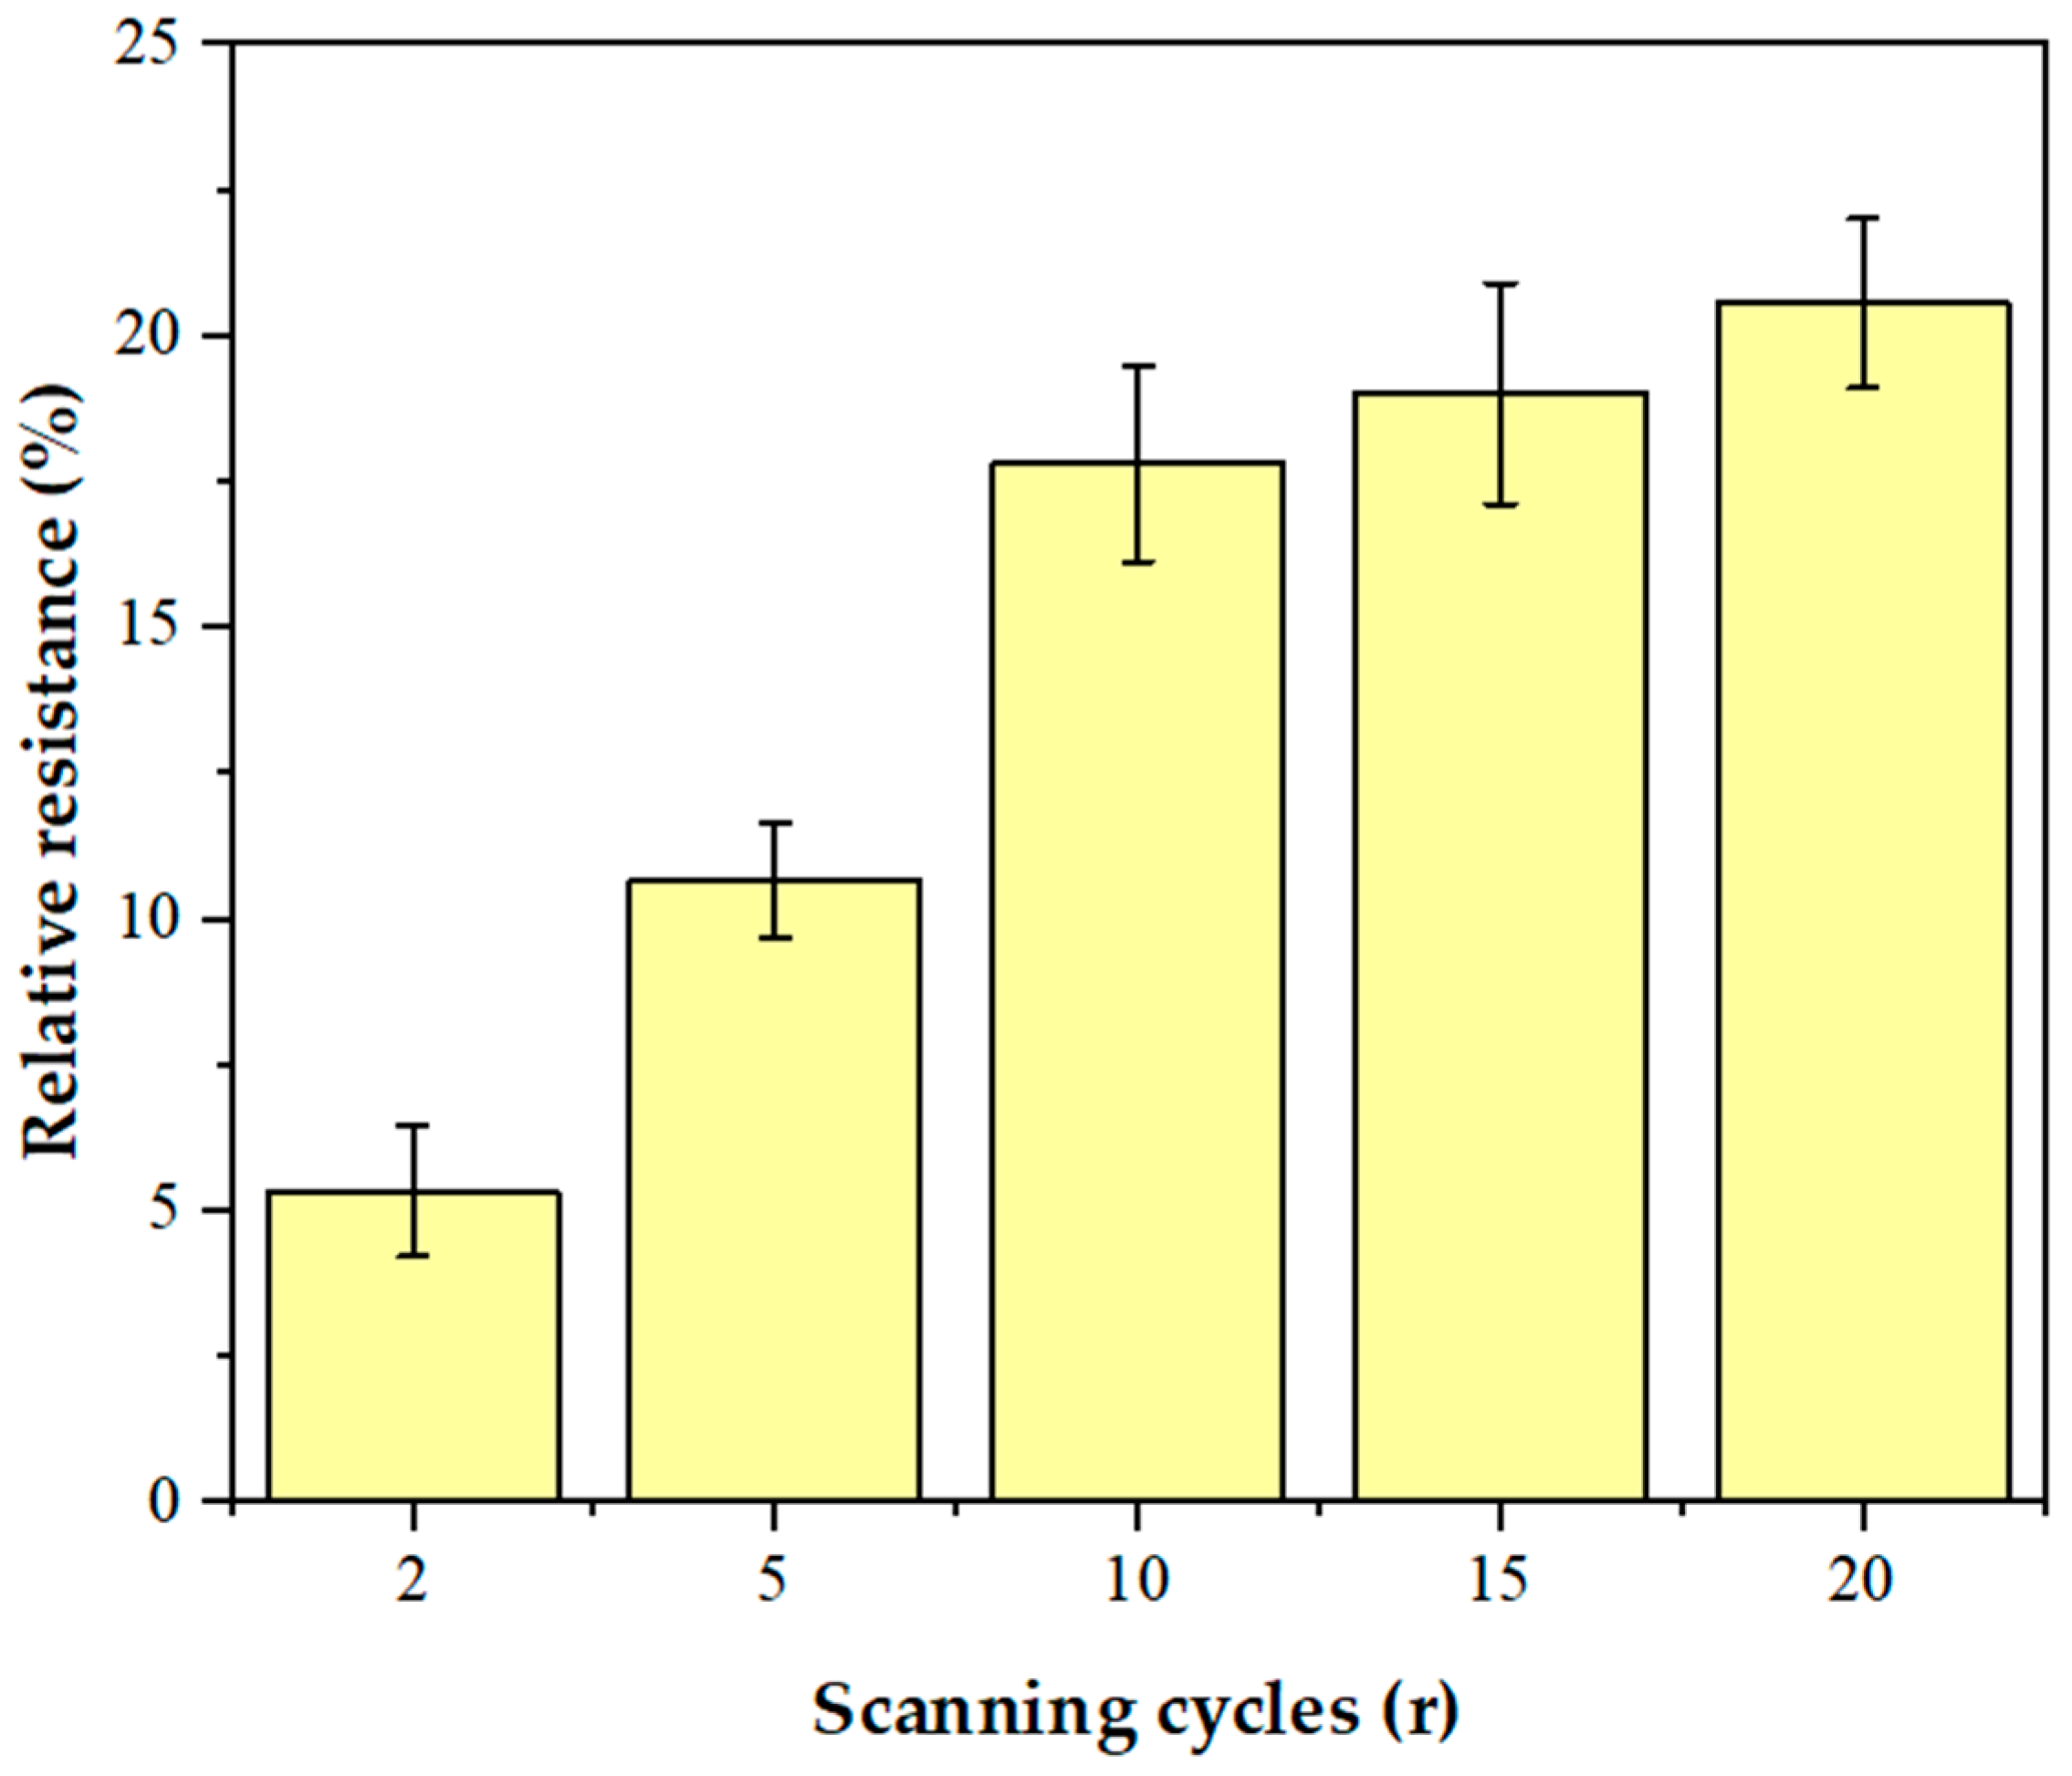
3.3. Optimization
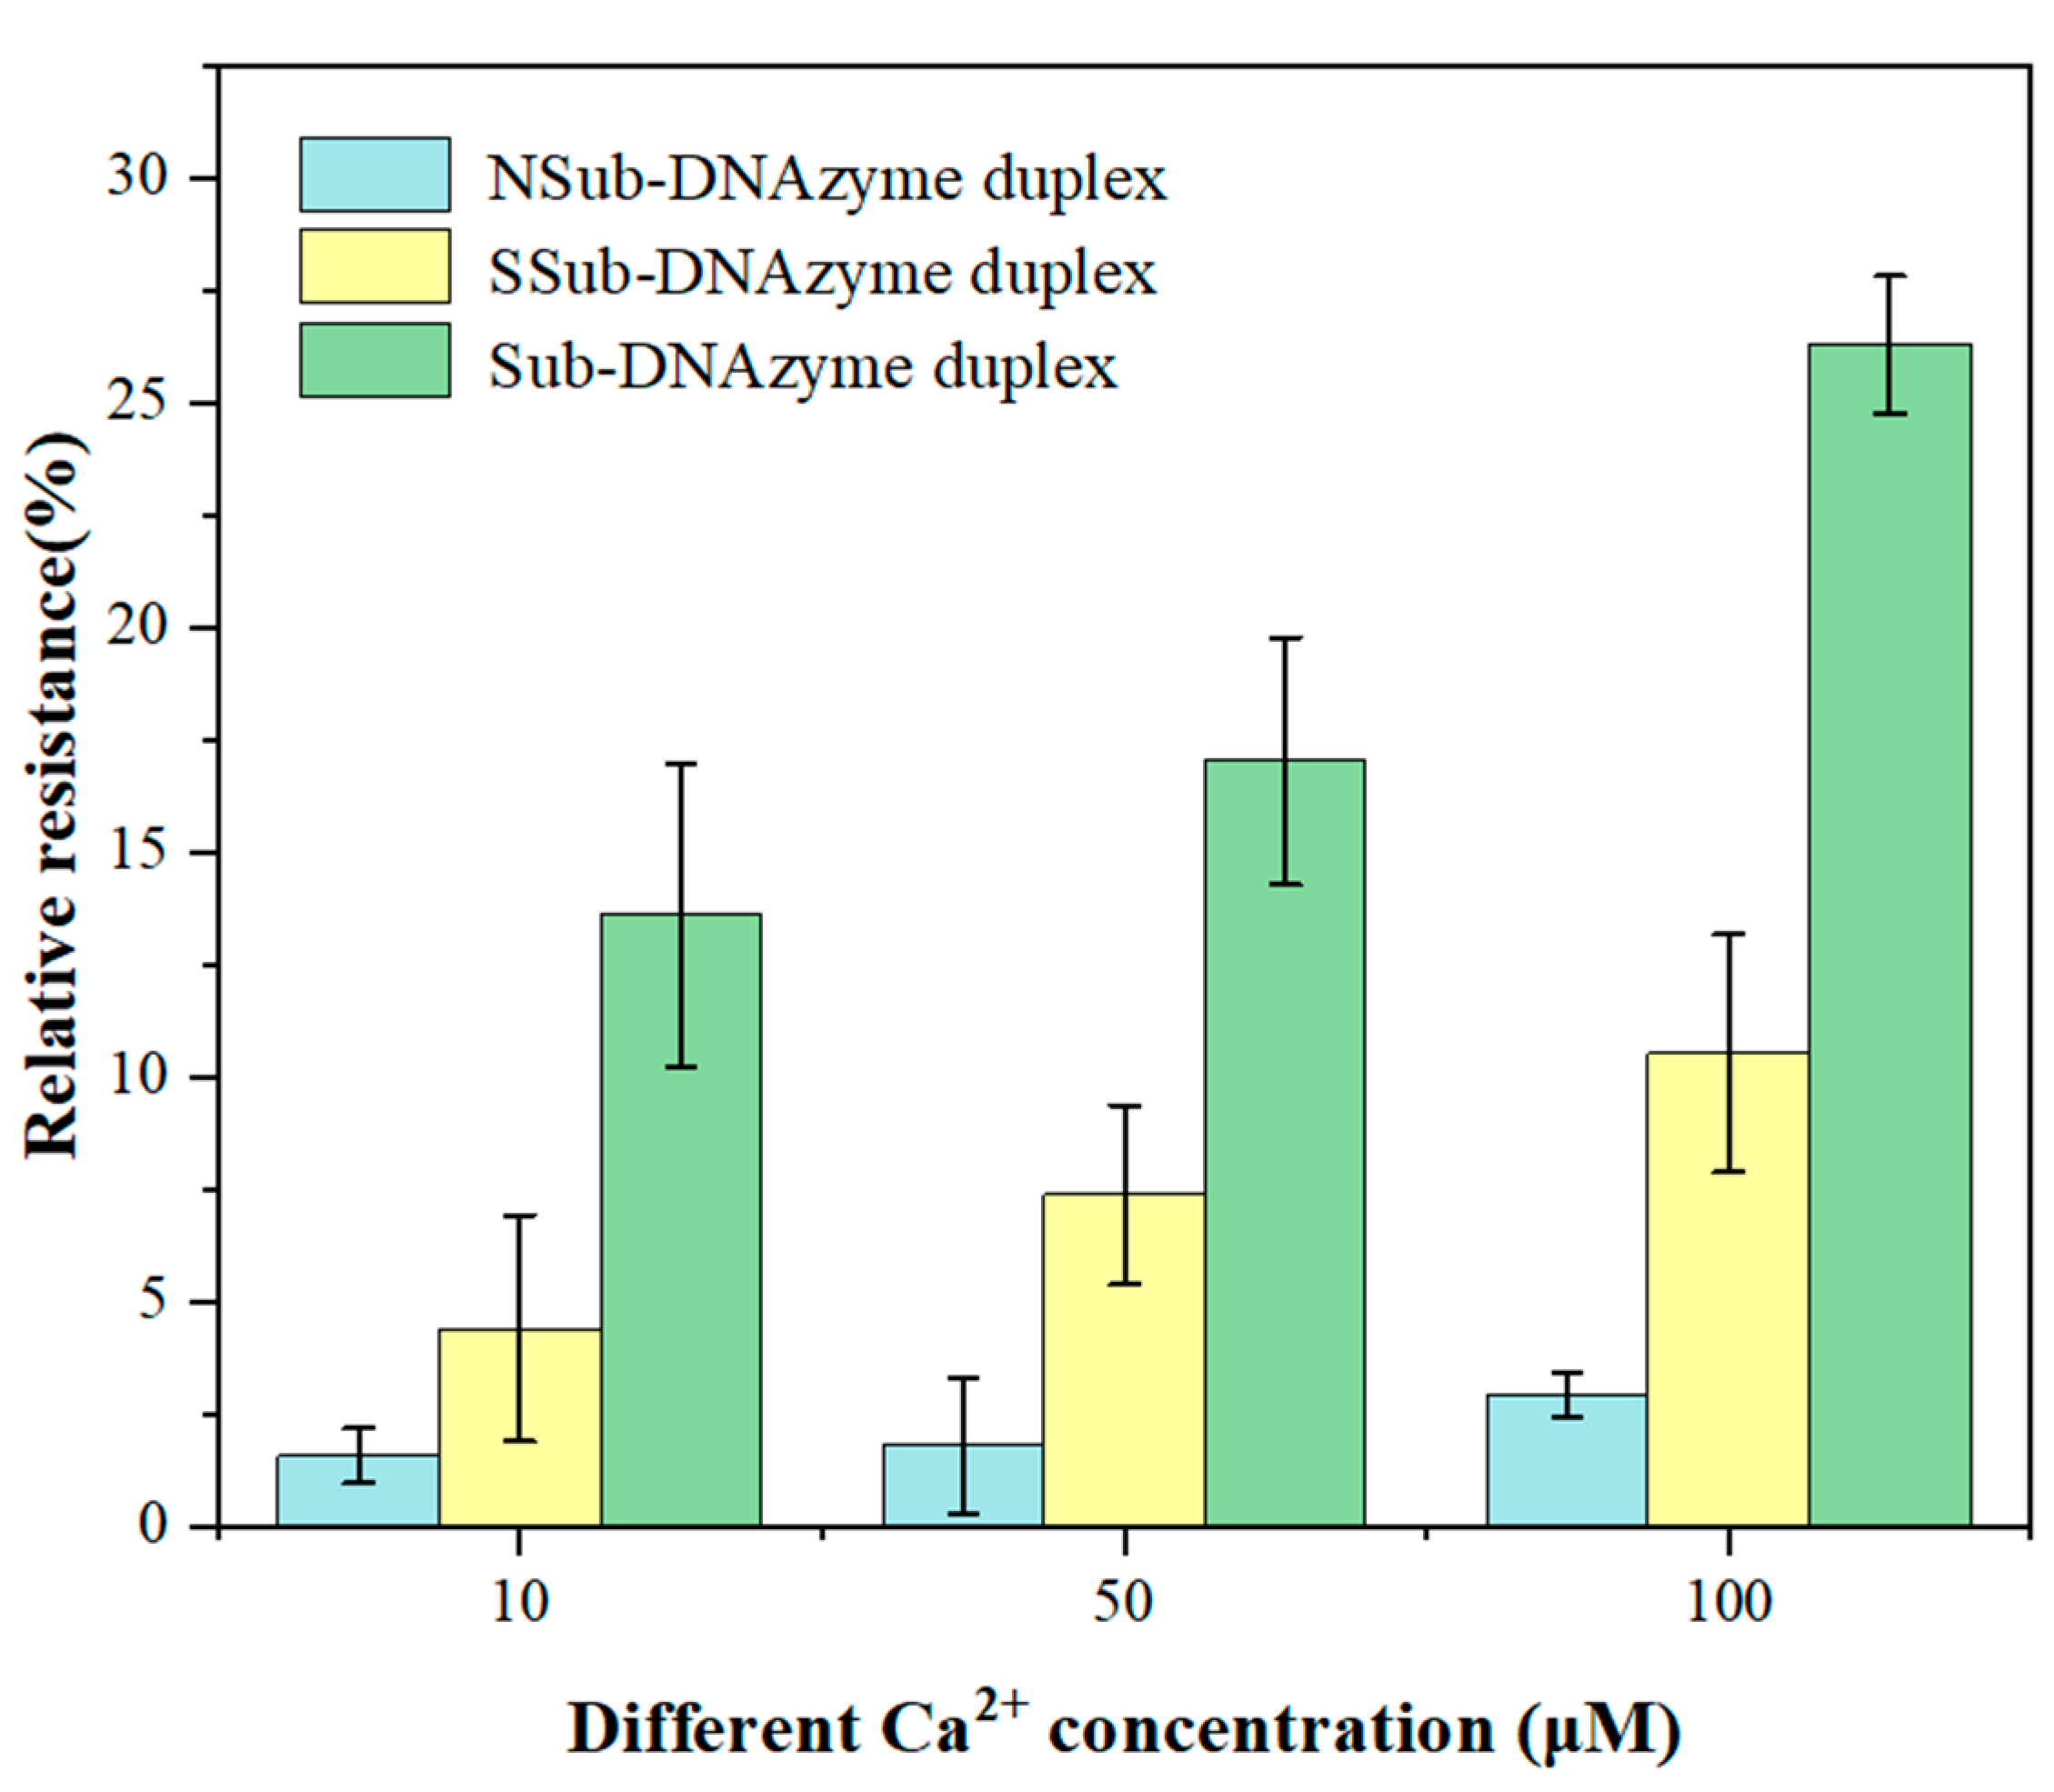
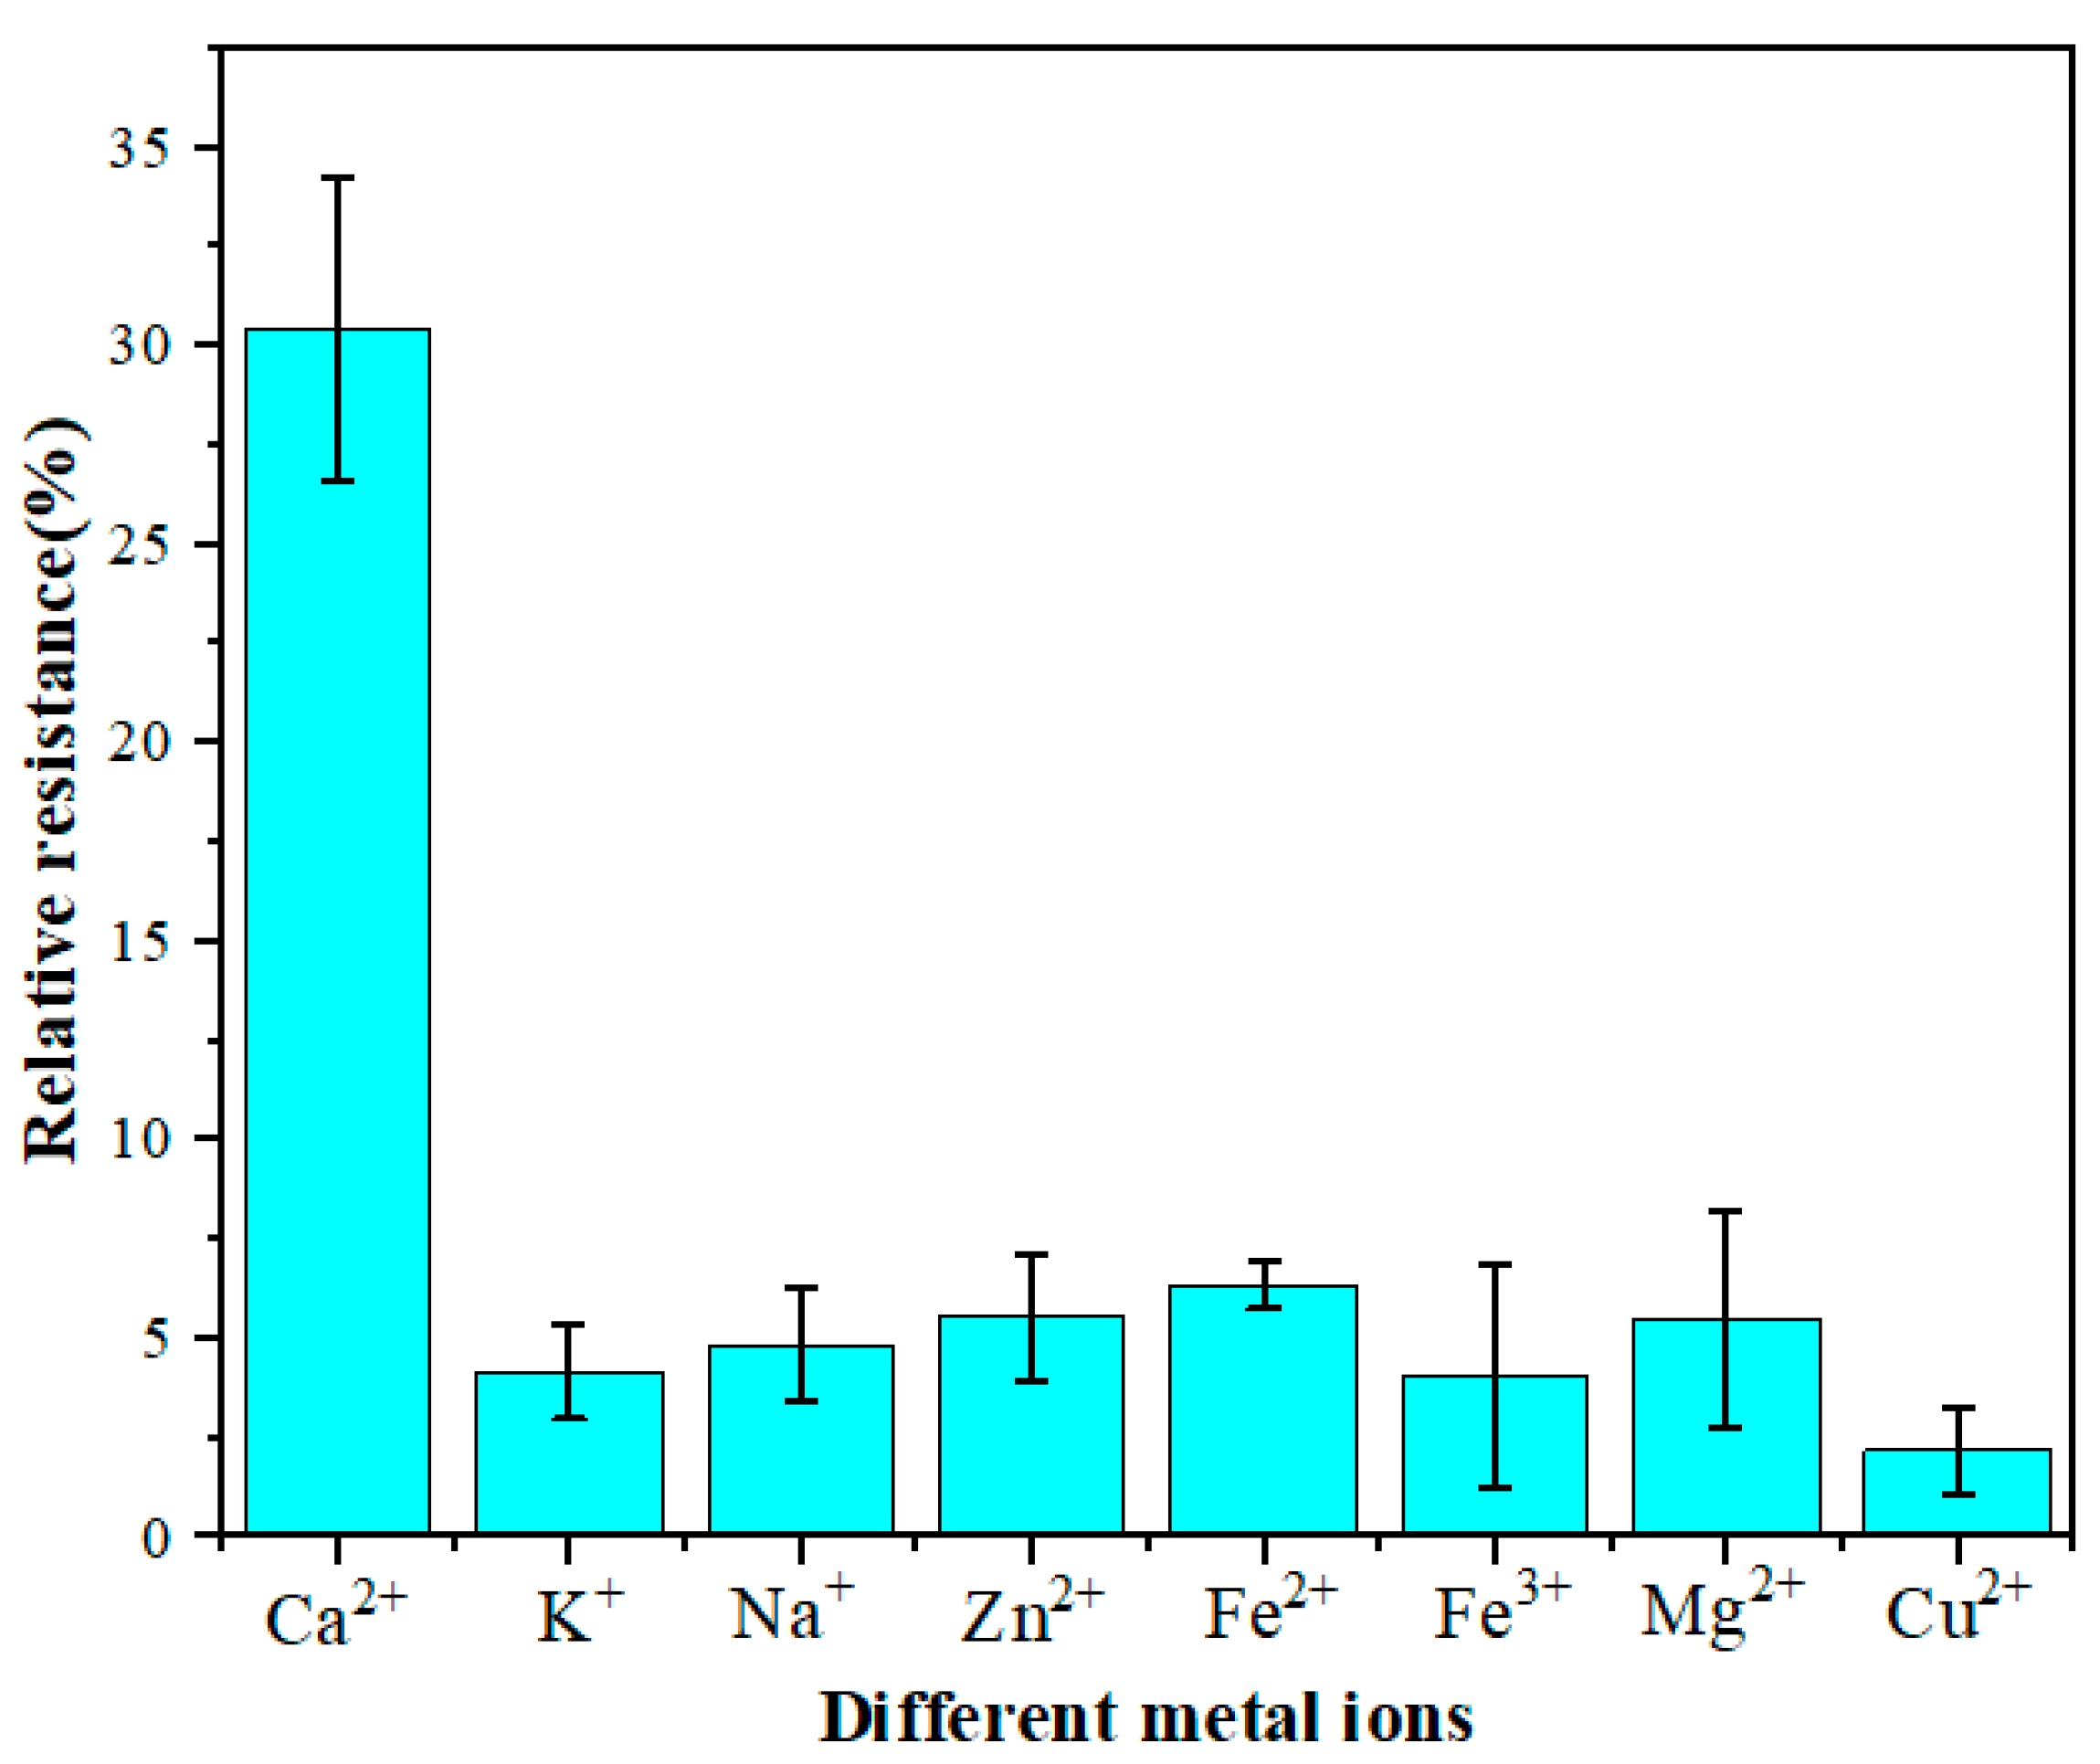
3.4. Interference
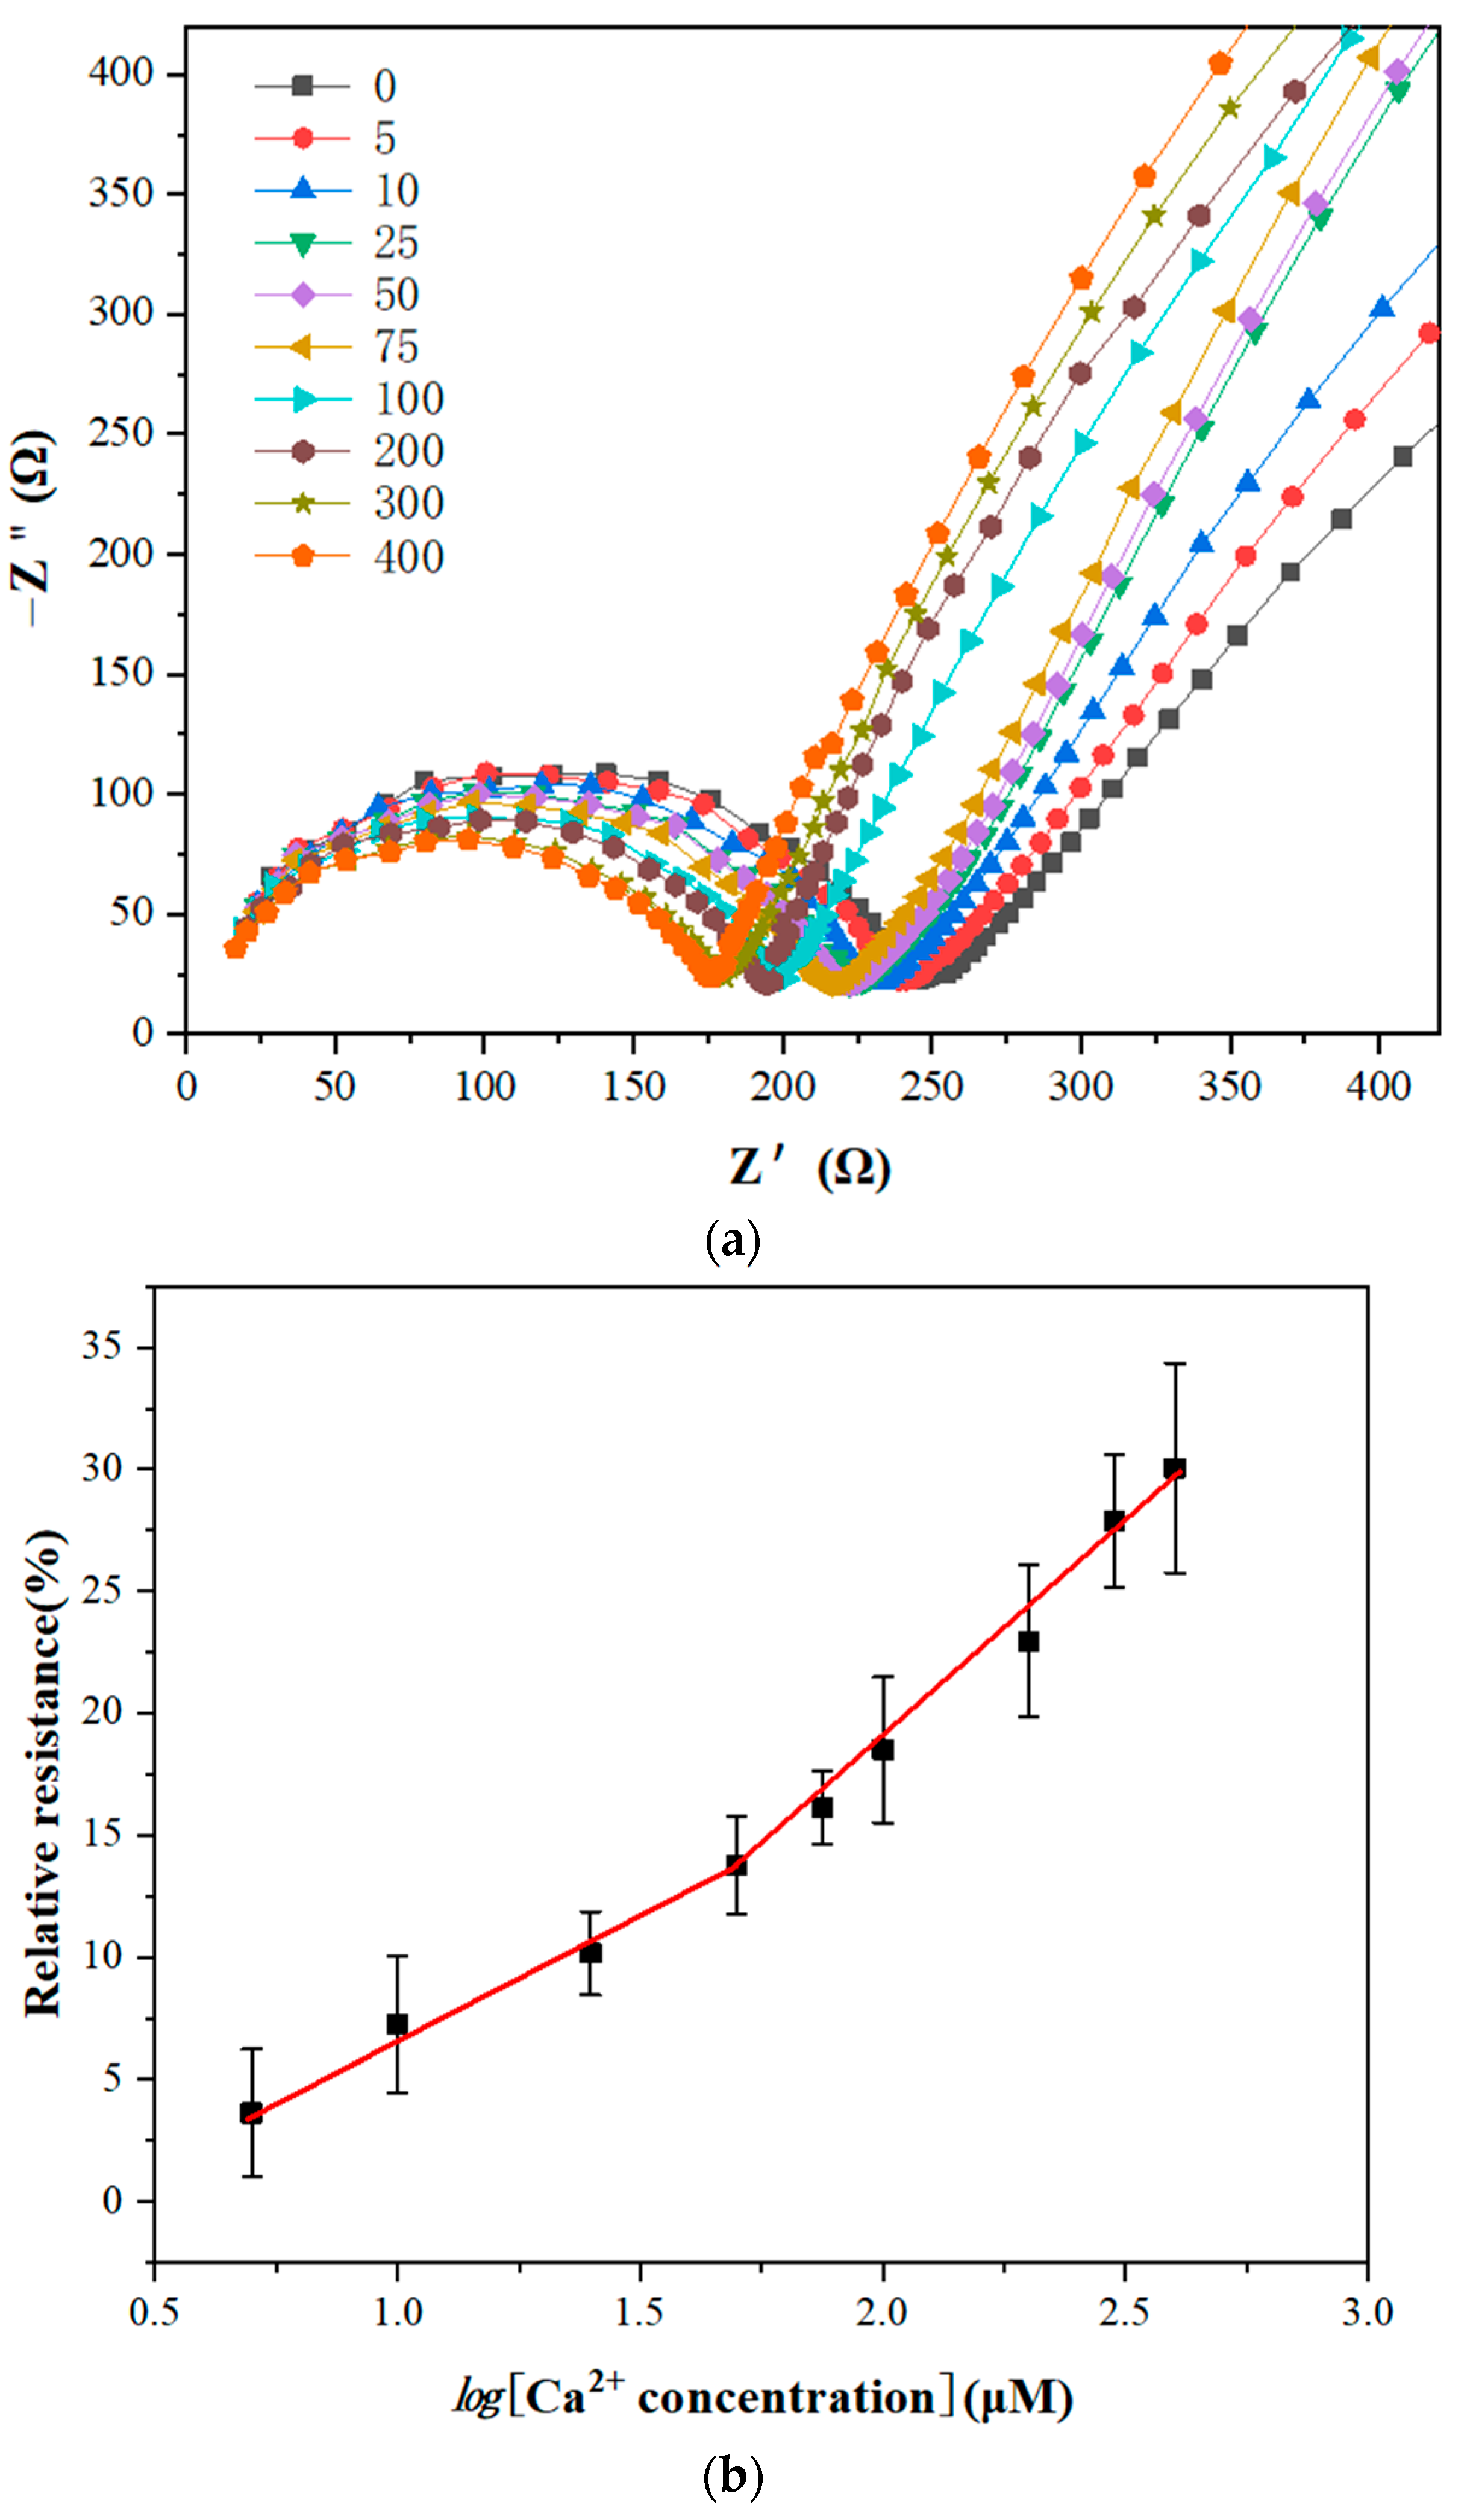
3.5. Ca2+ Sensing
3.6. Determination of Ca2+ in Real Samples
4. Conclusions
Supplementary Materials
Author Contributions
Funding
Institutional Review Board Statement
Informed Consent Statement
Data Availability Statement
Conflicts of Interest
References
- Wu, J. A DNAzyme-Based Electrochemical Impedance Biosensor for Highly Sensitive Detection of Cu2+ Ions in Aqueous Solution. Int. J. Electrochem. Sci. 2017, 12, 11666–11676. [Google Scholar] [CrossRef]
- Yu, T.; Zhou, W.; Liu, J. Ultrasensitive DNAzyme-Based Ca2+ Detection Boosted by Ethanol and a Solvent-Compatible Scaffold for Aptazyme Design. ChemBioChem 2018, 19, 31–36. [Google Scholar] [CrossRef] [PubMed]
- Chen, X.; Wang, X.; Lu, Z.; Luo, H.; Dong, L.; Ji, Z.; Xu, F.; Huo, D.; Hou, C. Ultra-Sensitive Detection of Pb2+ Based on DNAzymes Coupling with Multi-Cycle Strand Displacement Amplification (M-Sda) and Nano-Graphene Oxide. Sens. Actuators B Chem. 2020, 311, 127898. [Google Scholar] [CrossRef]
- He, Y.; Tian, J.; Zhang, J.; Chen, S.; Jiang, Y.; Hu, K.; Zhao, Y.; Zhao, S. DNAzyme Self-Assembled Gold Nanorods-Based Fret or Polarization Assay for Ultrasensitive and Selective Detection of Copper(II) Ion. Biosens. Bioelectron. 2014, 55, 285–288. [Google Scholar] [CrossRef]
- Santoro, S.W.; Joyce, G.F.; Sakthivel, K.; Gramatikova, S.; Barbas, C.F., 3rd. RNA Cleavage by a DNA Enzyme with Extended Chemical Functionality. J. Am. Chem. Soc. 2000, 122, 2433–2439. [Google Scholar] [CrossRef]
- Liao, Y.; Guo, S.; Hua, X.; Yuan, R.; Xu, W. Autocatalytic Replicated Mg2+-Ligation DNAzyme as Robust Biocatalyst for Sensitive, Label-Free and Enzyme-Free Electrochemical Biosensing of Protein. Sens. Actuators B Chem. 2020, 310, 127862. [Google Scholar] [CrossRef]
- Cao, C.; Liu, J.; Tang, S.; Dai, Z.; Xiao, F.; Rang, W.; Liu, L.; Chen, T.; Yuan, Y.; Li, L. Amplified Electrochemical Determination of UO22+ Based on the Cleavage of the DNAzyme and DNA-Modified Gold Nanoparticle Network Structure. Microchim. Acta 2020, 187, 311. [Google Scholar] [CrossRef]
- Li, T.; Dong, S.; Wang, E. Label-Free Colorimetric Detection of Aqueous Mercury Ion (Hg2+) Using Hg2+-Modulated G-Quadruplex-Based DNAzymes. Anal. Chem. 2009, 81, 2144–2149. [Google Scholar] [CrossRef]
- Wang, M.; Zhang, S.; Ye, Z.; Peng, D.; He, L.; Yan, F.; Yang, Y.; Zhang, H.; Zhang, Z. A Gold Electrode Modified with Amino-Modified Reduced Graphene Oxide, Ion Specific DNA and DNAzyme for Dual Electrochemical Determination of Pb (II) and Hg (II). Microchim. Acta 2015, 182, 2251–2258. [Google Scholar] [CrossRef]
- Robertson, D.L.; Joyce, G.F. Selection in Vitro of an RNA Enzyme That Specifically Cleaves Single-Stranded DNA. Nature 1990, 344, 467–468. [Google Scholar] [CrossRef]
- Ren, W.; Huang, P.J.J.; He, M.; Lyu, M.; Wang, S.; Wang, C.; Liu, J. The Two Classic Pb2+-Selective DNAzymes Are Related: Rational Evolution for Understanding Metal Selectivity. ChemBioChem 2020, 21, 1293–1297. [Google Scholar] [CrossRef] [PubMed]
- Heaton, I.; Platt, M. DNAzyme Sensor for the Detection of Ca2+ Using Resistive Pulse Sensing. Sensors 2020, 20, 5877. [Google Scholar] [CrossRef] [PubMed]
- Zhou, W.; Saran, R.; Huang, P.J.J.; Ding, J.; Liu, J. An Exceptionally Selective DNA Cooperatively Binding Two Ca2+ Ions. ChemBioChem 2017, 18, 518–522. [Google Scholar] [CrossRef] [PubMed]
- Zhou, W.; Zhang, Y.; Ding, J.; Liu, J. In Vitro Selection in Serum: RNA-Cleaving DNAzymes for Measuring Ca2+ and Mg2+. Acs Sens. 2016, 1, 600–606. [Google Scholar] [CrossRef]
- Geim, A.K.; Novoselov, K.S. The Rise of Graphene. In Nanoscience and Technology: A Collection of Reviews from Nature Journals; World Scientific: Singapore, 2010; pp. 11–19. [Google Scholar]
- Li, X.; Zhang, G.; Bai, X.; Sun, X.; Wang, X.; Wang, E.; Dai, H. Highly Conducting Graphene Sheets and Langmuir-Blodgett Films. Nat. Nanotechnol. 2008, 3, 538–542. [Google Scholar] [CrossRef] [Green Version]
- Wang, Y.; Shao, Y.; Matson, D.W.; Li, J.; Lin, Y. Nitrogen-Doped Graphene and Its Application in Electrochemical Biosensing. ACS Nano 2010, 4, 1790–1798. [Google Scholar] [CrossRef]
- Giovannetti, G.; Khomyakov, P.A.; Brocks, G.; Karpan, V.V.; van den Brink, J.; Kelly, P.J. Doping Graphene with Metal Contacts. Phys. Rev. Lett. 2008, 101, 026803. [Google Scholar] [CrossRef]
- Kaur, M.; Kaur, M.; Sharma, V.K. Nitrogen-Doped Graphene and Graphene Quantum Dots: A Review Onsynthesis and Applications in Energy, Sensors and Environment. Adv. Colloid Interface Sci. 2018, 259, 44–64. [Google Scholar] [CrossRef]
- Peña-Bahamonde, J.; Nguyen, H.N.; Fanourakis, S.K.; Rodrigues, D.F. Recent Advances in Graphene-Based Biosensor Technology with Applications in Life Sciences. J. Nanobiotechnol. 2018, 16, 1–17. [Google Scholar] [CrossRef] [Green Version]
- Prathish, K.P.; Barsan, M.M.; Geng, D.; Sun, X.; Brett, C.M. Chemically Modified Graphene and Nitrogen-Doped Graphene: Electrochemical Characterisation and Sensing Applications. Electrochim. Acta 2013, 114, 533–542. [Google Scholar] [CrossRef]
- Wang, Y.; Sauriat-Dorizon, H.; Korri-Youssoufi, H. Direct Electrochemical DNA Biosensor Based on Reduced Graphene Oxide and Metalloporphyrin Nanocomposite. Sens. Actuators B Chem. 2017, 251, 40–48. [Google Scholar] [CrossRef]
- Benvidi, A.; Tezerjani, M.D.; Jahanbani, S.; Ardakani, M.M.; Moshtaghioun, S.M. Comparison of Impedimetric Detection of DNA Hybridization on the Various Biosensors Based on Modified Glassy Carbon Electrodes with Panhs and Nanomaterials of RGO and MWCNTs. Talanta 2016, 147, 621–627. [Google Scholar] [CrossRef] [PubMed]
- Yola, M.L.; Eren, T.; Atar, N. A Novel and Sensitive Electrochemical DNA Biosensor Based on Fe@ Au Nanoparticles Decorated Graphene Oxide. Electrochim. Acta 2014, 125, 38–47. [Google Scholar] [CrossRef]
- Zhang, L.-S.; Liang, X.-Q.; Song, W.-G.; Wu, Z.-Y. Identification of the Nitrogen Species on N-Doped Graphene Layers and Pt/Ng Composite Catalyst for Direct Methanol Fuel Cell. Phys. Chem. Chem. Phys. 2010, 12, 12055–12059. [Google Scholar] [CrossRef] [PubMed]
- Jain, R.; Jadon, N.; Pawaiya, A. Polypyrrole Based Next Generation Electrochemical Sensors and Biosensors: A Review. TrAC Trends Anal. Chem. 2017, 97, 363–373. [Google Scholar] [CrossRef]
- Lv, H.; Xu, D.; Henzie, J.; Feng, J.; Lopes, A.; Yamauchi, Y.; Liu, B. Mesoporous Gold Nanospheres Via Thiolate-Au (I) Intermediates. Chem. Sci. 2019, 10, 6423–6430. [Google Scholar] [CrossRef] [Green Version]
- Hossain, M.Z.; Shimizu, N. Covalent Immobilization of Gold Nanoparticles on Graphene. J. Phys. Chem. C 2019, 123, 3512–3516. [Google Scholar] [CrossRef]
- Benvidi, A.; Firouzabadi, A.D.; Tezerjani, M.D.; Moshtaghiun, S.; Mazloum-Ardakani, M.; Ansarin, A. A Highly Sensitive and Selective Electrochemical DNA Biosensor to Diagnose Breast Cancer. J. Electroanal. Chem. 2015, 750, 57–64. [Google Scholar] [CrossRef]
- Martinez, N.; Risco, C.; Lima, F.; Bisinotto, R.; Greco, L.; Ribeiro, E.; Maunsell, F.; Galvão, K.; Santos, J. Evaluation of Peripartal Calcium Status, Energetic Profile, and Neutrophil Function in Dairy Cows at Low or High Risk of Developing Uterine Disease. J. Dairy Sci. 2012, 95, 7158–7172. [Google Scholar] [CrossRef] [Green Version]
- Neves, R.; Leno, B.; Bach, K.; McArt, J. Epidemiology of Subclinical Hypocalcemia in Early-Lactation Holstein Dairy Cows: The Temporal Associations of Plasma Calcium Concentration in the First 4 Days in Milk with Disease and Milk Production. J. Dairy Sci. 2018, 101, 9321–9331. [Google Scholar] [CrossRef] [Green Version]
- Hendriks, S.; Huzzey, J.; Kuhn-Sherlock, B.; Turner, S.-A.; Mueller, K.; Phyn, C.; Donaghy, D.; Roche, J. Associations between Lying Behavior and Activity and Hypocalcemia in Grazing Dairy Cows During the Transition Period. J. Dairy Sci. 2020, 103, 10530–10546. [Google Scholar] [CrossRef] [PubMed]
- Verhoef, W.; Zuidhof, S.; Ralston, B.; Ross, J.A.; Olson, M. Dissolution Rates of Calcium Boluses and Their Effects on Serum Calcium in Dairy Cattle. Vet. Med. Res. Rep. 2021, 12, 23. [Google Scholar]
- Pan, D.; Gu, Y.; Lan, H.; Sun, Y.; Gao, H. Functional Graphene-Gold Nano-Composite Fabricated Electrochemical Biosensor for Direct and Rapid Detection of Bisphenol A. Anal. Chim. Acta 2015, 853, 297–302. [Google Scholar] [CrossRef] [PubMed]
- Wang, P.; Li, X.; Dai, Z.; Zou, X.; Han, X. An Efficient Electrochemical Method for Direct Screening of the Mutation Status of DNA Base in Oligonucleotides. Sens. Actuators B Chem. 2014, 201, 222–227. [Google Scholar] [CrossRef]
- Singh, S.; Gill, A.A.; Nlooto, M.; Karpoormath, R. Prostate Cancer Biomarkers Detection Using Nanoparticles Based Electrochemical Biosensors. Biosens. Bioelectron. 2019, 137, 213–221. [Google Scholar] [CrossRef]
- Menon, S.; Mathew, M.R.; Sam, S.; Keerthi, K.; Kumar, K.G. Recent Advances and Challenges in Electrochemical Biosensors for Emerging and Re-Emerging Infectious Diseases. J. Electroanal. Chem. 2020, 878, 114596. [Google Scholar] [CrossRef]
- Powley, C.R.; Geiger, R.F.; Nieman, T.A. Bipolar Pulse Conductance Measurements with a Calcium Ion-Selective Electrode. Anal. Chem. 1980, 52, 705–709. [Google Scholar] [CrossRef]
- Eriksen, R.S.; Mackey, D.J.; van Dam, R.; Nowak, B. Copper Speciation and Toxicity in Macquarie Harbour, Tasmania: An Investigation Using a Copper Ion Selective Electrode. Mar. Chem. 2001, 74, 99–113. [Google Scholar] [CrossRef]
- De Marco, R.; Shackleton, J. Calibration of the Hg Chalcogenide Glass Membrane Ion-Selective Electrode in Seawater Media. Talanta 1999, 49, 385–391. [Google Scholar] [CrossRef]
- Ceresa, A.; Bakker, E.; Hattendorf, B.; Günther, D.; Pretsch, E. Potentiometric Polymeric Membrane Electrodes for Measurement of Environmental Samples at Trace Levels: New Requirements for Selectivities and Measuring Protocols, and Comparison with Icpms. Anal. Chem. 2001, 73, 343–351. [Google Scholar] [CrossRef]
- Hernández, R.; Riu, J.; Rius, F.X. Determination of Calcium Ion in Sap Using Carbon Nanotube-Based Ion-Selective Electrodes. Analyst 2010, 135, 1979–1985. [Google Scholar] [CrossRef] [PubMed]
- Komaba, S.; Akatsuka, T.; Ohura, K.; Suzuki, C.; Yabuuchi, N.; Kanazawa, S.; Tsuchiya, K.; Hasegawa, T. All-Solid-State Ion-Selective Electrodes with Redox-Active Lithium, Sodium, and Potassium Insertion Materials as the Inner Solid-Contact Layer. Analyst 2017, 142, 3857–3866. [Google Scholar] [CrossRef] [PubMed]
- Lindfors, T.; Ivaska, A. Stability of the Inner Polyaniline Solid Contact Layer in All-Solid-State K+-Selective Electrodes Based on Plasticized Poly (Vinyl Chloride). Anal. Chem. 2004, 76, 4387–4394. [Google Scholar] [CrossRef] [PubMed]
- Vázquez, M.; Danielsson, P.; Bobacka, J.; Lewenstam, A.; Ivaska, A. Solution-Cast Films of Poly (3, 4-Ethylenedioxythiophene) as Ion-to-Electron Transducers in All-Solid-State Ion-Selective Electrodes. Sens. Actuators B Chem. 2004, 97, 182–189. [Google Scholar] [CrossRef]
- Long, D.; Li, W.; Ling, L.; Miyawaki, J.; Mochida, I.; Yoon, S.-H. Preparation of Nitrogen-Doped Graphene Sheets by a Combined Chemical and Hydrothermal Reduction of Graphene Oxide. Langmuir 2010, 26, 16096–16102. [Google Scholar] [CrossRef]
- Thanh, T.D.; Balamurugan, J.; Lee, S.H.; Kim, N.H.; Lee, J.H. Effective Seed-Assisted Synthesis of Gold Nanoparticles Anchored Nitrogen-Doped Graphene for Electrochemical Detection of Glucose and Dopamine. Biosens. Bioelectron. 2016, 81, 259–267. [Google Scholar] [CrossRef]
- Zhang, C.; Lai, C.; Zeng, G.; Huang, D.; Tang, L.; Yang, C.; Zhou, Y.; Qin, L.; Cheng, M. Nanoporous Au-Based Chronocoulometric Aptasensor for Amplified Detection of Pb2+ Using DNAzyme Modified with Au Nanoparticles. Biosens. Bioelectron. 2016, 81, 61–67. [Google Scholar] [CrossRef]
- Maldonado, S.; Stevenson, K.J. Influence of Nitrogen Doping on Oxygen Reduction Electrocatalysis at Carbon Nanofiber Electrodes. J. Phys. Chem. B 2005, 109, 4707–4716. [Google Scholar] [CrossRef]
- Sheng, Z.H.; Zheng, X.Q.; Xu, J.Y.; Bao, W.J.; Wang, F.B.; Xia, X.H. Electrochemical Sensor Based on Nitrogen Doped Graphene: Simultaneous Determination of Ascorbic Acid, Dopamine and Uric Acid. Biosens Bioelectron 2012, 34, 125–131. [Google Scholar] [CrossRef]
- Chen, M.; Hou, C.; Huo, D.; Bao, J.; Fa, H.; Shen, C. An Electrochemical DNA Biosensor Based on Nitrogen-Doped Graphene/Au Nanoparticles for Human Multidrug Resistance Gene Detection. Biosens. Bioelectron. 2016, 85, 684–691. [Google Scholar] [CrossRef]
- Radi, A.E.; Acero Sánchez, J.L.; Baldrich, E.; O’Sullivan, C.K. Reagentless, Reusable, Ultrasensitive Electrochemical Molecular Beacon Aptasensor. J. Am. Chem. Soc. 2006, 128, 117–124. [Google Scholar] [CrossRef] [PubMed]
- Benvidi, A.; Firouzabadi, A.D.; Moshtaghiun, S.M.; Mazloum-Ardakani, M.; Tezerjani, M.D. Ultrasensitive DNA Sensor Based on Gold Nanoparticles/Reduced Graphene Oxide/Glassy Carbon Electrode. Anal. Biochem. 2015, 484, 24–30. [Google Scholar] [CrossRef] [PubMed]
- Zhao, Z.; Sun, Y.; Li, P.; Zhang, W.; Lian, K.; Hu, J.; Chen, Y. Preparation and Characterization of AuNPs/CNTs-ERGO Electrochemical Sensors for Highly Sensitive Detection of Hydrazine. Talanta 2016, 158, 283–291. [Google Scholar] [CrossRef] [PubMed] [Green Version]
- Li, L.; Ma, X.; Dong, W.; Miao, P.; Tang, Y. Electrochemical Determination of Ca2+ Based on Recycling Formation of Highly Selective DNAzyme and Gold Nanoparticle-Mediated Amplification. Bioconjug. Chem. 2018, 29, 1021–1024. [Google Scholar] [CrossRef] [PubMed]
- Wang, H.; Zhang, F.; Wang, Y.; Shi, F.; Luo, Q.; Zheng, S.; Chen, J.; Dai, D.; Yang, L.; Tang, X.; et al. DNAzyme-Amplified Electrochemical Biosensor Coupled with Ph Meter for Ca2+ Determination at Variable Ph Environments. Nanomaterials 2022, 12, 4. [Google Scholar] [CrossRef]
- Wang, H.; Luo, Q.; Zhao, Y.; Nan, X.; Zhang, F.; Wang, Y.; Wang, Y.; Hua, D.; Zheng, S.; Jiang, L.; et al. Electrochemical Device Based on Nonspecific DNAzyme for the High-Accuracy Determination of Ca2+ with Pb2+ Interference. Bioelectrochemistry 2021, 140, 107732. [Google Scholar] [CrossRef]
- Yue, J.; Li, L.; Cao, L.; Zan, M.; Yang, D.; Wang, Z.; Chang, Z.; Mei, Q.; Miao, P.; Dong, W.-F. Two-Step Hydrothermal Preparation of Carbon Dots for Calcium Ion Detection. ACS Appl. Mater. Interfaces 2019, 11, 44566–44572. [Google Scholar] [CrossRef]
- Du, X.; Zhai, J.; Zeng, D.; Chen, F.; Xie, X. Distance-Based Detection of Calcium Ions with Hydrogels Entrapping Exhaustive Ion-Selective Nanoparticles. Sens. Actuators B Chem. 2020, 319, 128300. [Google Scholar] [CrossRef]
- Johns, V.K.; Patel, P.K.; Hassett, S.; Calvo-Marzal, P.; Qin, Y.; Chumbimuni-Torres, K.Y. Visible Light Activated Ion Sensing Using a Photoacid Polymer for Calcium Detection. Anal. Chem. 2014, 86, 6184–6187. [Google Scholar] [CrossRef]


| DNA | Sequences and Modifications (Start with 5 Terminal ′) |
|---|---|
| Sub | HS-SH-(CH2)6-GCTGTAGAAGG/rA/TATCACTGTGCACTAAGCGGTA GAACTCACTATGTAGTGAGTTCTACCGCT |
| SSub | HS-SH-(CH2)6-GCTGTAGAAGG/rA/TATCACTGTGCACTAA |
| NSub | HS-SH-(CH2)6-GCTGTAGAAGGATATCACTGTGCACTAAGCGGTA GAACTCACTATGTAGTGAGTTCTACCGCT |
| SDNAzyme | TAGTGCACAGTGATTGTTGGAATCGCTCATGCGACACTC TTTTCTACAGC |
| DNAzyme | TCGCCATCTTGAGTGTTACAGCACTCAAGATGGCGATAGTGCACAGTGATTGTTGGAATCGCTCATGCGACACTCTTTTCTACAGC |
| Sensor | Method | Linear Range(M) | Hybridization Time (min) | Detection Limit (M) | Ref. |
|---|---|---|---|---|---|
| DNAzyme/AuNPs | SWV | 10−7~10−3 | 90 | 10−7 | [55] |
| GCE/SWNT/DNAzyme | EIS | 5 × 10⁻⁶~2.5 × 10⁻² | 7 | 4.2 × 10⁻⁶ | [56] |
| DNAzyme/SWNT/FET | EIS | 7.5 × 10⁻⁶~10−3 | 9 | 5.48 × 10⁻⁶ | [57] |
| CD-EGTA * | Fluorescence | 1.5 × 10⁻⁵~3 × 10⁻⁴ | - | 3.8 × 10⁻⁷ | [58] |
| EICON * | UV-vis | 1 × 10⁻⁴~5 × 10⁻⁴ 1 × 10⁻³~5 × 10⁻³ | 30 | 6 × 10⁻⁵ | [59] |
| CSS-PAH | UV-vis | 5 × 10⁻⁴~1 | 35 | 5 × 10⁻⁴ | [60] |
| GCE/NGR/AuNPs/Sub-DNAzyme duplex | EIS | 5 × 10⁻⁶~5 × 10⁻⁵ 5 × 10⁻⁵~4 × 10⁻⁴ | 15 | 3.8 × 10⁻⁶ | This work |
| Sample | Electrochemical Device (μM) | AAS (μM) | Recovery (%) |
|---|---|---|---|
| 1 | 933 ± 42 | 983 ± 12 | 94.90 ± 4.2 |
| 2 | 1070 ± 51 | 1021 ± 15 | 104.90 ± 4.8 |
| 3 | 1164 ± 62 | 1214 ± 20 | 95.87 ± 4.9 |
| 4 | 862 ± 56 | 921 ± 16 | 93.48 ± 5.6 |
Publisher’s Note: MDPI stays neutral with regard to jurisdictional claims in published maps and institutional affiliations. |
© 2022 by the authors. Licensee MDPI, Basel, Switzerland. This article is an open access article distributed under the terms and conditions of the Creative Commons Attribution (CC BY) license (https://creativecommons.org/licenses/by/4.0/).
Share and Cite
Yu, Z.; Wang, H.; Zhao, Y.; Zhang, F.; Tang, X.; Xiong, B. Electrochemical Biosensor Using Nitrogen-Doped Graphene/Au Nanoparticles/DNAzyme for Ca2+ Determination. Biosensors 2022, 12, 331. https://doi.org/10.3390/bios12050331
Yu Z, Wang H, Zhao Y, Zhang F, Tang X, Xiong B. Electrochemical Biosensor Using Nitrogen-Doped Graphene/Au Nanoparticles/DNAzyme for Ca2+ Determination. Biosensors. 2022; 12(5):331. https://doi.org/10.3390/bios12050331
Chicago/Turabian StyleYu, Zhixue, Hui Wang, Yiguang Zhao, Fan Zhang, Xiangfang Tang, and Benhai Xiong. 2022. "Electrochemical Biosensor Using Nitrogen-Doped Graphene/Au Nanoparticles/DNAzyme for Ca2+ Determination" Biosensors 12, no. 5: 331. https://doi.org/10.3390/bios12050331
APA StyleYu, Z., Wang, H., Zhao, Y., Zhang, F., Tang, X., & Xiong, B. (2022). Electrochemical Biosensor Using Nitrogen-Doped Graphene/Au Nanoparticles/DNAzyme for Ca2+ Determination. Biosensors, 12(5), 331. https://doi.org/10.3390/bios12050331