Abstract
An electrochemical biosensor for detecting Ca2+ concentration was proposed using glass carbon electrodes (GCEs) modified with nitrogen-doped graphene (NGR), gold nanoparticles (AuNPs) and DNAzyme. The resistance signal was amplified through two methods: electrochemical reduction of AuNPs on the NGR surface to increase the specific surface area of the electrode and strengthen the adsorption of DNAzyme; and increasement of the DNAzyme base sequence. The process of electrode modification was characterized by scanning electron microscopy, Raman spectroscopy, cyclic voltammetry (CV), and electrochemical impedance spectroscopy (EIS). Experimental parameters’ influence, such as the deposition time of gold nanoparticles and the detection time, were assessed by electrochemical methods. The linear ranges of the electrochemical biosensor were in the range from 5 × 10⁻⁶ to 5 × 10⁻⁵ and 5 × 10⁻⁵ to 4 × 10⁻⁴ M, with a detection limit of 3.8 × 10⁻⁶ M. The concentration of Ca2+ in the serum of dairy cows was determined by the biosensor with satisfactory results, which could be potentially used to diagnose subclinical hypocalcemia.
1. Introduction
DNAzyme is a single-stranded DNA sequence with the advantages of simple synthesis, high stability and fast reaction speed. At present, DNAzyme has broad application prospects in the highly selective recognition of elements by metal ions [1]. DNAzymes are selectively isolated in vitro using Ca2+ [2], Pb2+ [3], Cu2+ [4], Zn2+ [5], Mg2+ [6], UO22+ [7], and Hg2+ [8] as cofactors and have high specificity for metal ions [9]. DNAzyme consists of the catalytic part and binding arm [10]. There is an adenosine ribonucleotide (rA) cleavage site in the substrate chain [11]. The reason why DNAzyme is selected to measure calcium ions is that when the binding arm and the substrate chain are hybridized into a double chain structure through base complementary pairing, calcium ions, as a cofactor, will specifically combine with the catalytic center to initiate the catalytic activity of the enzyme, prompting the enzyme to recognize and crack the phosphate diester bond in the substrate chain [2]. Heaton et al. [12] quantified Ca2+ by measuring structural changes in the binding of Ca2+ and DNAzymes. Zhou et al. [13] reported a DNAzyme named EtNa, which could be specifically activated by Ca2+ with a detection limit of 17 μM Ca2+, showing good selectivity. They also selected DNAzyme in serum and obtained 17EV1, which was more active with Ca2+ [14].
Graphene, a two-dimensional material, has broad application prospects in the fields of bioelectronics and biosensing. Graphene is widely used in electronic devices and biosensors because of its unique physical and chemical properties, such as high specific surface area, excellent electrical conductivity, easy production, and functionalization [15,16]. In order to improve the characteristics of graphene in bioelectrochemical applications, chemical doping is the primary potential strategy carried out to increase the density of free carriers and improve conductivity [17]. Studies demonstrate that nitrogen is a good element for the chemical doping of carbon materials because it has a comparable atomic size and contains five valence electrons, forming strong valence bonds with carbon atoms [18]. Compared with original graphene, nitrogen-doped graphene has larger specific surface area, higher volume ratio of surface-active groups, and stronger electrocatalysis. It has been widely used in electrochemical catalysis and biosensors [19,20,21,22].
To improve the performance of biosensors, it is necessary to improve the efficiency of DNA hybridization and increase the fixed amount of biomaterials. Nanomaterials play an important role in the adsorption and fixation of biomolecules [23,24]. Among metal nanoparticles, gold nanoparticles (AuNPs) are considered to be candidate materials for electrochemical sensors because of their excellent electrocatalytic activity. The presence of nitrogen can promote the high dispersion of AuNPs and induce excellent conductivity [25]. The combination of AuNPs and NGR increases the specific surface area of the electrode and improves the catalytic performance of the electrons. High specific surface area allows for more fixation of probe DNA [26]. In addition, organic thiolated compounds and thiolated oligonucleotides can react on the gold surface to form S-Au covalent bonds, which improves the sensitivity and selectivity of biosensors [27,28,29].
Hypocalcemia is a common nutritional and metabolic disease in dairy cows before and after parturition in intensive dairy farms in China. After calving, a large amount of blood calcium is used to synthesize milk, which can cause hypocalcemia in dairy cows. Clinical hypocalcemia is often accompanied by muscle weakness, anorexia, quadriplegia and other apparent symptoms, and even coma or death. Subclinical hypocalcemia without symptoms can induce postpartum paralysis, ketosis, fetal failure, gastric displacement, uterine prolapse, and other diseases, and can reduce the milk yield and service life and increase the mortality of dairy cows [30,31,32]. According to statistics, the average incidence of clinical hypocalcemia in dairy cows is 7.5%, and the incidence of subclinical hypocalcemia is about 30% [33]. Due to a lack of practical, rapid, and inexpensive on-site detection techniques, subclinical hypocalcemia is easily ignored by breeding farms. Therefore, the fast and economical detection of Ca2+ concentration in the serum of dairy cows would be highly useful in diagnosing subclinical hypocalcemia.
The traditional Ca2+ analysis method based on spectral analysis has high sensitivity and precision. However, this method can only be carried out in specific laboratories operated by trained technicians, and the sample pretreatment is time-consuming and expensive, so it is not suitable for rapid on-site monitoring [34]. Therefore, these highly instrument-dependent detection methods cannot fully meet the needs of rapid real-time monitoring. Compared with instrumental detection methods, electrochemical biosensors are characterized by simplicity, rapidity, low cost, and high sensitivity [35,36,37]. Although the ion-selective electrode (ISE) has good selectivity and a short detection time, the measurement of actual samples is mainly limited by the unstable signal generated by the complex matrix. When using the ISE to measure Ca2+ concentration [38], Cu2+ in natural water [39], Hg2+ in seawater [40], and Pb2+ in drinking water [41], as with all classic ISEs with internal solutions, this electrode is limited to vertical measurements, difficult to miniaturize, and leaks ions from internal solutions [42]. In addition, the mechanical strength and durability of the ion-sensitive membrane are insufficient, and if the ion-sensitive membrane is broken, the internal solution can also leak into the analyte [43]. Although these disadvantages can be overcome by using solid-state electrodes, solid-state electrodes are often affected by pH and the formation of an aqueous layer, resulting in signal drift and distortion, which can reduce the measurement accuracy [44,45]. When commercial ISEs are used to measure real samples, the electrical signals fluctuate greatly and are unstable, which indicates that it is difficult to use classical commercial ISEs to measure real complex samples. An AuNPs/NGR nanohybrid based on DNAzyme is a new electrocatalyst for serum Ca2+ detection with high sensitivity, high selectivity, and good reproducibility. In this work, we developed an electrochemical biosensor fabricated using glass carbon electrodes modified with nitrogen-doped graphene, gold nanoparticles, and DNAzyme, which was then applied to diagnose subclinical hypocalcemia in dairy cows.
2. Materials and Methods
2.1. Materials and Reagents
Nitrogen-doped graphene (NGR) was bought from Shanghai Aladdin Biochemical Technology Co., Ltd. (Shanghai, China). 6-Mercapto-1-hexanol (MCH), N, N-Dimethylformamide (DMF), Sodium acetate, NaCl, KCl, MgCl2, CaCl2, CuCl2, FeCl2, FeCl3, and ZnCl2 were provided by Sigma Aldrich (Beijing, China). HAuCl4, Na2SO4, Tris (2-carboxyethyl) phosphine (TCEP), and ethanol were purchased from Macklin Inc. (Shanghai, China). Tris (hydroxymethyl) ammonia methane (Tris) was provided by Titan Scientific Co., Ltd. (Shanghai, China). Both hydrochloric acid (HCl) and acetic acid (CH3COOH) came from Beijing Chemical Co., Ltd. (Beijing, China). The Ca2+ standard solution was provided by the National Research Center for Reference Materials of China (Beijing, China) and diluted to the required Ca2+ concentration. All chemical reagents in this study were analytically pure without further purification. Millipore Milli-Q Systems produced ultra-pure water. Tris-HCl buffer was used. Oligonucleotide sequences were synthesized by Sangon Biotechnology Co., Ltd. (Shanghai, China). Table 1 shows the oligonucleotide sequences.

Table 1.
The modified DNA sequences.
The substrate chain (Sub) required sulfhydryl reduction: 4 mg TCEP was dissolved in 100 µL Tris-HCl solution and then mixed thoroughly with 100 µL Sub solution. The mixture was left for 1 h until 200 µL acetic acid solution of 6% and 50 µL 3 M sodium acetate were added. It was then centrifuged at 5000 rpm at room temperature for 5 min to remove the supernatant, and the remains were dispersed in sterile water to a concentration of 50 µM. Sub combined with DNAzyme to form the Sub-DNAzyme duplex.
2.2. Apparatus and Measurements
SEM images were obtained by field emission scanning electron microscope (FE-SEM SU8040) at 10 kV acceleration voltage. Raman spectra were measured using Renishaw inVia using an imaging microscope. Electrical signals were recorded using a CHI 760E Electrochemical Station (Shanghai Chenhua Instrument, Shanghai, China) with three electrodes. In this recording, the modified electrode (GCE/NGR/AuNPs/Sub-DNAzyme duplex), platinum electrode, and Ag/AgCl electrode were used as the working electrode, reference electrode, and counter electrode, respectively. The centrifuge (SN-LSC-40) was provided by Shanghai Shangyi Instrument Equipment Co., Ltd. (Shanghai, China).
2.3. Fabrication
Figure 1 describes the modification process of the GCE/NGR/AuNPs/Sub-DNAzyme duplex. Briefly, the bare GCE was polished with 0.3 µm and 0.05 µm Al2O3 powder, followed by multiple ultrasonic treatments in deionized water. The surface of the GCE covered with 6 μL 0.01 M NGR solution was dried at 60 °C for 30 min, and was then rinsed with sufficient water to remove the residual NGR. AuNPs were electrodeposited by cyclic voltammetry. The GCE/NGR/AuNPs was formed by placing GCE/NGR in 5 mL 0.3 mM HAuCl4 and 0.01 M Na2SO4 solution. Then, 10 cycles were scanned at a rate of 100 mV/s in the potential range of −0.2 to 1.2 V. The GCE/NGR/AuNPs was covered with 5 μL 50 μM Sub solution at high humidity overnight at 4 °C. During this time, Sub could be covalently connected to the AuNPs’ surface by forming S-Au bonds. Drops of 0.1 mM MCH were applied to the surface of the modified electrode to prevent adsorption of unbound Sub on the Au surface. Finally, Sub on Au surface hybridized with DNAzyme to form the GCE/NGR/AuNPs/Sub-DNAzyme duplex for 4 h. DNAzyme could bind to Ca2+ and then cleave complementary substrates (Sub) at the rA site. Because the conductivity of the Sub-DNAzyme duplex was relatively poor, the structure could affect the resistance of the GCE/NGR/AuNPs, thus facilitating highly selective Ca2+ detection.
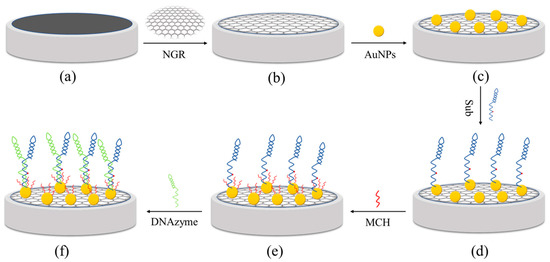
Figure 1.
The process of GCE (a) functionalized with NGR (b), AuNPs (c), Sub (d), MCH (e), and DNAzyme (f).
2.4. Method of Measurement
To measure Ca2+ concentration, Rct values need to be calculated by electrochemical biosensor before and after measuring the real samples. The Ca2+ was covered on the biosensor for 15 min and then rinsed with an adequate quantity of water to remove the excess. The sensor was then immersed in 5 mM [Fe(CN)6]4−/3− and 0.1 M KCl for EIS.
The calculation formula of relative resistance is as follows:
Rct0 is to measure the initial resistance value, Rct is to measure the resistance value of the actual sample.
2.5. Measurement of Real Samples
Blood samples from dairy cows were collected at the China-Israel demonstration dairy farm in southeast Beijing. A 10 mL centrifuge tube containing heparin lithium was used to collect blood samples from the tail vein of dairy cows. The blood samples were centrifuged at 5000 rpm at room temperature for 5 min, and the supernatant was then separated, which was diluted four times using 0.1 M Tris-HCl buffer solution with pH 7.4.
3. Results
3.1. Characterization
SEM was used to characterize the structure and micromorphology of the GCE before and after being modified with NGR, AuNPs, Sub, and DNAzyme, shown in Figure 2. As shown in Figure 2a, bare GCEs polished using 0.3 µm and 0.05 µm Al2O3 powder had a smooth surface. The SEM image of GCE/NGR in Figure 2b was covered with multilayer film and accompanied by a folded structure, suggesting that NGR had been deposited on the GCE. The NGR was deposited on the electrode surface, which effectively increased the specific surface area of the sensing interface and provided more active sites for AuNPs deposition [46]. In Figure 2c, there were dense nanoparticles present on the surface of NGR after electroplating chloroauric acid solution, which can improve the specific surface area [47]. When the GCE/NGR/AuNPs was functionalized with Sub and DNAzyme, the structure was as shown in Figure 2d,e. Because Sub and DNAzyme were non-conductive materials with size, when they were modified on the surface of gold nanoparticles, the size increased. Due to poor conductivity, SEM imaging was affected under the same conditions, so the image looked blurred, which was consistent with previous reports [48].
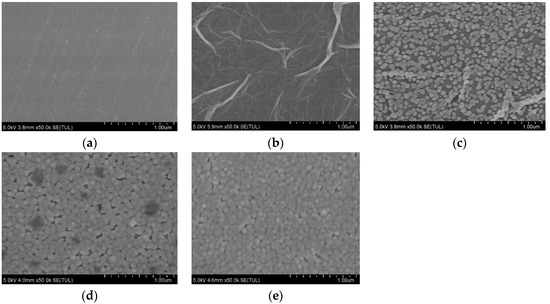
Figure 2.
SEM images of bare GCE (a), GCE/NGR (b), GCE/NGR/AuNPs (c), GCE/NGR/AuNPs/Sub (d), and GCE/NGR/AuNPs/Sub-DNAzyme duplex (e).
As shown in Figure 3, Raman spectroscopy was used to study the changes of various GCE-modified materials under 532 nm laser excitation. The Raman spectra of GO contained three peaks located at 1352 cm−1, 1592 cm−1, and 2690 cm−1, corresponding to the D, G, and 2D bands, respectively. After the NGR was immobilized on the GCE, the high-intensity D band at 1352 cm−1 indicated many defects in the NGR layer. These defects could be attributed to damage of sp2 C and nitrogen doping [49]. A sharp G-band at 1592 cm−1 indicated that the nitrogen-doped graphene maintained its two-dimensional structure. At 2690 cm−1, a wideband corresponding to the design of nitro fossilized graphene was observed, which was consistent with the report of Sheng et al. [50], further confirming the existence of graphene structure in the final product. When AuNPs, Sub, and DNAzyme were used to treat GCE/NGR, the intensity ratio of ID/IG decreased (1.69, 1.58, 1.38), respectively. It is possible that the modified molecules interacted with each other, and that the molecules’ influence on light weakened the electric field and reduced the signal.
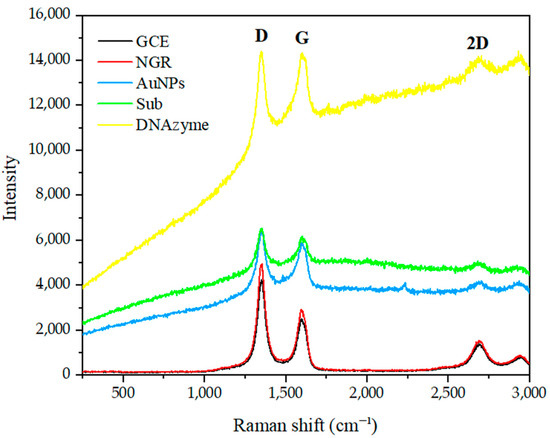
Figure 3.
Raman spectrum of GCE modified with NGR, AuNPs, Sub and DNAzyme.
3.2. CV and EIS Characterization
Figure 4 shows the cyclic voltammetry curves of GCE functionalized successively by NGR, AuNPs, Sub, MCH, and DNAzyme in 5 mmol/L [Fe(CN)6]4−/3− and 0.1 mol/L KCl mixed solution. When NGR was fixed on the GCE surface, the peak current increased from 52 μA to 73 μA. The peak current of AuNPs-modified GCE/NGR increased to 83 μA. These phenomena indicated that conductive nanomaterials could improve the specific surface area and the electron transfer rate between the electrode and the solution. When Sub with negative charge was assembled on the AuNPs surface, the peak current decreased because the negative direction of current and the negative charge of Sub sequence induced electrostatic repulsion on the electrode surface in [Fe(CN)6]4−/3−, thus preventing the electron transfer rate [51]. When MCH blocked AuNPs and NGR non-specific sites, the peak current decreased. Finally, the peak current was significantly reduced when the electrode was placed in 50 mM DNAzyme. This was due to the large negative charge generated by DNAzyme, which repelled the transfer rate of [Fe(CN)6]4−/3− between electrode and electrolyte [52]. In addition, immobilization of Sub and DNAzyme resulted in increased electrode surface density and prevented electron transfer between the electrode surface and electrically-active species.
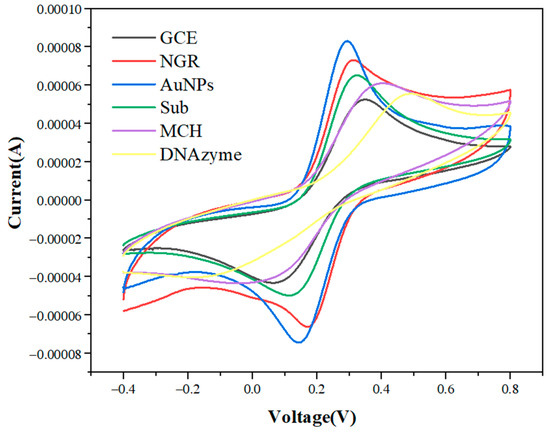
Figure 4.
Cyclic voltammetry curves of GCE modified with NGR, AuNPs, Sub, MCH, and DNAzyme in 5.0 mmol/L [Fe(CN)6]4−/3− and 0.1 mol/L KCl at 50 mV/s scanning rate.
Electrochemical impedance spectroscopy (EIS) was used to monitor the resistance characteristics of GCE-modified NGR, AuNPs, Sub, MCH, and DNAzyme in 5 mM [Fe(CN)6]4−/3− and 0.1 M KCl at room temperature. The typical Nyquist resistance spectrum includes a semicircle at high frequencies corresponding to electron transfer confinement processes. The linear part at low frequencies corresponds to diffusion-constrained processes. As shown in Figure 5, Rct of resistance spectrum on bare GCE was about 230 ± 11 Ω. When NGR was deposited on the surface of the GCE, the semicircles in the resistance spectrum decreased due to the good electrical conductivity of deposited NGR. After AuNPs were assembled on the GCE/NGR surface, the semicircles in the resistance spectrum decreased significantly, indicating that the charge transfer process was fast. When Sub functionalized on the Au surface via the S-Au bond, the resistance value increased, and the Rct reached 238 ± 9 Ω. The negatively charged probe sequence fixed on the electrode surface generated repulsion with the negatively charged redox probe [Fe(CN)6]4−/3− [47]. The subsequent surface blocking of MCH also significantly increased Rct to 244 ± 13 Ω, indicating that MCH occupied the remaining bare position of unspecific adsorption [53]. After DNAzyme hybridization, the Rct value was 250 ± 13 Ω. The resistance of the GCE/NGR/AuNPs/Sub-DNAzyme duplex increased slightly, but the relative resistance decreased noticeably when exposed to different Ca2+ concentrations in Section 3.5, indicating DNAzyme was hybridized with Sub successfully. EIS results were consistent with CV, so it could be concluded that the biosensor was successfully prepared.
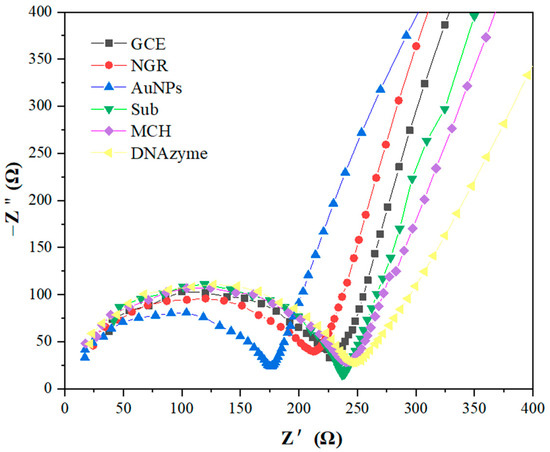
Figure 5.
In 5 mmol/L [Fe(CN)6]4−/3− and 0.1 mol/L KCl solution, GCE modified with NGR, AuNPs, Sub, MCH, and DNAzyme obtained EIS in the frequency range from 0.1 to 105 Hz (potential = 0.2 V).
3.3. Optimization
To improve the sensitivity of the electrochemical sensors, some detection parameters were optimized at different Ca2+ concentrations.
Incubation time had a significant influence on the sensitivity of the electrochemical biosensor. Figure 6 shows the change of relative resistance of the GCE/NGR/AuNPs/Sub-DNAzyme duplex at different Ca2+ concentrations with incubation time. The relative resistance of DNAzyme increased significantly with the incubation time ranging from 0 min to 15 min, which was due to the effect of Ca2+ on the continuous cleavage of DNAzyme. However, when the incubation time exceeded 15 min, the response signal was relatively stable, especially at the concentration of 100 μM Ca2+, indicating that the adsorption on the surface of GCE had reached saturation. To balance the sensitivity of biosensor and incubation time, 15 min was selected as the best incubation time.
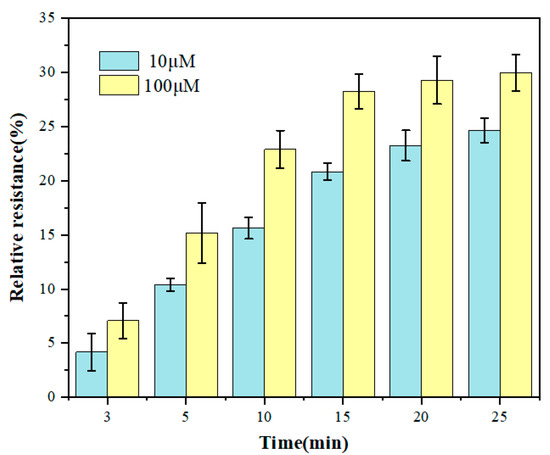
Figure 6.
The relative resistance of the GCE/NGR/AuNPs/Sub-DNAzyme duplex after incubation in different Ca2+ concentrations at different times (The error bars were determined in three duplicates).
The structure and length of Sub and DNAzyme that combine to form the Sub-DNAzyme duplex are two key factors affecting the sensitivity of the GCE/NGR/AuNPs/Sub-DNAzyme duplex. Figure 7 shows the relative resistance of different Sub-DNAzyme duplexes (NSub-DNAzyme duplex, SSub-DNAzyme duplex, and Sub-DNAzyme duplex) for 10, 50, and 100 μM Ca2+. When combined with Ca2+, DNAzyme catalyzed the cleavage of Sub on the electrode surface at rA, which reduced the substrate chain density on the electrode surface and reduced the charge transfer resistance. The relative resistance of the NSub-DNAzyme duplex without rA was almost zero, suggesting that DNAzyme bound with Ca2+ did cleave Sub at rA. The relative resistance of the SSub-DNAzyme duplex and Sub-DNAzyme duplex-modified electrodes increased with the increase of Ca2+ concentration. However, the relative resistance of the SSub-DNAzyme duplex was not as high as that of the Sub-DNAzyme duplex. This suggested that the length of DNAzyme may affect the sensitivity of the GCE/NGR/AuNPs/Sub-DNAzyme duplex. Therefore, the combination of DNAzyme and Sub were used to measure Ca2+ concentration in this experiment.
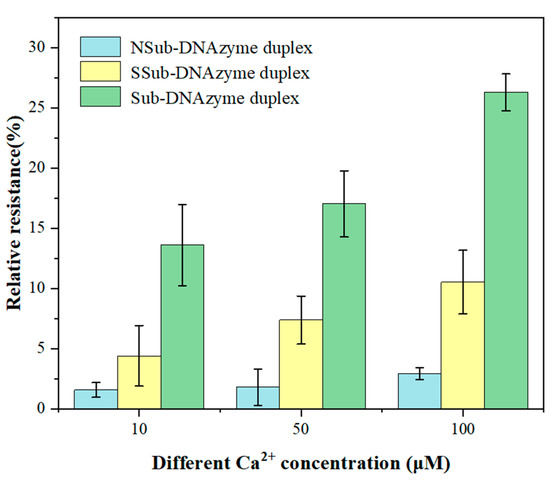
Figure 7.
The relative resistance of Sub-DNAzyme duplex structure and length to different Ca2+ concentration (The error bars were determined in three duplicates).
The number of AuNPs has a significant effect on the electrochemical performance of the sensor. In order to optimize the electrodeposition conditions of AuNPs, different amounts of AuNPs were deposited on the GCE/NGR surface by controlling the number of scanning cycles (2 r, 5 r, 10 r, 15 r, and 20 r). Figure S1 shows the deposition process of AuNPs. Figure 8 shows the change of relative resistance of the GCE/NGR/AuNPs/Sub-DNAzyme duplex at 100 μM Ca2+ concentration with different scanning cycles of AuNPs. The sensitivity of the sensor increased significantly as the scanning cycles increased from 2 r to 10 r, and then remained stable. As the number of scanning cycles increased, AuNPs became larger and more uniform, which was not conducive to electrochemical catalysis [54]. The GCE/NGR/AuNPs/Sub-DNAzyme duplex sensor showed the highest sensitivity at the scanning cycles of 10 r. Therefore, 10 r was chosen as the optimal scanning cycle.
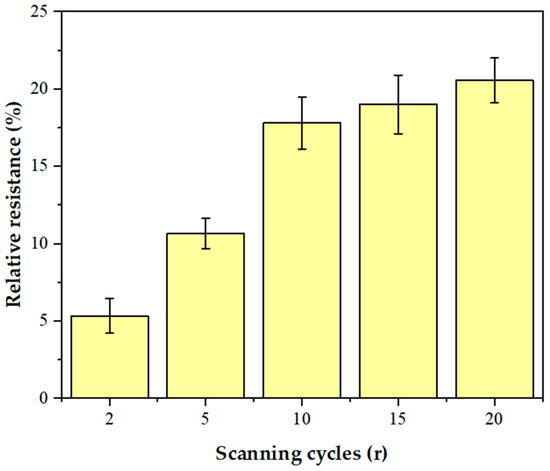
Figure 8.
The relative resistance of GCE/NGR/AuNPs/Sub-DNAzyme duplex electrodeposition of AuNPs with different scanning cycles (2 r, 5 r, 10 r, 15 r, and 20 r) in 100 μM Ca2+ solution (The error bars were determined in three duplicates).
Figure S2 shows the comparison of relative resistance measurement between AuNPs modified on NGR surface and naked GCE surface under different Ca2+ concentrations. As shown in the comparison figure, the relative resistance of the electrode modified with NGR was higher than that not modified. The reason is that the NGR increased the specific surface area of the electrode, making more AuNPs bond to the electrode surface and increasing the conductivity of the electrode. Therefore, the combination of NGR and AuNPs were selected to produce the electrode.
3.4. Interference
Anti-interference is an essential factor affecting the performance of electrochemical biosensors. There are many metal ions in the serum of dairy cows, which may interfere with the relative resistance of the GCE/NGR/AuNPs/Sub-DNAzyme duplex. Therefore, seven metal ions with high concentrations were selected, including K+, Na+, Zn2+, Fe2+, Fe3+, Mg2+, and Cu2+. The GCE/NGR/AuNPs/Sub-DNAzyme duplex was then used to detect 0.4 mM of these metal ions in the 0.1 M Tris-HCl at pH 7.4. The results in Figure 9 show that the relative resistance of the GCE/NGR/AuNPs/Sub-DNAzyme duplex to 0.4 mM Ca2+ was about 30%, but the relative resistance of other metal ions was much less than Ca2+, indicating that these metal ions had no interference effect on the GCE/NGR/AuNPs/Sub-DNAzyme duplex.
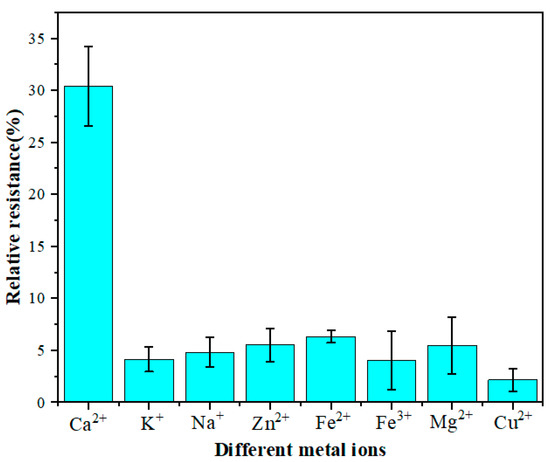
Figure 9.
The relative resistance of GCE/NGR/AuNPs/Sub-DNAzyme duplex incubated in different 0.4 mM metal ion solutions (K+, Na+, Zn2+, Fe2+, Fe3+, Mg2+, and Cu2+) (The error bars were determined in three duplicates).
3.5. Ca2+ Sensing
To evaluate the analytical performance of the GCE/NGR/AuNPs/Sub-DNAzyme duplex, the EIS was recorded by analyzing a series of Ca2+ concentrations under optimal conditions, and three measurements were repeated for each concentration. The semicircle diameter decreased with the increase of Ca2+ concentration in Figure 10a. The linear relationship between Ca2+ concentration and relative resistance ranged from 0 μM to 400 μM. The calculated relative resistance is shown in Figure 10b. When Ca2+ concentration was less than 50 μM, the relative resistance increased slowly, indicating that the cleavage efficiency of the Sub-DNAzyme duplex was low at low Ca2+ concentration. The logarithmic relationship between the relative resistance and Ca2+ concentration was linear in the range of 5 to 50 μM. The linear equation was relative resistance = −2.9637 + 9.7288 log[Ca2+](µM) and the linear regression coefficient was 0.9901. In the range of 50 to 400 μM, the relative resistance increased rapidly with the increase of Ca2+ concentration. The linear equation was relative resistance = −17.862 + 18.252 log[Ca2+](µM), and the linear regression coefficient was 0.9893.
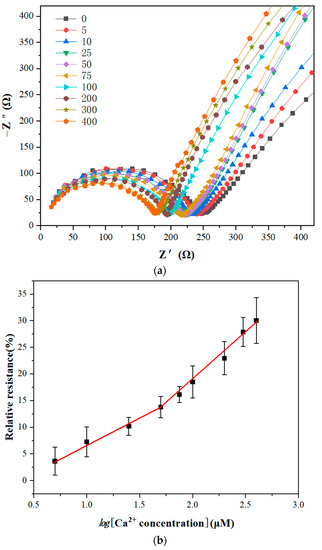
Figure 10.
(a) Electrochemical impedance spectroscopy of GCE/NGR/AuNPs/Sub-DNAzyme duplex at different Ca2+ concentrations from 0 μM to 400 μM; (b) Linear relationship between relative resistance and logarithms of Ca2+ concentration (The error bars were determined in three duplicates).
Table 2 lists the detecting parameters of Ca2+ by different biosensors. Most DNAzyme-modified sensors have a similar linear range. Although the linear range of the electrochemical device (GCE/NGR/AuNPs/Sub-DNAzyme duplex) developed in this paper was narrower than that of some sensors and the detection limit was not low enough, for cows, the serum Ca2+ concentration was about 1 to 1.25 mM and 250 to 300 μM after diluting four times. Therefore, the electrochemical device didn’t need a wide linear range and a very low detection limit to detect serum Ca2+ in dairy cows. In addition, serum Ca2+ could be detected without complex pretreatment, and the detection time was 15 min, which was shorter than UV-vis to detect Ca2+, meeting the needs of practical application.

Table 2.
Comparison of GCE/NGR/AuNPs/Sub-DNAzyme duplex performance with other reported sensors for Ca2+ determination.
3.6. Determination of Ca2+ in Real Samples
An electrochemical instrument was used to test the serum samples of dairy cows with different concentrations, following the preprocessing procedure of the blood sample described in Section 2.5. The method developed in the current study and an atomic absorption spectrometry (AAS) were used to detect the same extracted samples. The results are shown in Table 3. Although the detection accuracy of our method was slightly lower than that of the AAS, the recoveries ranged from 93.48% to 104.90%, which indicated its suitability in determining Ca2+ concentration in serum samples. A t-test was performed on the results of the two methods, and p = 0.78 > 0.05. There was no significant difference between the results obtained by the two methods, indicating that the biosensor was accurate and repeatable. It could be more practically used to determine Ca2+ concentration in the serum of dairy cows at farms.

Table 3.
Comparison of electrochemical device and AAS in determining Ca2+ concentrations in dairy cow serum samples.
4. Conclusions
This study developed a novel DNA electrochemical biosensor based on the GCE/NGR/AuNPs/Sub-DNAzyme duplex. NGR/AuNPs-modified GCE not only increased the specific surface area of the electrode, but also accelerated the electron transfer and enhanced the signal detection. Under optimal conditions, the linear ranges of the electrochemical biosensor were 5 × 10⁻⁶ to 5 × 10⁻⁵ and 5 × 10⁻⁵ to 4 × 10⁻⁴ M, showing high selectivity and sensitivity. In addition, the electrochemical biosensor had good stability, a short detection time, and didn’t require an extremely low detection limit. Therefore, it provided a practical option for the detection of Ca2+ in cow serum, which may contribute to the diagnosis of subclinical hypocalcemia at dairy farms.
Supplementary Materials
The following supporting information can be downloaded at: https://www.mdpi.com/article/10.3390/bios12050331/s1, Figure S1: Scanning cycles of deposition of AuNPs; Figure S2: Comparison of the relative resistances of Ca2+ at different concentrations with and without NGR modification.
Author Contributions
Conceptualization, Z.Y. and H.W.; methodology, H.W. and F.Z.; investigation, Z.Y., H.W. and F.Z.; writing—original draft preparation, Z.Y.; writing—review and editing, H.W., Y.Z. and B.X.; supervision, F.Z.; project administration, B.X.; funding acquisition, B.X. and X.T. All authors have read and agreed to the published version of the manuscript.
Funding
This research was funded by the State Key Laboratory of Animal Nutrition (No. 2004DA125184G2104), the Science and Technology Innovation Project of Institute of Animal Sciences (No. 2021-YWF-ZYSQ-05) and the National Key R&D Program of China (2019YFE0125600).
Institutional Review Board Statement
Not applicable.
Informed Consent Statement
Not applicable.
Data Availability Statement
Not applicable.
Conflicts of Interest
The authors declare no conflict of interest.
References
- Wu, J. A DNAzyme-Based Electrochemical Impedance Biosensor for Highly Sensitive Detection of Cu2+ Ions in Aqueous Solution. Int. J. Electrochem. Sci. 2017, 12, 11666–11676. [Google Scholar] [CrossRef]
- Yu, T.; Zhou, W.; Liu, J. Ultrasensitive DNAzyme-Based Ca2+ Detection Boosted by Ethanol and a Solvent-Compatible Scaffold for Aptazyme Design. ChemBioChem 2018, 19, 31–36. [Google Scholar] [CrossRef] [PubMed]
- Chen, X.; Wang, X.; Lu, Z.; Luo, H.; Dong, L.; Ji, Z.; Xu, F.; Huo, D.; Hou, C. Ultra-Sensitive Detection of Pb2+ Based on DNAzymes Coupling with Multi-Cycle Strand Displacement Amplification (M-Sda) and Nano-Graphene Oxide. Sens. Actuators B Chem. 2020, 311, 127898. [Google Scholar] [CrossRef]
- He, Y.; Tian, J.; Zhang, J.; Chen, S.; Jiang, Y.; Hu, K.; Zhao, Y.; Zhao, S. DNAzyme Self-Assembled Gold Nanorods-Based Fret or Polarization Assay for Ultrasensitive and Selective Detection of Copper(II) Ion. Biosens. Bioelectron. 2014, 55, 285–288. [Google Scholar] [CrossRef]
- Santoro, S.W.; Joyce, G.F.; Sakthivel, K.; Gramatikova, S.; Barbas, C.F., 3rd. RNA Cleavage by a DNA Enzyme with Extended Chemical Functionality. J. Am. Chem. Soc. 2000, 122, 2433–2439. [Google Scholar] [CrossRef]
- Liao, Y.; Guo, S.; Hua, X.; Yuan, R.; Xu, W. Autocatalytic Replicated Mg2+-Ligation DNAzyme as Robust Biocatalyst for Sensitive, Label-Free and Enzyme-Free Electrochemical Biosensing of Protein. Sens. Actuators B Chem. 2020, 310, 127862. [Google Scholar] [CrossRef]
- Cao, C.; Liu, J.; Tang, S.; Dai, Z.; Xiao, F.; Rang, W.; Liu, L.; Chen, T.; Yuan, Y.; Li, L. Amplified Electrochemical Determination of UO22+ Based on the Cleavage of the DNAzyme and DNA-Modified Gold Nanoparticle Network Structure. Microchim. Acta 2020, 187, 311. [Google Scholar] [CrossRef]
- Li, T.; Dong, S.; Wang, E. Label-Free Colorimetric Detection of Aqueous Mercury Ion (Hg2+) Using Hg2+-Modulated G-Quadruplex-Based DNAzymes. Anal. Chem. 2009, 81, 2144–2149. [Google Scholar] [CrossRef]
- Wang, M.; Zhang, S.; Ye, Z.; Peng, D.; He, L.; Yan, F.; Yang, Y.; Zhang, H.; Zhang, Z. A Gold Electrode Modified with Amino-Modified Reduced Graphene Oxide, Ion Specific DNA and DNAzyme for Dual Electrochemical Determination of Pb (II) and Hg (II). Microchim. Acta 2015, 182, 2251–2258. [Google Scholar] [CrossRef]
- Robertson, D.L.; Joyce, G.F. Selection in Vitro of an RNA Enzyme That Specifically Cleaves Single-Stranded DNA. Nature 1990, 344, 467–468. [Google Scholar] [CrossRef]
- Ren, W.; Huang, P.J.J.; He, M.; Lyu, M.; Wang, S.; Wang, C.; Liu, J. The Two Classic Pb2+-Selective DNAzymes Are Related: Rational Evolution for Understanding Metal Selectivity. ChemBioChem 2020, 21, 1293–1297. [Google Scholar] [CrossRef] [PubMed]
- Heaton, I.; Platt, M. DNAzyme Sensor for the Detection of Ca2+ Using Resistive Pulse Sensing. Sensors 2020, 20, 5877. [Google Scholar] [CrossRef] [PubMed]
- Zhou, W.; Saran, R.; Huang, P.J.J.; Ding, J.; Liu, J. An Exceptionally Selective DNA Cooperatively Binding Two Ca2+ Ions. ChemBioChem 2017, 18, 518–522. [Google Scholar] [CrossRef] [PubMed]
- Zhou, W.; Zhang, Y.; Ding, J.; Liu, J. In Vitro Selection in Serum: RNA-Cleaving DNAzymes for Measuring Ca2+ and Mg2+. Acs Sens. 2016, 1, 600–606. [Google Scholar] [CrossRef]
- Geim, A.K.; Novoselov, K.S. The Rise of Graphene. In Nanoscience and Technology: A Collection of Reviews from Nature Journals; World Scientific: Singapore, 2010; pp. 11–19. [Google Scholar]
- Li, X.; Zhang, G.; Bai, X.; Sun, X.; Wang, X.; Wang, E.; Dai, H. Highly Conducting Graphene Sheets and Langmuir-Blodgett Films. Nat. Nanotechnol. 2008, 3, 538–542. [Google Scholar] [CrossRef] [Green Version]
- Wang, Y.; Shao, Y.; Matson, D.W.; Li, J.; Lin, Y. Nitrogen-Doped Graphene and Its Application in Electrochemical Biosensing. ACS Nano 2010, 4, 1790–1798. [Google Scholar] [CrossRef]
- Giovannetti, G.; Khomyakov, P.A.; Brocks, G.; Karpan, V.V.; van den Brink, J.; Kelly, P.J. Doping Graphene with Metal Contacts. Phys. Rev. Lett. 2008, 101, 026803. [Google Scholar] [CrossRef]
- Kaur, M.; Kaur, M.; Sharma, V.K. Nitrogen-Doped Graphene and Graphene Quantum Dots: A Review Onsynthesis and Applications in Energy, Sensors and Environment. Adv. Colloid Interface Sci. 2018, 259, 44–64. [Google Scholar] [CrossRef]
- Peña-Bahamonde, J.; Nguyen, H.N.; Fanourakis, S.K.; Rodrigues, D.F. Recent Advances in Graphene-Based Biosensor Technology with Applications in Life Sciences. J. Nanobiotechnol. 2018, 16, 1–17. [Google Scholar] [CrossRef] [Green Version]
- Prathish, K.P.; Barsan, M.M.; Geng, D.; Sun, X.; Brett, C.M. Chemically Modified Graphene and Nitrogen-Doped Graphene: Electrochemical Characterisation and Sensing Applications. Electrochim. Acta 2013, 114, 533–542. [Google Scholar] [CrossRef]
- Wang, Y.; Sauriat-Dorizon, H.; Korri-Youssoufi, H. Direct Electrochemical DNA Biosensor Based on Reduced Graphene Oxide and Metalloporphyrin Nanocomposite. Sens. Actuators B Chem. 2017, 251, 40–48. [Google Scholar] [CrossRef]
- Benvidi, A.; Tezerjani, M.D.; Jahanbani, S.; Ardakani, M.M.; Moshtaghioun, S.M. Comparison of Impedimetric Detection of DNA Hybridization on the Various Biosensors Based on Modified Glassy Carbon Electrodes with Panhs and Nanomaterials of RGO and MWCNTs. Talanta 2016, 147, 621–627. [Google Scholar] [CrossRef] [PubMed]
- Yola, M.L.; Eren, T.; Atar, N. A Novel and Sensitive Electrochemical DNA Biosensor Based on Fe@ Au Nanoparticles Decorated Graphene Oxide. Electrochim. Acta 2014, 125, 38–47. [Google Scholar] [CrossRef]
- Zhang, L.-S.; Liang, X.-Q.; Song, W.-G.; Wu, Z.-Y. Identification of the Nitrogen Species on N-Doped Graphene Layers and Pt/Ng Composite Catalyst for Direct Methanol Fuel Cell. Phys. Chem. Chem. Phys. 2010, 12, 12055–12059. [Google Scholar] [CrossRef] [PubMed]
- Jain, R.; Jadon, N.; Pawaiya, A. Polypyrrole Based Next Generation Electrochemical Sensors and Biosensors: A Review. TrAC Trends Anal. Chem. 2017, 97, 363–373. [Google Scholar] [CrossRef]
- Lv, H.; Xu, D.; Henzie, J.; Feng, J.; Lopes, A.; Yamauchi, Y.; Liu, B. Mesoporous Gold Nanospheres Via Thiolate-Au (I) Intermediates. Chem. Sci. 2019, 10, 6423–6430. [Google Scholar] [CrossRef] [Green Version]
- Hossain, M.Z.; Shimizu, N. Covalent Immobilization of Gold Nanoparticles on Graphene. J. Phys. Chem. C 2019, 123, 3512–3516. [Google Scholar] [CrossRef]
- Benvidi, A.; Firouzabadi, A.D.; Tezerjani, M.D.; Moshtaghiun, S.; Mazloum-Ardakani, M.; Ansarin, A. A Highly Sensitive and Selective Electrochemical DNA Biosensor to Diagnose Breast Cancer. J. Electroanal. Chem. 2015, 750, 57–64. [Google Scholar] [CrossRef]
- Martinez, N.; Risco, C.; Lima, F.; Bisinotto, R.; Greco, L.; Ribeiro, E.; Maunsell, F.; Galvão, K.; Santos, J. Evaluation of Peripartal Calcium Status, Energetic Profile, and Neutrophil Function in Dairy Cows at Low or High Risk of Developing Uterine Disease. J. Dairy Sci. 2012, 95, 7158–7172. [Google Scholar] [CrossRef] [Green Version]
- Neves, R.; Leno, B.; Bach, K.; McArt, J. Epidemiology of Subclinical Hypocalcemia in Early-Lactation Holstein Dairy Cows: The Temporal Associations of Plasma Calcium Concentration in the First 4 Days in Milk with Disease and Milk Production. J. Dairy Sci. 2018, 101, 9321–9331. [Google Scholar] [CrossRef] [Green Version]
- Hendriks, S.; Huzzey, J.; Kuhn-Sherlock, B.; Turner, S.-A.; Mueller, K.; Phyn, C.; Donaghy, D.; Roche, J. Associations between Lying Behavior and Activity and Hypocalcemia in Grazing Dairy Cows During the Transition Period. J. Dairy Sci. 2020, 103, 10530–10546. [Google Scholar] [CrossRef] [PubMed]
- Verhoef, W.; Zuidhof, S.; Ralston, B.; Ross, J.A.; Olson, M. Dissolution Rates of Calcium Boluses and Their Effects on Serum Calcium in Dairy Cattle. Vet. Med. Res. Rep. 2021, 12, 23. [Google Scholar]
- Pan, D.; Gu, Y.; Lan, H.; Sun, Y.; Gao, H. Functional Graphene-Gold Nano-Composite Fabricated Electrochemical Biosensor for Direct and Rapid Detection of Bisphenol A. Anal. Chim. Acta 2015, 853, 297–302. [Google Scholar] [CrossRef] [PubMed]
- Wang, P.; Li, X.; Dai, Z.; Zou, X.; Han, X. An Efficient Electrochemical Method for Direct Screening of the Mutation Status of DNA Base in Oligonucleotides. Sens. Actuators B Chem. 2014, 201, 222–227. [Google Scholar] [CrossRef]
- Singh, S.; Gill, A.A.; Nlooto, M.; Karpoormath, R. Prostate Cancer Biomarkers Detection Using Nanoparticles Based Electrochemical Biosensors. Biosens. Bioelectron. 2019, 137, 213–221. [Google Scholar] [CrossRef]
- Menon, S.; Mathew, M.R.; Sam, S.; Keerthi, K.; Kumar, K.G. Recent Advances and Challenges in Electrochemical Biosensors for Emerging and Re-Emerging Infectious Diseases. J. Electroanal. Chem. 2020, 878, 114596. [Google Scholar] [CrossRef]
- Powley, C.R.; Geiger, R.F.; Nieman, T.A. Bipolar Pulse Conductance Measurements with a Calcium Ion-Selective Electrode. Anal. Chem. 1980, 52, 705–709. [Google Scholar] [CrossRef]
- Eriksen, R.S.; Mackey, D.J.; van Dam, R.; Nowak, B. Copper Speciation and Toxicity in Macquarie Harbour, Tasmania: An Investigation Using a Copper Ion Selective Electrode. Mar. Chem. 2001, 74, 99–113. [Google Scholar] [CrossRef]
- De Marco, R.; Shackleton, J. Calibration of the Hg Chalcogenide Glass Membrane Ion-Selective Electrode in Seawater Media. Talanta 1999, 49, 385–391. [Google Scholar] [CrossRef]
- Ceresa, A.; Bakker, E.; Hattendorf, B.; Günther, D.; Pretsch, E. Potentiometric Polymeric Membrane Electrodes for Measurement of Environmental Samples at Trace Levels: New Requirements for Selectivities and Measuring Protocols, and Comparison with Icpms. Anal. Chem. 2001, 73, 343–351. [Google Scholar] [CrossRef]
- Hernández, R.; Riu, J.; Rius, F.X. Determination of Calcium Ion in Sap Using Carbon Nanotube-Based Ion-Selective Electrodes. Analyst 2010, 135, 1979–1985. [Google Scholar] [CrossRef] [PubMed]
- Komaba, S.; Akatsuka, T.; Ohura, K.; Suzuki, C.; Yabuuchi, N.; Kanazawa, S.; Tsuchiya, K.; Hasegawa, T. All-Solid-State Ion-Selective Electrodes with Redox-Active Lithium, Sodium, and Potassium Insertion Materials as the Inner Solid-Contact Layer. Analyst 2017, 142, 3857–3866. [Google Scholar] [CrossRef] [PubMed]
- Lindfors, T.; Ivaska, A. Stability of the Inner Polyaniline Solid Contact Layer in All-Solid-State K+-Selective Electrodes Based on Plasticized Poly (Vinyl Chloride). Anal. Chem. 2004, 76, 4387–4394. [Google Scholar] [CrossRef] [PubMed]
- Vázquez, M.; Danielsson, P.; Bobacka, J.; Lewenstam, A.; Ivaska, A. Solution-Cast Films of Poly (3, 4-Ethylenedioxythiophene) as Ion-to-Electron Transducers in All-Solid-State Ion-Selective Electrodes. Sens. Actuators B Chem. 2004, 97, 182–189. [Google Scholar] [CrossRef]
- Long, D.; Li, W.; Ling, L.; Miyawaki, J.; Mochida, I.; Yoon, S.-H. Preparation of Nitrogen-Doped Graphene Sheets by a Combined Chemical and Hydrothermal Reduction of Graphene Oxide. Langmuir 2010, 26, 16096–16102. [Google Scholar] [CrossRef]
- Thanh, T.D.; Balamurugan, J.; Lee, S.H.; Kim, N.H.; Lee, J.H. Effective Seed-Assisted Synthesis of Gold Nanoparticles Anchored Nitrogen-Doped Graphene for Electrochemical Detection of Glucose and Dopamine. Biosens. Bioelectron. 2016, 81, 259–267. [Google Scholar] [CrossRef]
- Zhang, C.; Lai, C.; Zeng, G.; Huang, D.; Tang, L.; Yang, C.; Zhou, Y.; Qin, L.; Cheng, M. Nanoporous Au-Based Chronocoulometric Aptasensor for Amplified Detection of Pb2+ Using DNAzyme Modified with Au Nanoparticles. Biosens. Bioelectron. 2016, 81, 61–67. [Google Scholar] [CrossRef]
- Maldonado, S.; Stevenson, K.J. Influence of Nitrogen Doping on Oxygen Reduction Electrocatalysis at Carbon Nanofiber Electrodes. J. Phys. Chem. B 2005, 109, 4707–4716. [Google Scholar] [CrossRef]
- Sheng, Z.H.; Zheng, X.Q.; Xu, J.Y.; Bao, W.J.; Wang, F.B.; Xia, X.H. Electrochemical Sensor Based on Nitrogen Doped Graphene: Simultaneous Determination of Ascorbic Acid, Dopamine and Uric Acid. Biosens Bioelectron 2012, 34, 125–131. [Google Scholar] [CrossRef]
- Chen, M.; Hou, C.; Huo, D.; Bao, J.; Fa, H.; Shen, C. An Electrochemical DNA Biosensor Based on Nitrogen-Doped Graphene/Au Nanoparticles for Human Multidrug Resistance Gene Detection. Biosens. Bioelectron. 2016, 85, 684–691. [Google Scholar] [CrossRef]
- Radi, A.E.; Acero Sánchez, J.L.; Baldrich, E.; O’Sullivan, C.K. Reagentless, Reusable, Ultrasensitive Electrochemical Molecular Beacon Aptasensor. J. Am. Chem. Soc. 2006, 128, 117–124. [Google Scholar] [CrossRef] [PubMed]
- Benvidi, A.; Firouzabadi, A.D.; Moshtaghiun, S.M.; Mazloum-Ardakani, M.; Tezerjani, M.D. Ultrasensitive DNA Sensor Based on Gold Nanoparticles/Reduced Graphene Oxide/Glassy Carbon Electrode. Anal. Biochem. 2015, 484, 24–30. [Google Scholar] [CrossRef] [PubMed]
- Zhao, Z.; Sun, Y.; Li, P.; Zhang, W.; Lian, K.; Hu, J.; Chen, Y. Preparation and Characterization of AuNPs/CNTs-ERGO Electrochemical Sensors for Highly Sensitive Detection of Hydrazine. Talanta 2016, 158, 283–291. [Google Scholar] [CrossRef] [PubMed] [Green Version]
- Li, L.; Ma, X.; Dong, W.; Miao, P.; Tang, Y. Electrochemical Determination of Ca2+ Based on Recycling Formation of Highly Selective DNAzyme and Gold Nanoparticle-Mediated Amplification. Bioconjug. Chem. 2018, 29, 1021–1024. [Google Scholar] [CrossRef] [PubMed]
- Wang, H.; Zhang, F.; Wang, Y.; Shi, F.; Luo, Q.; Zheng, S.; Chen, J.; Dai, D.; Yang, L.; Tang, X.; et al. DNAzyme-Amplified Electrochemical Biosensor Coupled with Ph Meter for Ca2+ Determination at Variable Ph Environments. Nanomaterials 2022, 12, 4. [Google Scholar] [CrossRef]
- Wang, H.; Luo, Q.; Zhao, Y.; Nan, X.; Zhang, F.; Wang, Y.; Wang, Y.; Hua, D.; Zheng, S.; Jiang, L.; et al. Electrochemical Device Based on Nonspecific DNAzyme for the High-Accuracy Determination of Ca2+ with Pb2+ Interference. Bioelectrochemistry 2021, 140, 107732. [Google Scholar] [CrossRef]
- Yue, J.; Li, L.; Cao, L.; Zan, M.; Yang, D.; Wang, Z.; Chang, Z.; Mei, Q.; Miao, P.; Dong, W.-F. Two-Step Hydrothermal Preparation of Carbon Dots for Calcium Ion Detection. ACS Appl. Mater. Interfaces 2019, 11, 44566–44572. [Google Scholar] [CrossRef]
- Du, X.; Zhai, J.; Zeng, D.; Chen, F.; Xie, X. Distance-Based Detection of Calcium Ions with Hydrogels Entrapping Exhaustive Ion-Selective Nanoparticles. Sens. Actuators B Chem. 2020, 319, 128300. [Google Scholar] [CrossRef]
- Johns, V.K.; Patel, P.K.; Hassett, S.; Calvo-Marzal, P.; Qin, Y.; Chumbimuni-Torres, K.Y. Visible Light Activated Ion Sensing Using a Photoacid Polymer for Calcium Detection. Anal. Chem. 2014, 86, 6184–6187. [Google Scholar] [CrossRef]
Publisher’s Note: MDPI stays neutral with regard to jurisdictional claims in published maps and institutional affiliations. |
© 2022 by the authors. Licensee MDPI, Basel, Switzerland. This article is an open access article distributed under the terms and conditions of the Creative Commons Attribution (CC BY) license (https://creativecommons.org/licenses/by/4.0/).