Surface Plasmon Resonance Sensitivity Enhancement Based on Protonated Polyaniline Films Doped by Aluminum Nitrate

 ,
,  , , and
Abstract
:1. Introduction
2. Materials and Methods
2.1. Synthesis Technique
2.2. Characterization Techniques
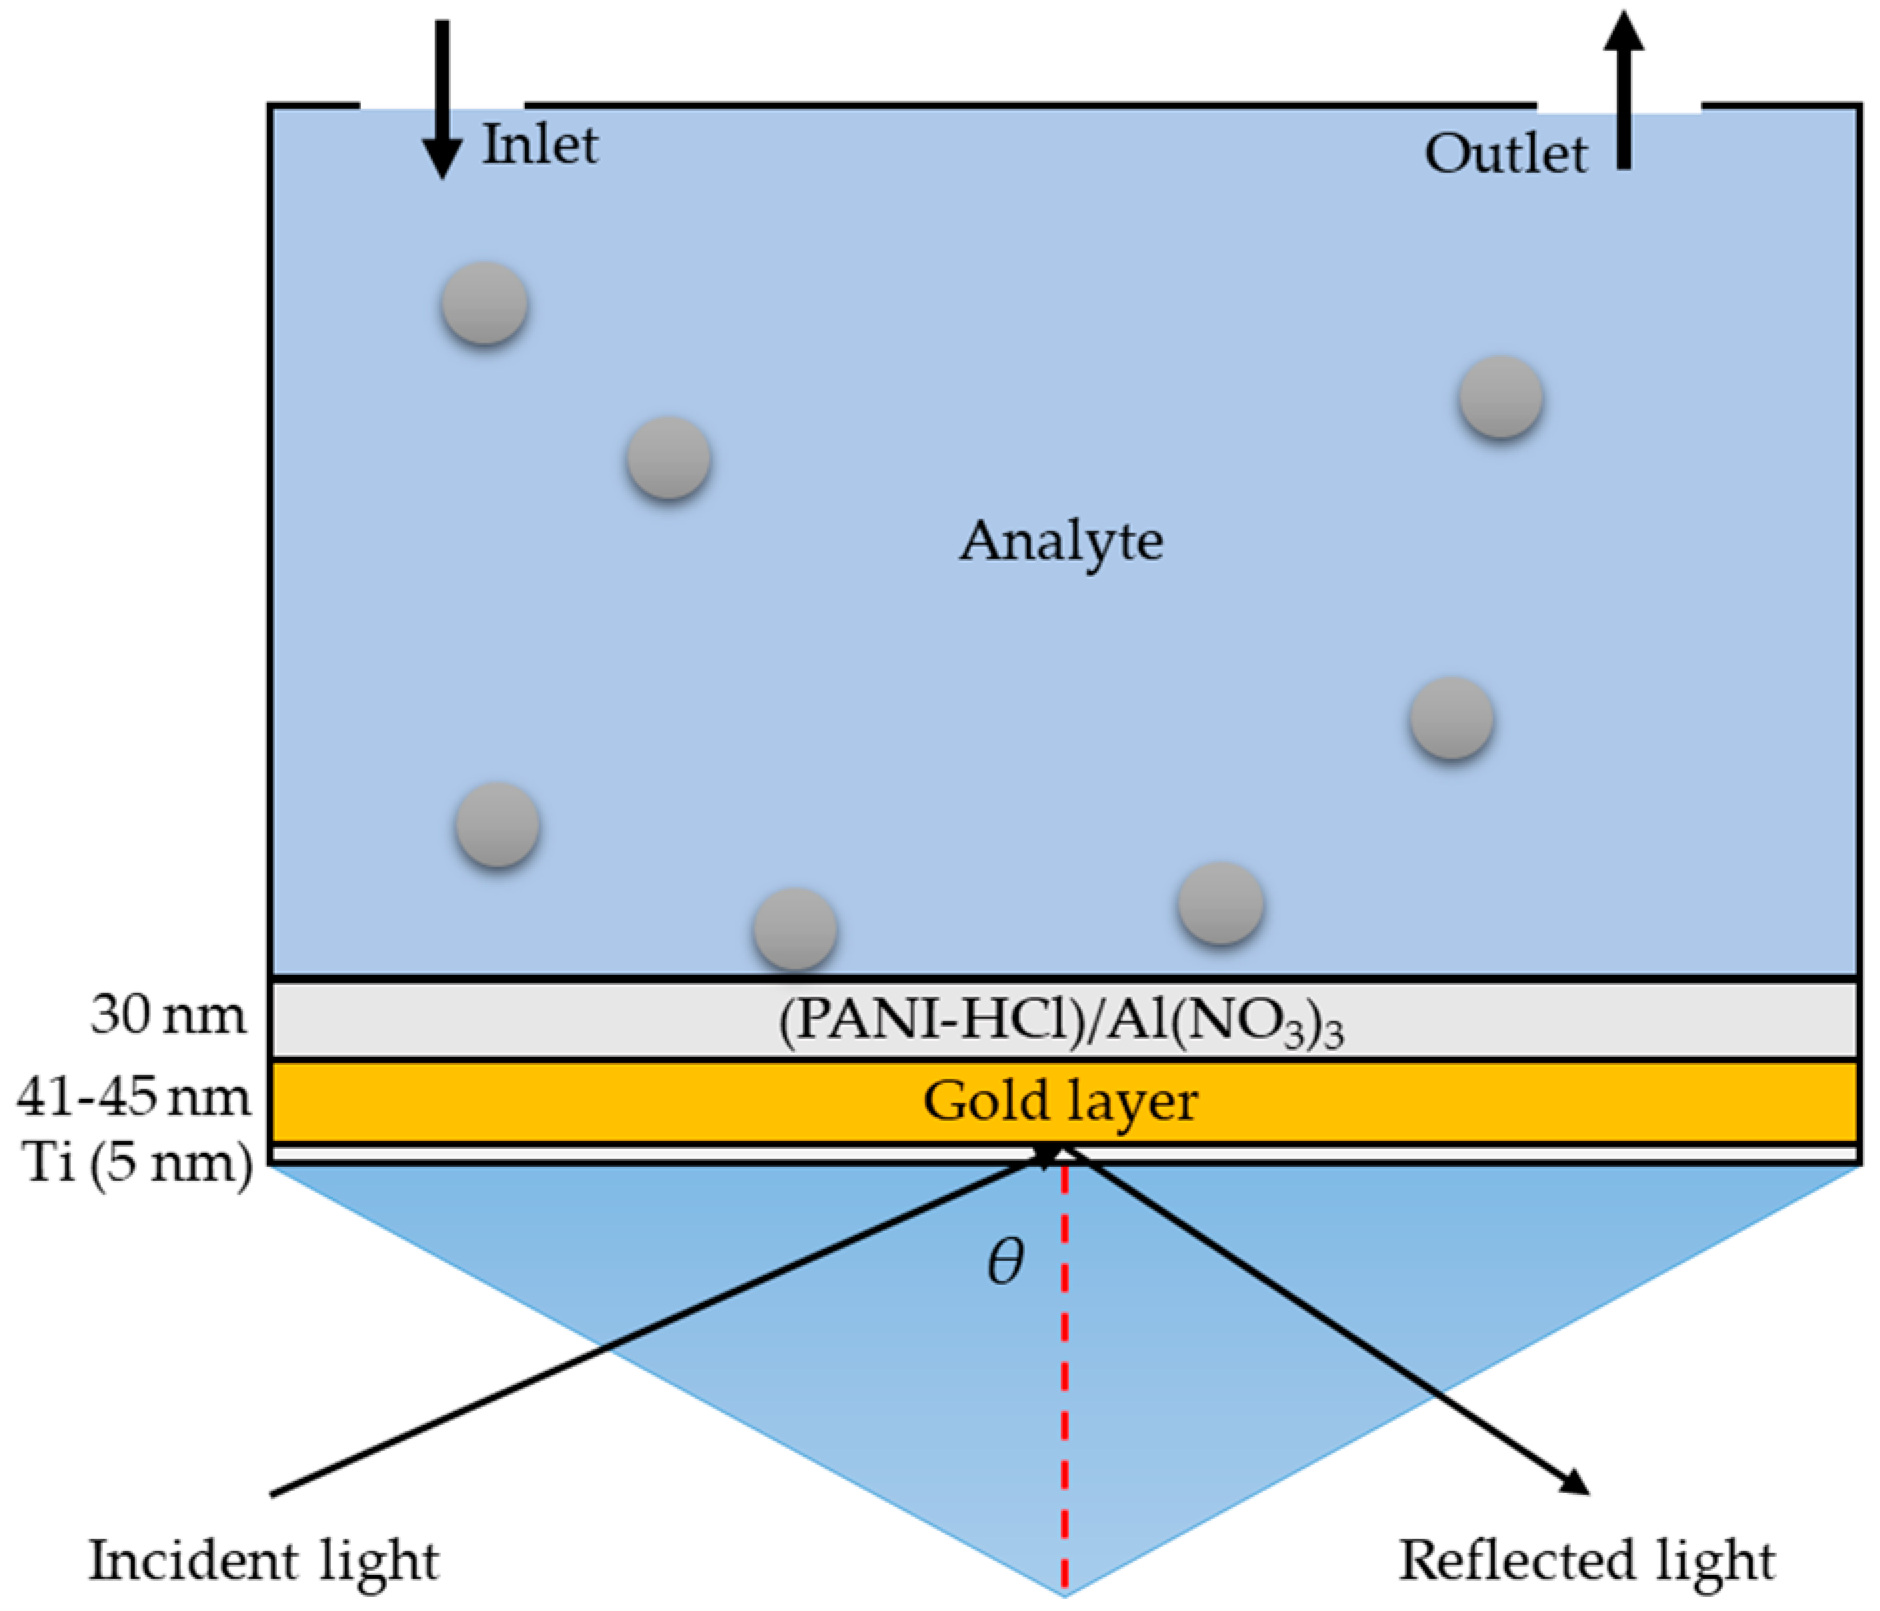
2.3. Surface Plasmon Resonance (SPR) Measurements
3. Results and Discussion
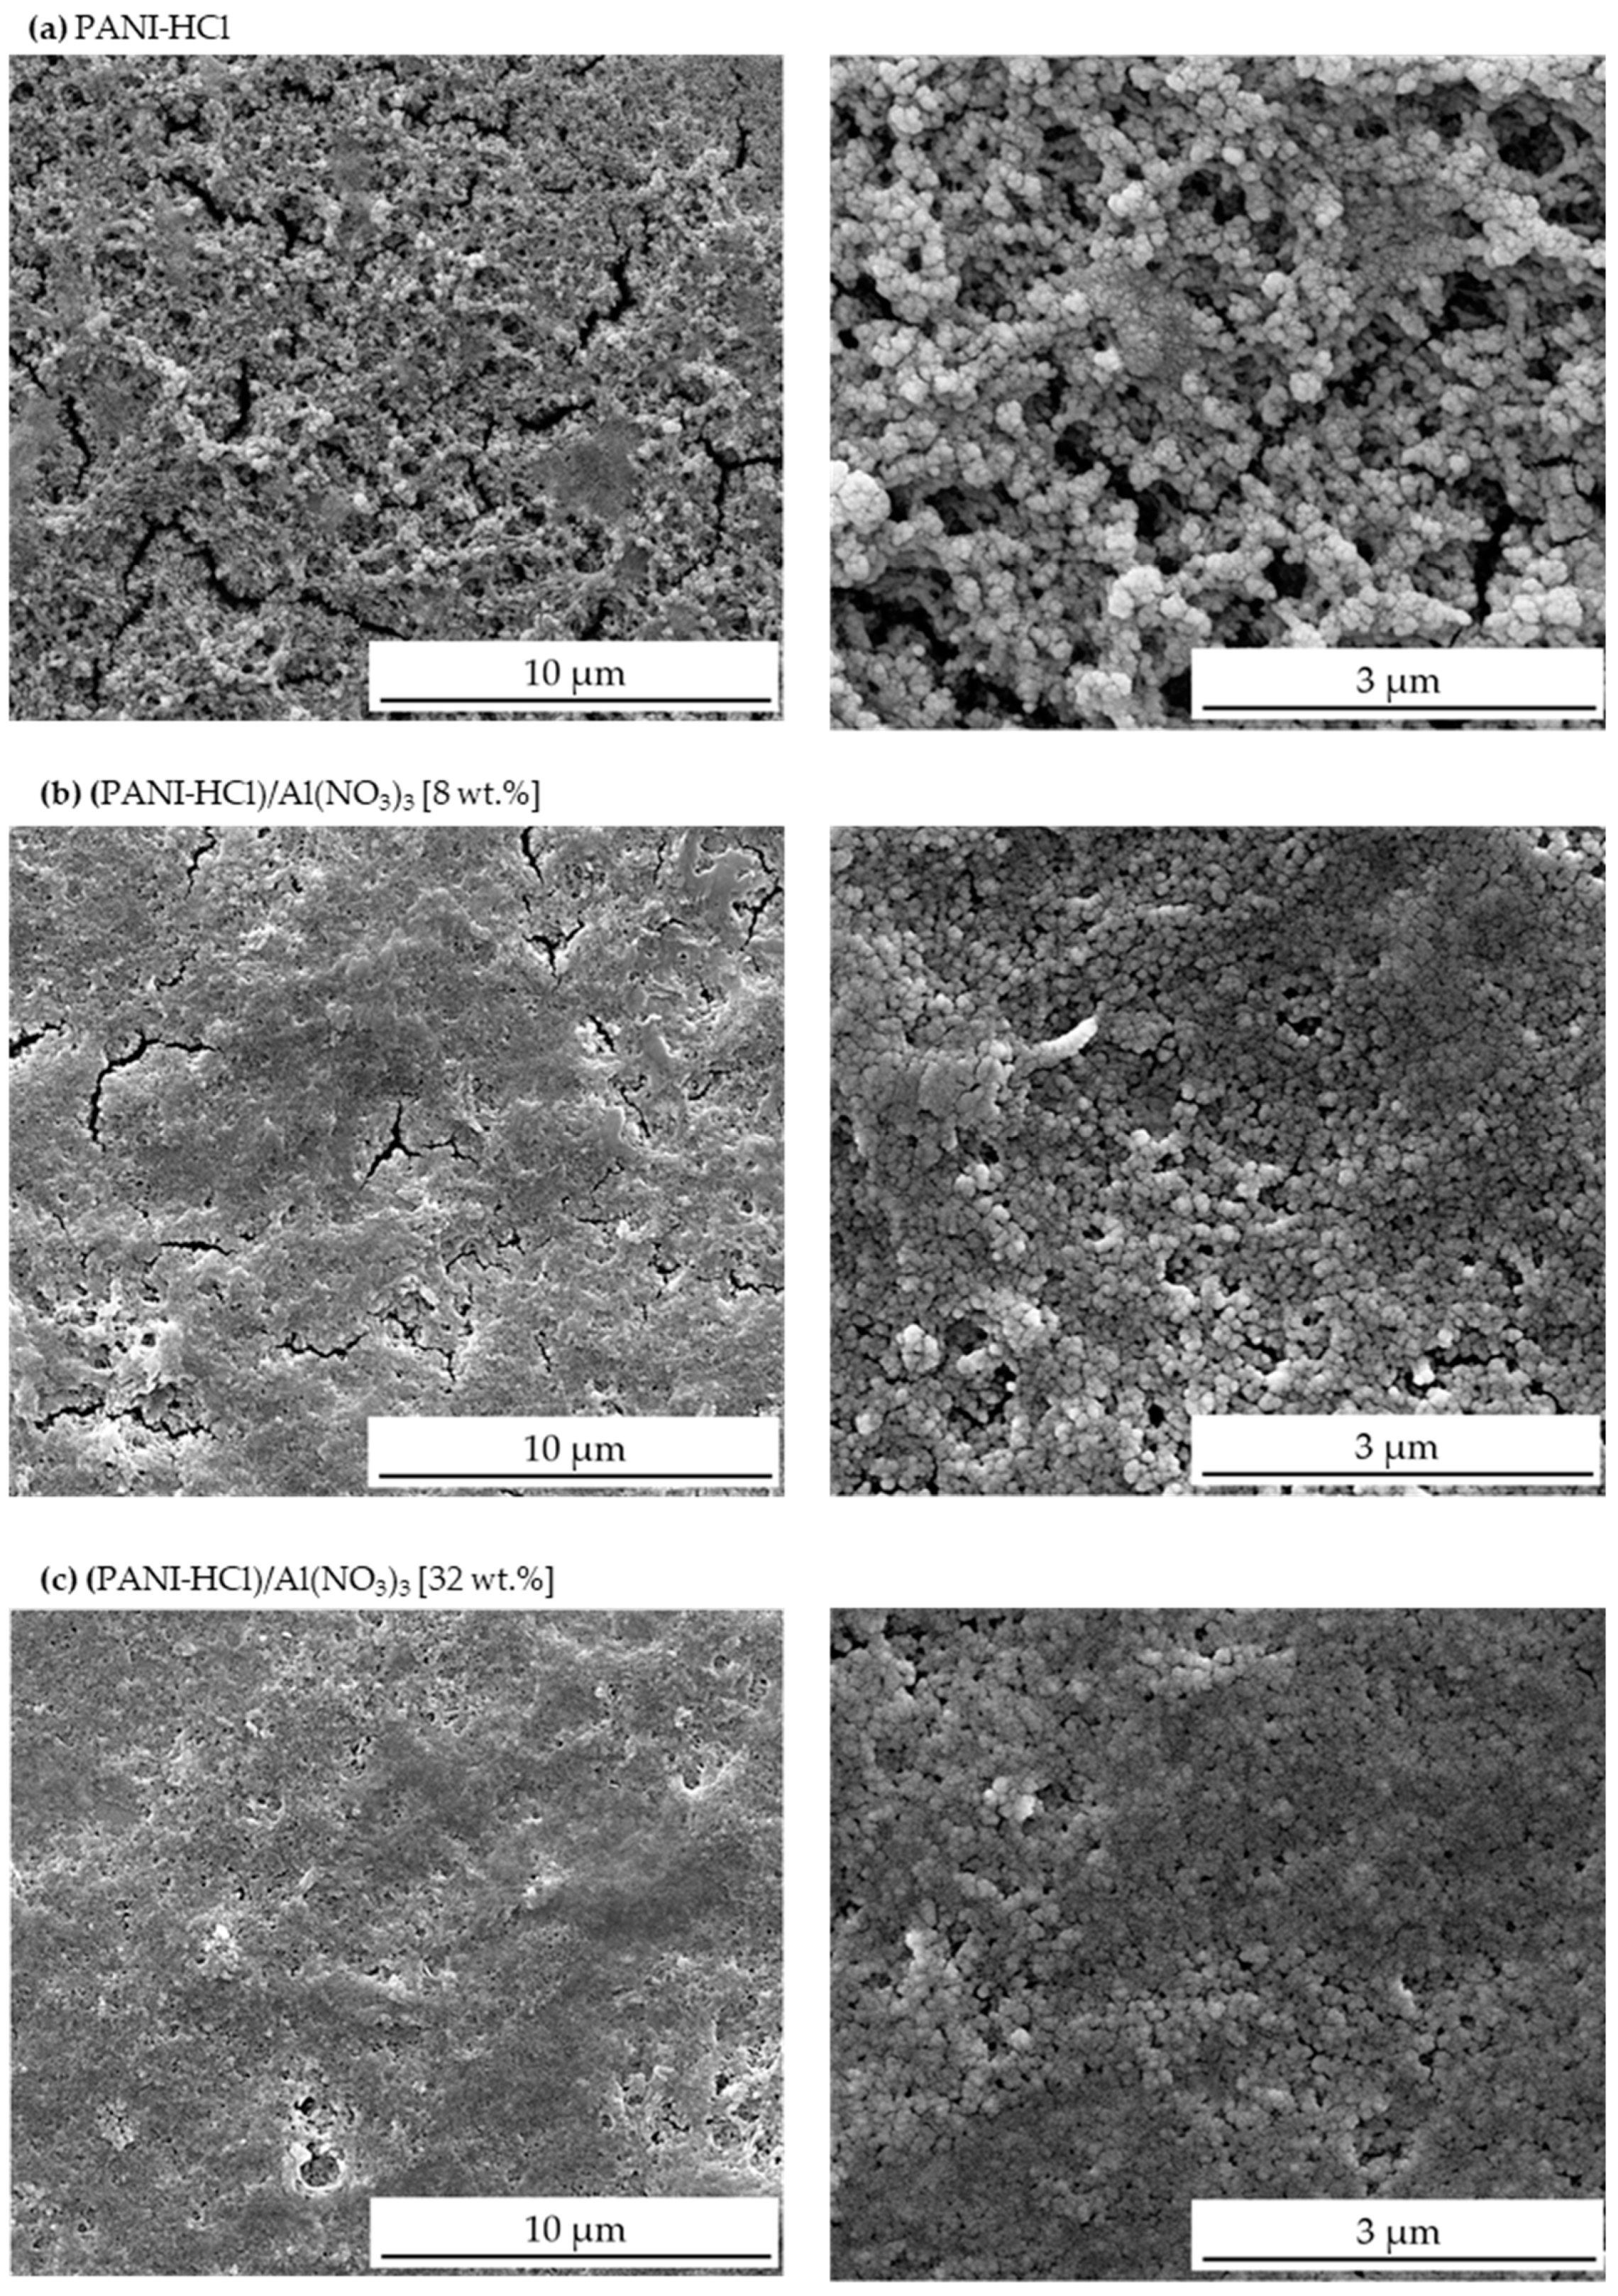
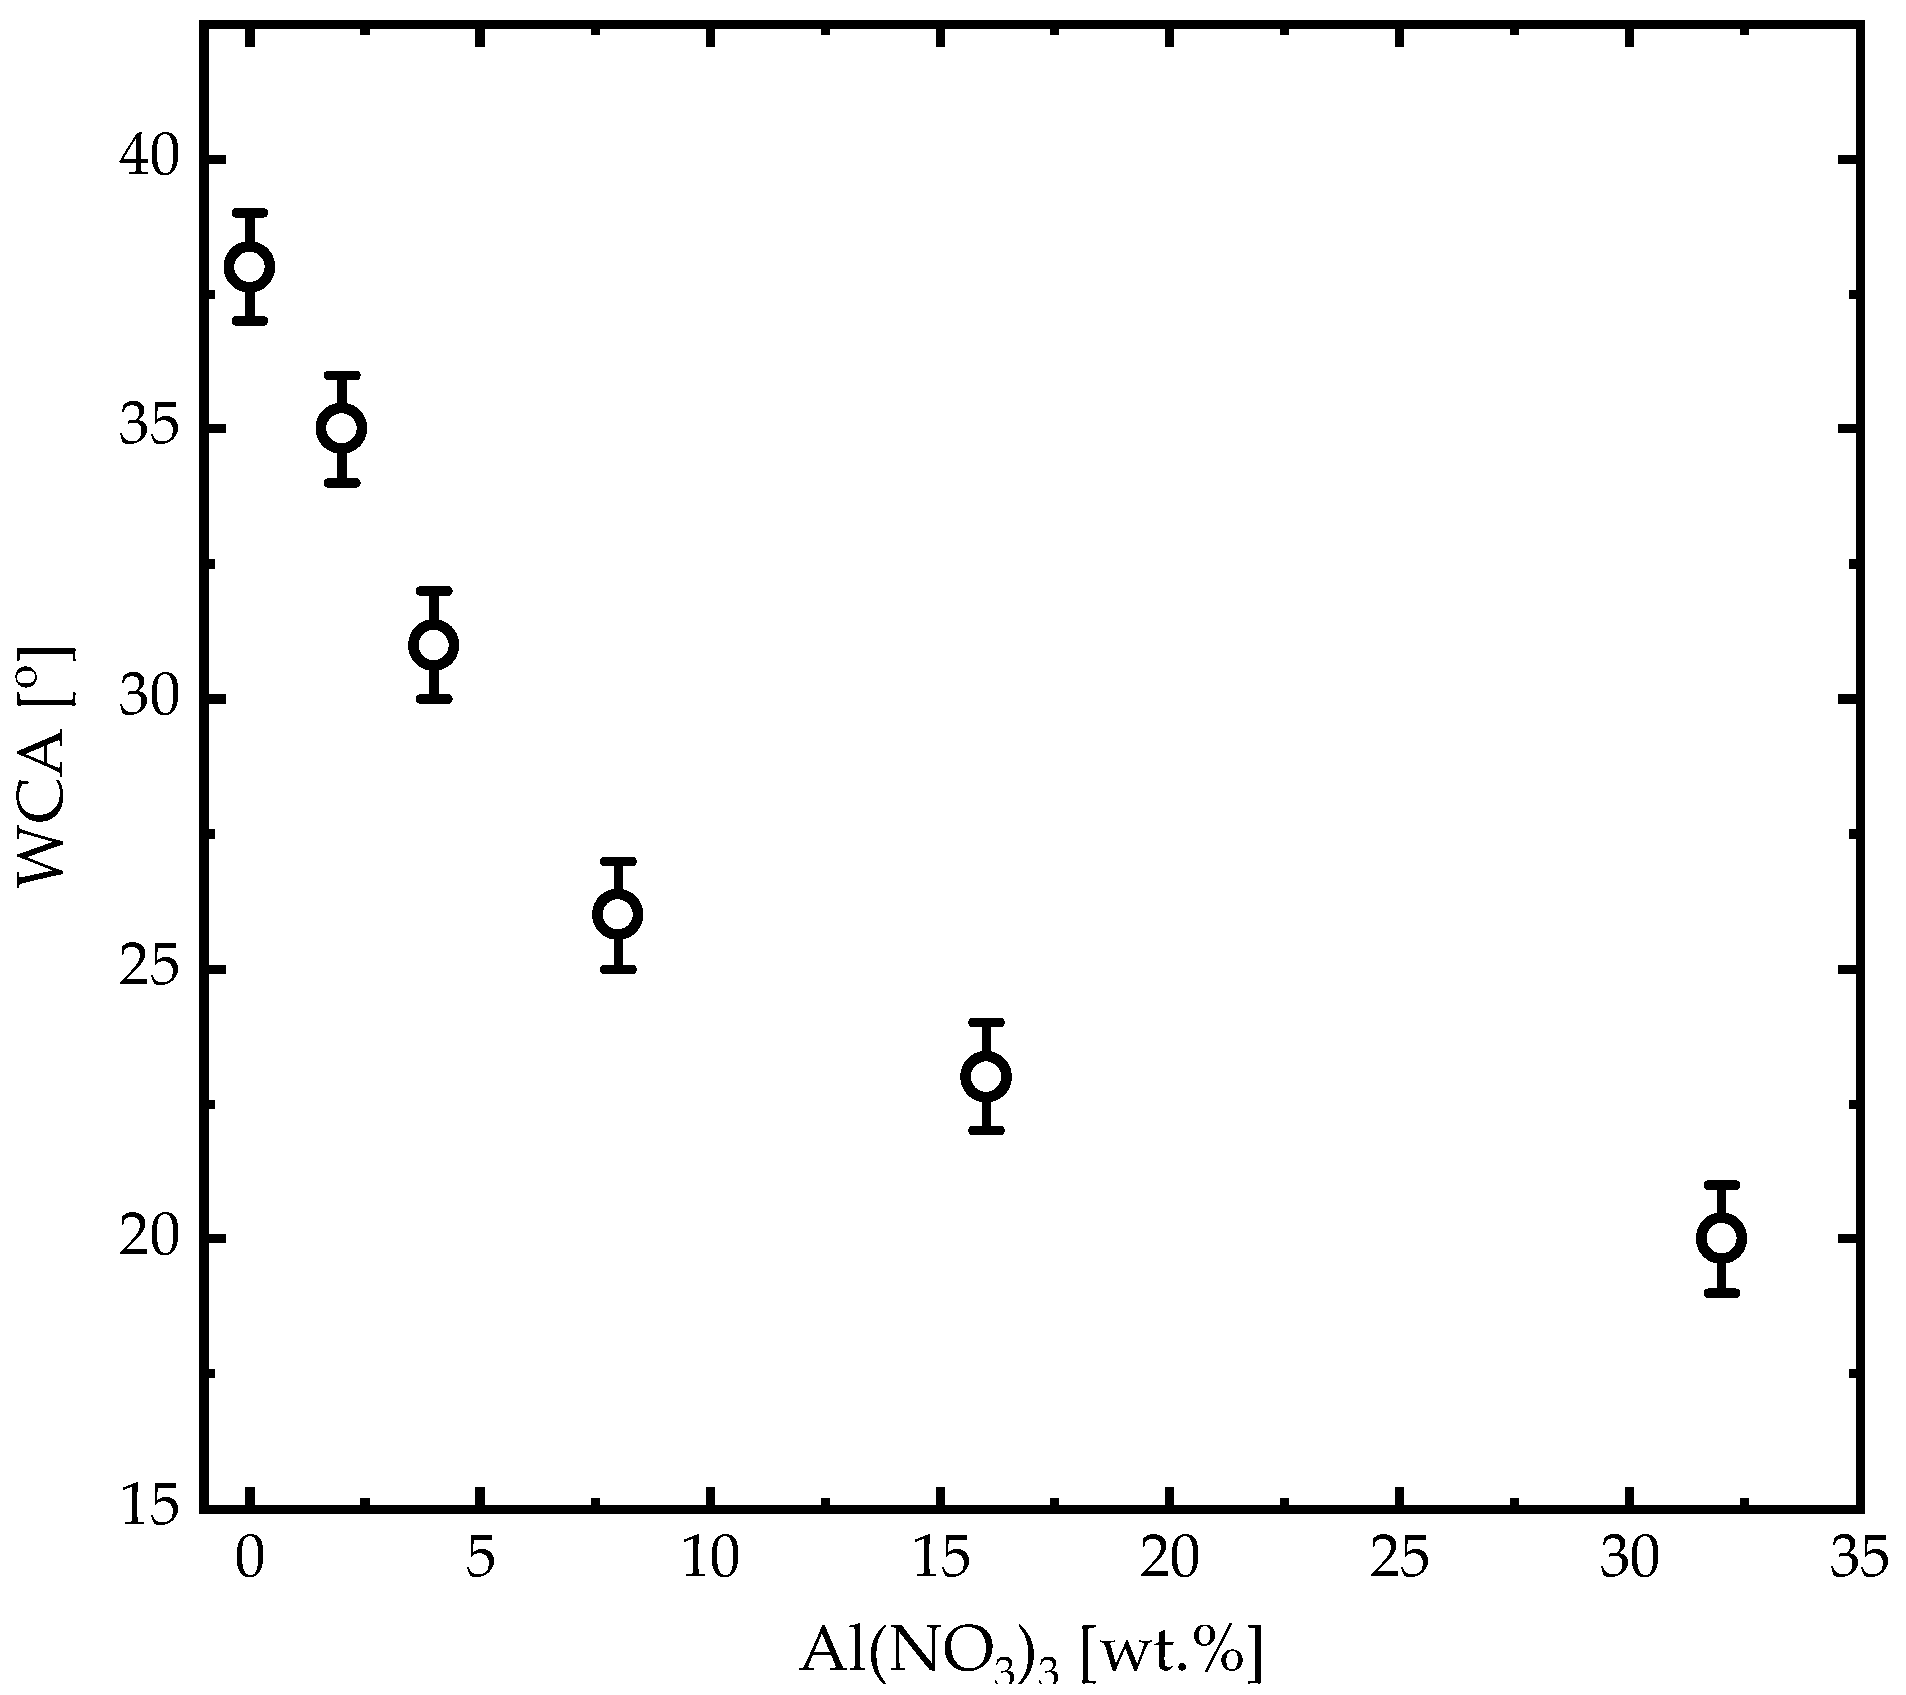
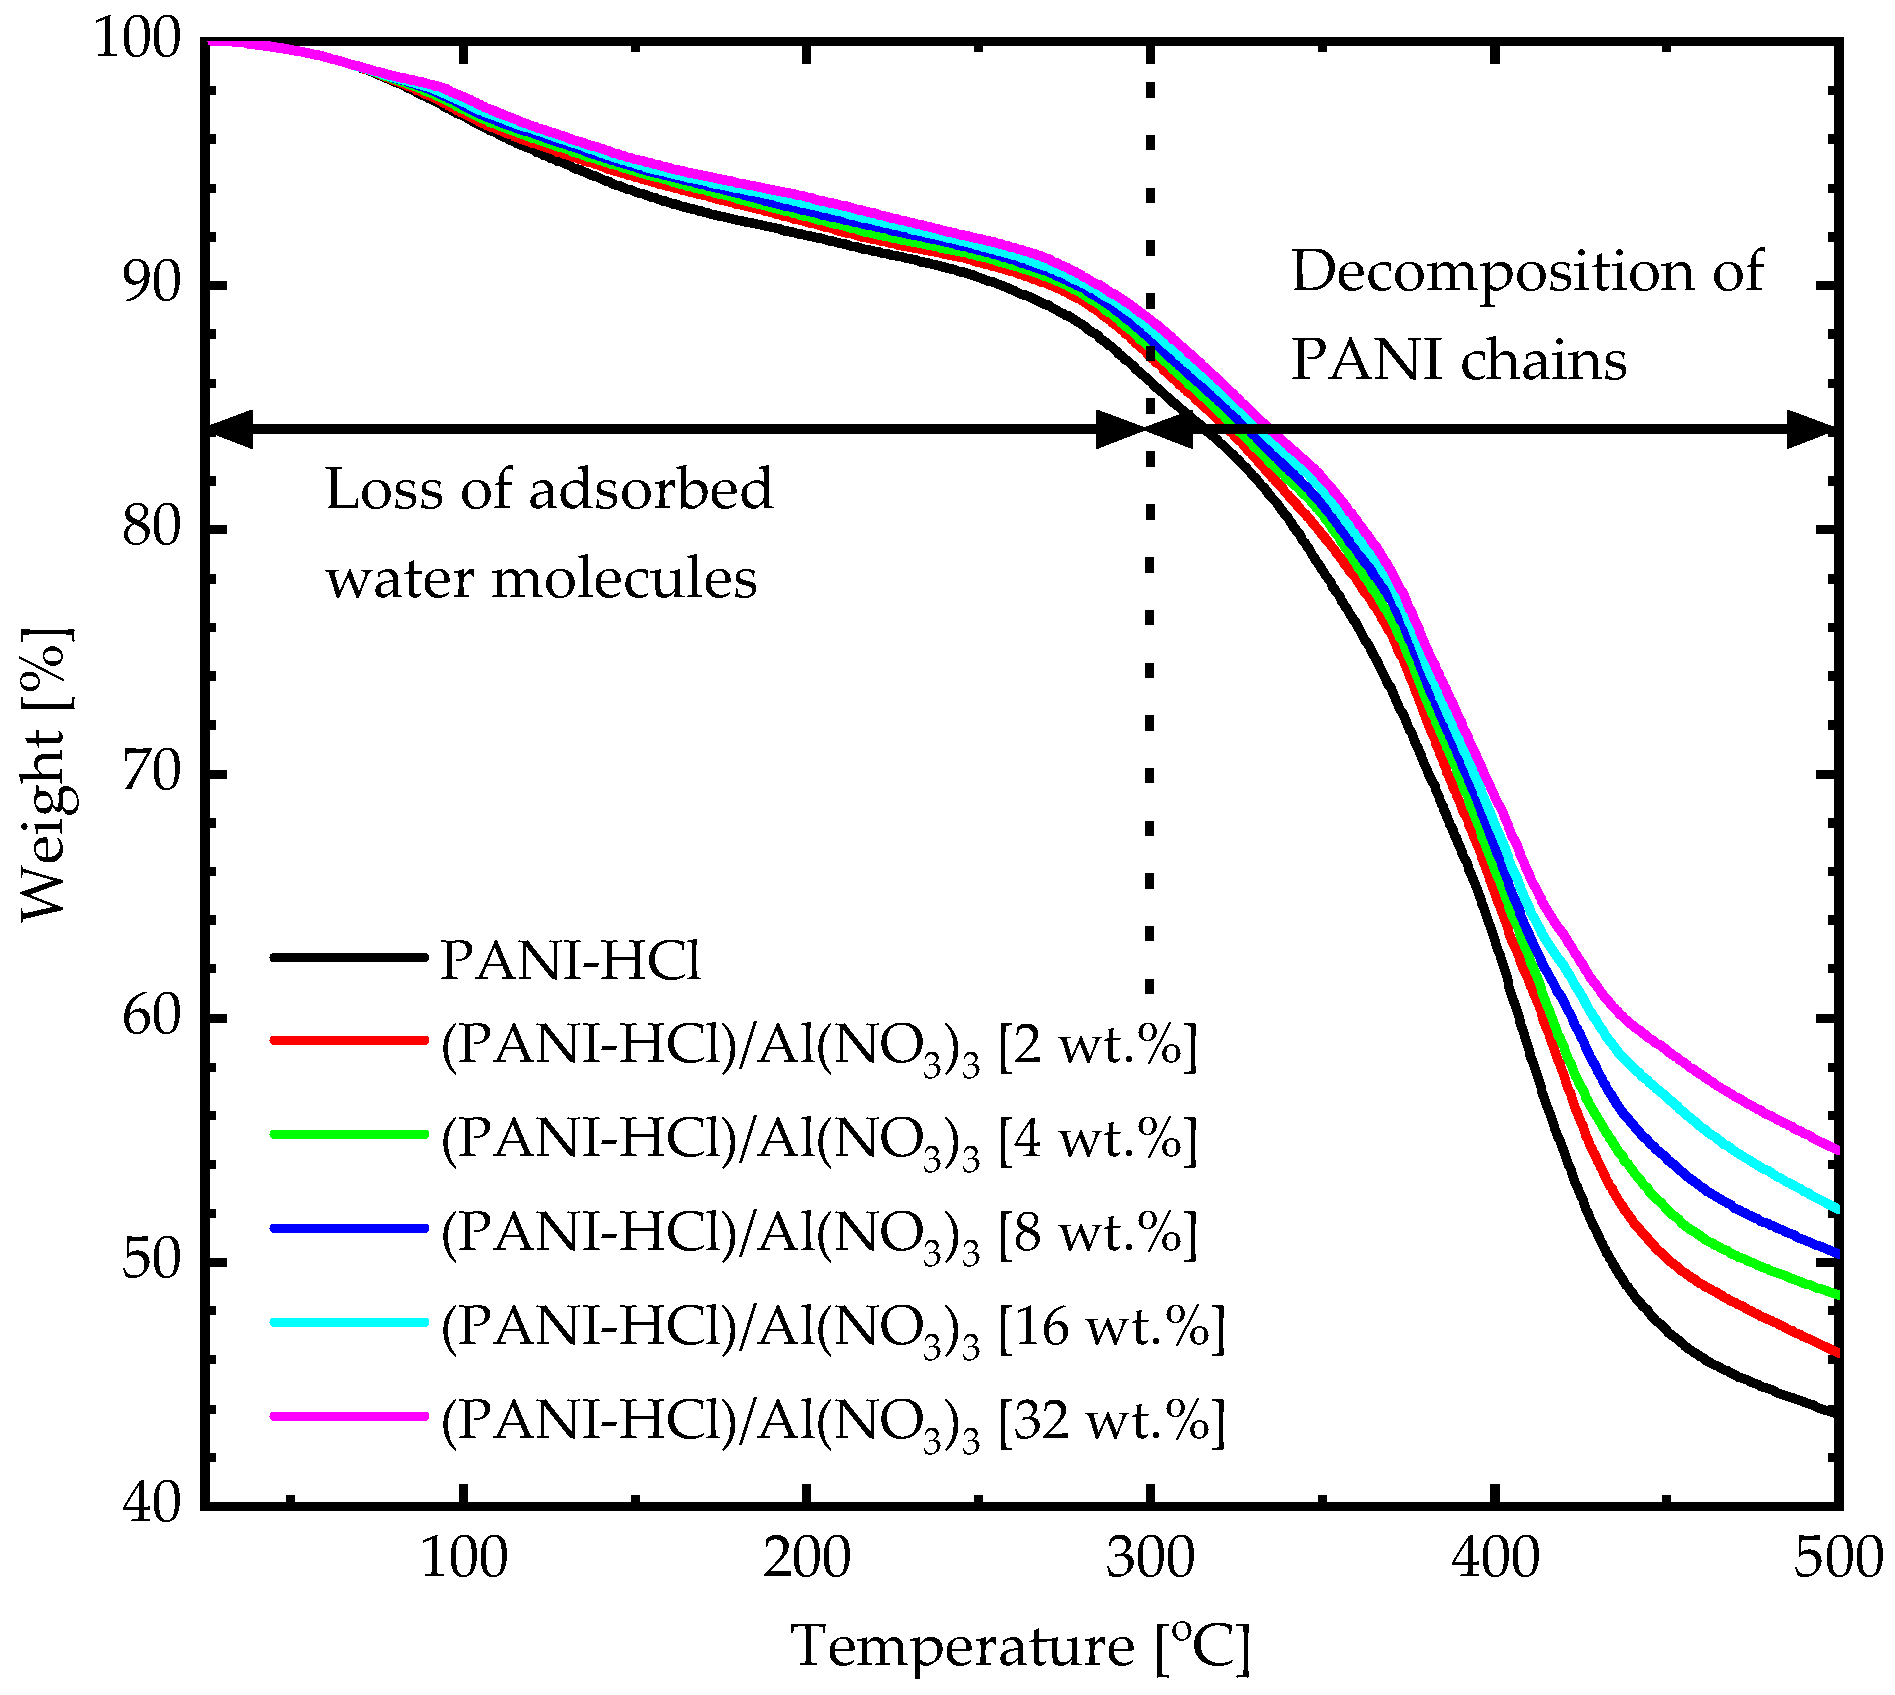
3.1. Physicochemical Properties
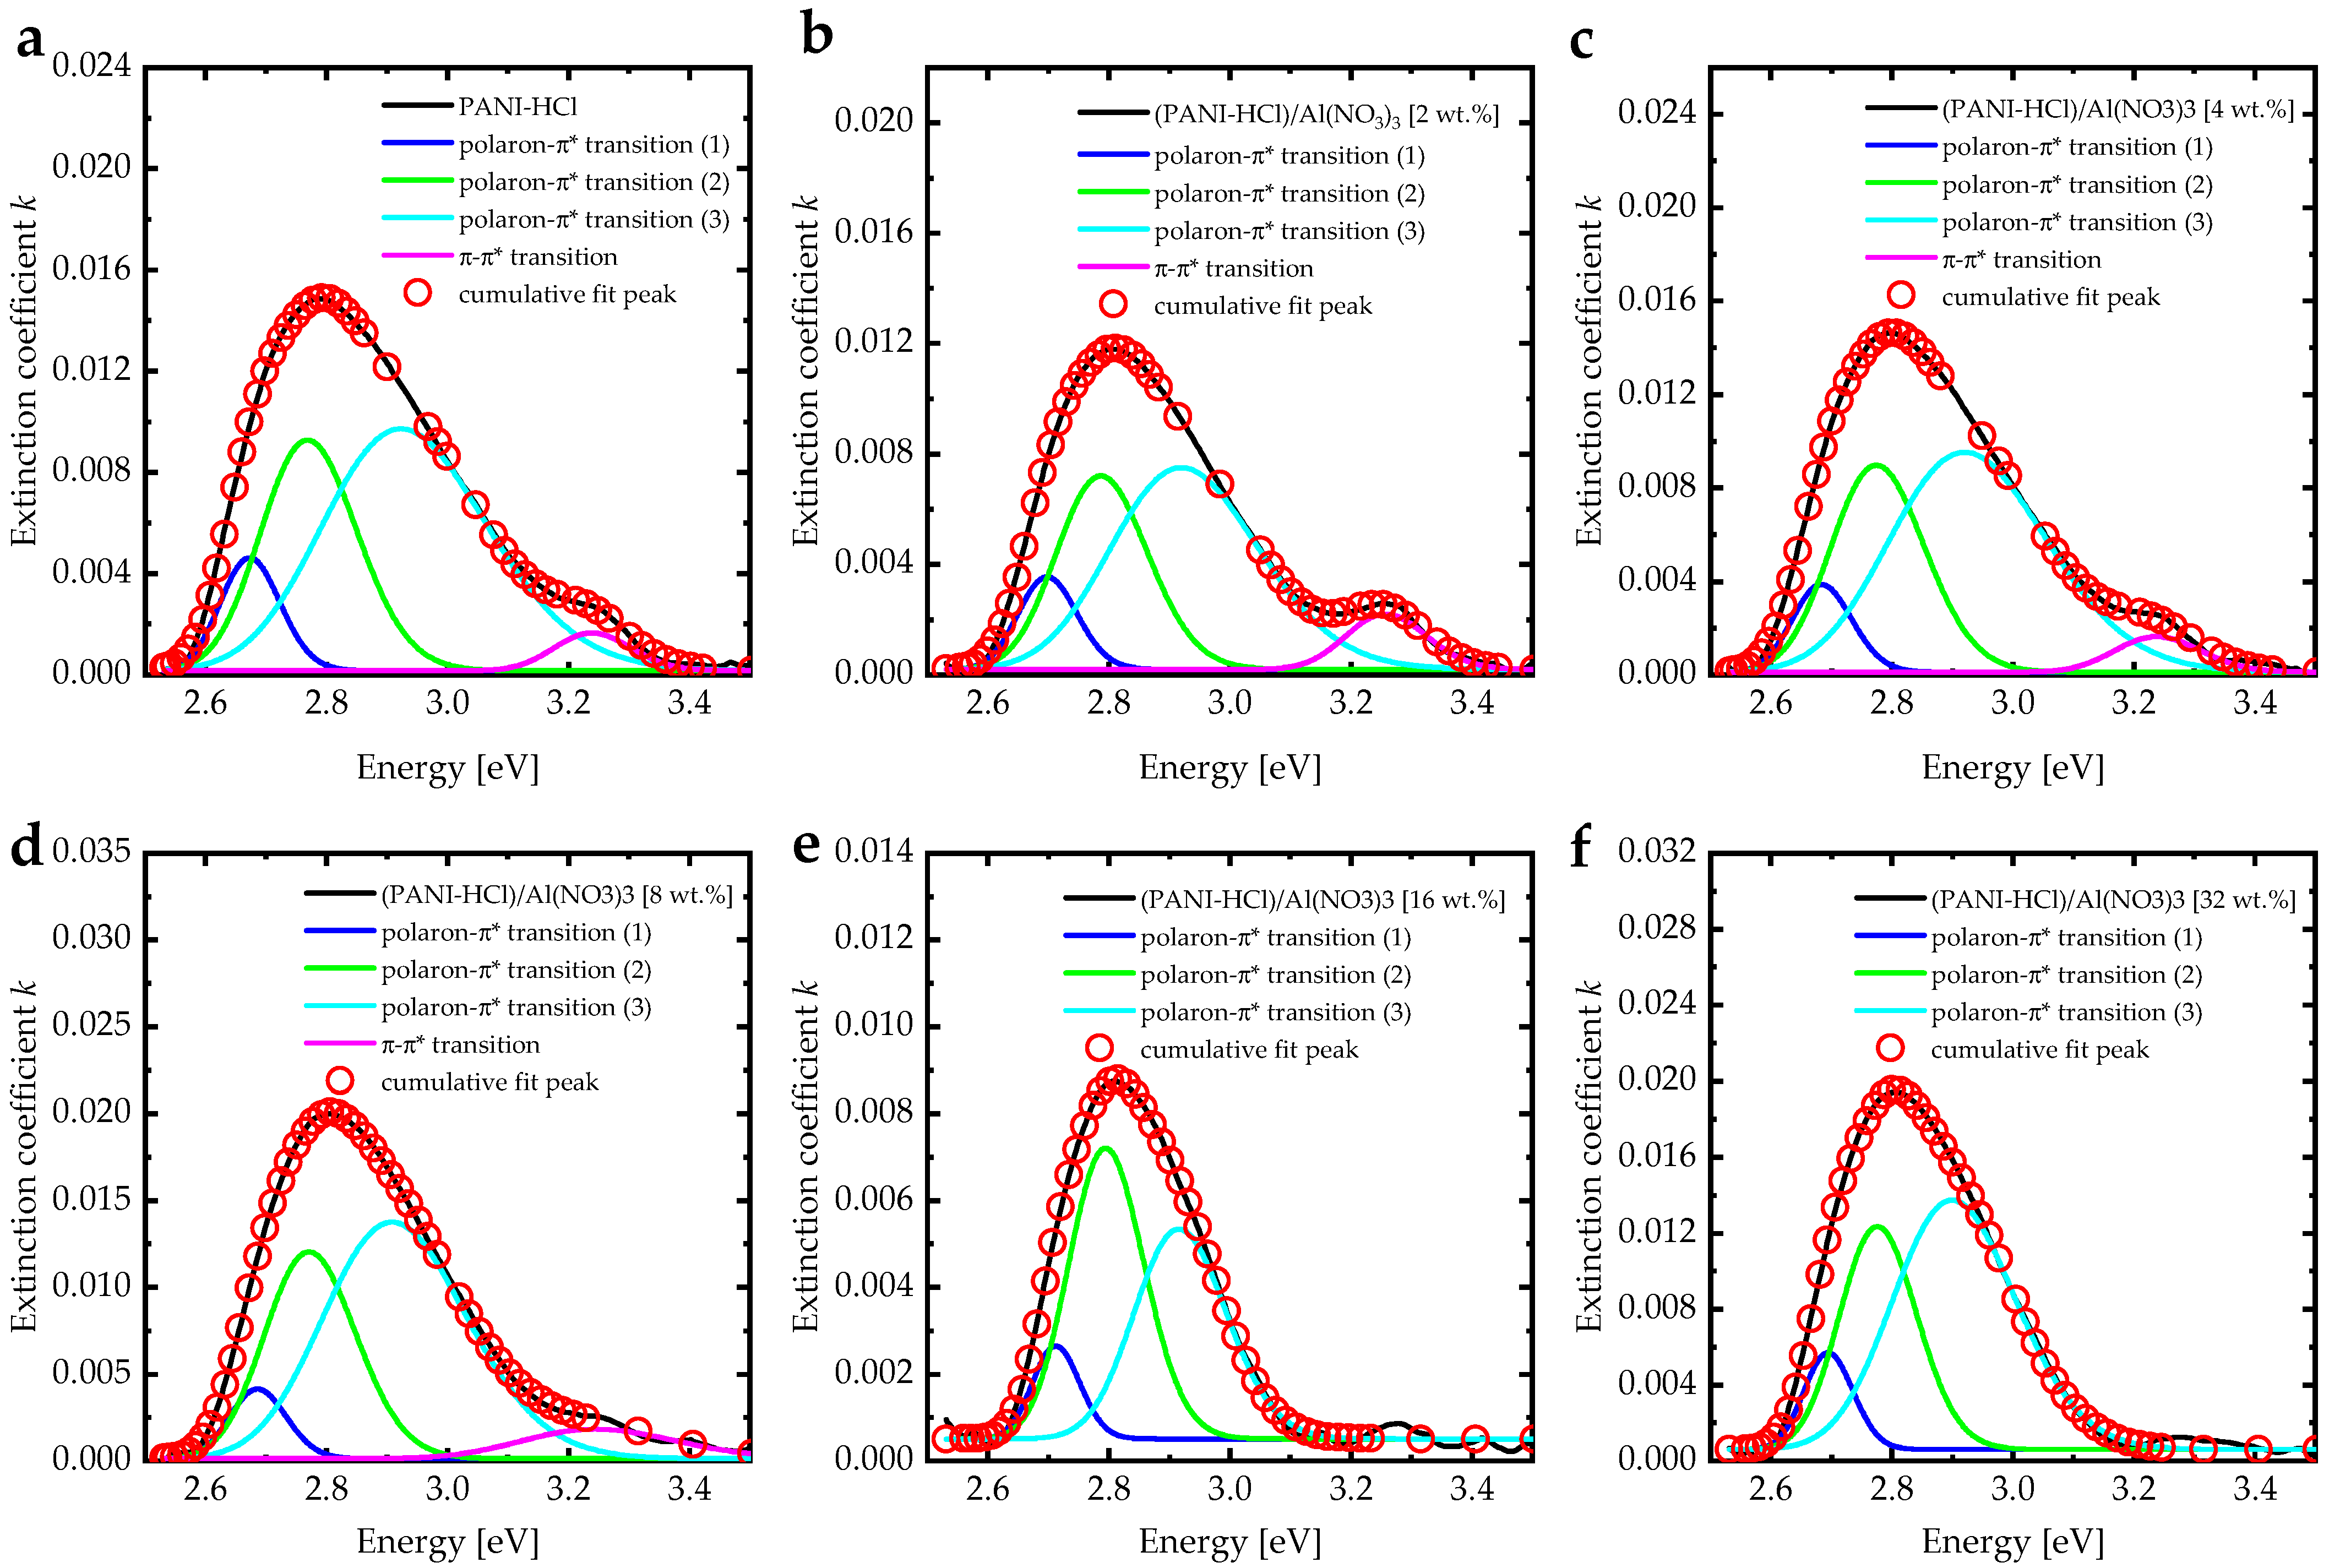
3.2. Optical Characterizations
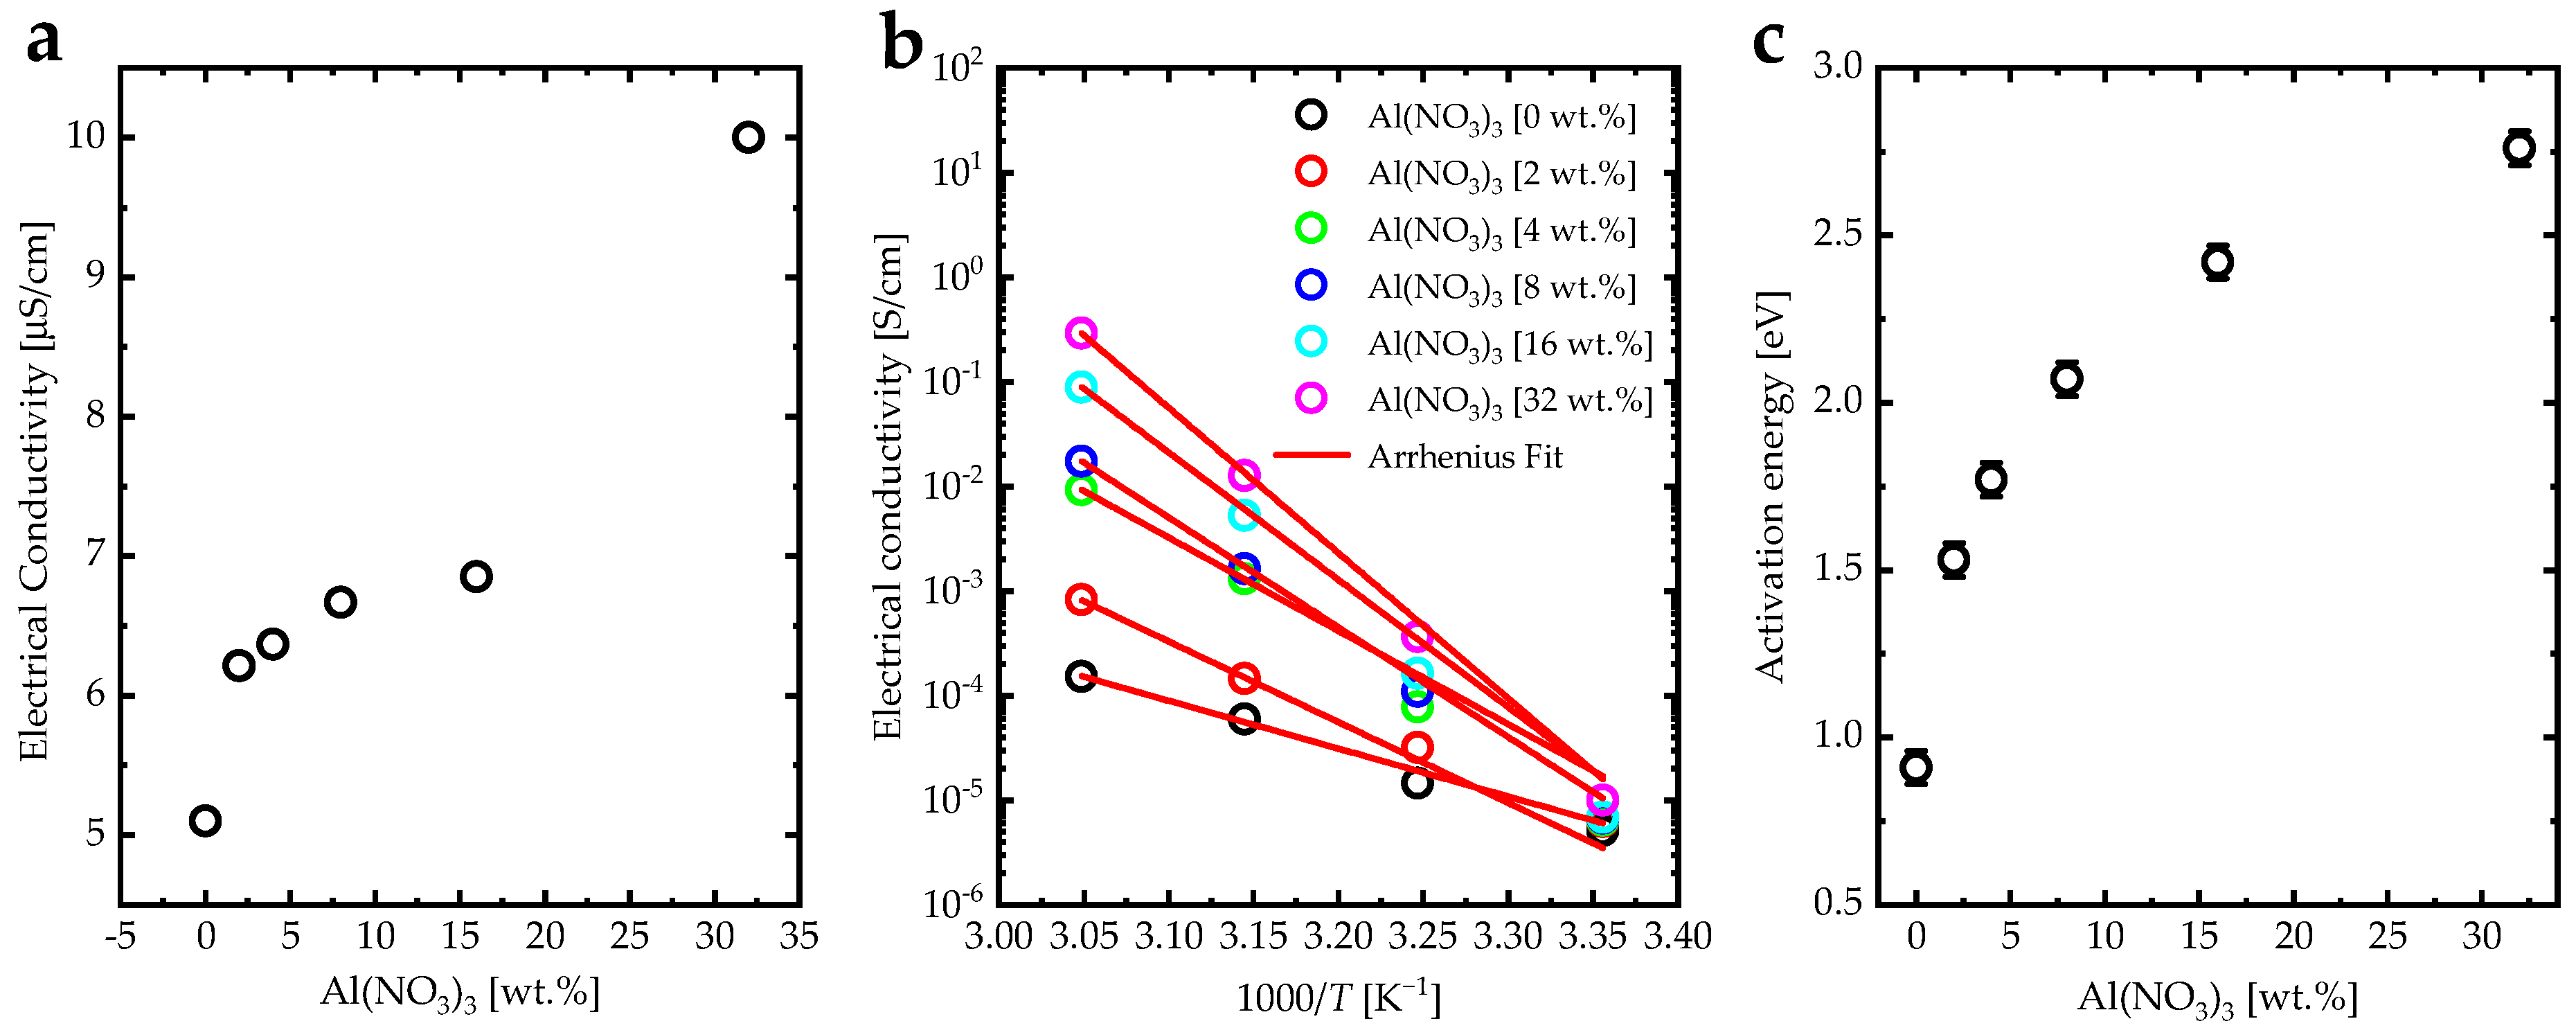
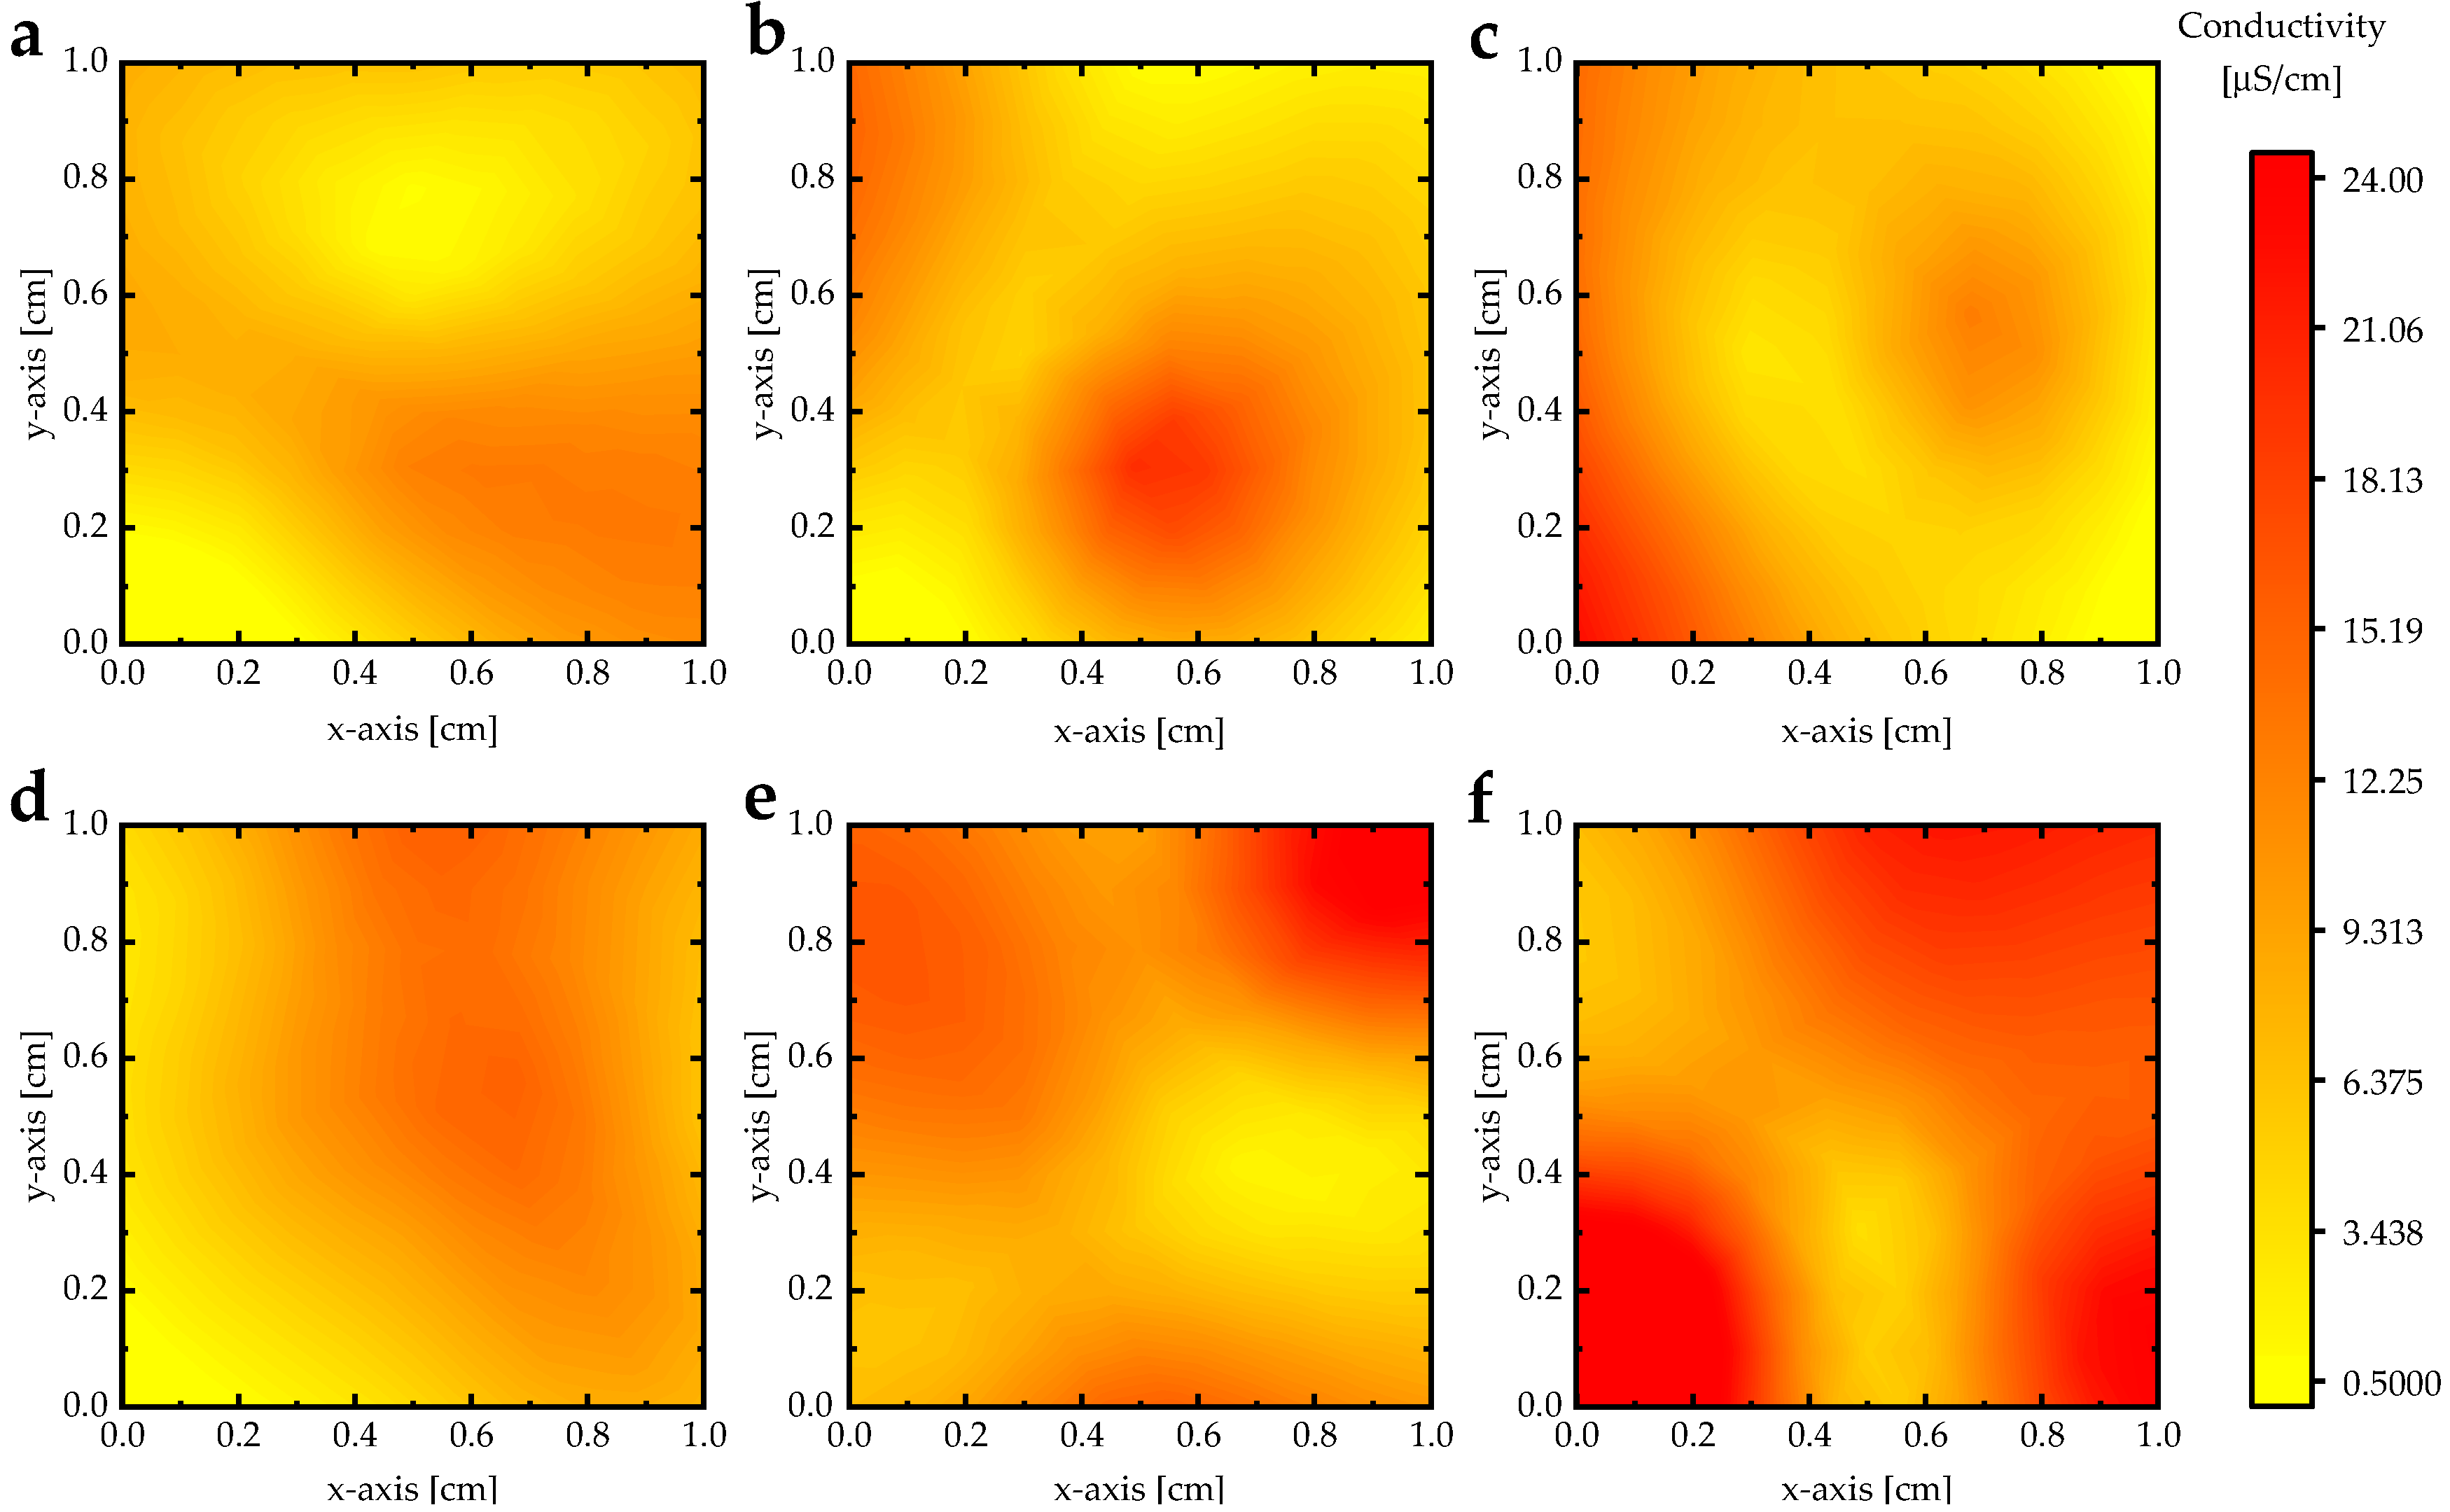
3.3. Electrical Conductivity
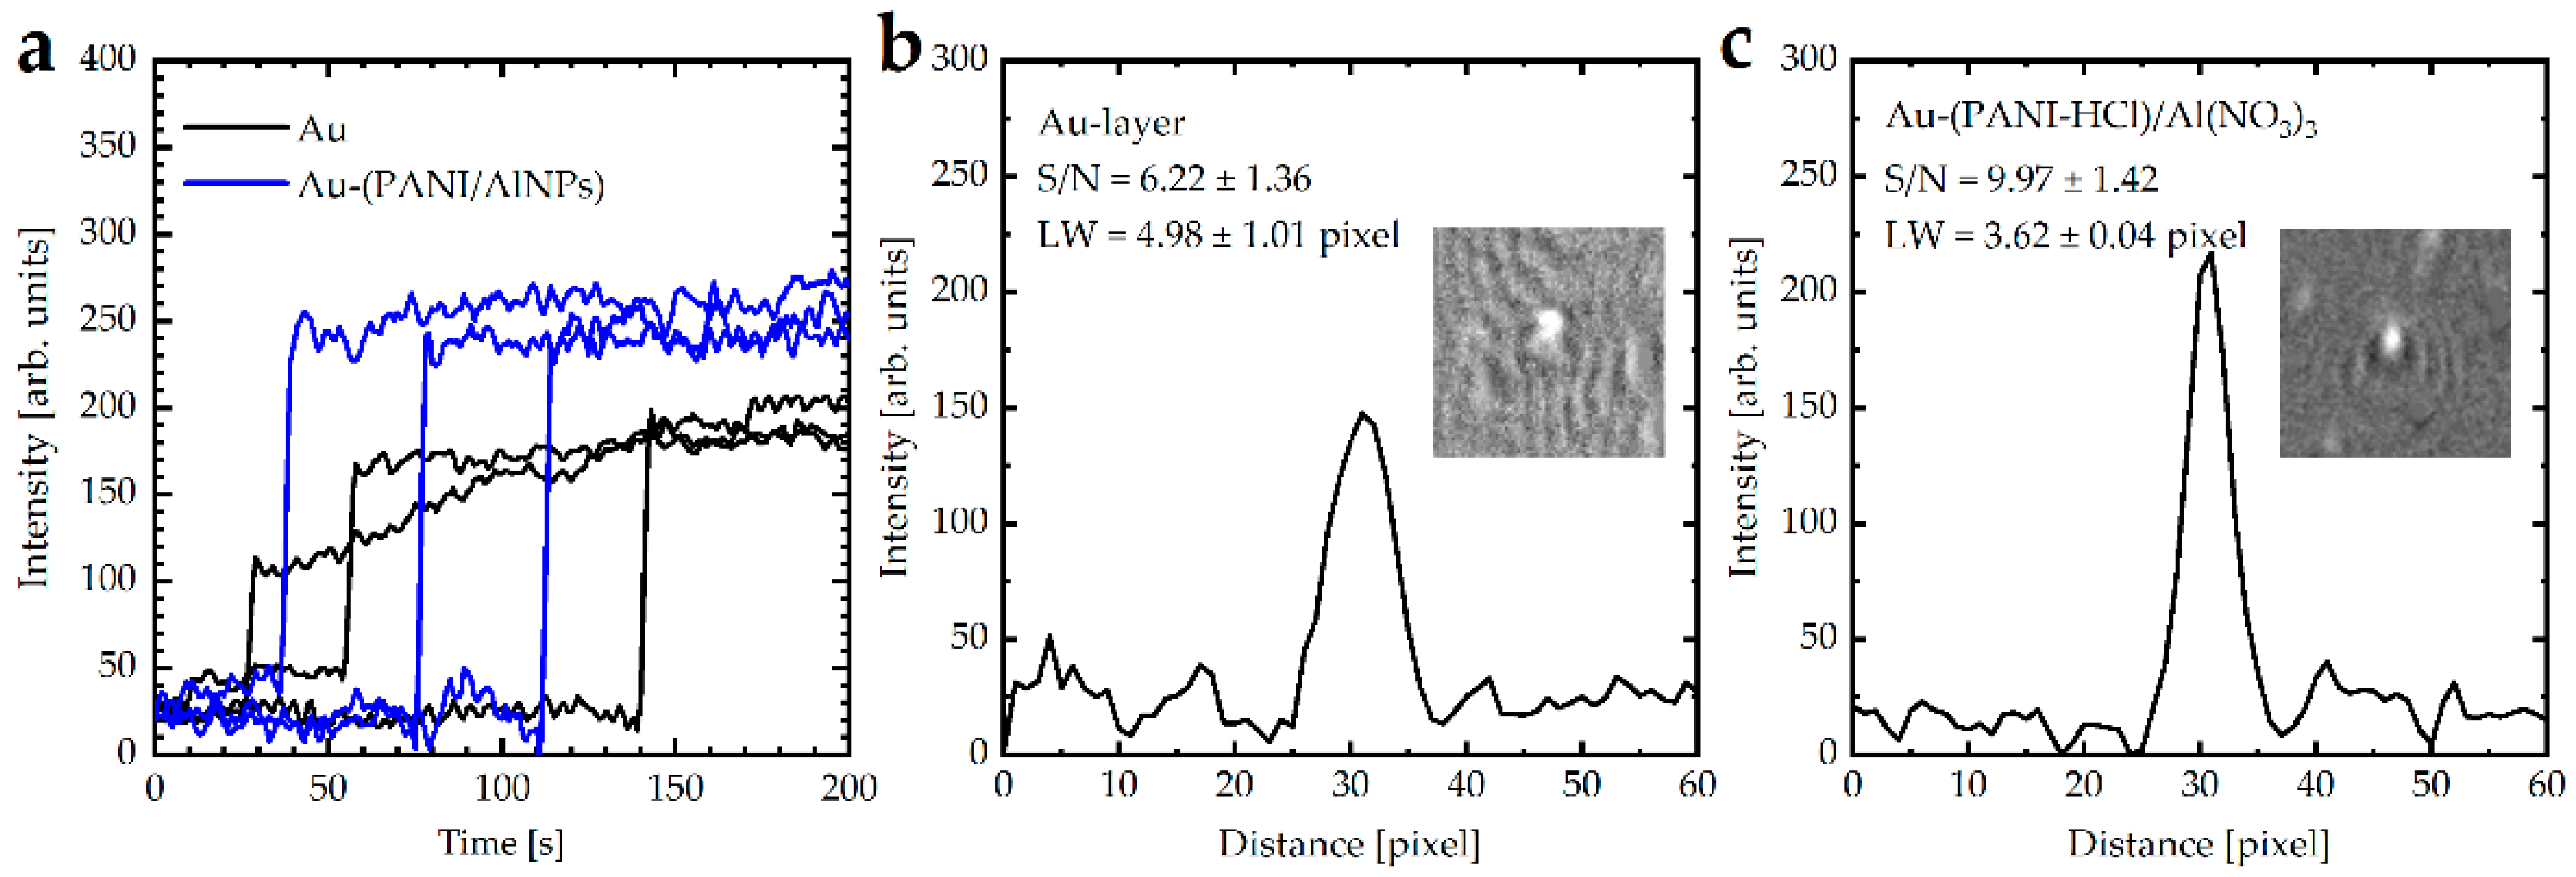
3.4. Surface Plasmon Resonance (SPR) Measurements
4. Conclusions
Author Contributions
Funding
Institutional Review Board Statement
Informed Consent Statement
Data Availability Statement
Acknowledgments
Conflicts of Interest
References
- Santos, J.L.; Farahi, F. Handbook of Optical Sensors; CRC Press: Boca Raton, FL, USA, 2014. [Google Scholar]
- Masson, J.-F. Surface plasmon resonance clinical biosensors for medical diagnostics. ACS Sens. 2017, 2, 16–30. [Google Scholar] [CrossRef] [PubMed]
- Shpacovitch, V.; Hergenröder, R. Surface plasmon resonance (SPR)-based biosensors as instruments with high versatility and sensitivity. Sensors 2020, 20, 3010. [Google Scholar] [CrossRef] [PubMed]
- Nizamov, S.; Sazdovska, S.D.; Mirsky, V.M. A review of optical methods for ultrasensitive detection and characterization of nanoparticles in liquid media with a focus on the wide field surface plasmon microscopy. Anal. Chim. Acta 2022, 1204, 339633. [Google Scholar] [CrossRef] [PubMed]
- Sidorenko, I.; Nizamov, S.; Hergenröder, R.; Zybin, A.; Kuzmichev, A.; Kiwull, B.; Niessner, R.; Mirsky, V.M. Computer assisted detection and quantification of single adsorbing nanoparticles by differential surface plasmon microscopy. Mikrochim. Acta 2015, 183, 101–109. [Google Scholar] [CrossRef]
- Nizamov, S.; Scherbahn, V.; Mirsky, V.M. Detection and quantification of single engineered nanoparticles in complex samples using template matching in wide-field surface plasmon microscopy. Anal. Chem. 2016, 88, 10206–10214. [Google Scholar] [CrossRef] [Green Version]
- Shpacovitch, V.; Sidorenko, I.; Lenssen, J.E.; Temchura, V.; Weichert, F.; Müller, H.; Überla, K.; Zybin, A.; Schramm, A.; Hergenröder, R. Application of the pamono-sensor for quantification of microvesicles and determination of nano-particle size distribution. Sensors 2017, 17, 244. [Google Scholar] [CrossRef] [Green Version]
- Zybin, A.; Shpacovitch, V.; Skolnik, J.; Hergenröder, R. Optimal conditions for SPR-imaging of nano-objects. Sens. Actuators B Chem. 2017, 239, 338–342. [Google Scholar] [CrossRef]
- Rouf, H.K.; Haque, T. Performance enhancement of Ag-Au bimetallic surface plasmon resonance biosensor using INP. Prog. Electromagn. Res. M 2018, 76, 31–42. [Google Scholar] [CrossRef] [Green Version]
- Kretschm, E. Determination of optical constants of metals by excitation of surface plasmons. Z. Fur Phys. 1971, 241, 313. [Google Scholar]
- Li, Q.; Wang, Q.; Yang, X.; Wang, K.; Zhang, H.; Nie, W. High sensitivity surface plasmon resonance biosensor for detection of microRNA and small molecule based on graphene oxide-gold nanoparticles composites. Talanta 2017, 174, 521–526. [Google Scholar] [CrossRef]
- Amendola, V.; Pilot, R.; Frasconi, M.; Maragò, O.M.; Iatì, M.A. Surface plasmon resonance in gold nanoparticles: A review. J. Phys. Condens. Matter 2017, 29, 203002. [Google Scholar] [CrossRef] [PubMed]
- Du, W.; Zhao, F. Silicon carbide based surface plasmon resonance waveguide sensor with a bimetallic layer for improved sensitivity. Mater. Lett. 2017, 186, 224–226. [Google Scholar] [CrossRef]
- Kim, S.H.; Kim, T.U.; Jung, H.Y.; Ki, H.C.; Kim, D.G.; Lee, B.-T. The effect of Au/Ag bimetallic thin-films on surface plasmon resonance properties comparing with those of Au and Ag single thin-films. J. Nanosci. Nano-Technol. 2018, 18, 1777–1781. [Google Scholar] [CrossRef] [PubMed]
- Menegazzo, N.; Herbert, B.; Banerji, S.; Booksh, K.S. Discourse on the utilization of polyaniline coatings for surface plasmon resonance sensing of ammonia vapor. Talanta 2011, 85, 1369–1375. [Google Scholar] [CrossRef]
- Yılmaz, E.; Özgür, E.; Bereli, N.; Türkmen, D.; Denizli, A. Plastic antibody based surface plasmon resonance nanosensors for selective atrazine detection. Mater. Sci. Eng. C 2017, 73, 603–610. [Google Scholar] [CrossRef]
- Park, G.; Kim, H.-O.; Lim, J.-W.; Park, C.; Yeom, M.; Song, D.; Haam, S. Rapid detection of influenza A (H1N1) virus by conductive polymer-based nanoparticle via optical response to virus-specific binding. Nano Res. 2021, 15, 2254–2262. [Google Scholar] [CrossRef]
- Omar, N.A.S.; Fen, Y.W.; Abdullah, J.; Kamil, Y.M.; Daniyal, W.M.E.M.M.; Sadrolhosseini, A.R.; Mahdi, M.A. Sensitive detection of dengue virus type 2 e-proteins signals using self-assembled monolayers/reduced graphene oxide-pamam dendrimer thin film-SPR optical sensor. Sci. Rep. 2020, 10, 1–15. [Google Scholar] [CrossRef] [Green Version]
- Agarwal, A.; Vitiello, M.S.; Viti, L.; Cupolillo, A.; Politano, A. Plasmonics with two-dimensional semiconductors: From basic research to technological applications. Nanoscale 2018, 10, 8938–8946. [Google Scholar] [CrossRef] [Green Version]
- Politano, A.; Viti, L.; Vitiello, M.S. Optoelectronic devices, plasmonics, and photonics with topological insulators. APL Mater. 2017, 5, 35504. [Google Scholar] [CrossRef] [Green Version]
- Usman, F.; Dennis, J.O.; Seong, K.C.; Ahmed, A.Y.; Ferrell, T.L.; Fen, Y.W.; Sadrolhosseini, A.R.; Ayodele, O.B.; Meriaudeau, F.; Saidu, A. Enhanced sensitivity of surface plasmon resonance biosensor functionalized with doped polyaniline composites for the detection of low-concentration acetone vapour. J. Sensors 2019, 2019, 1–13. [Google Scholar] [CrossRef] [Green Version]
- Ahmad, A.A.; Bani-Salameh, A.A.; Al-Bataineh, Q.M.; Jum’h, I.; Telfah, A.D. Optical, structural and morphological properties of synthesized PANI-CSA-PEO-based GaN nanocomposite films for optoelectronic applications. Polym. Bull. 2022, 1–20. [Google Scholar] [CrossRef]
- Aksimentyeva, O.I.; Savchyn, V.P.; Dyakonov, V.P.; Piechota, S.; Horbenko, Y.Y.; Opainych, I.Y.; Demchenko, P.Y.; Popov, A.; Szymczak, H. Modification of polymer-magnetic nanoparticles by luminescent and conducting substances. Mol. Cryst. Liq. Cryst. 2014, 590, 35–42. [Google Scholar] [CrossRef]
- Bayan, M.A.H.; Taromi, F.A.; Lanzi, M.; Pierini, F. Enhanced efficiency in hollow core electrospun nanofiber-based organic solar cells. Sci. Rep. 2021, 11, 1–11. [Google Scholar] [CrossRef]
- Chen, Y.; Su, L.; Jiang, M.; Fang, X. Switch type PANI/ZnO core-shell microwire heterojunction for UV photodetection. J. Mater. Sci. Technol. 2021, 105, 259–265. [Google Scholar] [CrossRef]
- Yang, M. Resistive room temperature DMA gas sensor based on the forest-like unusual n-type PANI/TiO2 nano-composites. Sens. Actuators B Chem. 2021, 342, 130067. [Google Scholar] [CrossRef]
- Botewad, S.; Pahurkar, V.; Muley, G. Fabrication and evaluation of evanescent wave absorption based polyaniline-cladding modified fiber optic urea biosensor. Opt. Fiber Technol. 2018, 40, 8–12. [Google Scholar] [CrossRef]
- Ramos, K.C.; Nishiyama, K.; Maeki, M.; Ishida, A.; Tani, H.; Kasama, T.; Baba, Y.; Tokeshi, M. Rapid, sensitive, and selective detection of h5 hemagglutinin from avian influenza virus using an immunowall device. ACS Omega 2019, 4, 16683–16688. [Google Scholar] [CrossRef] [Green Version]
- Maddali, H.; Miles, C.E.; Kohn, J.; O’Carroll, D.M. Optical biosensors for virus detection: Prospects for SARS-CoV-2/COVID-19. ChemBioChem 2021, 22, 1176–1189. [Google Scholar] [CrossRef]
- Kulkarni, M.V.; Viswanath, A.K.; Marimuthu, R.; Seth, T. Spectroscopic, transport, and morphological studies of polyaniline doped with inorganic acids. Polym. Eng. Sci. 2004, 44, 1676–1681. [Google Scholar] [CrossRef]
- Işik, C.; Arabaci, G.; Doğaç, Y.I.; Deveci, İ.; Teke, M. Synthesis and characterization of electrospun PVA/Zn2+ metal composite nanofibers for lipase immobilization with effective thermal, pH stabilities and reusability. Mater. Sci. Eng. C 2019, 99, 1226–1235. [Google Scholar] [CrossRef]
- Migdadi, A.B.; Ahmad, A.A.; Alsaad, A.M.; Al-Bataineh, Q.M.; Telfah, A. Electrical and thermal characterizations of synthesized composite films based on polyethylene oxide (PEO) doped by aluminium chloride (AlCl3). Polym. Bull. 2022, 1–14. [Google Scholar] [CrossRef]
- Sarkar, R.; Kundu, T.K. Hydrogen bond interactions of hydrated aluminum nitrate with PVDF, PVDF-TrFE, and PVDF-HFP: A density functional theory-based illustration. Int. J. Quantum Chem. 2020, 120, e26328. [Google Scholar] [CrossRef]
- Patnaik, P. Handbook of Inorganic Chemicals; McGraw-Hill: New York, NY, USA, 2003. [Google Scholar]
- Chamroukhi, H. Optical and structural properties enhancement of hybrid nanocomposites thin films based on polyaniline doped with Zinc Oxide embedded in bimodal mesoporous silica (ZnO@ SiOX) nanoparticles. Opt. Mater. 2018, 84, 703–713. [Google Scholar] [CrossRef]
- Gurevich, E.; Temchura, V.; Überla, K.; Zybin, A. Analytical features of particle counting sensor based on plasmon assisted microscopy of nano objects. Sens. Actuators B Chem. 2011, 160, 1210–1215. [Google Scholar] [CrossRef]
- Schnorrenberg, H.-J.; Hengstebeck, M.; Schlinkmeier, K. The attenuation of a coherent field by scattering. Opt. Commun. 1995, 117, 532–540. [Google Scholar] [CrossRef]
- Li, J.; Tang, X.; Li, H.; Yan, Y.; Zhang, Q. Synthesis and thermoelectric properties of hydrochloric acid-doped polyaniline. Synth. Met. 2010, 160, 1153–1158. [Google Scholar] [CrossRef]
- Daikh, S.; Zeggai, F.; Bellil, A.; Benyoucef, A. Chemical polymerization, characterization and electrochemical studies of PANI/ZnO doped with hydrochloric acid and/or zinc chloride: Differences between the synthesized nanocomposites. J. Phys. Chem. Solids 2018, 121, 78–84. [Google Scholar] [CrossRef]
- Thapa, R.; Saha, B.; Goswami, S.; Chattopadhyay, K.K. Study of field emission and dielectric properties of AlN films prepared by DC sputtering technique at different substrate temperatures. Indian J. Phys. 2010, 84, 1347–1354. [Google Scholar] [CrossRef]
- Vivekanandan, J.; Ponnusamy, V.; Mahudeswaran, A.; Vijayanand, P. Synthesis, characterization and conductivity study of polyaniline prepared by chemical oxidative and electrochemical methods. Arch. Appl. Sci. Res. 2011, 3, 147–153. [Google Scholar]
- Mazzeu, M.A.C.; Faria, L.K.; Cardoso, A.D.M.; Gama, A.M.; Baldan, M.R.; Gonçalves, E.S. Structural and morphological characteristics of polyaniline synthesized in pilot scale. J. Aerosp. Technol. Manag. 2017, 9, 39–47. [Google Scholar] [CrossRef]
- Diggikar, R.S.; Deshmukh, S.; Thopate, T.S.; Kshirsagar, S.R. Performance of polyaniline nanofibers (PANI NFs) as PANI NFs-silver (Ag) nanocomposites (NCs) for energy storage and antibacterial applications. ACS Omega 2019, 4, 5741–5749. [Google Scholar] [CrossRef]
- Bhadra, S.; Khastgir, D. Determination of crystal structure of polyaniline and substituted polyanilines through powder X-ray diffraction analysis. Polym. Test. 2008, 27, 851–857. [Google Scholar] [CrossRef]
- Waikar, M.R.; Shaikh, A.A.; Sonkawade, R.G. Paninfs synthesized electrochemically as an electrode material for energy storage application. Polym. Bull. 2018, 76, 4703–4718. [Google Scholar] [CrossRef]
- Jum’h, I.; Mousa, M.S.; Mhawish, M.; Sbeih, S.; Telfah, A. Optical and structural properties of (PANI-CSA-PMMA)/NiNPs nanocomposites thin films for organic optical filters. J. Appl. Polym. Sci. 2020, 137, 48643. [Google Scholar] [CrossRef]
- Alsaad, A.; Al-Bataineh, Q.M.; Ahmad, A.; Albataineh, Z.; Telfah, A. Optical band gap and refractive index dispersion parameters of boron-doped ZnO thin films: A novel derived mathematical model from the experimental transmission spectra. Optik 2020, 211, 164641. [Google Scholar] [CrossRef]
- Gul, S.; Shah, A.-U.A.; Bilal, S. Synthesis and characterization of processable polyaniline salts. J. Physics: Conf. Ser. 2013, 439, 012002. [Google Scholar] [CrossRef] [Green Version]
- Abdiryim, T.; Xiao-Gang, Z.; Jamal, R. Comparative studies of solid-state synthesized polyaniline doped with inorganic acids. Mater. Chem. Phys. 2005, 90, 367–372. [Google Scholar] [CrossRef]
- Brik, M.; Srivastava, A.; Popov, A. A few common misconceptions in the interpretation of experimental spectroscopic data. Opt. Mater. 2022, 127, 112276. [Google Scholar] [CrossRef]
- Liland, K.H.; Almøy, T.; Mevik, B.-H. Optimal choice of baseline correction for multivariate calibration of spectra. Appl. Spectrosc. 2010, 64, 1007–1016. [Google Scholar] [CrossRef]
- Al-Gharram, M.; Jum’h, I.; Telfah, A.; Al-Hussein, M. Highly crystalline conductive electrodeposited films of PANI-CSA/CoFe2O4 nanocomposites. Colloids Surf. A Physicochem. Eng. Asp. 2021, 628, 127342. [Google Scholar] [CrossRef]
- Ahmad, A.A.; Khazaleh, M.H.; Alsaad, A.M.; Al-Bataineh, Q.M.; Telfah, A.D. Characterization of As-prepared PVA-PEO/ZnO-Al2O3-NPs hybrid nanocomposite thin films. Polym. Bull. 2022, 79, 9881–9905. [Google Scholar] [CrossRef]
- Atta, A.; Abdelhamied, M.M.; Abdelreheem, A.M.; Berber, M.R. Flexible methyl cellulose/polyaniline/silver composite films with enhanced linear and nonlinear optical properties. Polymers 2021, 13, 1225. [Google Scholar] [CrossRef] [PubMed]
- Al-Bataineh, Q.M.; Aljarrah, I.A.; Ahmad, A.A.; Alsaad, A.M.; Telfah, A. Investigation of the doping mechanism and electron transition bands of PEO/KMnO4 complex composite films. J. Mater. Sci. Mater. Electron. 2022, 33, 14051–14062. [Google Scholar] [CrossRef]
- Urbach, F. The long-wavelength edge of photographic sensitivity and of the electronic absorption of solids. Phys. Rev. 1953, 92, 1324. [Google Scholar] [CrossRef]
- Parmar, R.; Kundu, R.; Punia, R.; Aghamkar, P.; Kishore, N. Iron modified structural and optical spectral properties of bismuth silicate glasses. Phys. B Condens. Matter 2014, 450, 39–44. [Google Scholar] [CrossRef]
- Al-Bataineh, Q.M.; Telfah, M.; Abu-Zurayk, R.; Benchaabane, A.; Tavares, C.J.; Telfah, A. Nano-SnO2/polyaniline composite films for surface plasmon resonance. Mater. Chem. Phys. 2022, 293, 126816. [Google Scholar] [CrossRef]
- Asiri, A.M.; Lichtfouse, E. Nanophotocatalysis and Environmental Applications: Detoxification and Disinfection; Springer: Berlin/Heidelberg, Germany, 2019. [Google Scholar]
- Al-Akhras, M.; Alzoubi, S.E.; Ahmad, A.A.; Ababneh, R.; Telfah, A. Studies of composite films of polyethylene oxide doped with potassium hexachloroplatinate. J. Appl. Polym. Sci. 2020, 138, 49757. [Google Scholar] [CrossRef]
- Al-Bataineh, Q.M.; Ahmad, A.A.; Alsaad, A.M.; Migdadi, A.; Telfah, A. Correlation of electrical, thermal, and crystal parameters of complex composite films based on polyethylene oxide (PEO) doped by copper sulfate (CuSO4). Phys. B Condens. Matter 2022, 645, 414224. [Google Scholar] [CrossRef]
- Singh, S.; Singh, P.K.; Umar, A.; Lohia, P.; Albargi, H.; Castañeda, L.; Dwivedi, D.K. 2D nanomaterial-based surface plasmon resonance sensors for biosensing applications. Micromachines 2020, 11, 779. [Google Scholar] [CrossRef]
- Mukhtar, W.M.; Murat, N.F.; Samsuri, N.D.; Dasuki, K.A. Maximizing the response of SPR signal: A vital role of light excitation wavelength. AIP Conf. Proc. 2018, 2016, 020104. [Google Scholar] [CrossRef]
- Available online: http://www.res-tec.de/ (accessed on 12 October 2022).
- Rahman, M.; Abdulrazak, L.F.; Ahsan, M.; Based, A.; Rana, M.; Anower, S.; Rikta, K.A.; Haider, J.; Gurusamy, S. 2D nanomaterial-based hybrid structured (Au-WSe2-PtSe2-BP) surface plasmon resonance (SPR) sensor with improved performance. IEEE Access 2021, 10, 689–698. [Google Scholar] [CrossRef]
- Yakubovsky, D.I.; Arsenin, A.V.; Stebunov, Y.; Fedyanin, D.; Volkov, V.S. Optical constants and structural properties of thin gold films. Opt. Express 2017, 25, 25574–25587. [Google Scholar] [CrossRef] [PubMed]
- Rasband, W.S. ImageJ. (1997–2018). Available online: https://imagej.nih.gov/ij/ (accessed on 12 October 2022).
- Prabowo, B.A.; Purwidyantri, A.; Liu, K.-C. Surface plasmon resonance optical sensor: A review on light source technology. Biosensors 2018, 8, 80. [Google Scholar] [CrossRef] [PubMed]


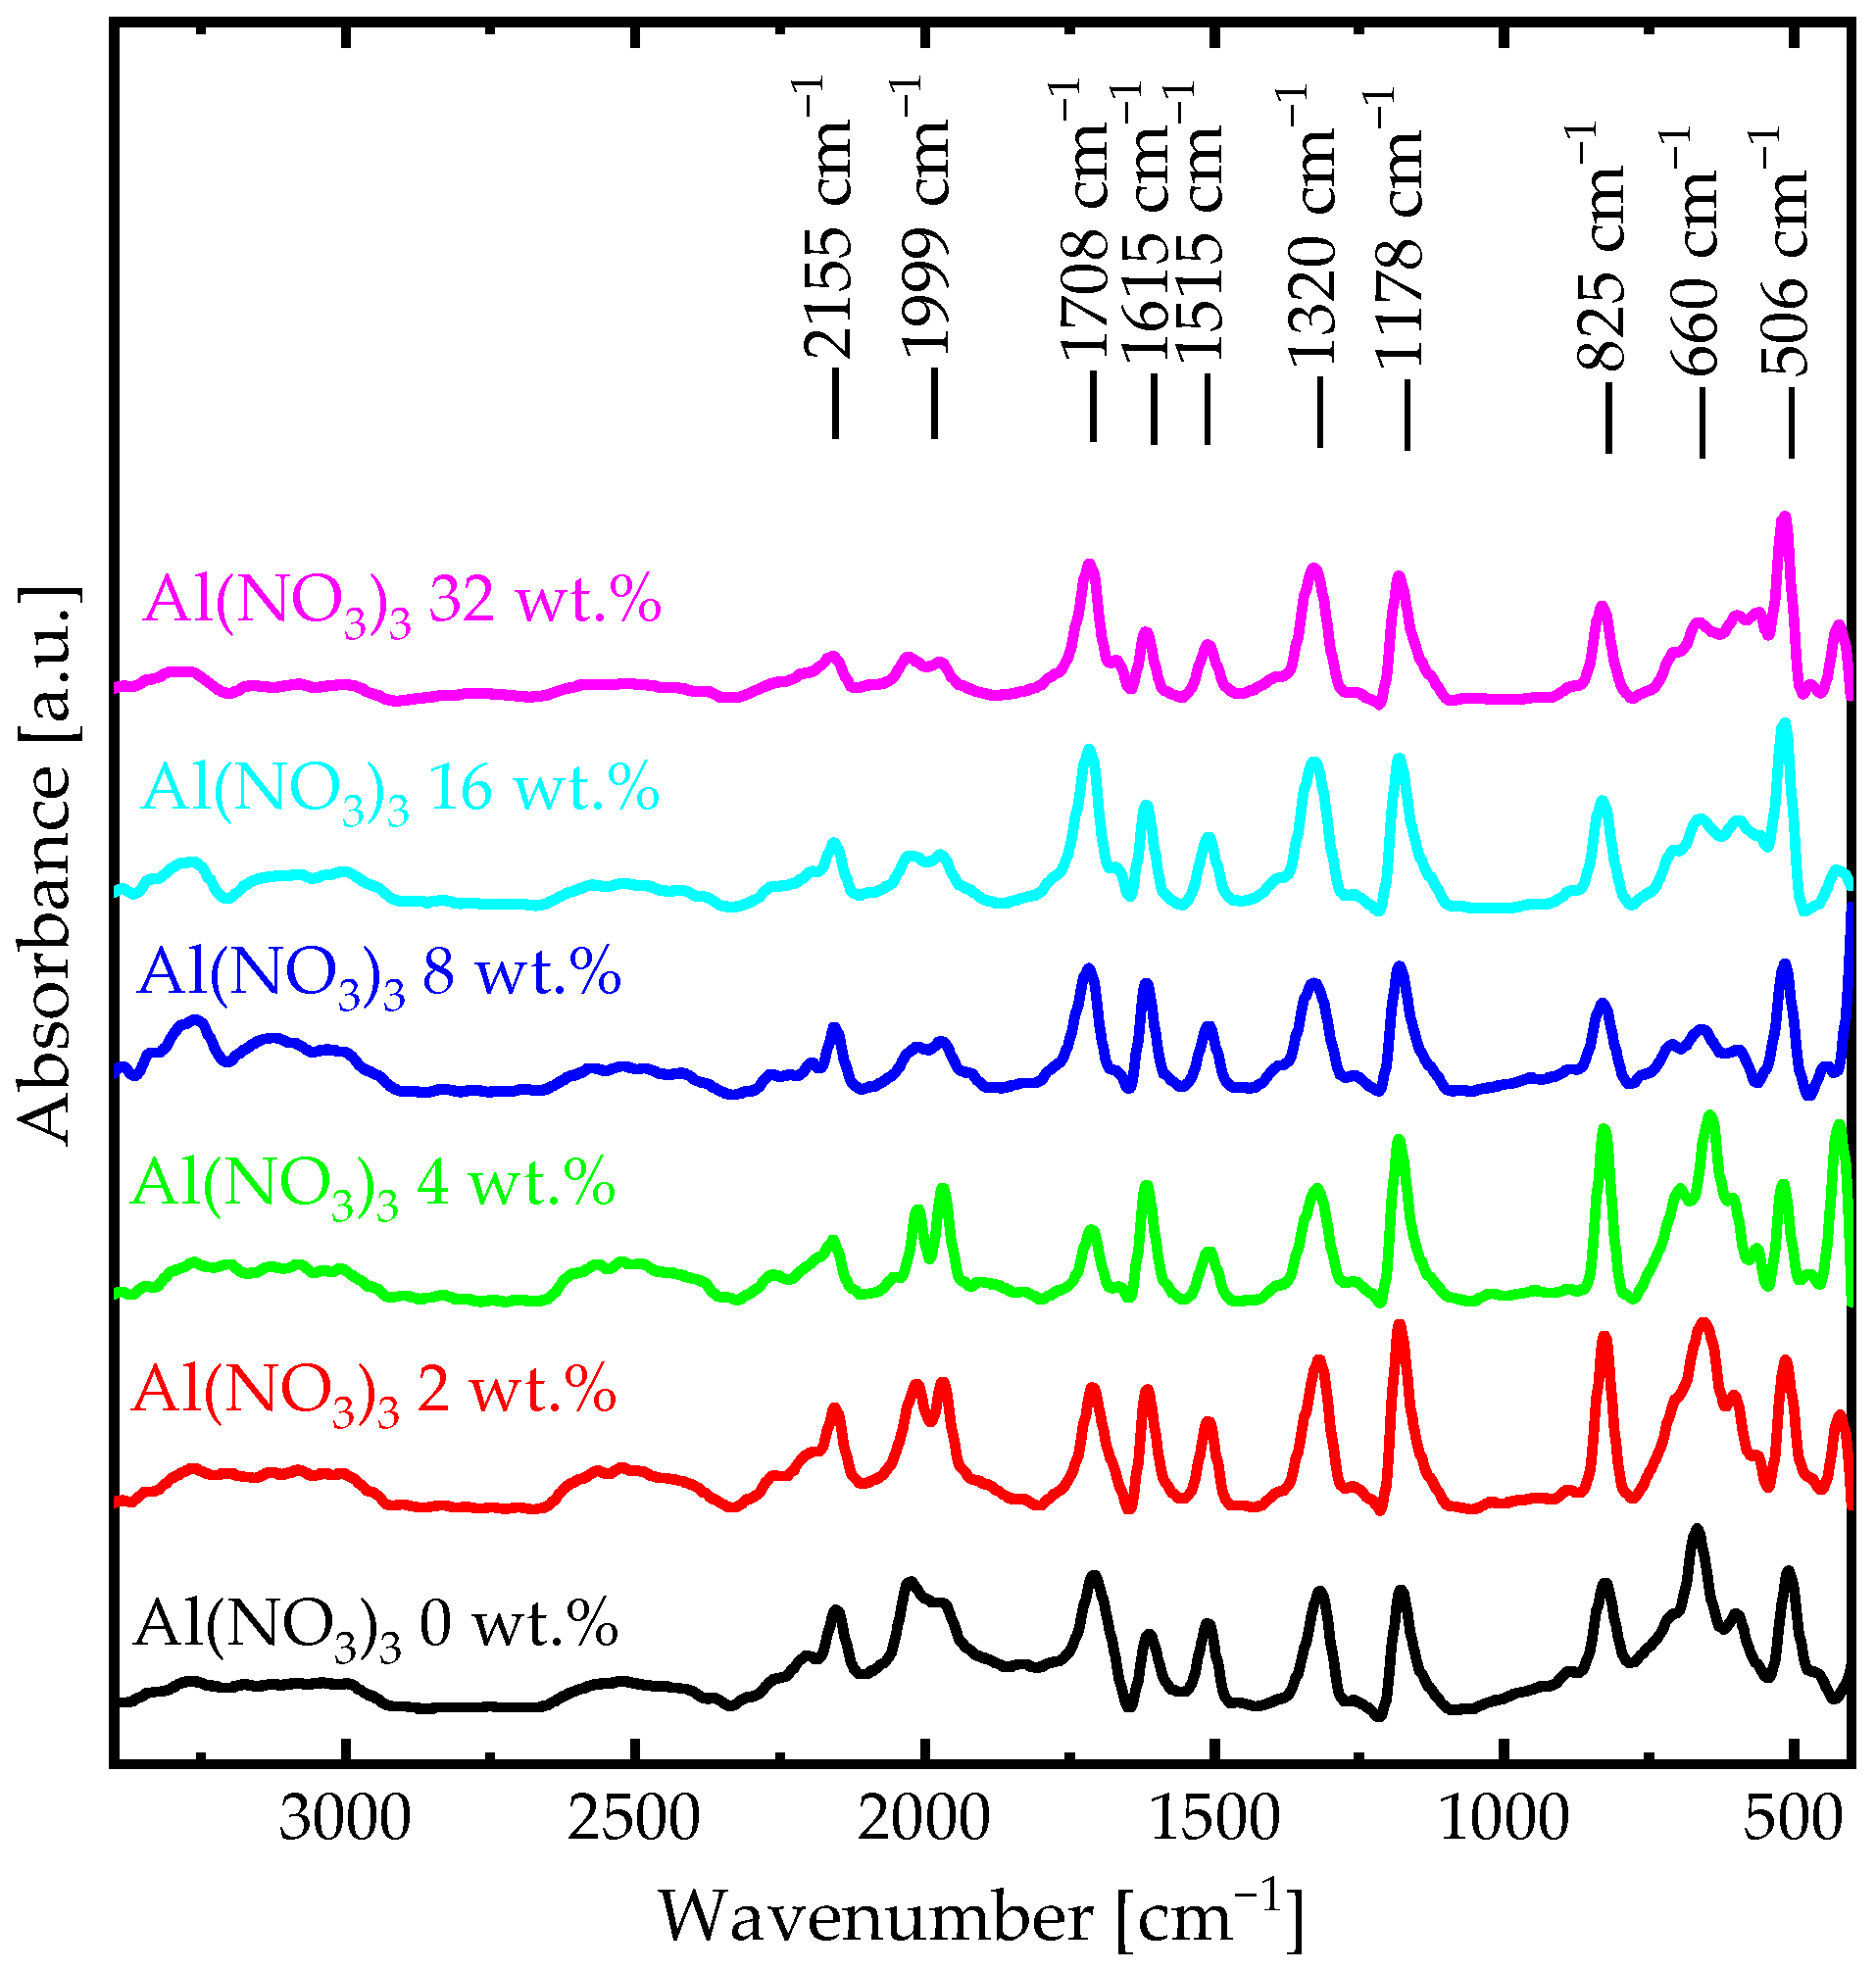
| Absorption Bands | Al(NO3)3 0 wt.% | Al(NO3)3 2 wt.% | Al(NO3)3 4 wt.% | Al(NO3)3 8 wt.% | Al(NO3)3 16 wt.% | Al(NO3)3 32 wt.% |
|---|---|---|---|---|---|---|
| out-of-plane bending | 506 | 510 | 515 | 517 | 519 | 521 |
| iminoquinone | 660 | 658 | 656 | 652 | 650 | 646 |
| paradisubstituted aromatic rings | 825 | 827 | 828 | 829 | 832 | 835 |
| in-plane bending vibrations | 1178 | 1178 | 1178 | 1184 | 1184 | 1184 |
| aromatic stretching | 1320 | 1320 | 1320 | 1329 | 1334 | 1334 |
| stretching ) | 1515 | 1514 | 1511 | 1511 | 1511 | 1511 |
| stretching ) | 1615 | 1615 | 1615 | 1615 | 1615 | 1615 |
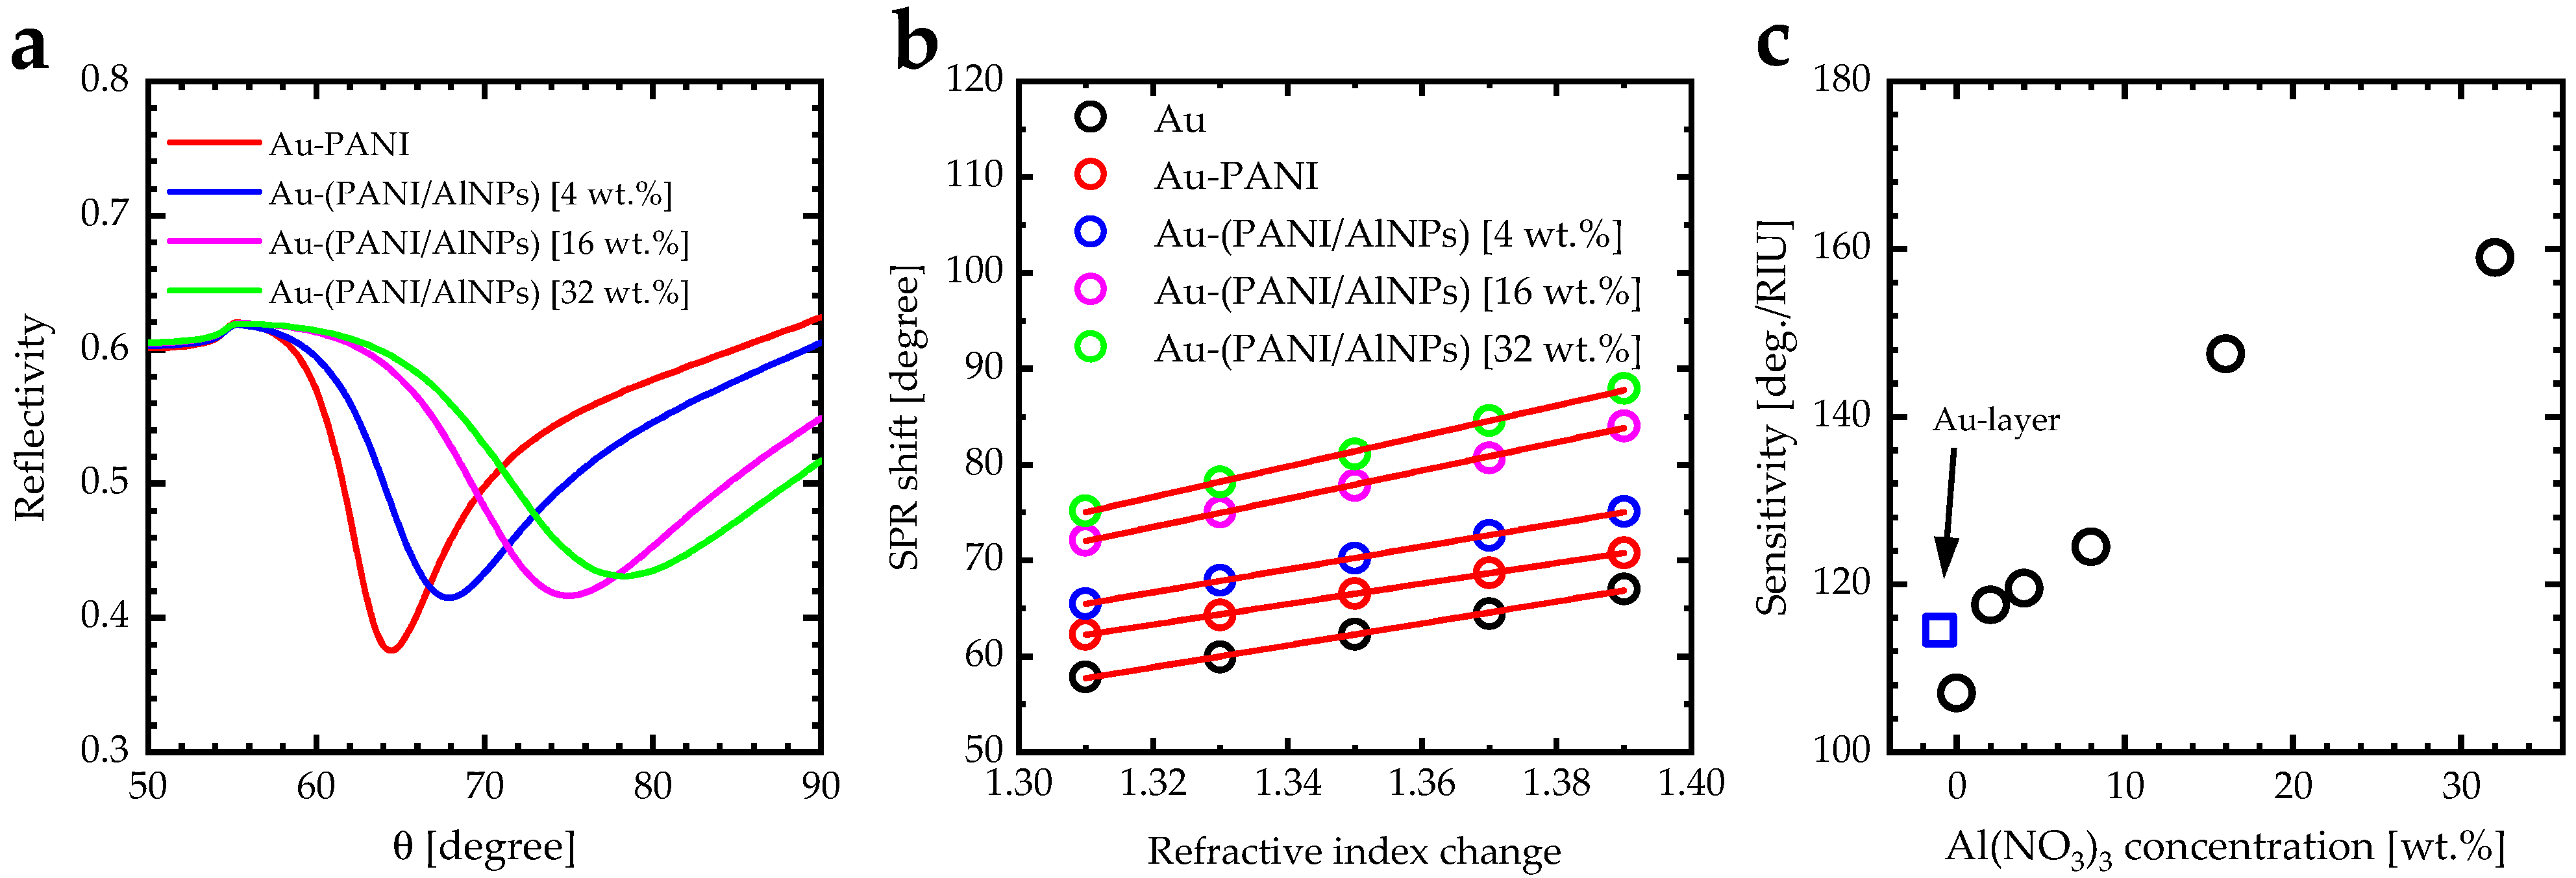
| Al(NO3)3 Concentration [wt.] | Refractive Index n | Extinction Coefficient k | SPR Angle [°] | SPR Sensitivity [deg/RIU] | Figure of Merit (FOM) [RIU−1] |
|---|---|---|---|---|---|
| Gold layer | 0.15 [66] | 4.91 [66] | 59.9 | 114.5 | 79.51 |
| 0 | 1.51 | 0.11 | 64.3 | 107.0 | 8.99 |
| 2 | 1.61 | 0.13 | 67.0 | 117.5 | 8.64 |
| 4 | 1.63 | 0.17 | 67.9 | 119.5 | 6.91 |
| 8 | 1.67 | 0.19 | 69.1 | 124.5 | 6.66 |
| 16 | 1.87 | 0.21 | 75.0 | 147.5 | 7.45 |
| 32 | 1.96 | 0.24 | 78.2 | 159.0 | 7.23 |
Publisher’s Note: MDPI stays neutral with regard to jurisdictional claims in published maps and institutional affiliations. |
© 2022 by the authors. Licensee MDPI, Basel, Switzerland. This article is an open access article distributed under the terms and conditions of the Creative Commons Attribution (CC BY) license (https://creativecommons.org/licenses/by/4.0/).
Share and Cite
Al-Bataineh, Q.M.; Shpacovitch, V.; Sadiq, D.; Telfah, A.; Hergenröder, R. Surface Plasmon Resonance Sensitivity Enhancement Based on Protonated Polyaniline Films Doped by Aluminum Nitrate. Biosensors 2022, 12, 1122. https://doi.org/10.3390/bios12121122
Al-Bataineh QM, Shpacovitch V, Sadiq D, Telfah A, Hergenröder R. Surface Plasmon Resonance Sensitivity Enhancement Based on Protonated Polyaniline Films Doped by Aluminum Nitrate. Biosensors. 2022; 12(12):1122. https://doi.org/10.3390/bios12121122
Chicago/Turabian StyleAl-Bataineh, Qais M., Victoria Shpacovitch, Diyar Sadiq, Ahmad Telfah, and Roland Hergenröder. 2022. "Surface Plasmon Resonance Sensitivity Enhancement Based on Protonated Polyaniline Films Doped by Aluminum Nitrate" Biosensors 12, no. 12: 1122. https://doi.org/10.3390/bios12121122
APA StyleAl-Bataineh, Q. M., Shpacovitch, V., Sadiq, D., Telfah, A., & Hergenröder, R. (2022). Surface Plasmon Resonance Sensitivity Enhancement Based on Protonated Polyaniline Films Doped by Aluminum Nitrate. Biosensors, 12(12), 1122. https://doi.org/10.3390/bios12121122