SnO2QDs Deposited on GO/PPy-Modified Glassy Carbon Electrode for Efficient Electrochemical Hydrogen Peroxide Sensor


Abstract
1. Introduction
2. Materials and Methods
2.1. Chemical Reagents
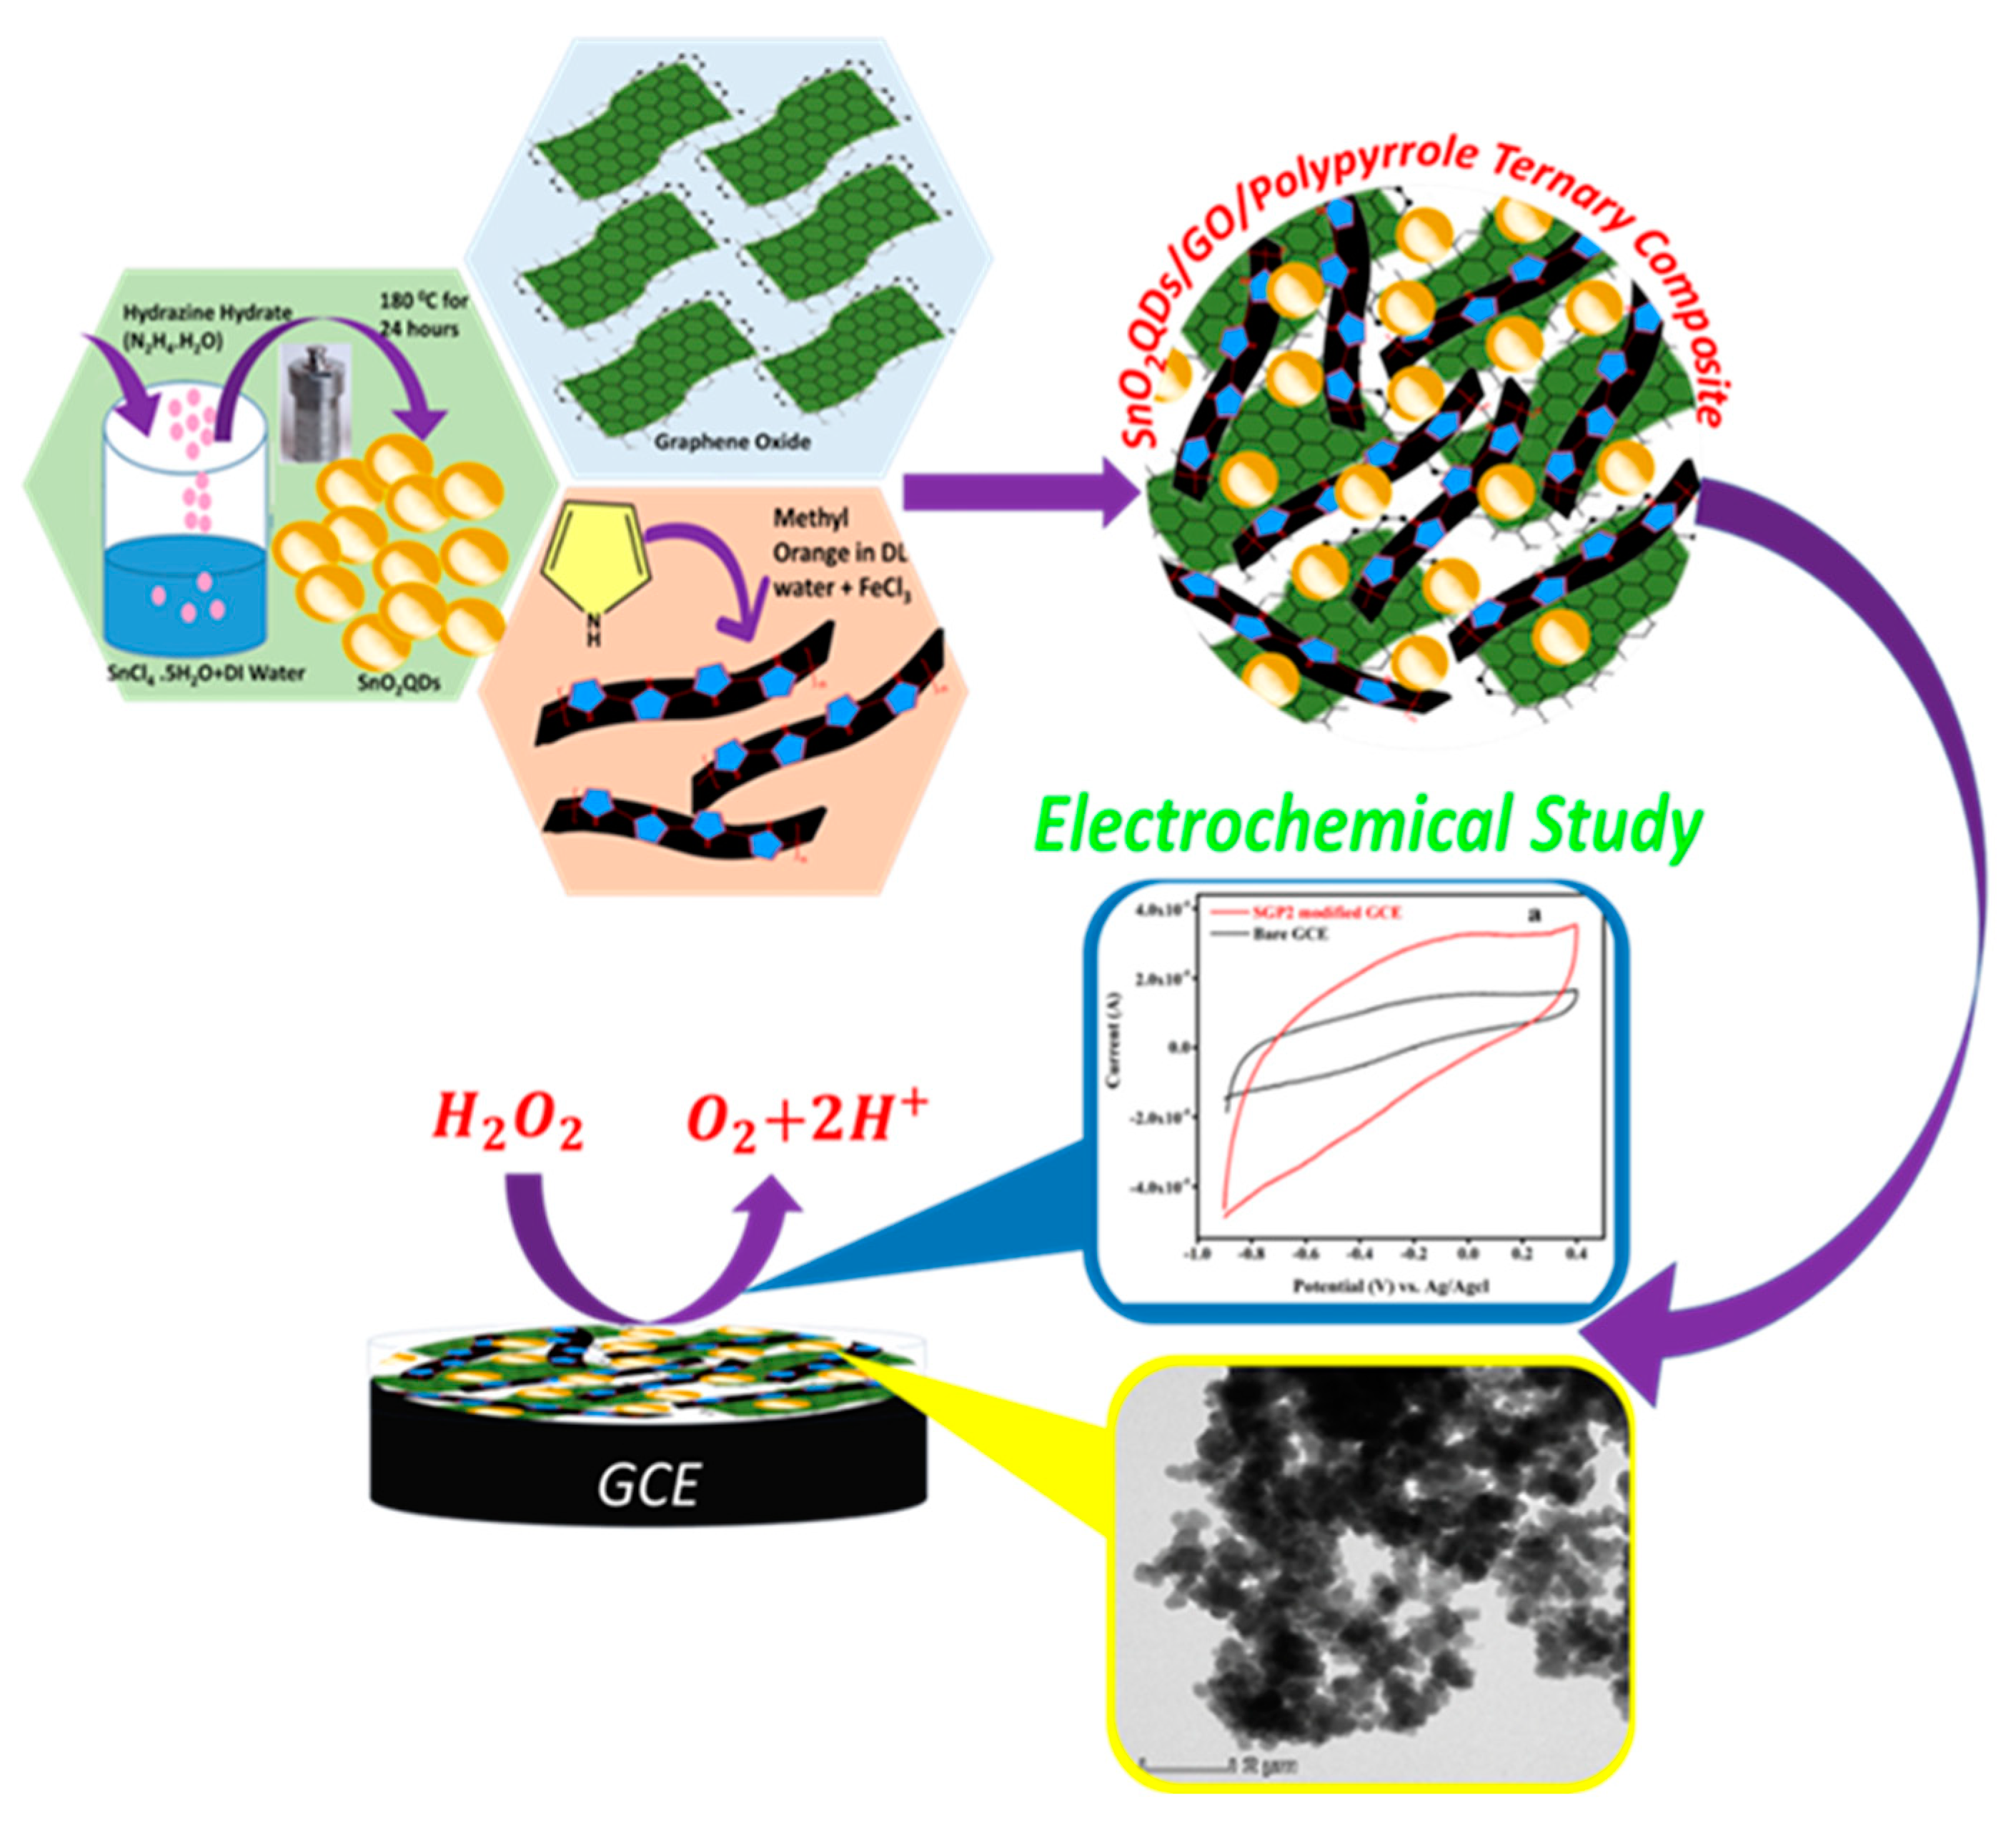
2.2. Synthesis of SnO2 Quantum Dots
2.3. Synthesis of Graphene Oxide
2.4. Synthesis of SGP2 Ternary Composite
3. Characterization Techniques
4. Results and Discussion
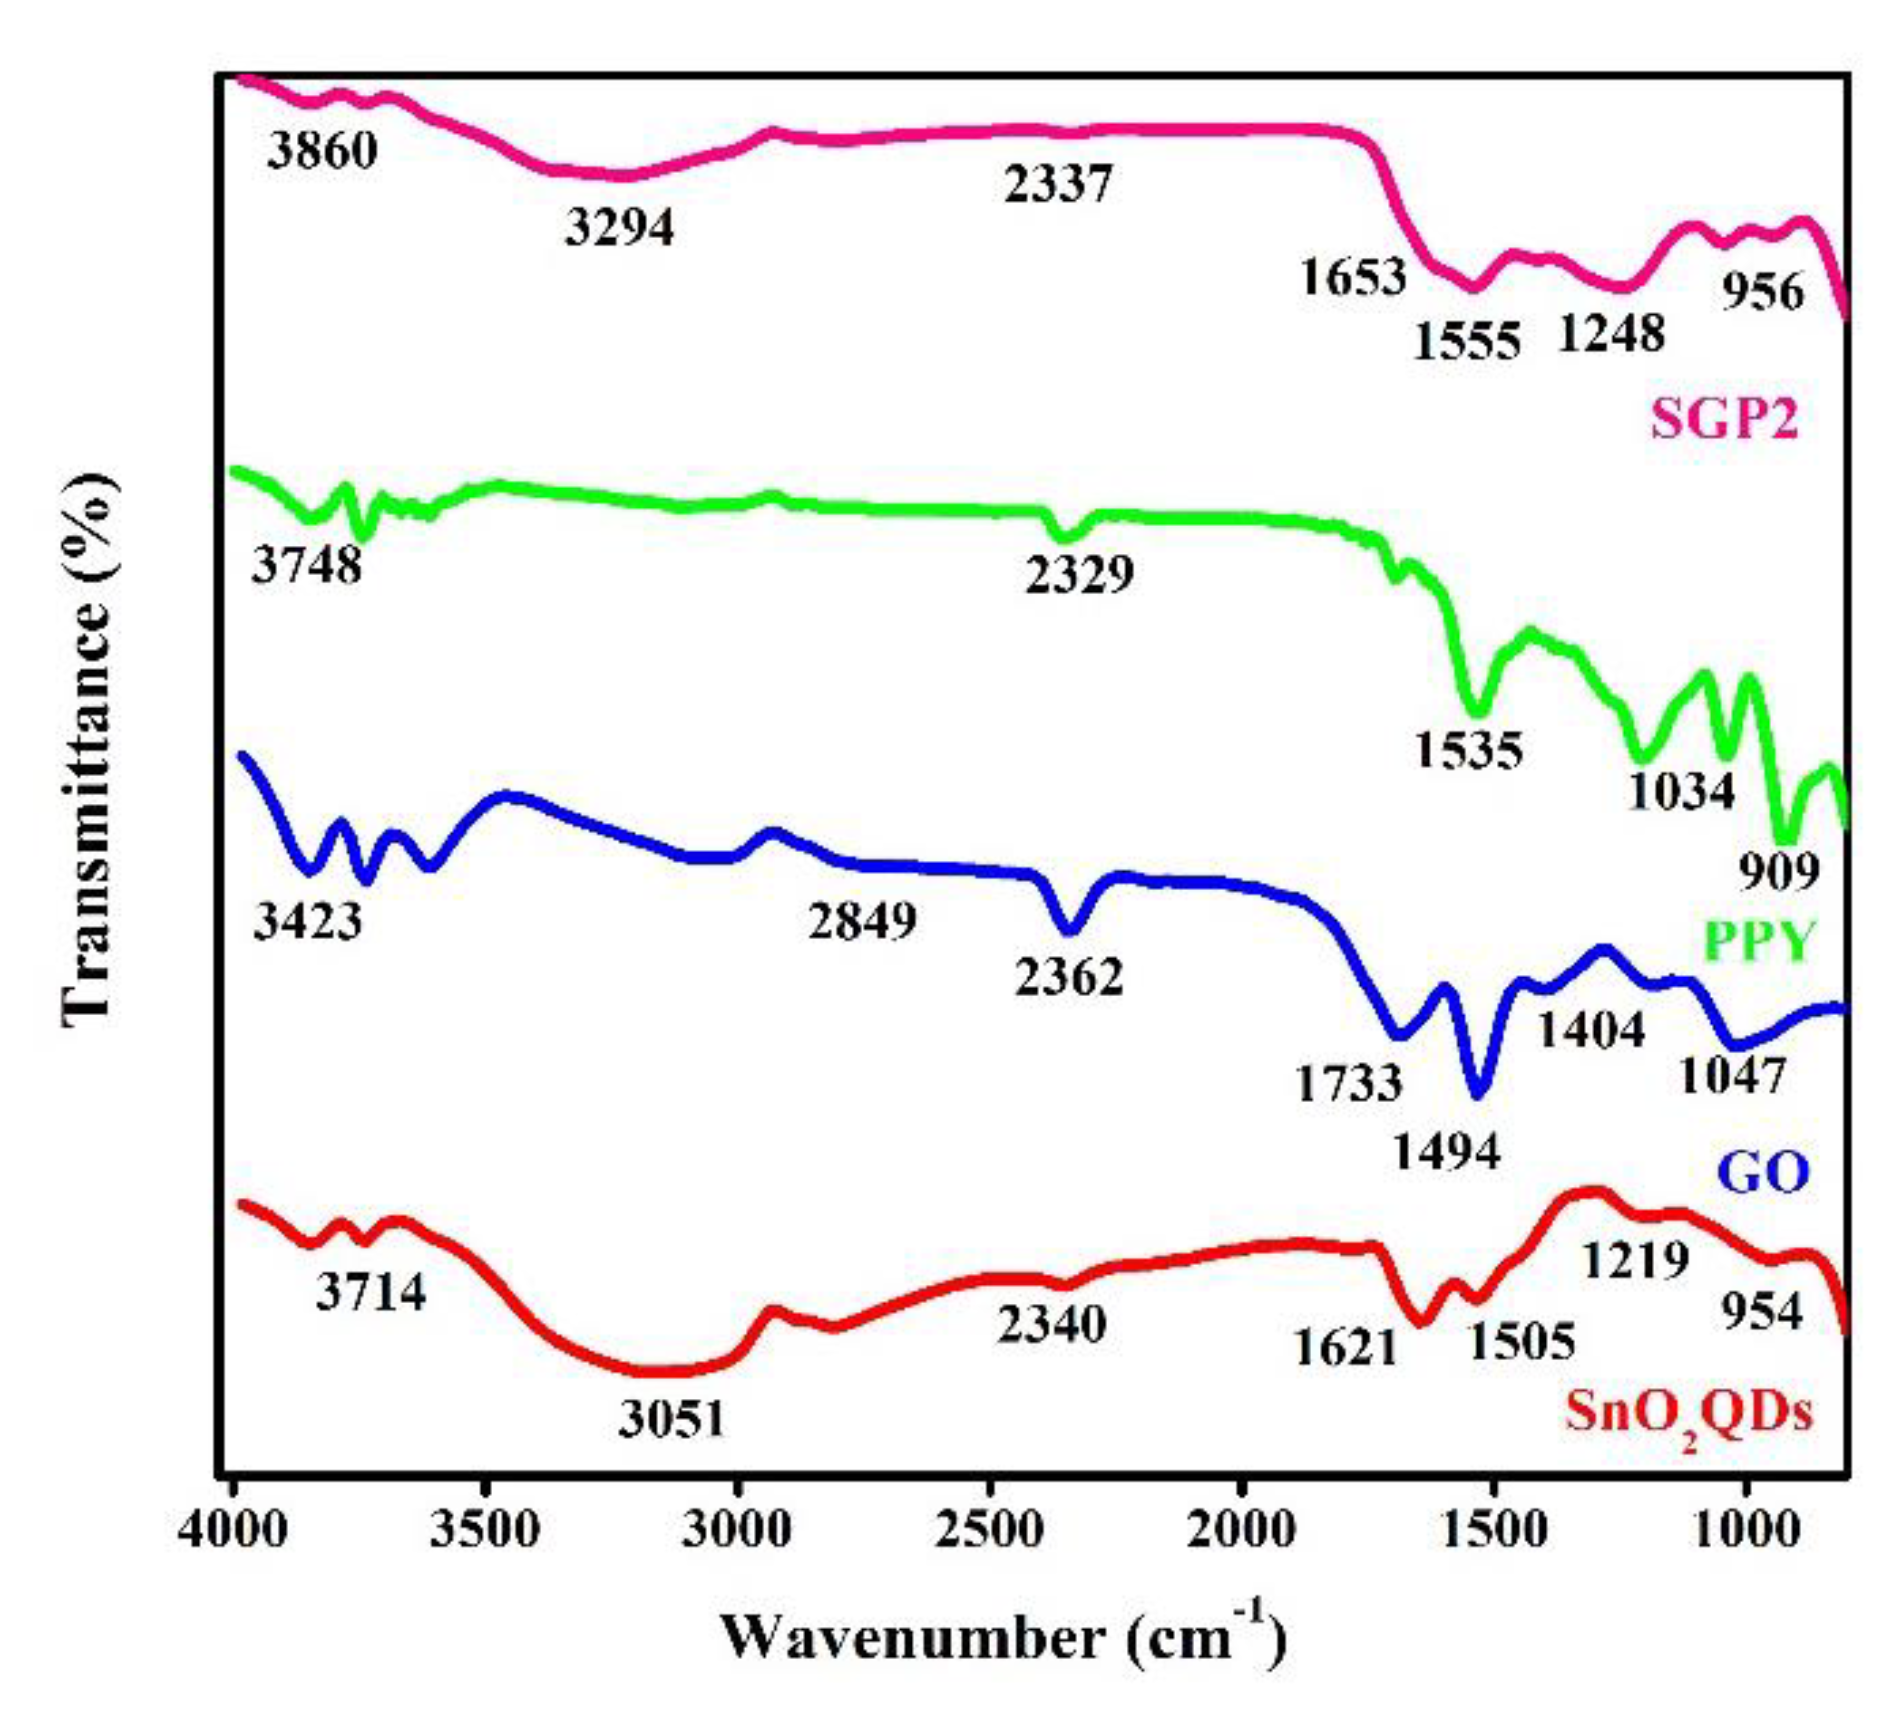
4.1. FTIR Study
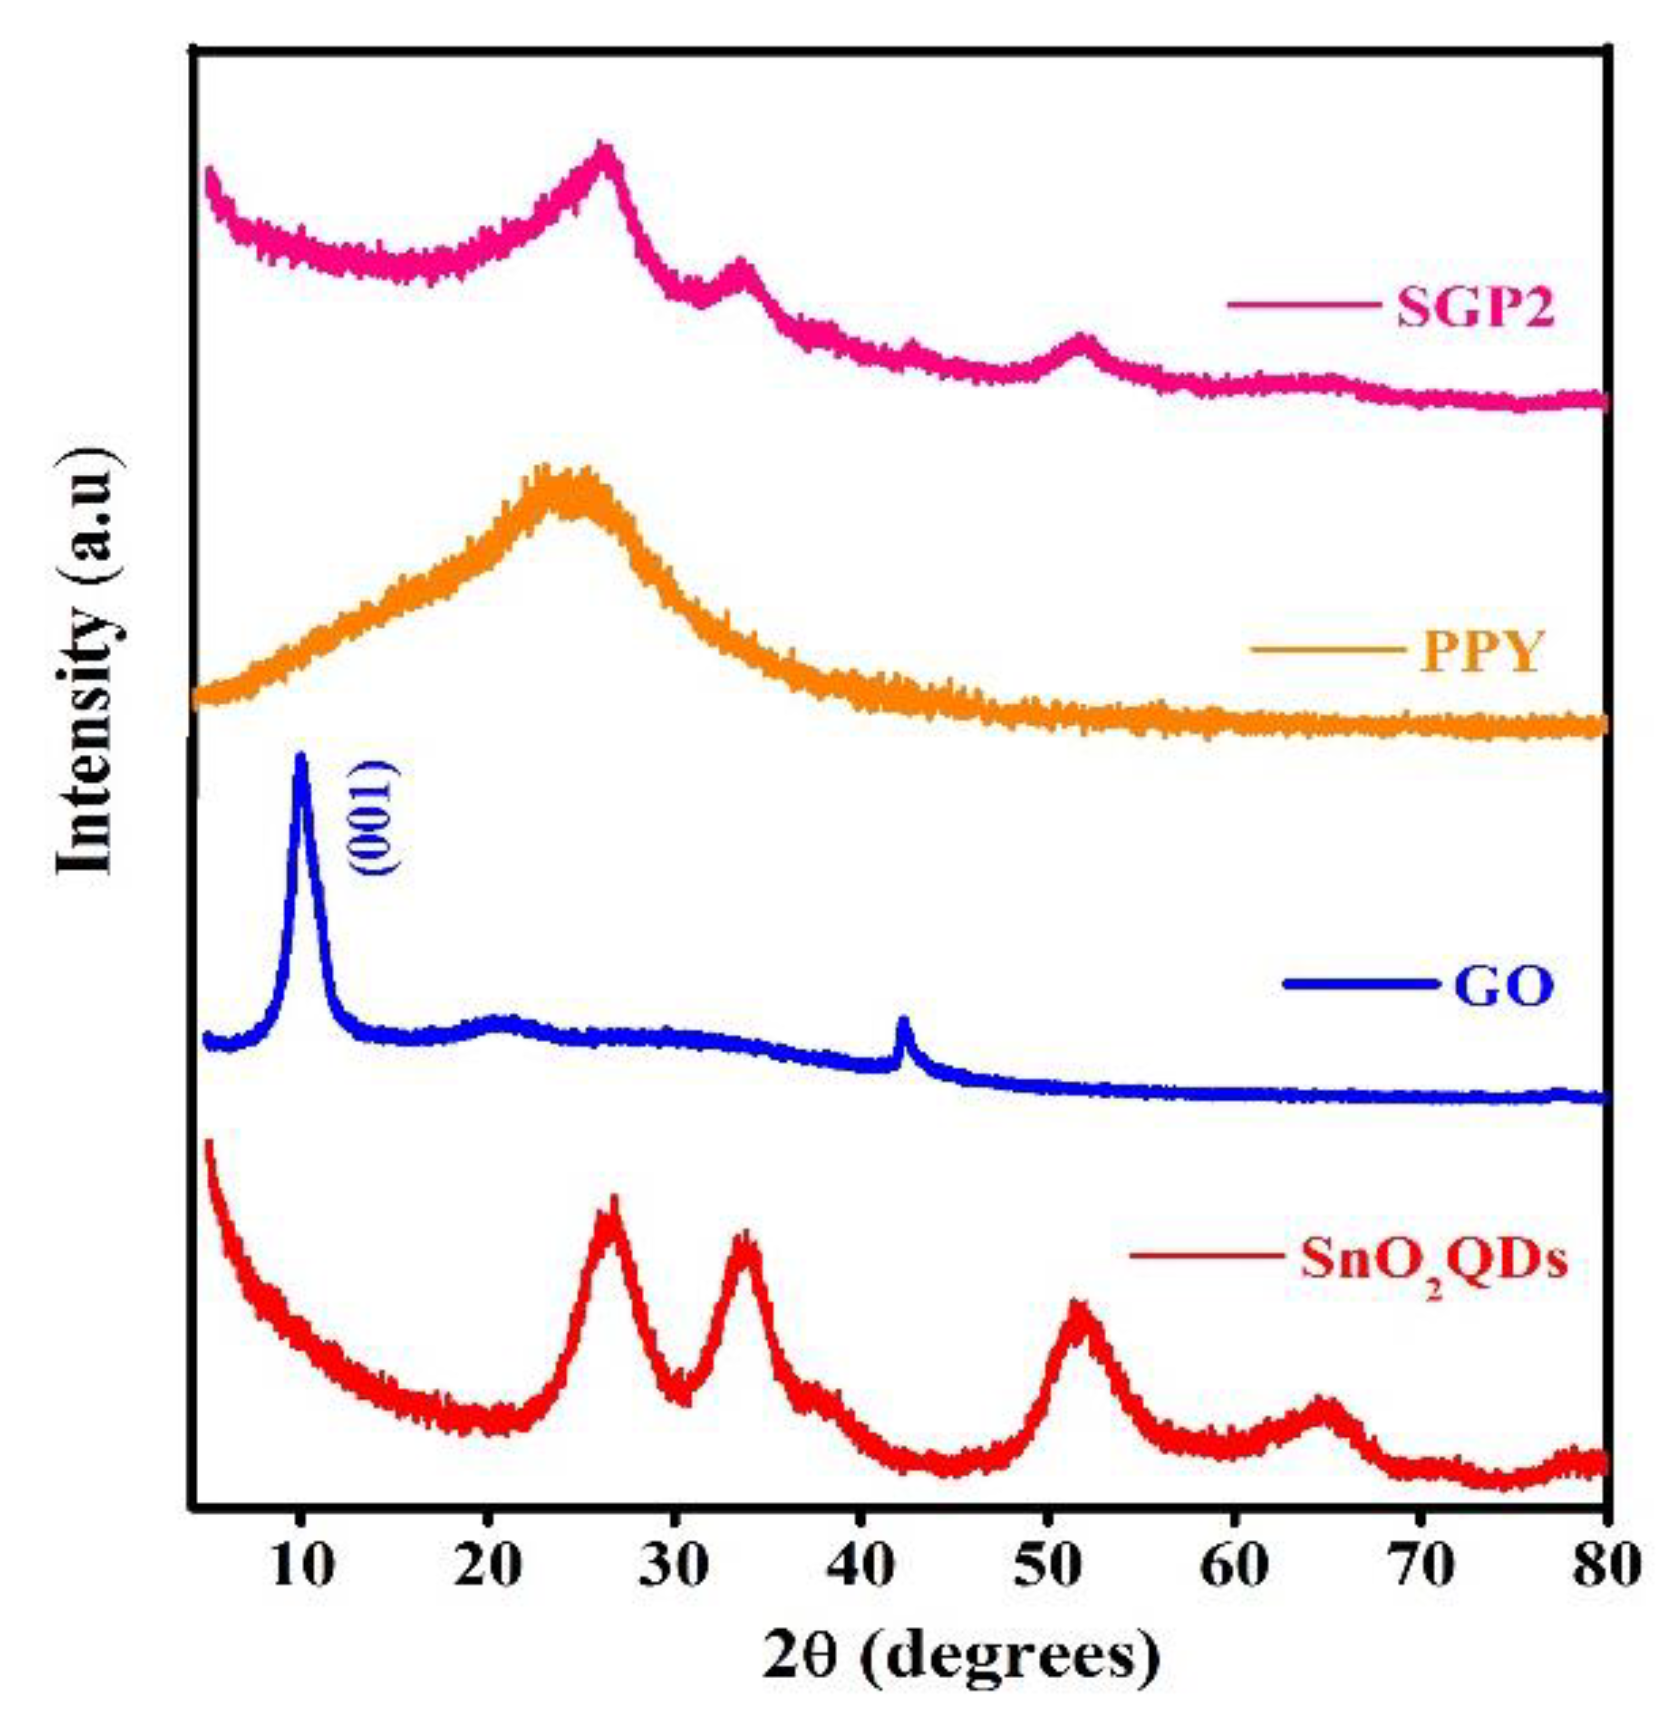
4.2. XRD Analysis
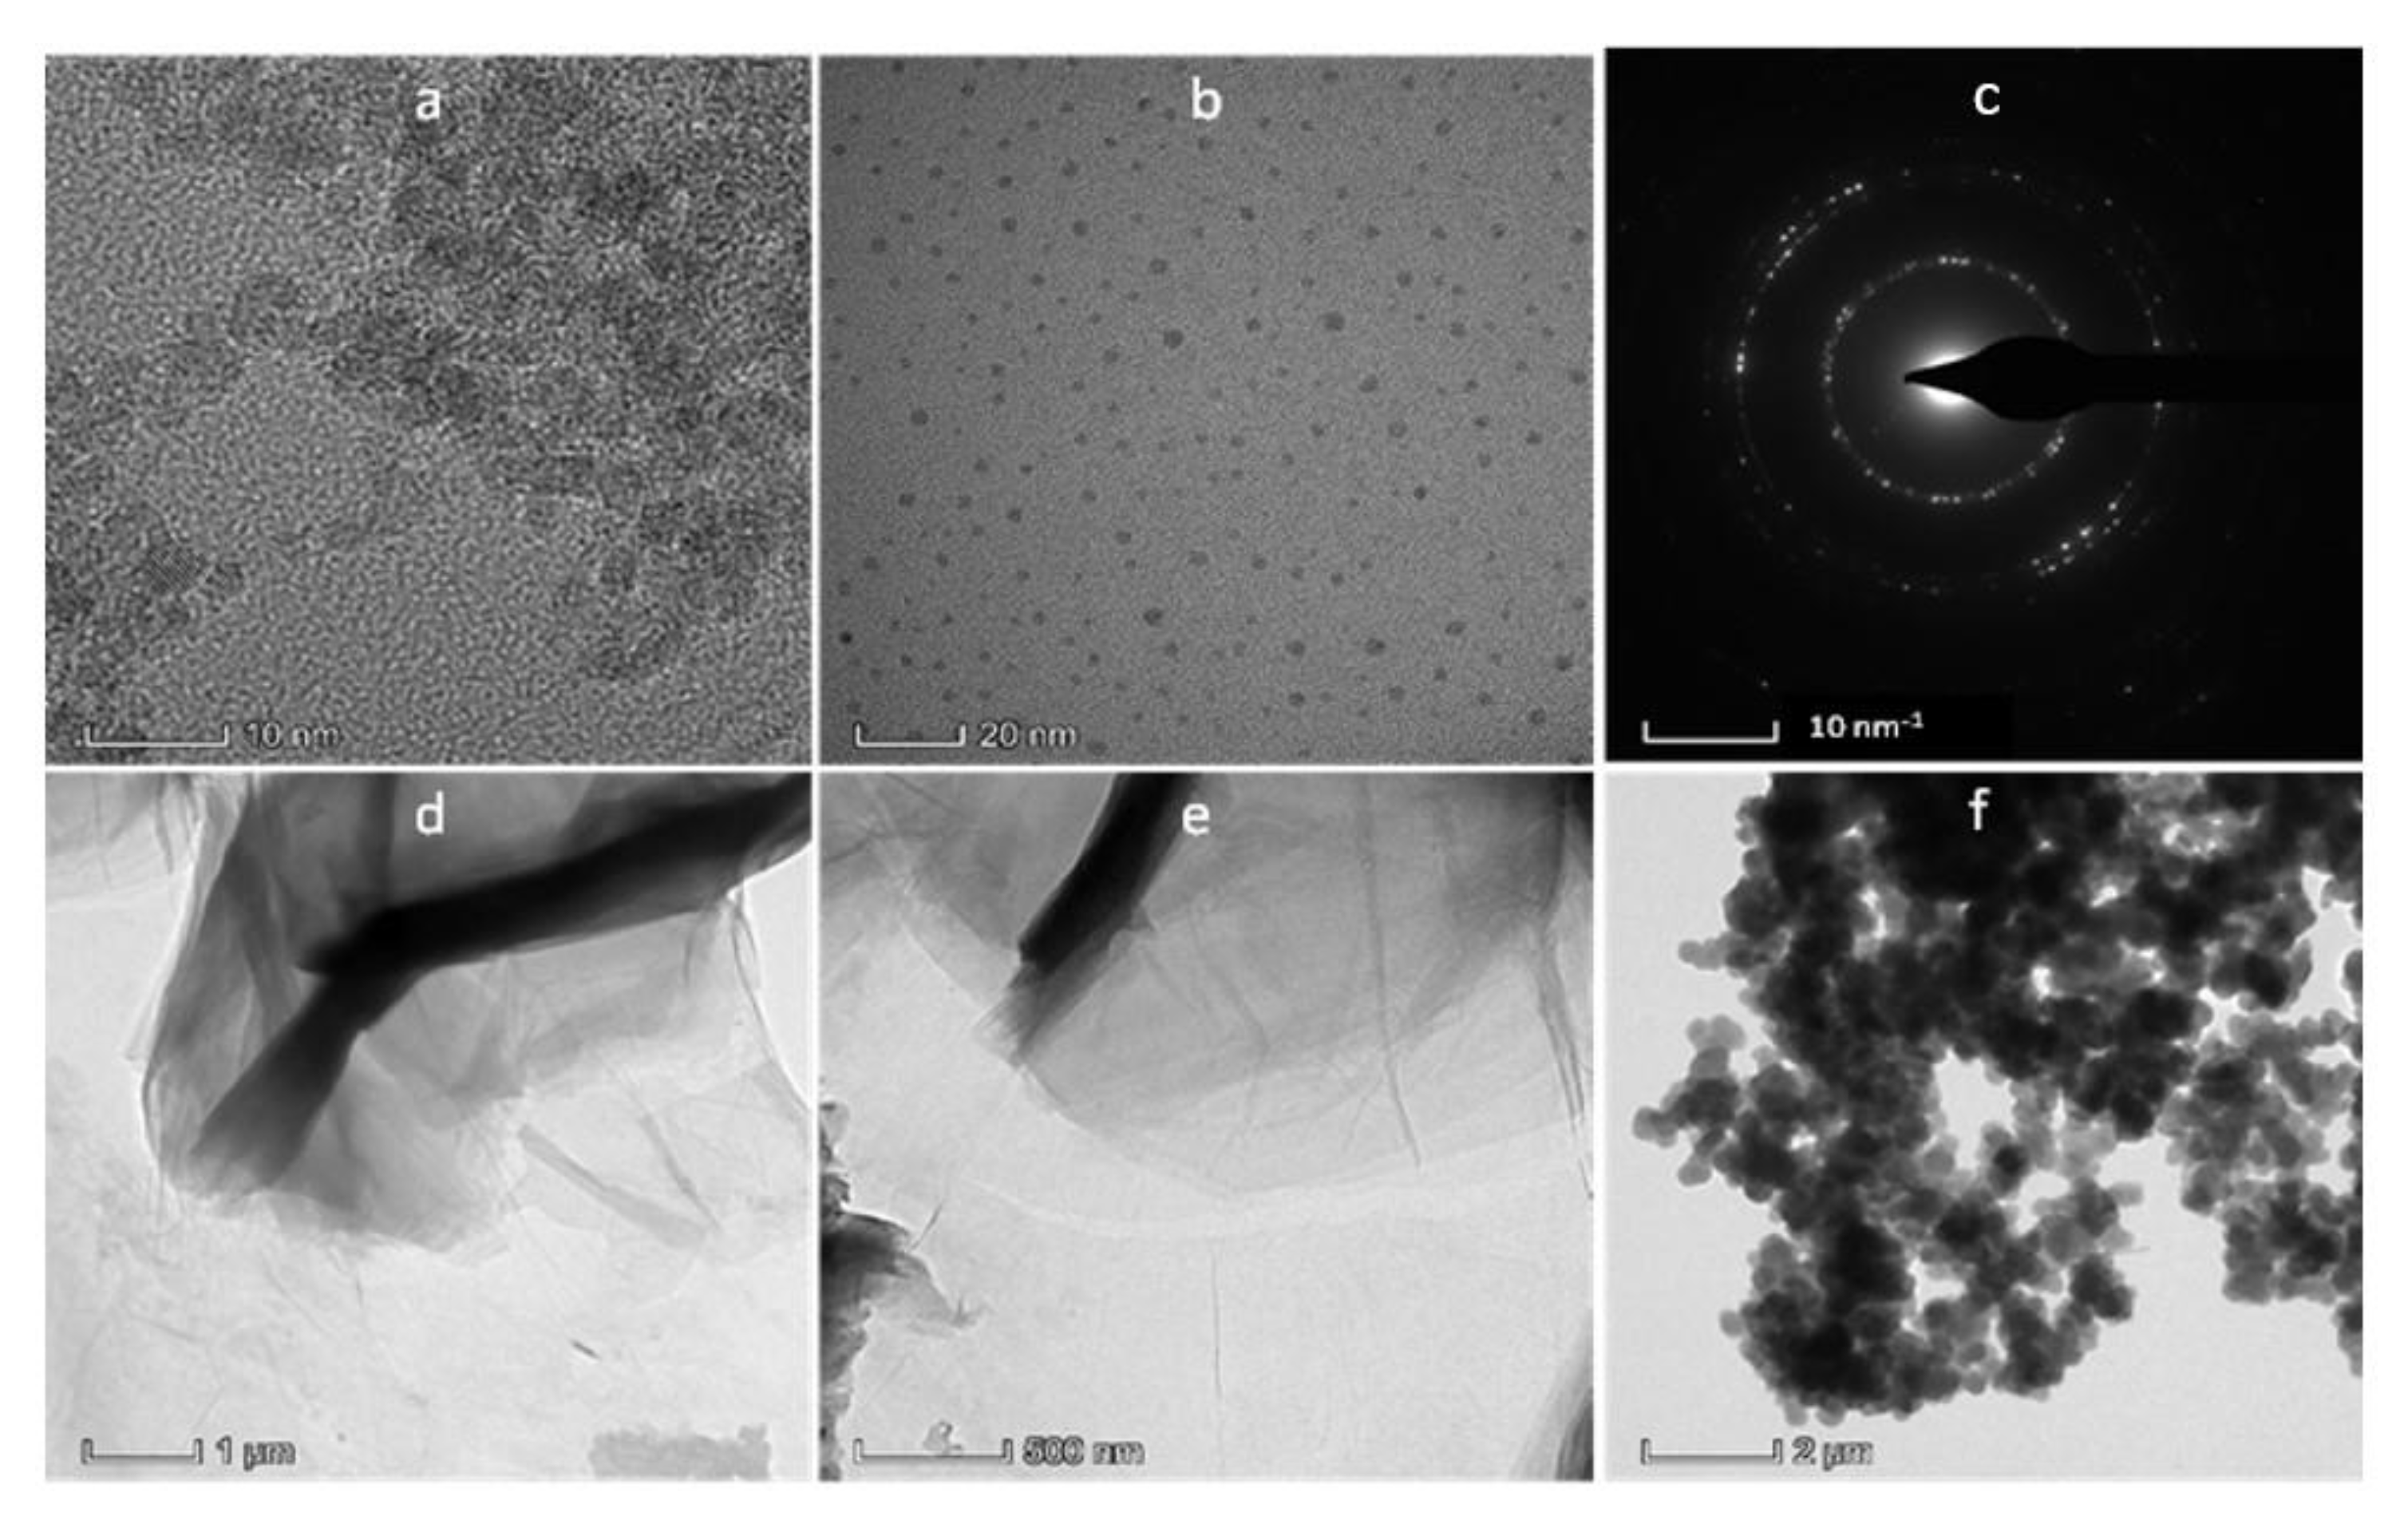
4.3. TEM Analysis
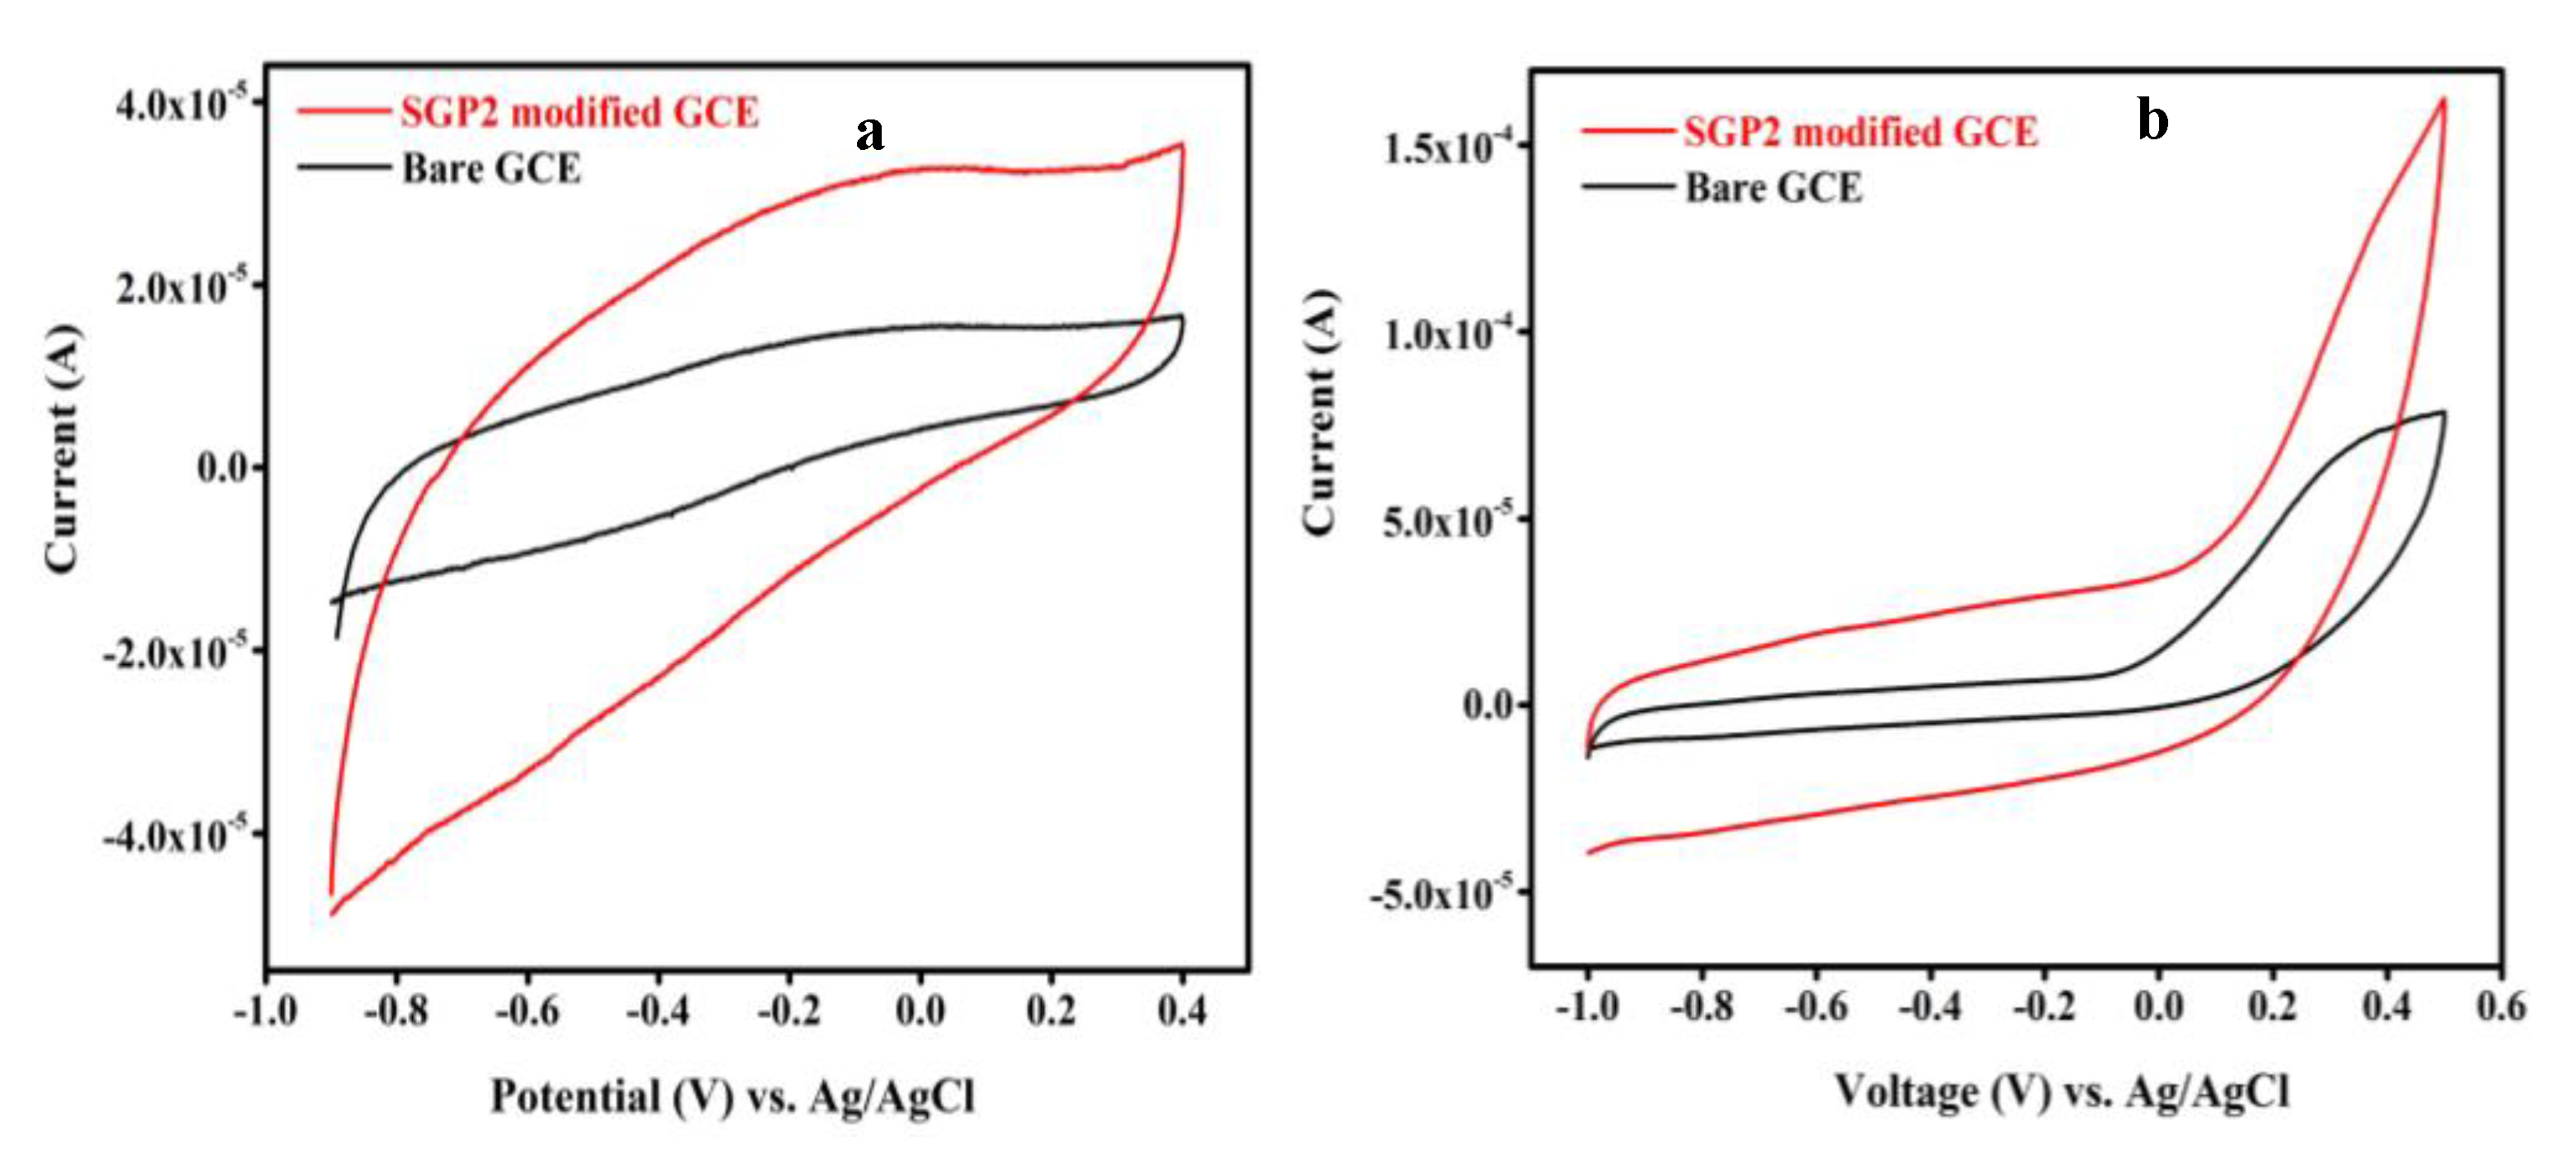
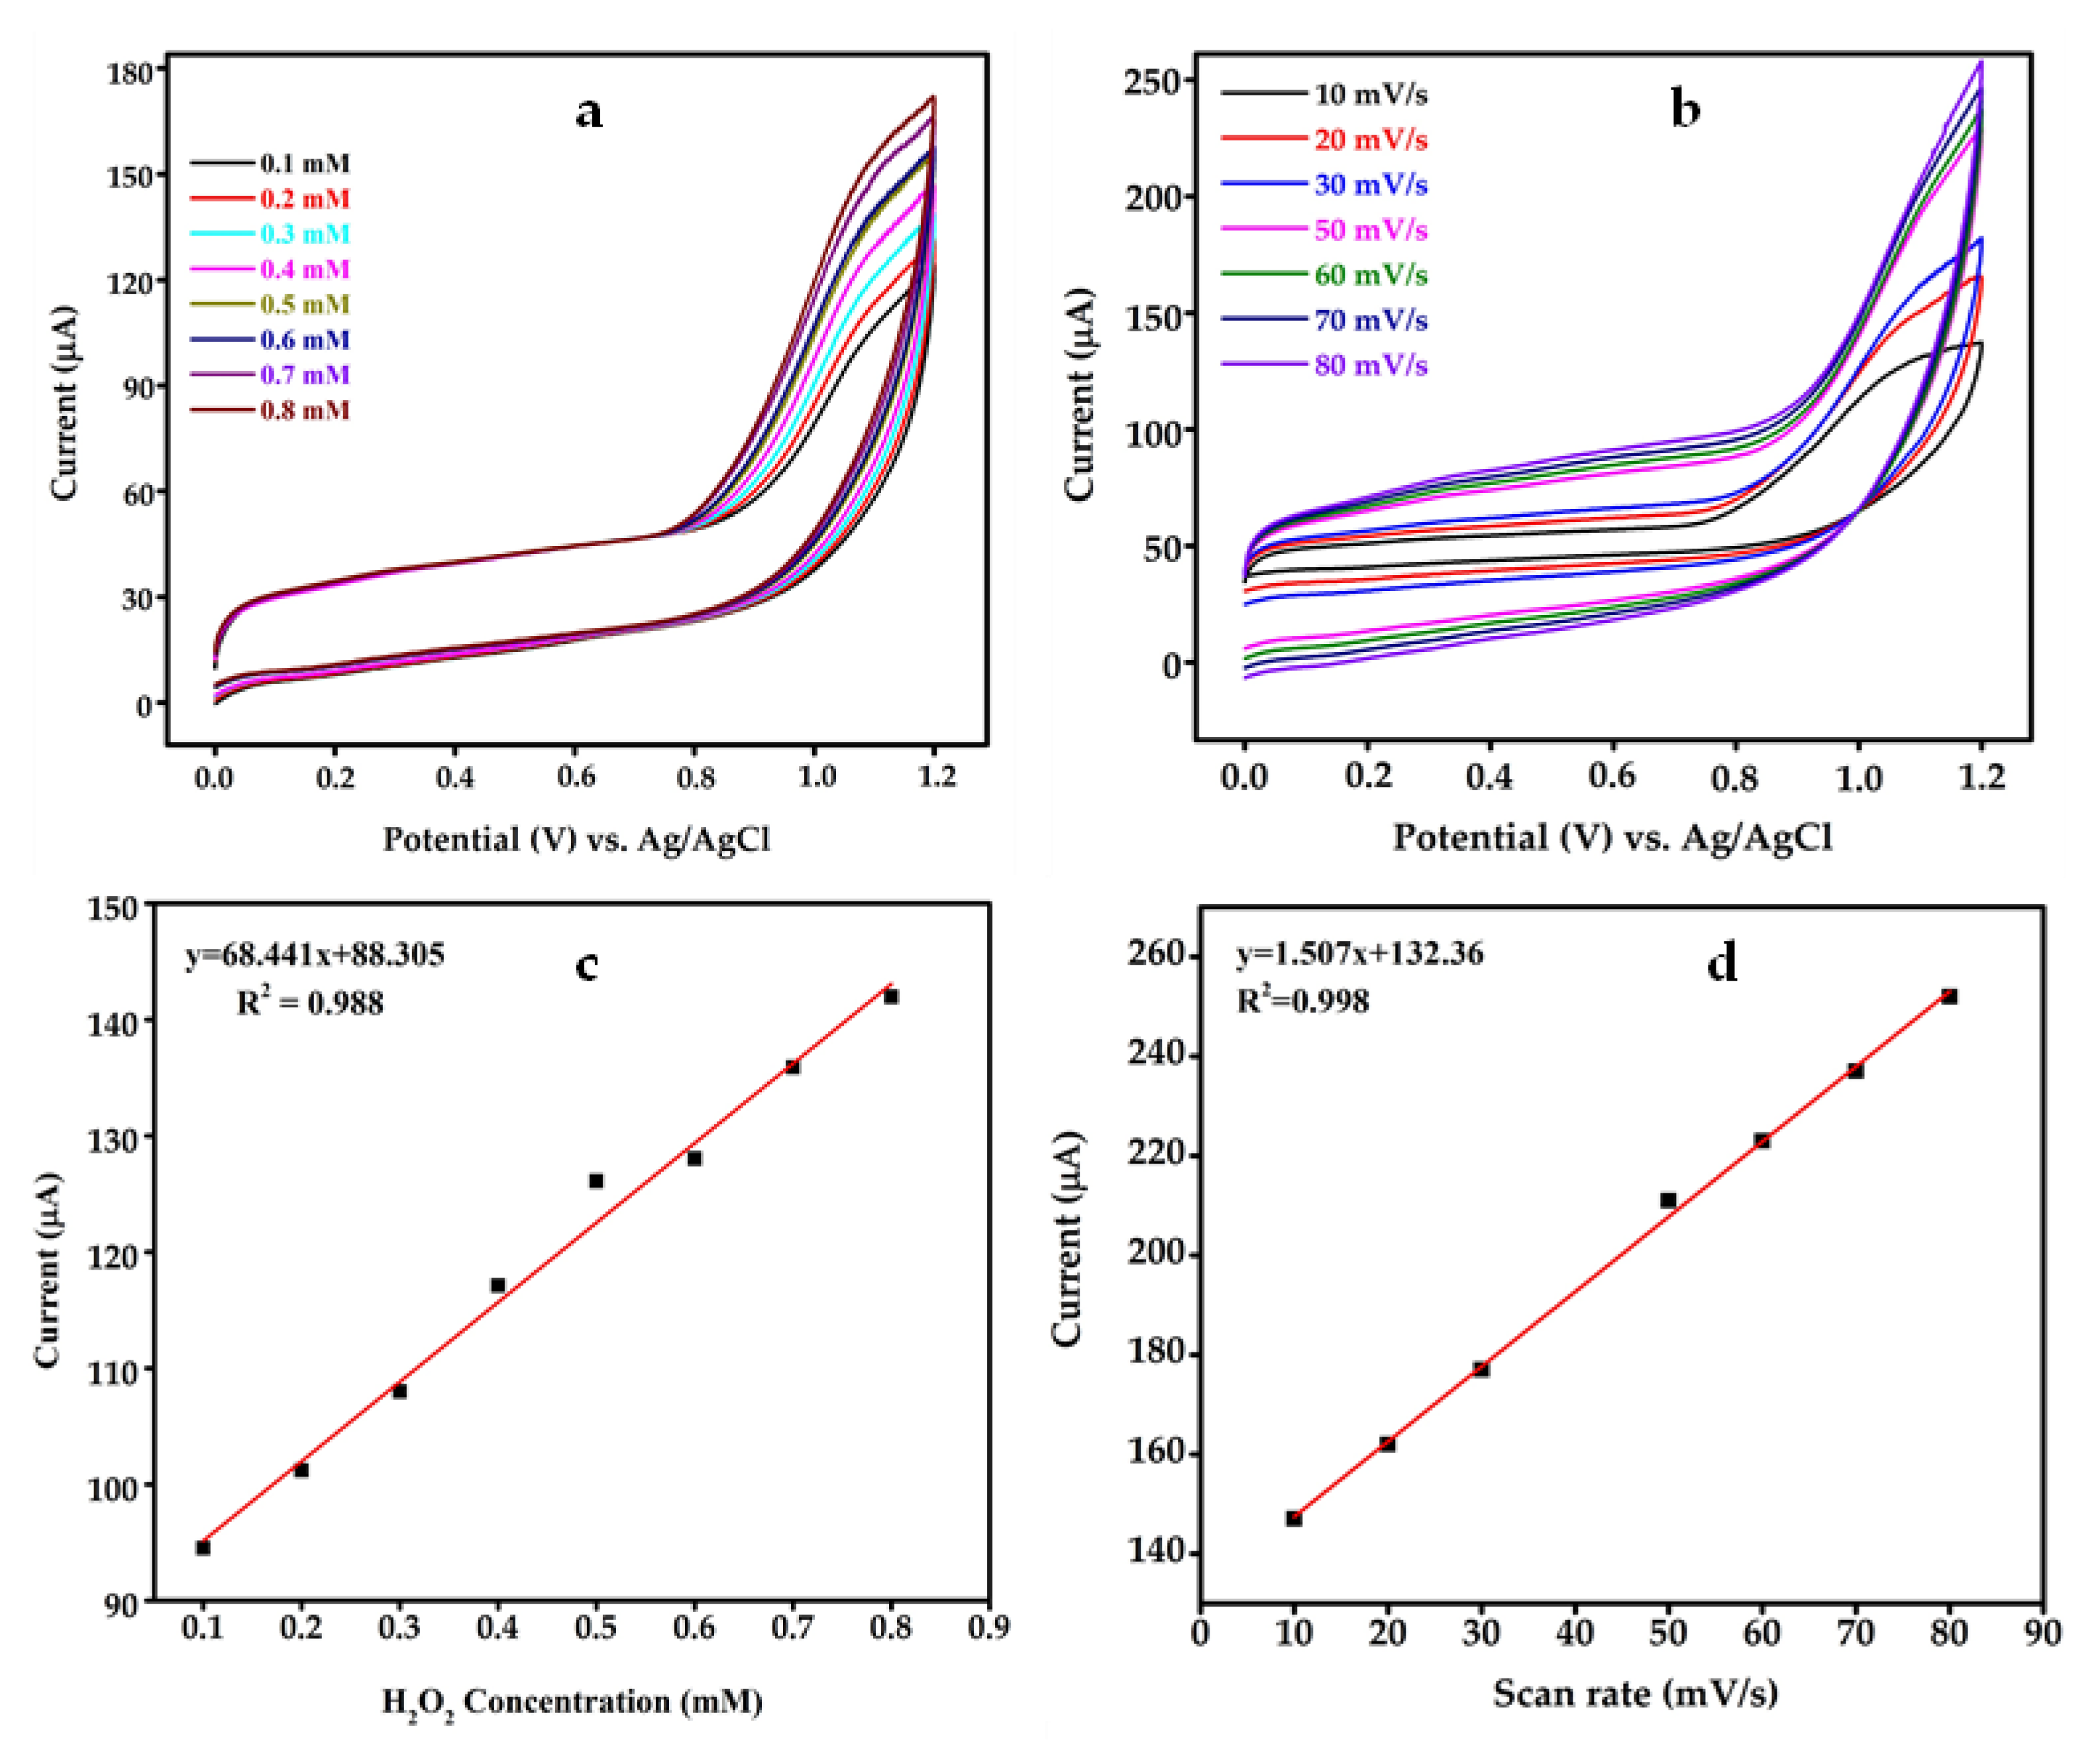
4.4. Fabrication of Sensor and Electrochemical Study
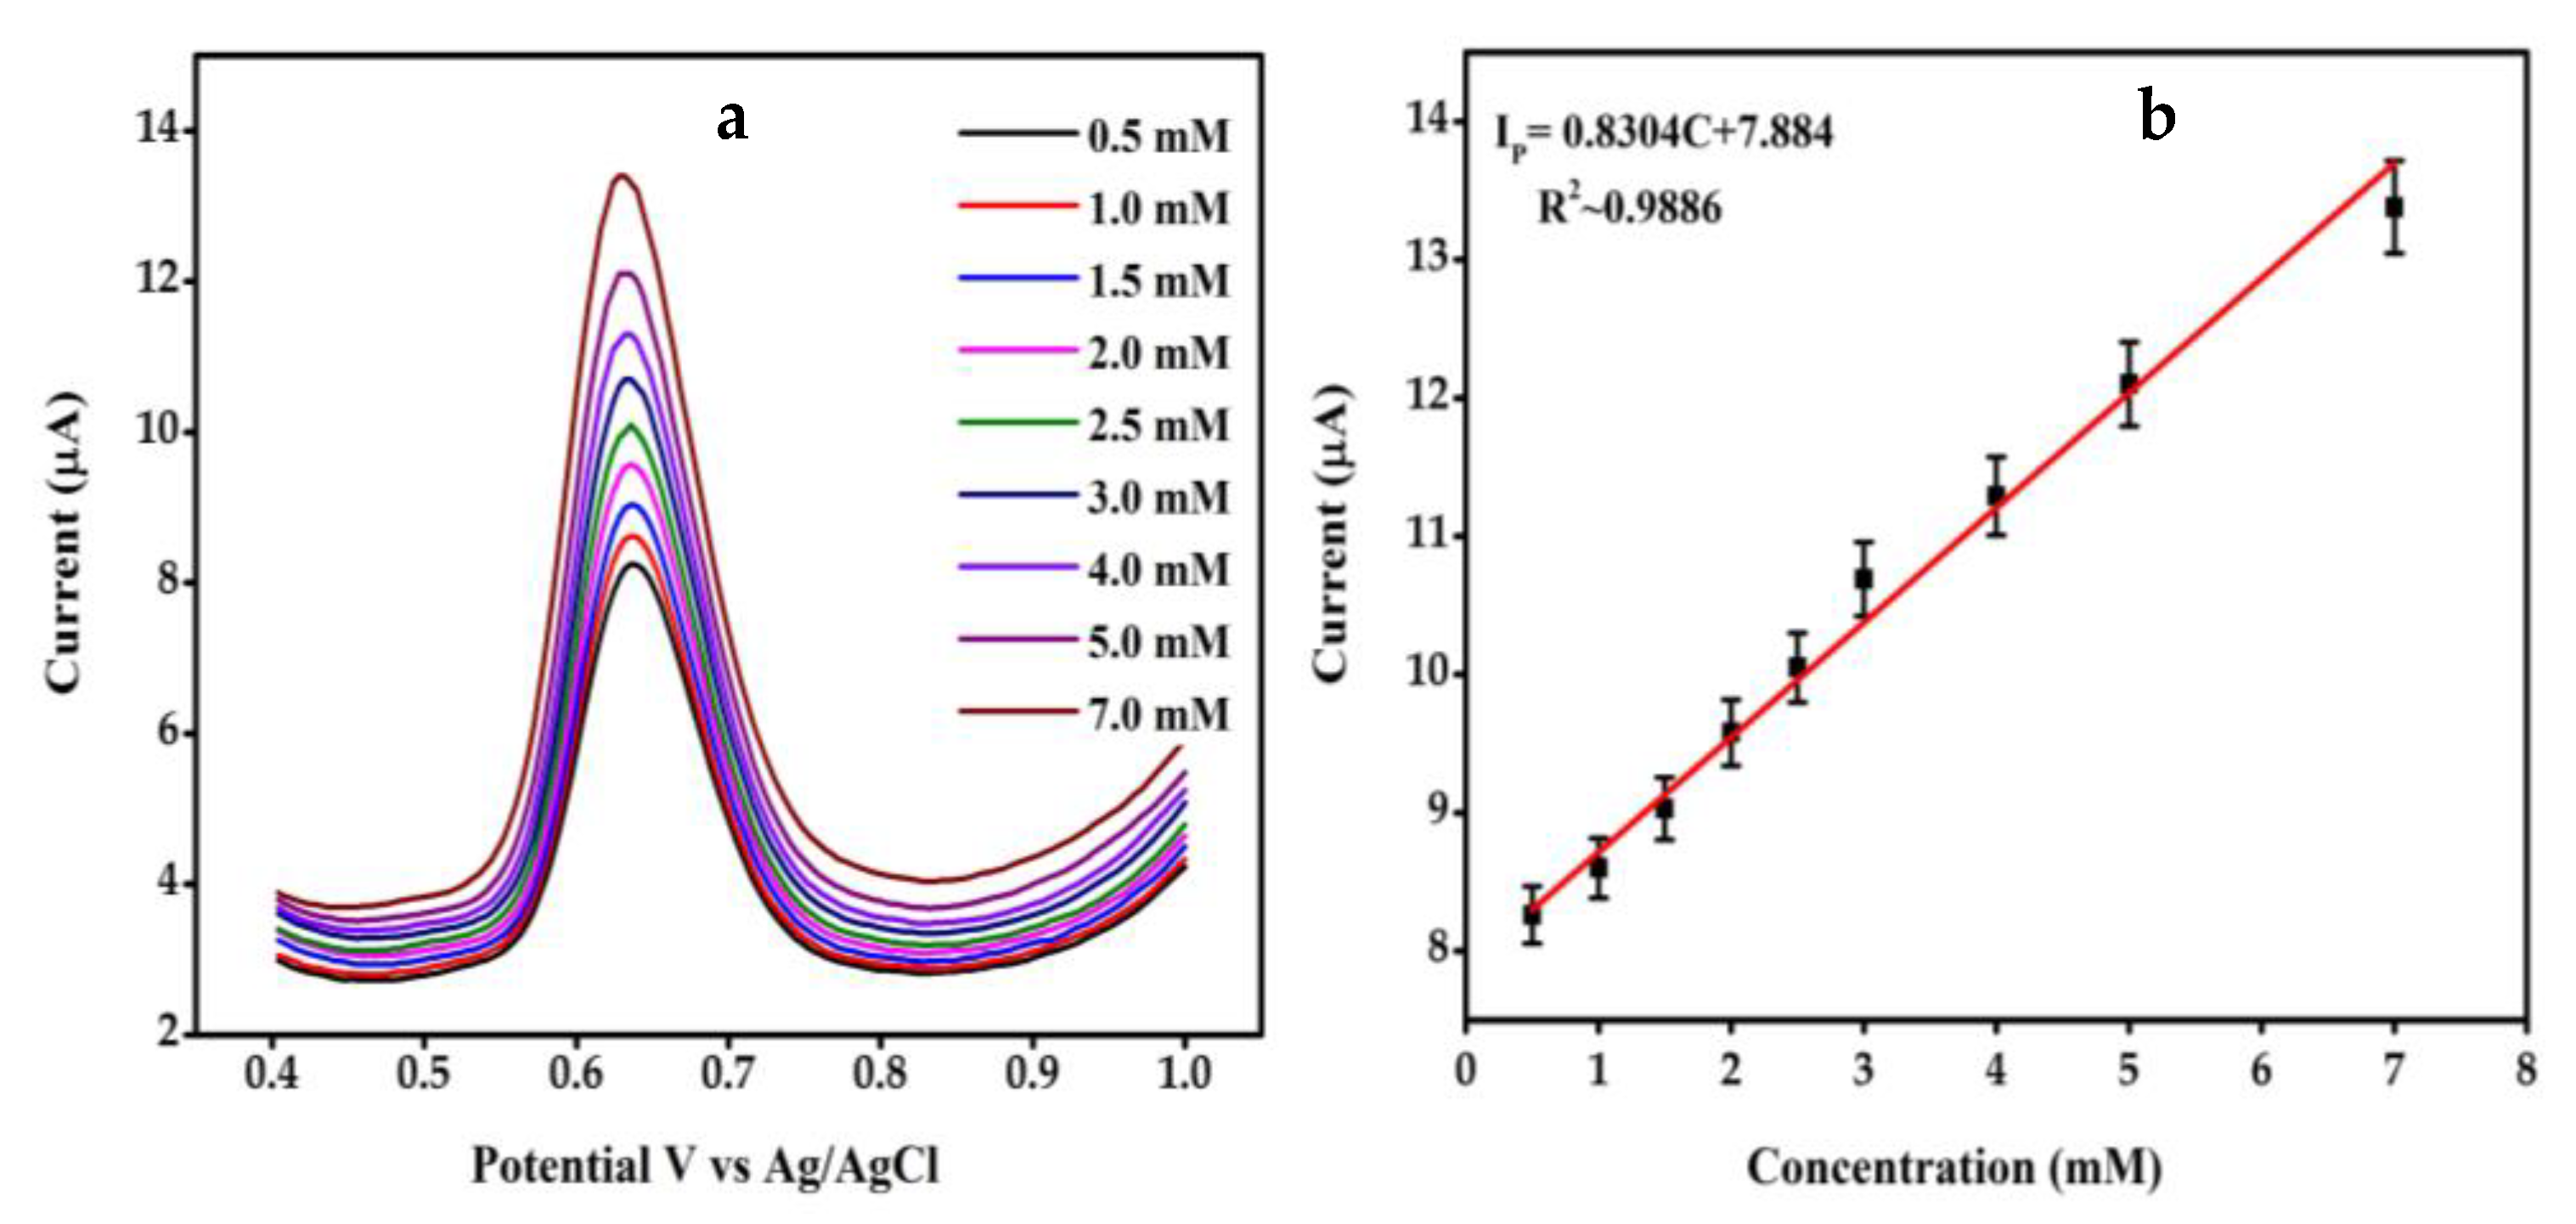
4.5. Differential Pulse Voltametry Analysis of SGP2 GCE
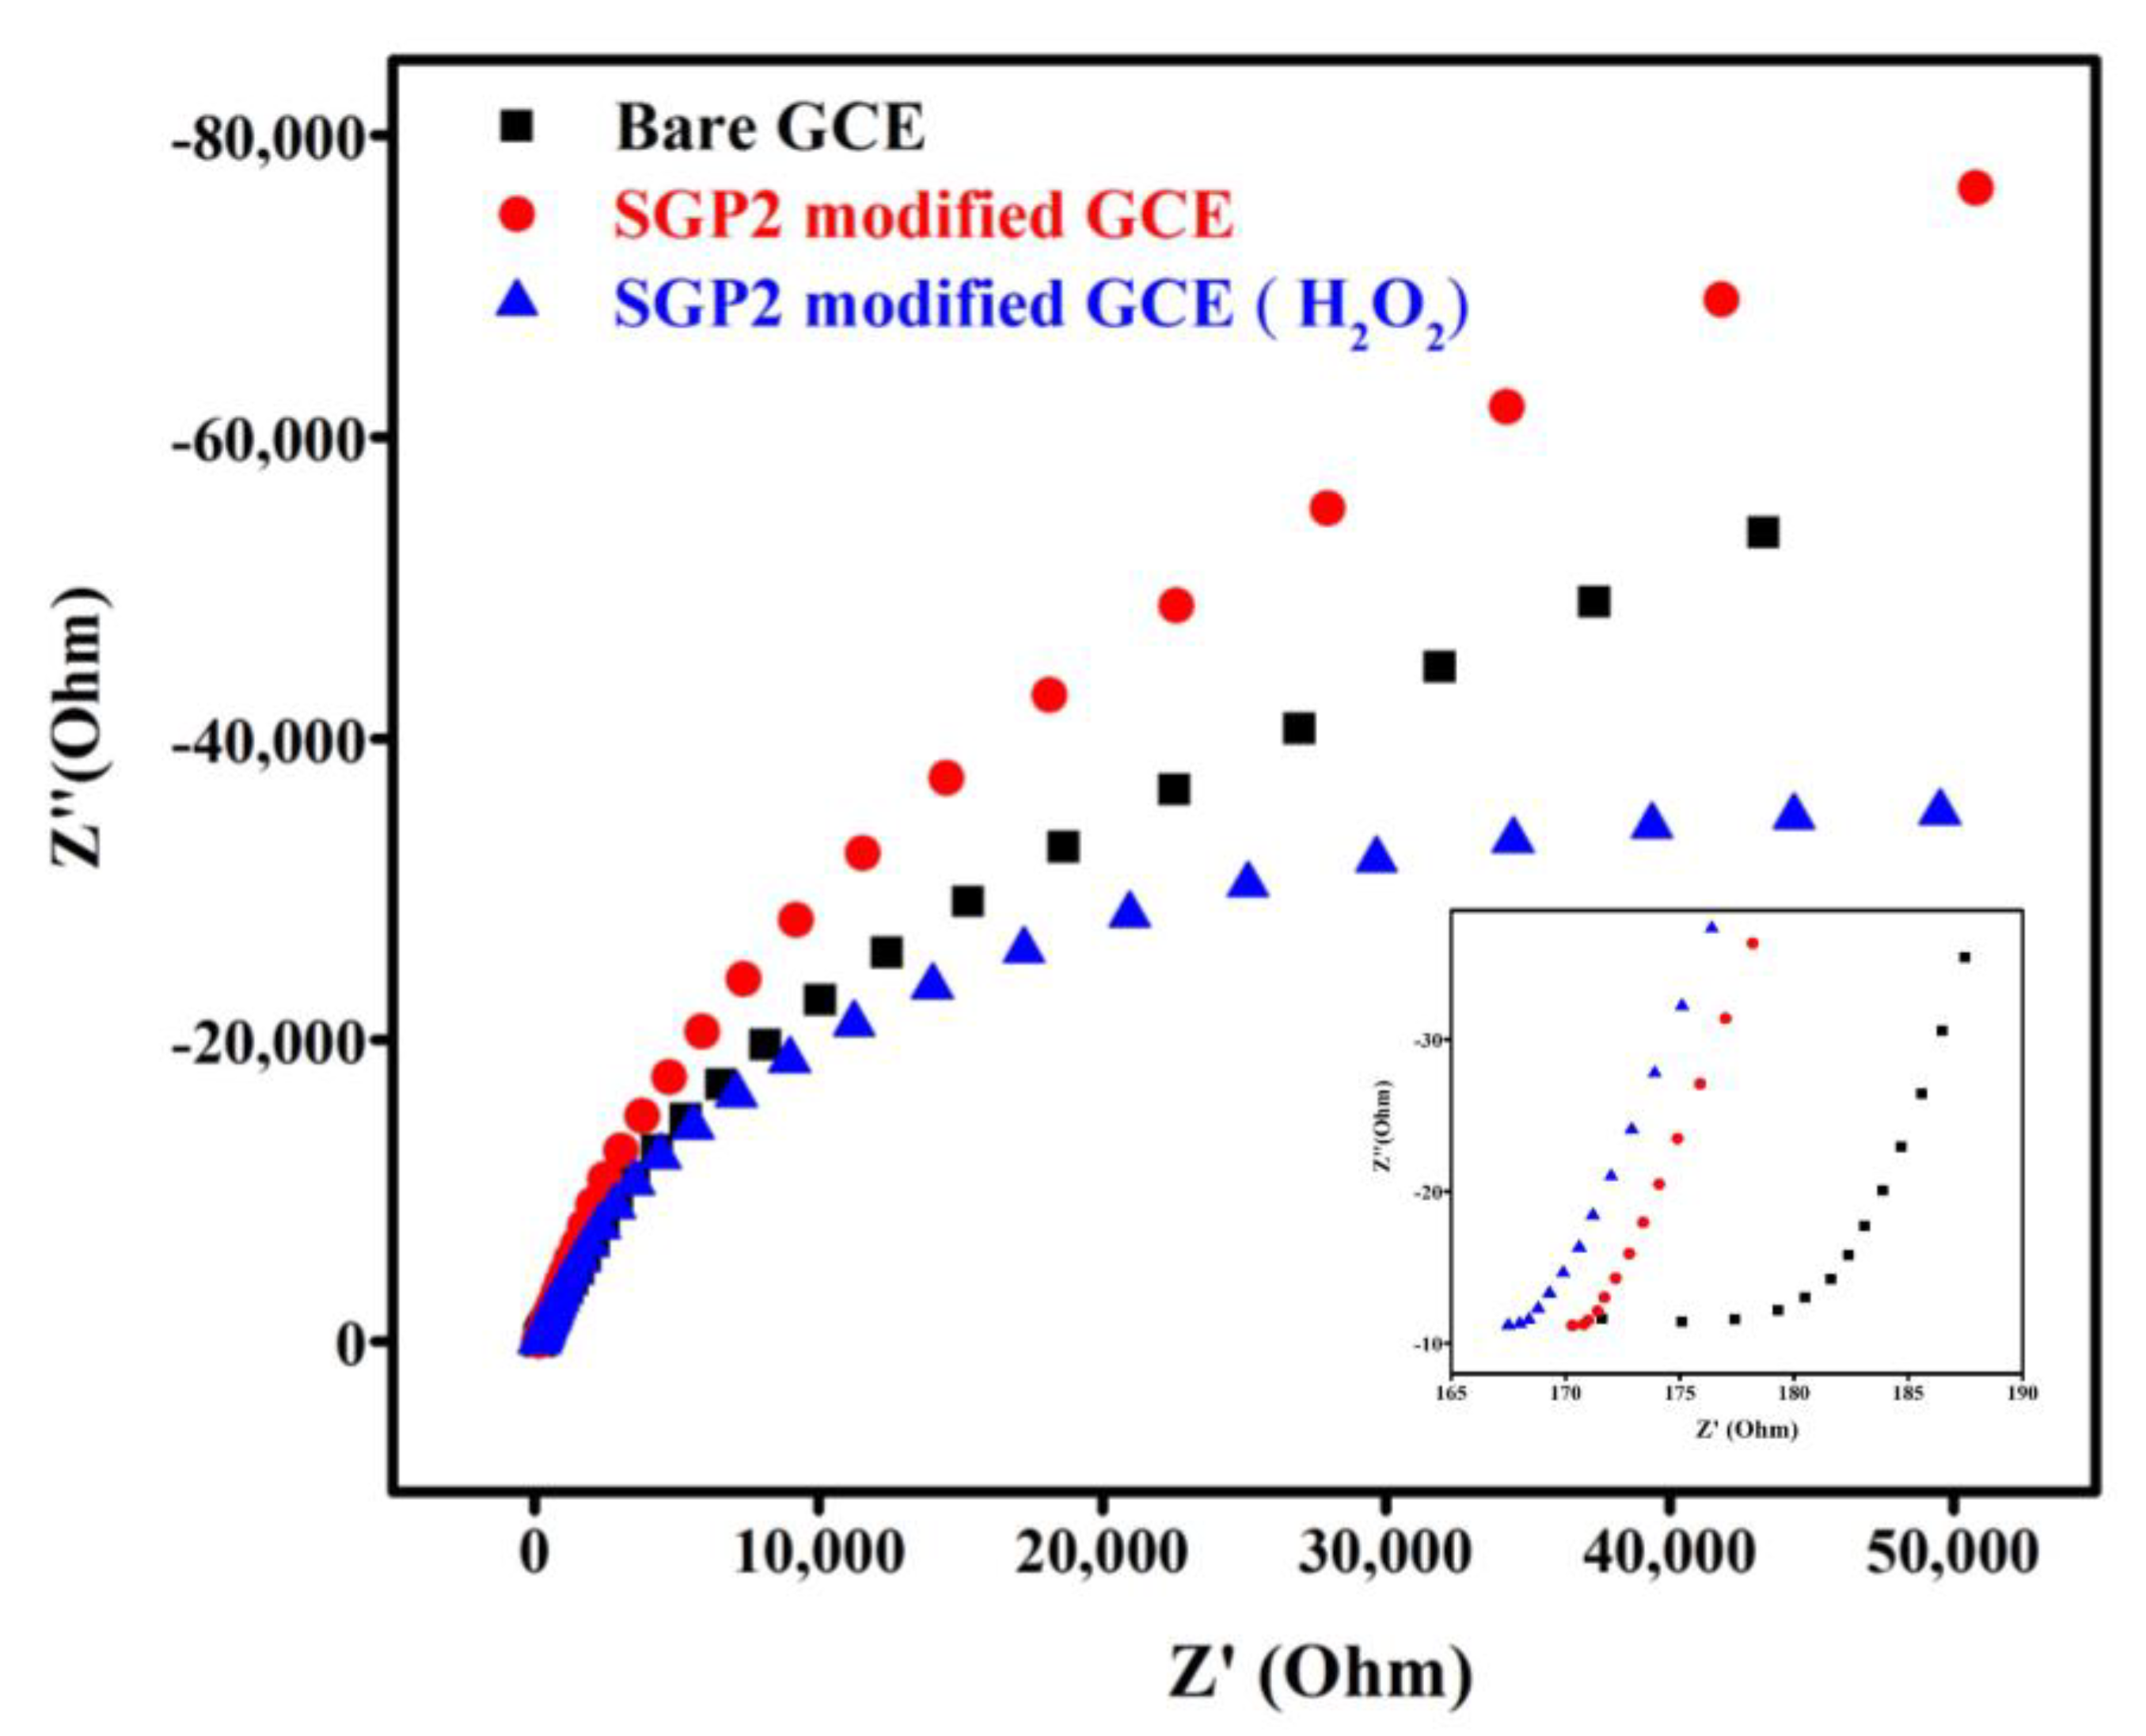
4.6. Electrochemical Impedance Spectroscopy (EIS)
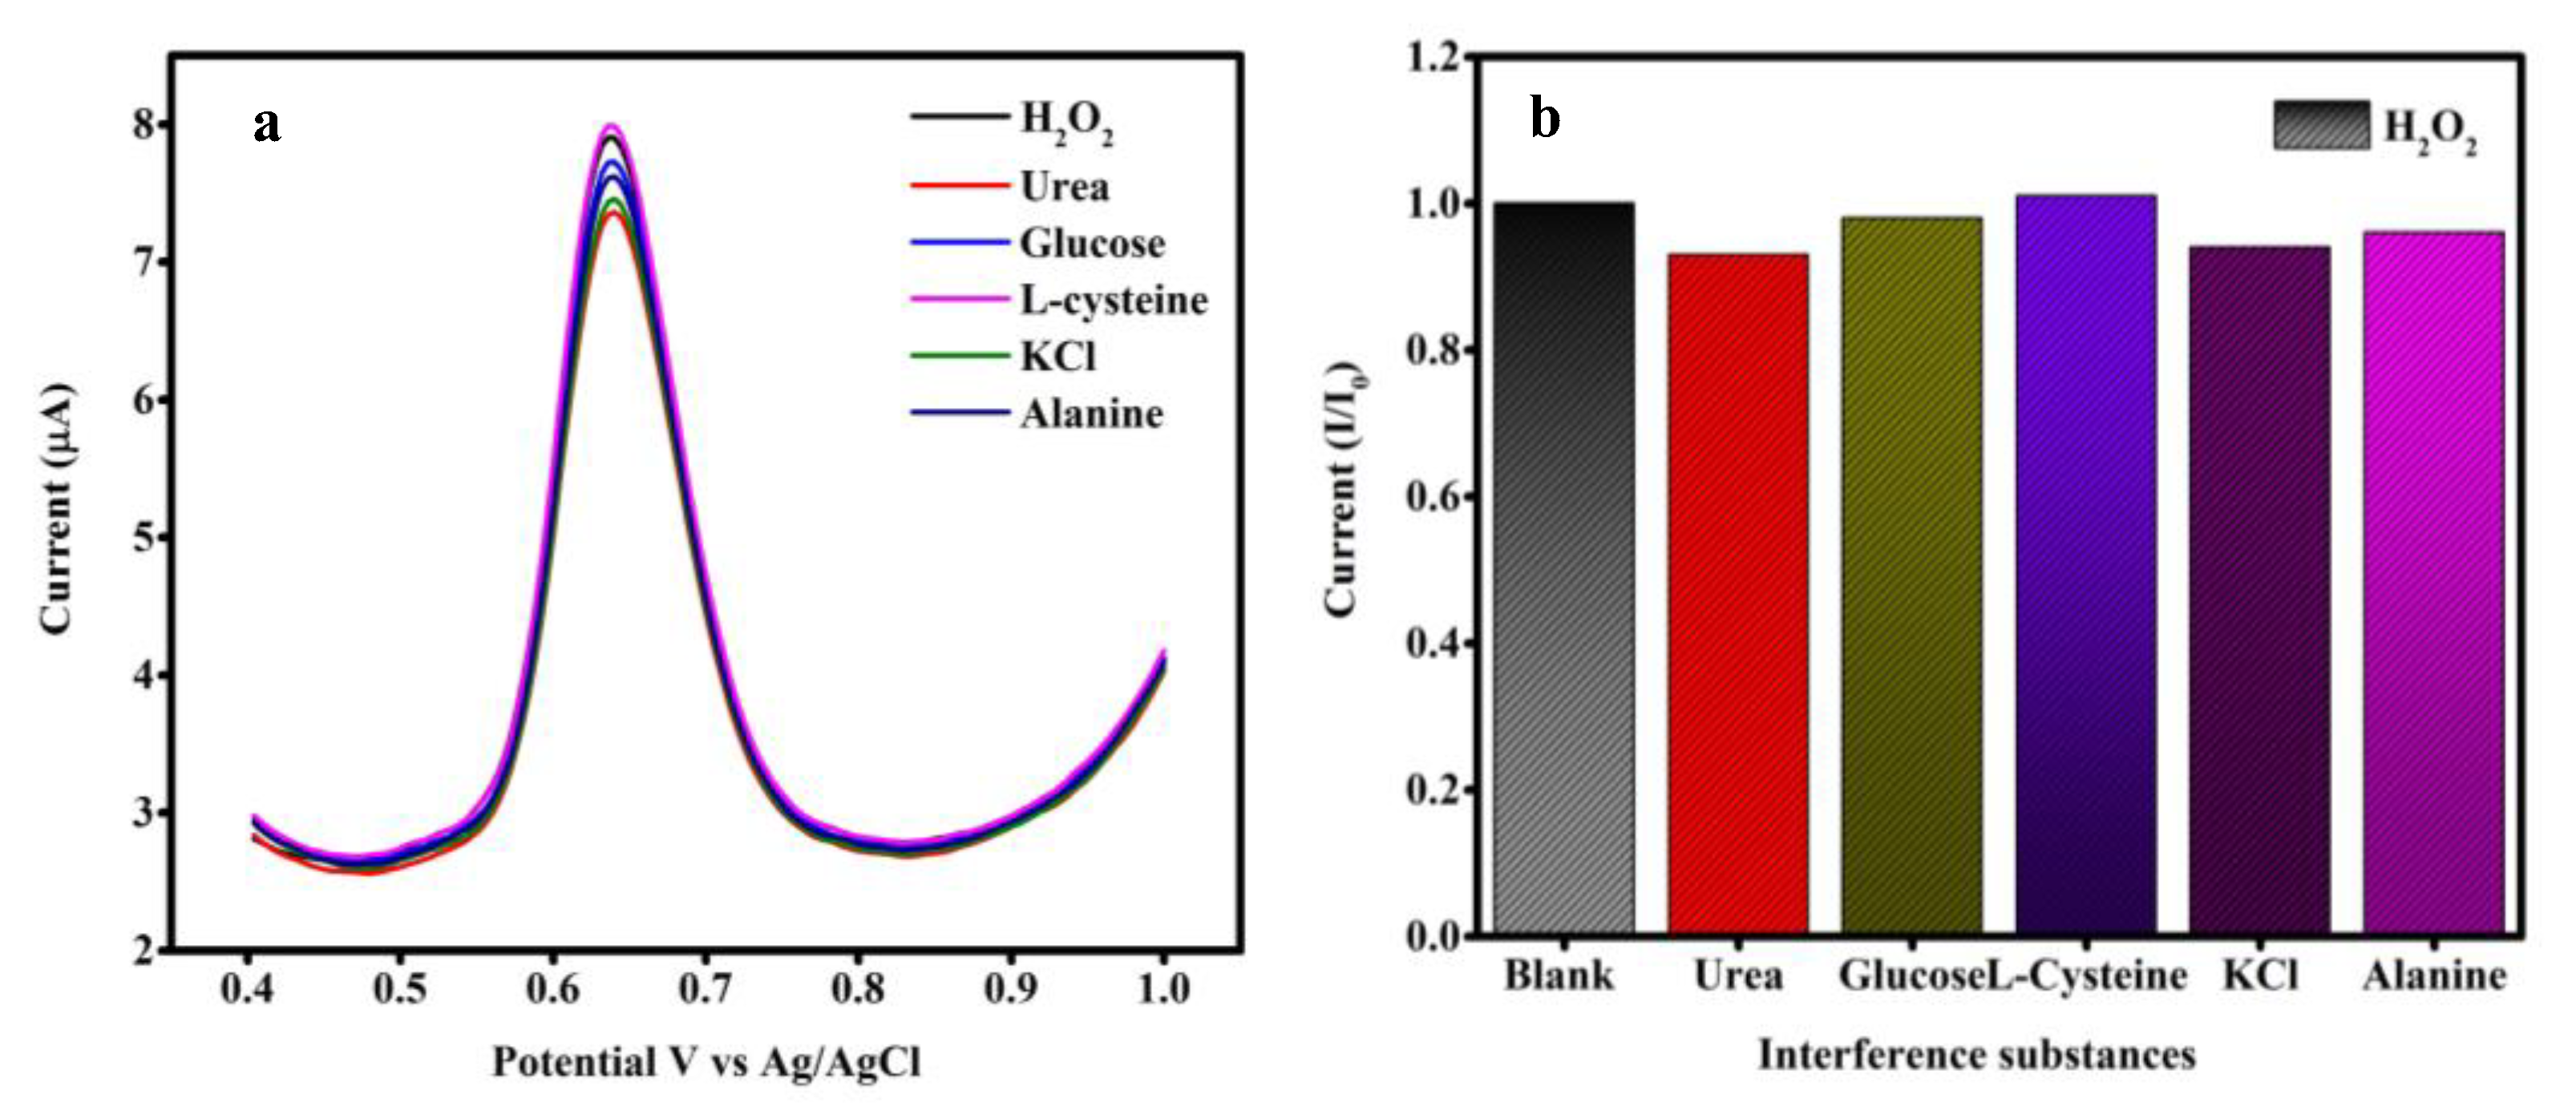
4.7. Selectivity Study SGP2 Glassy Carbon Electrode
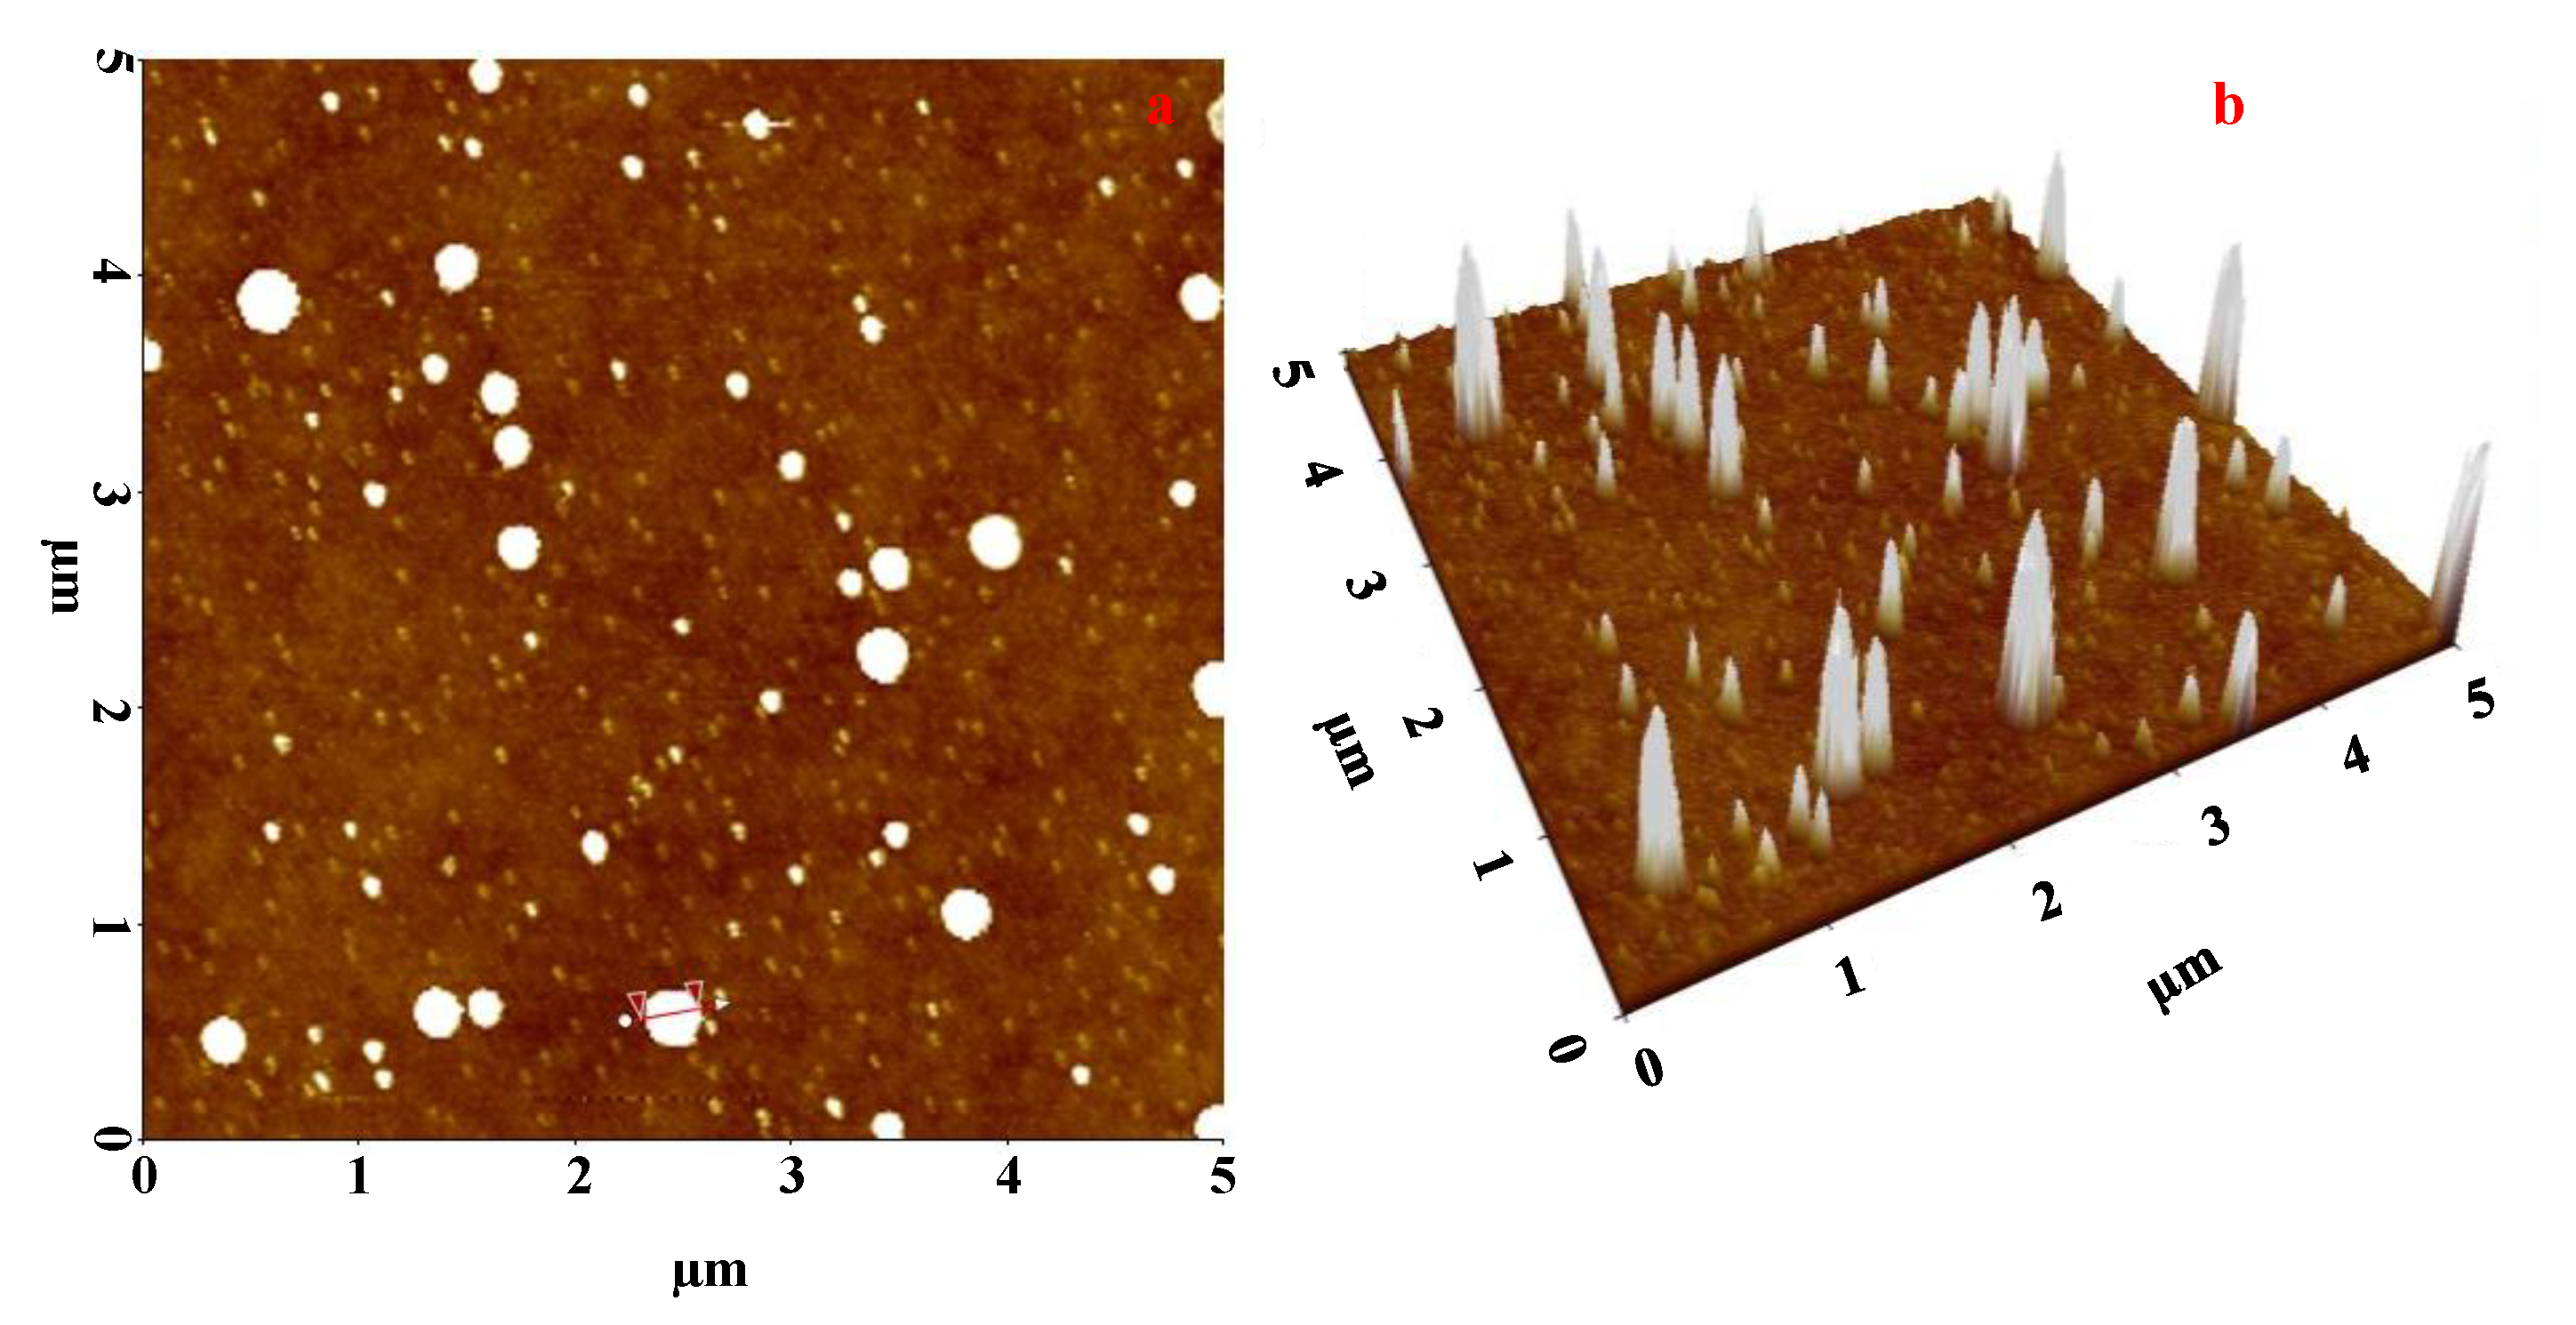
4.8. AFM Analysis
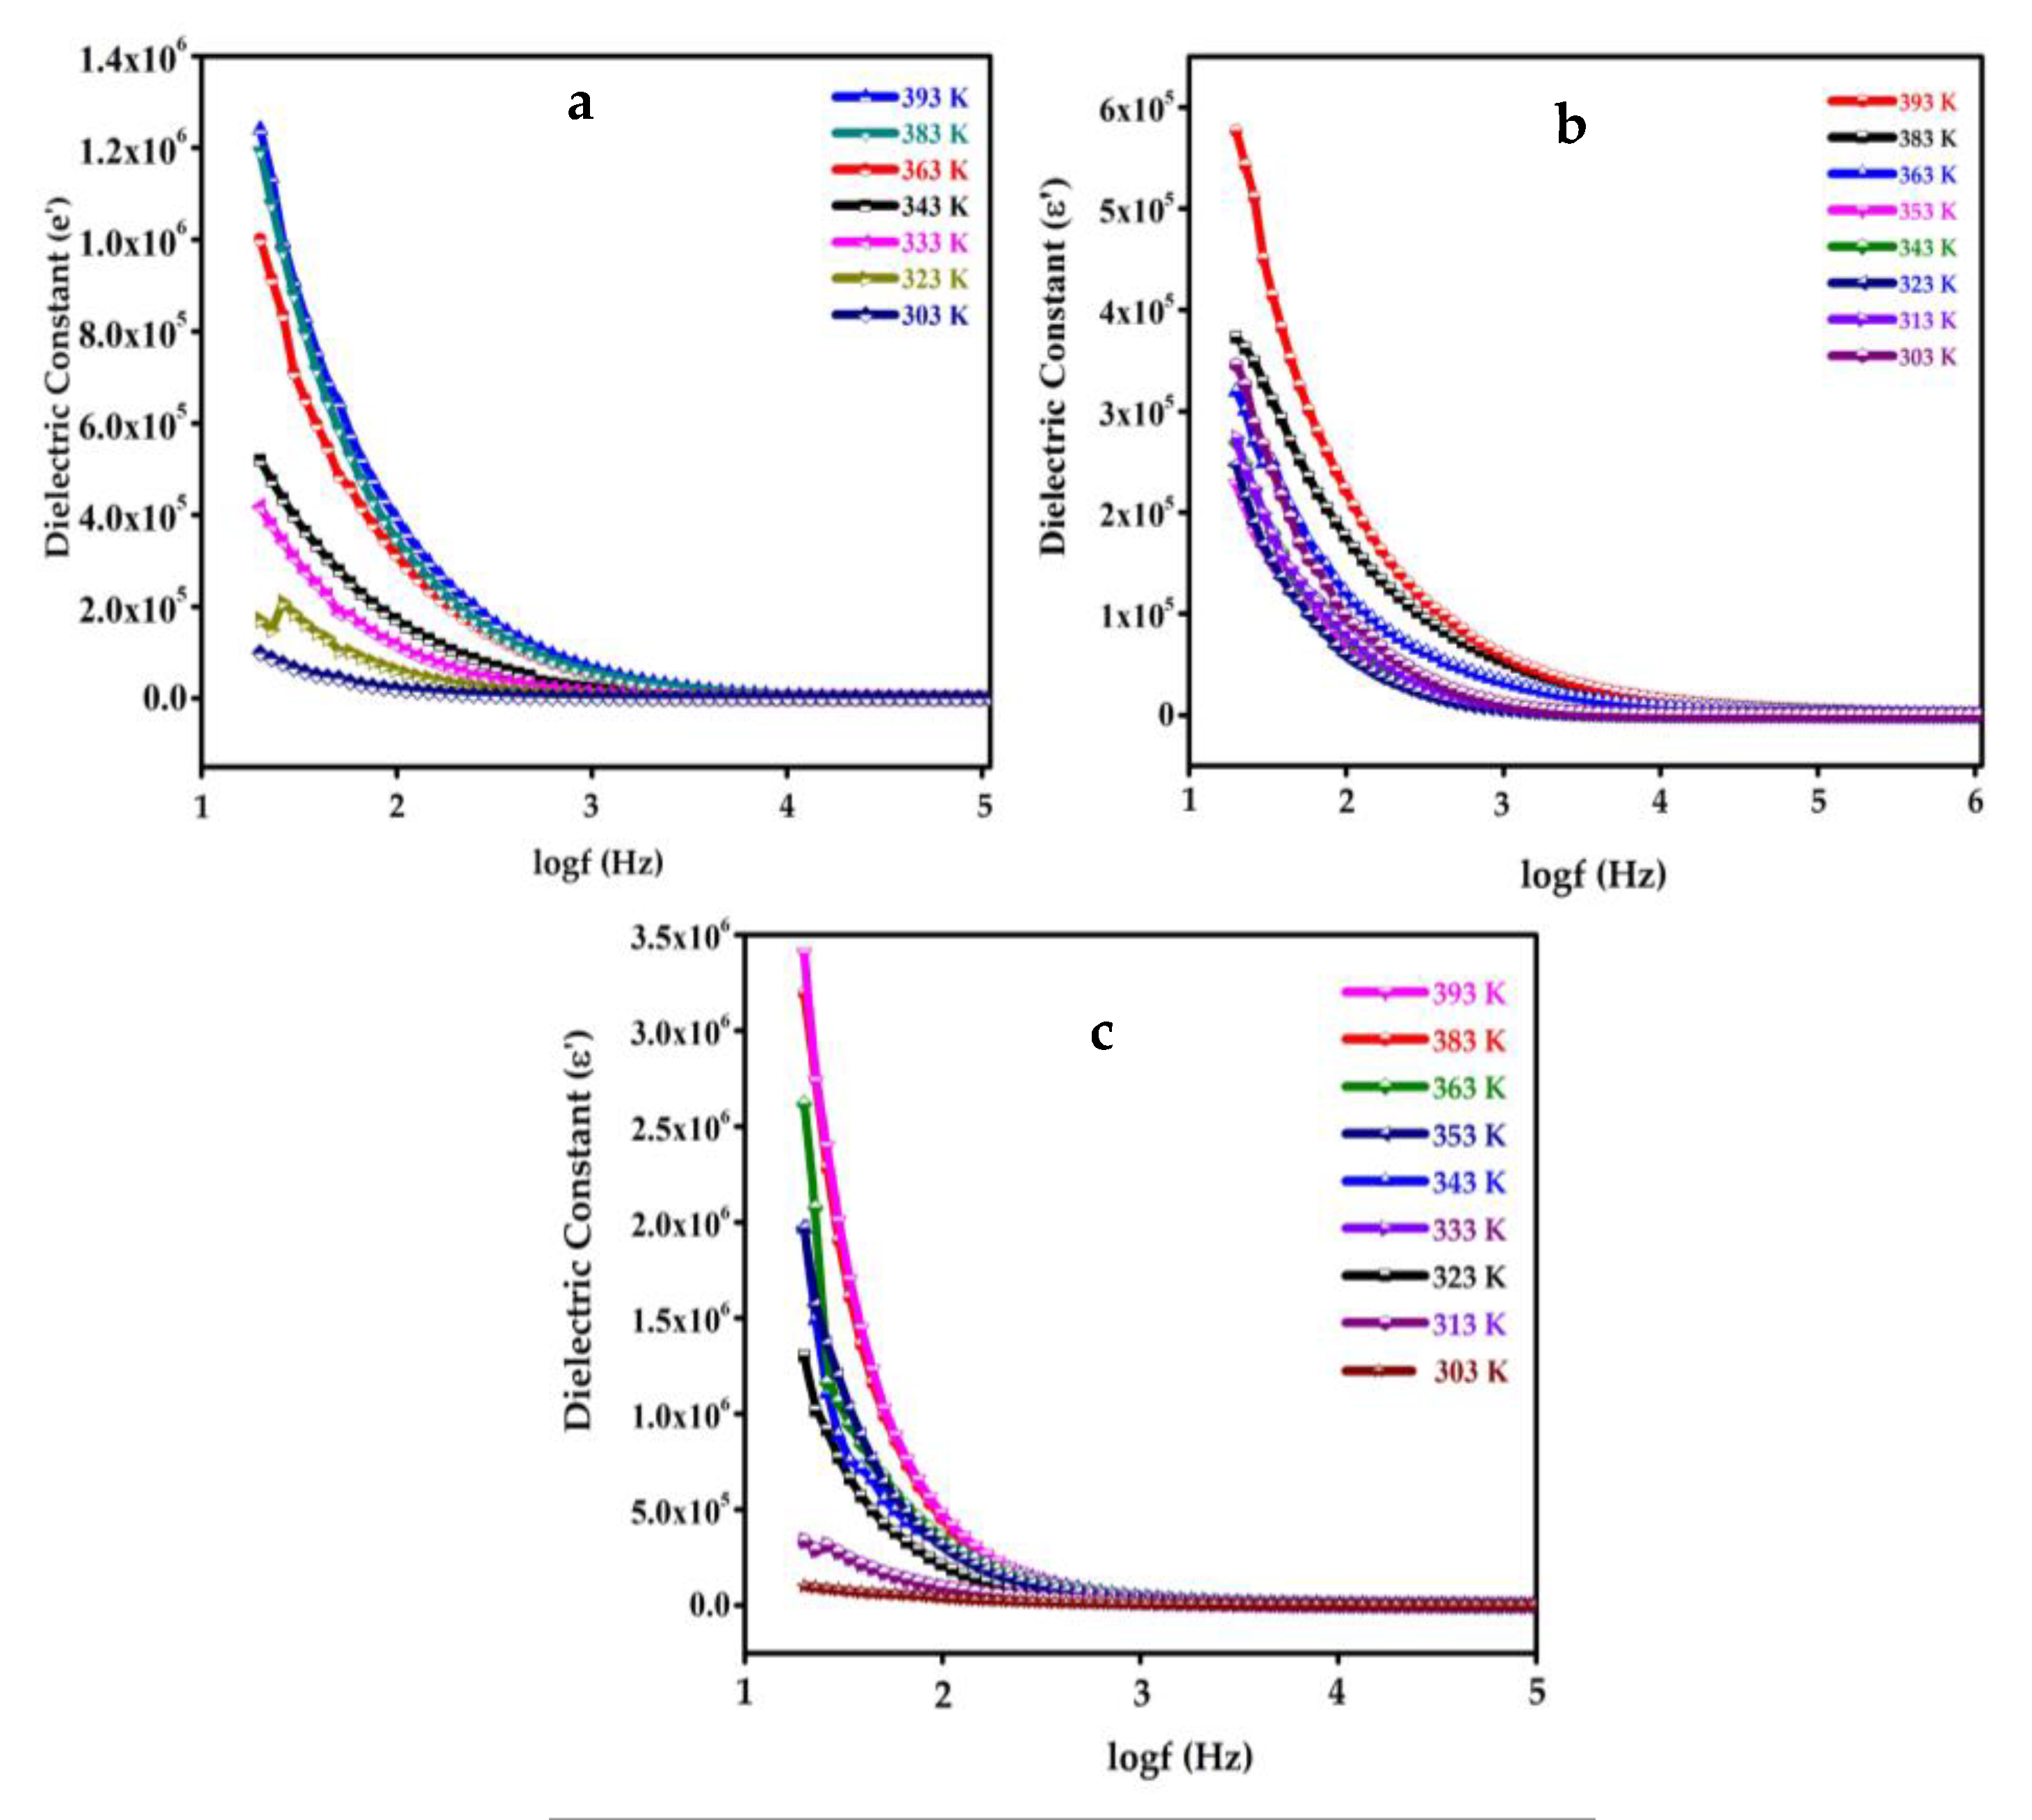
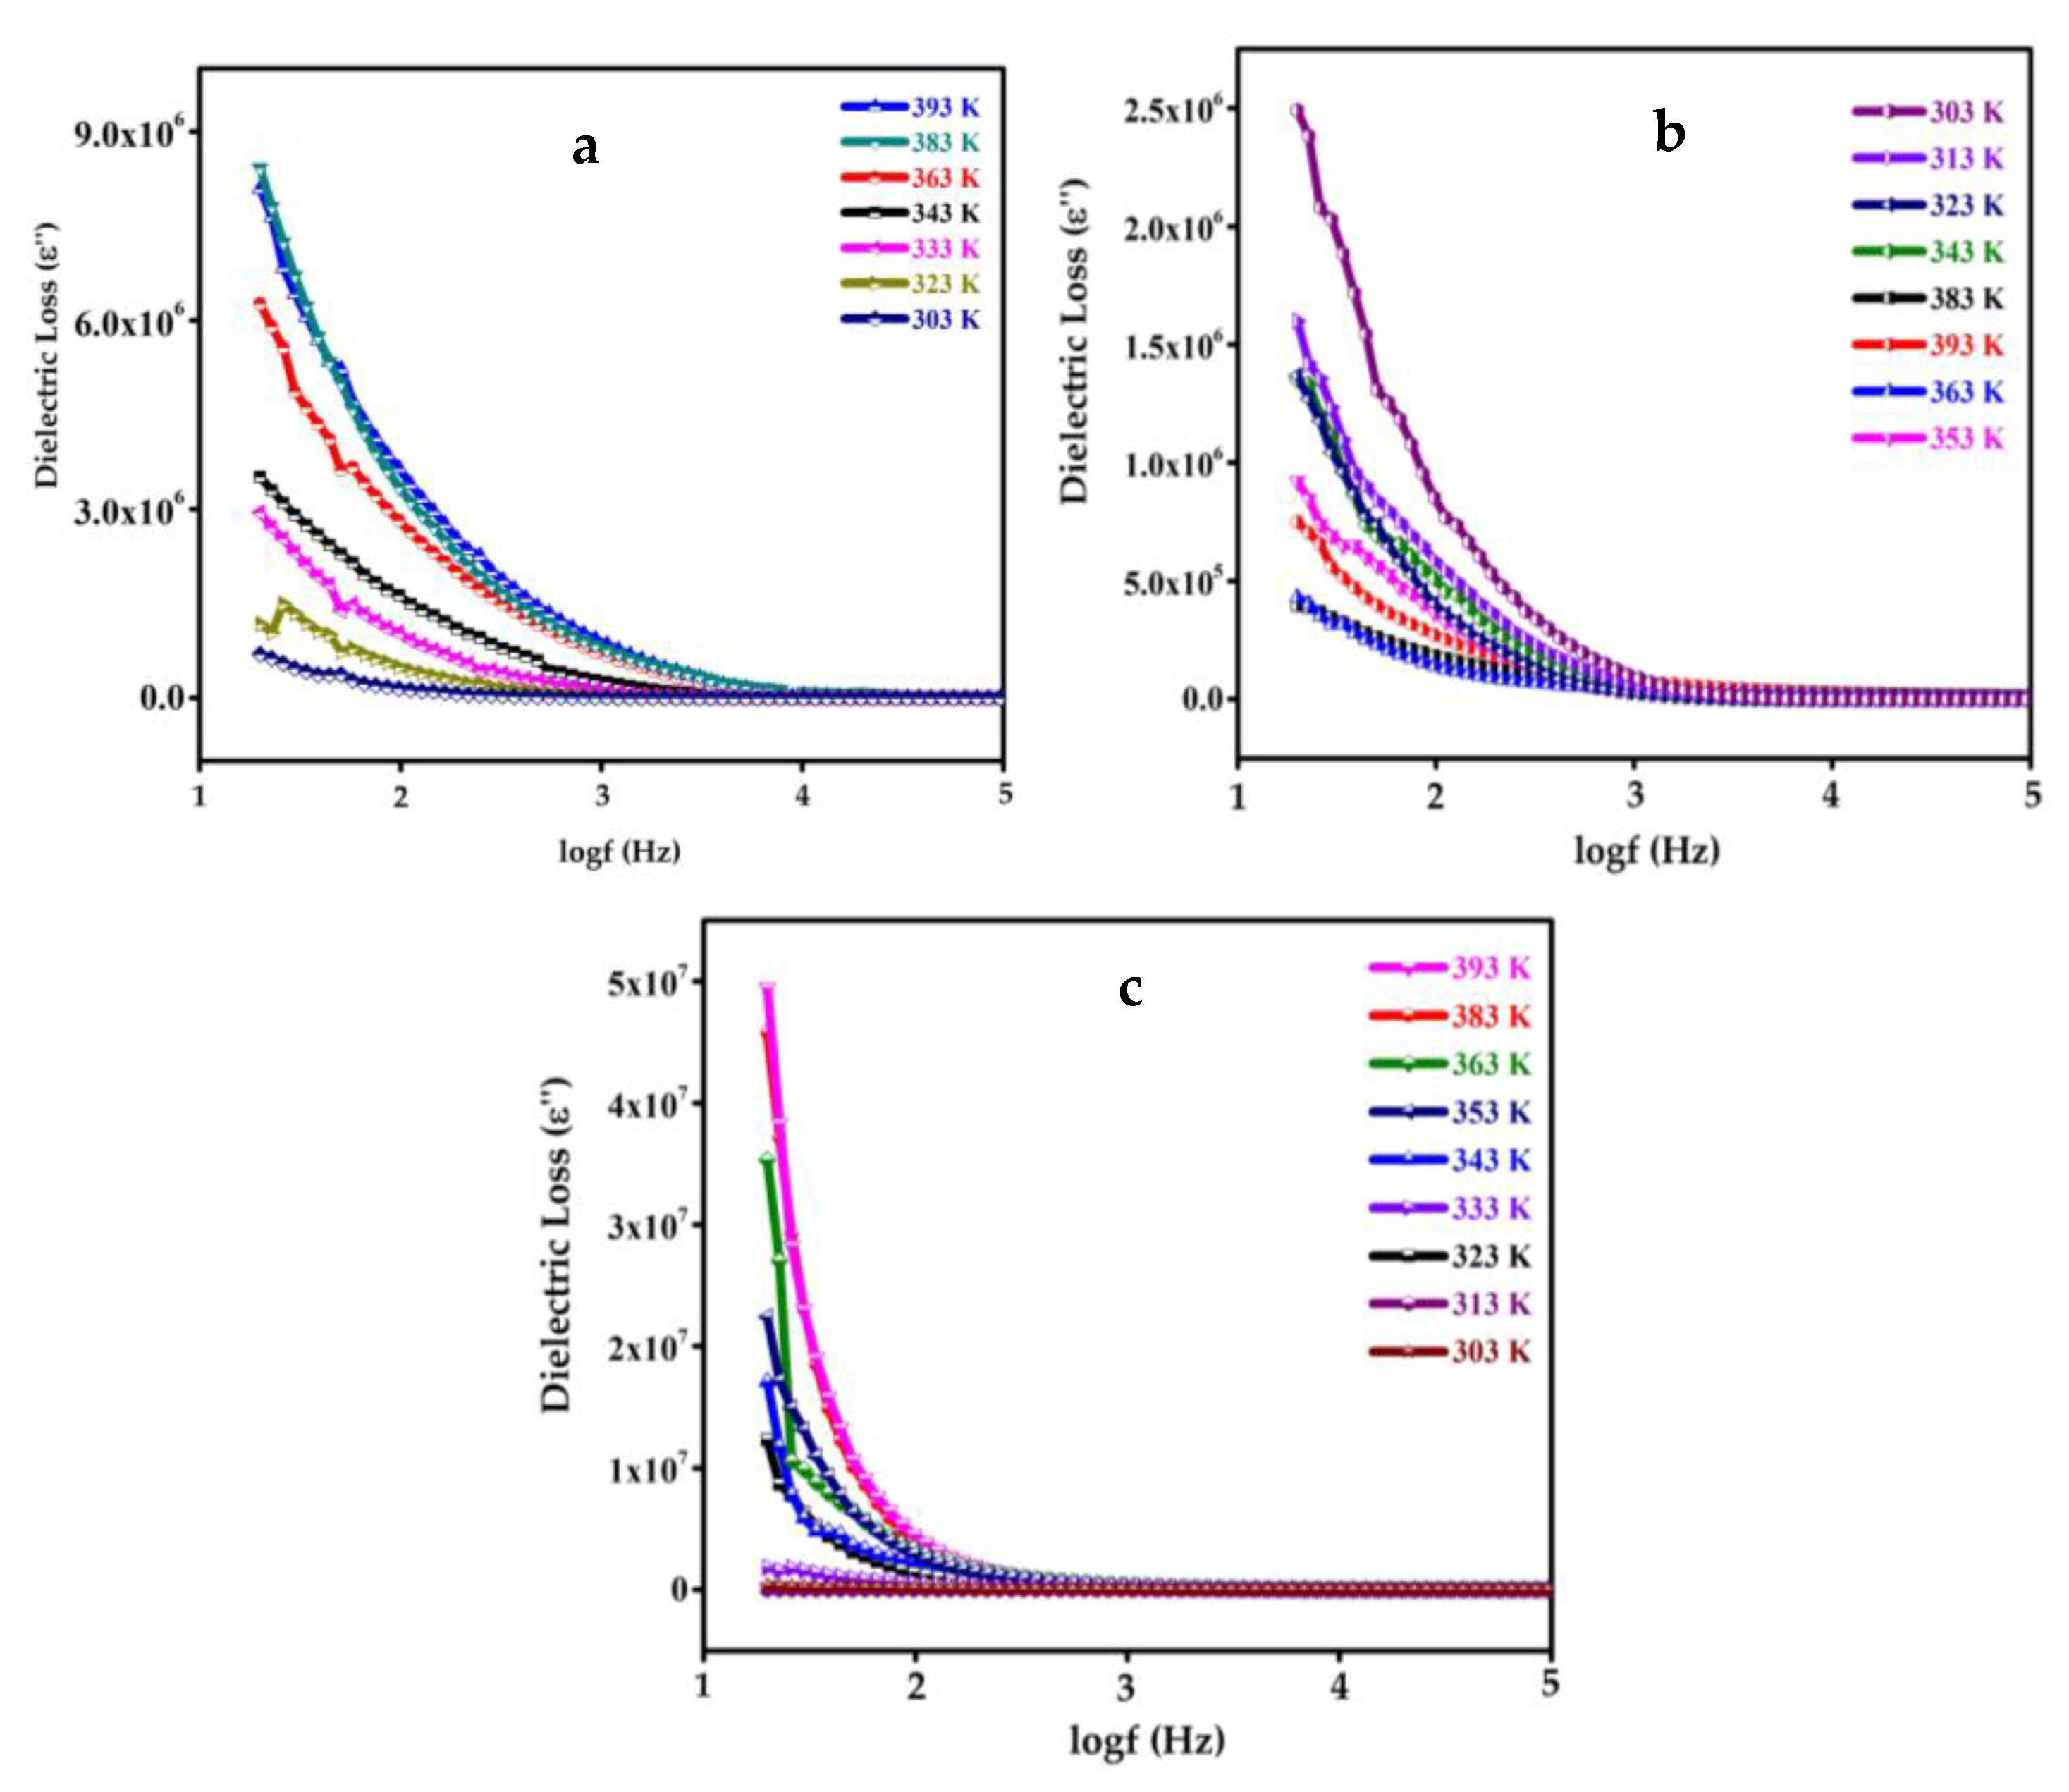
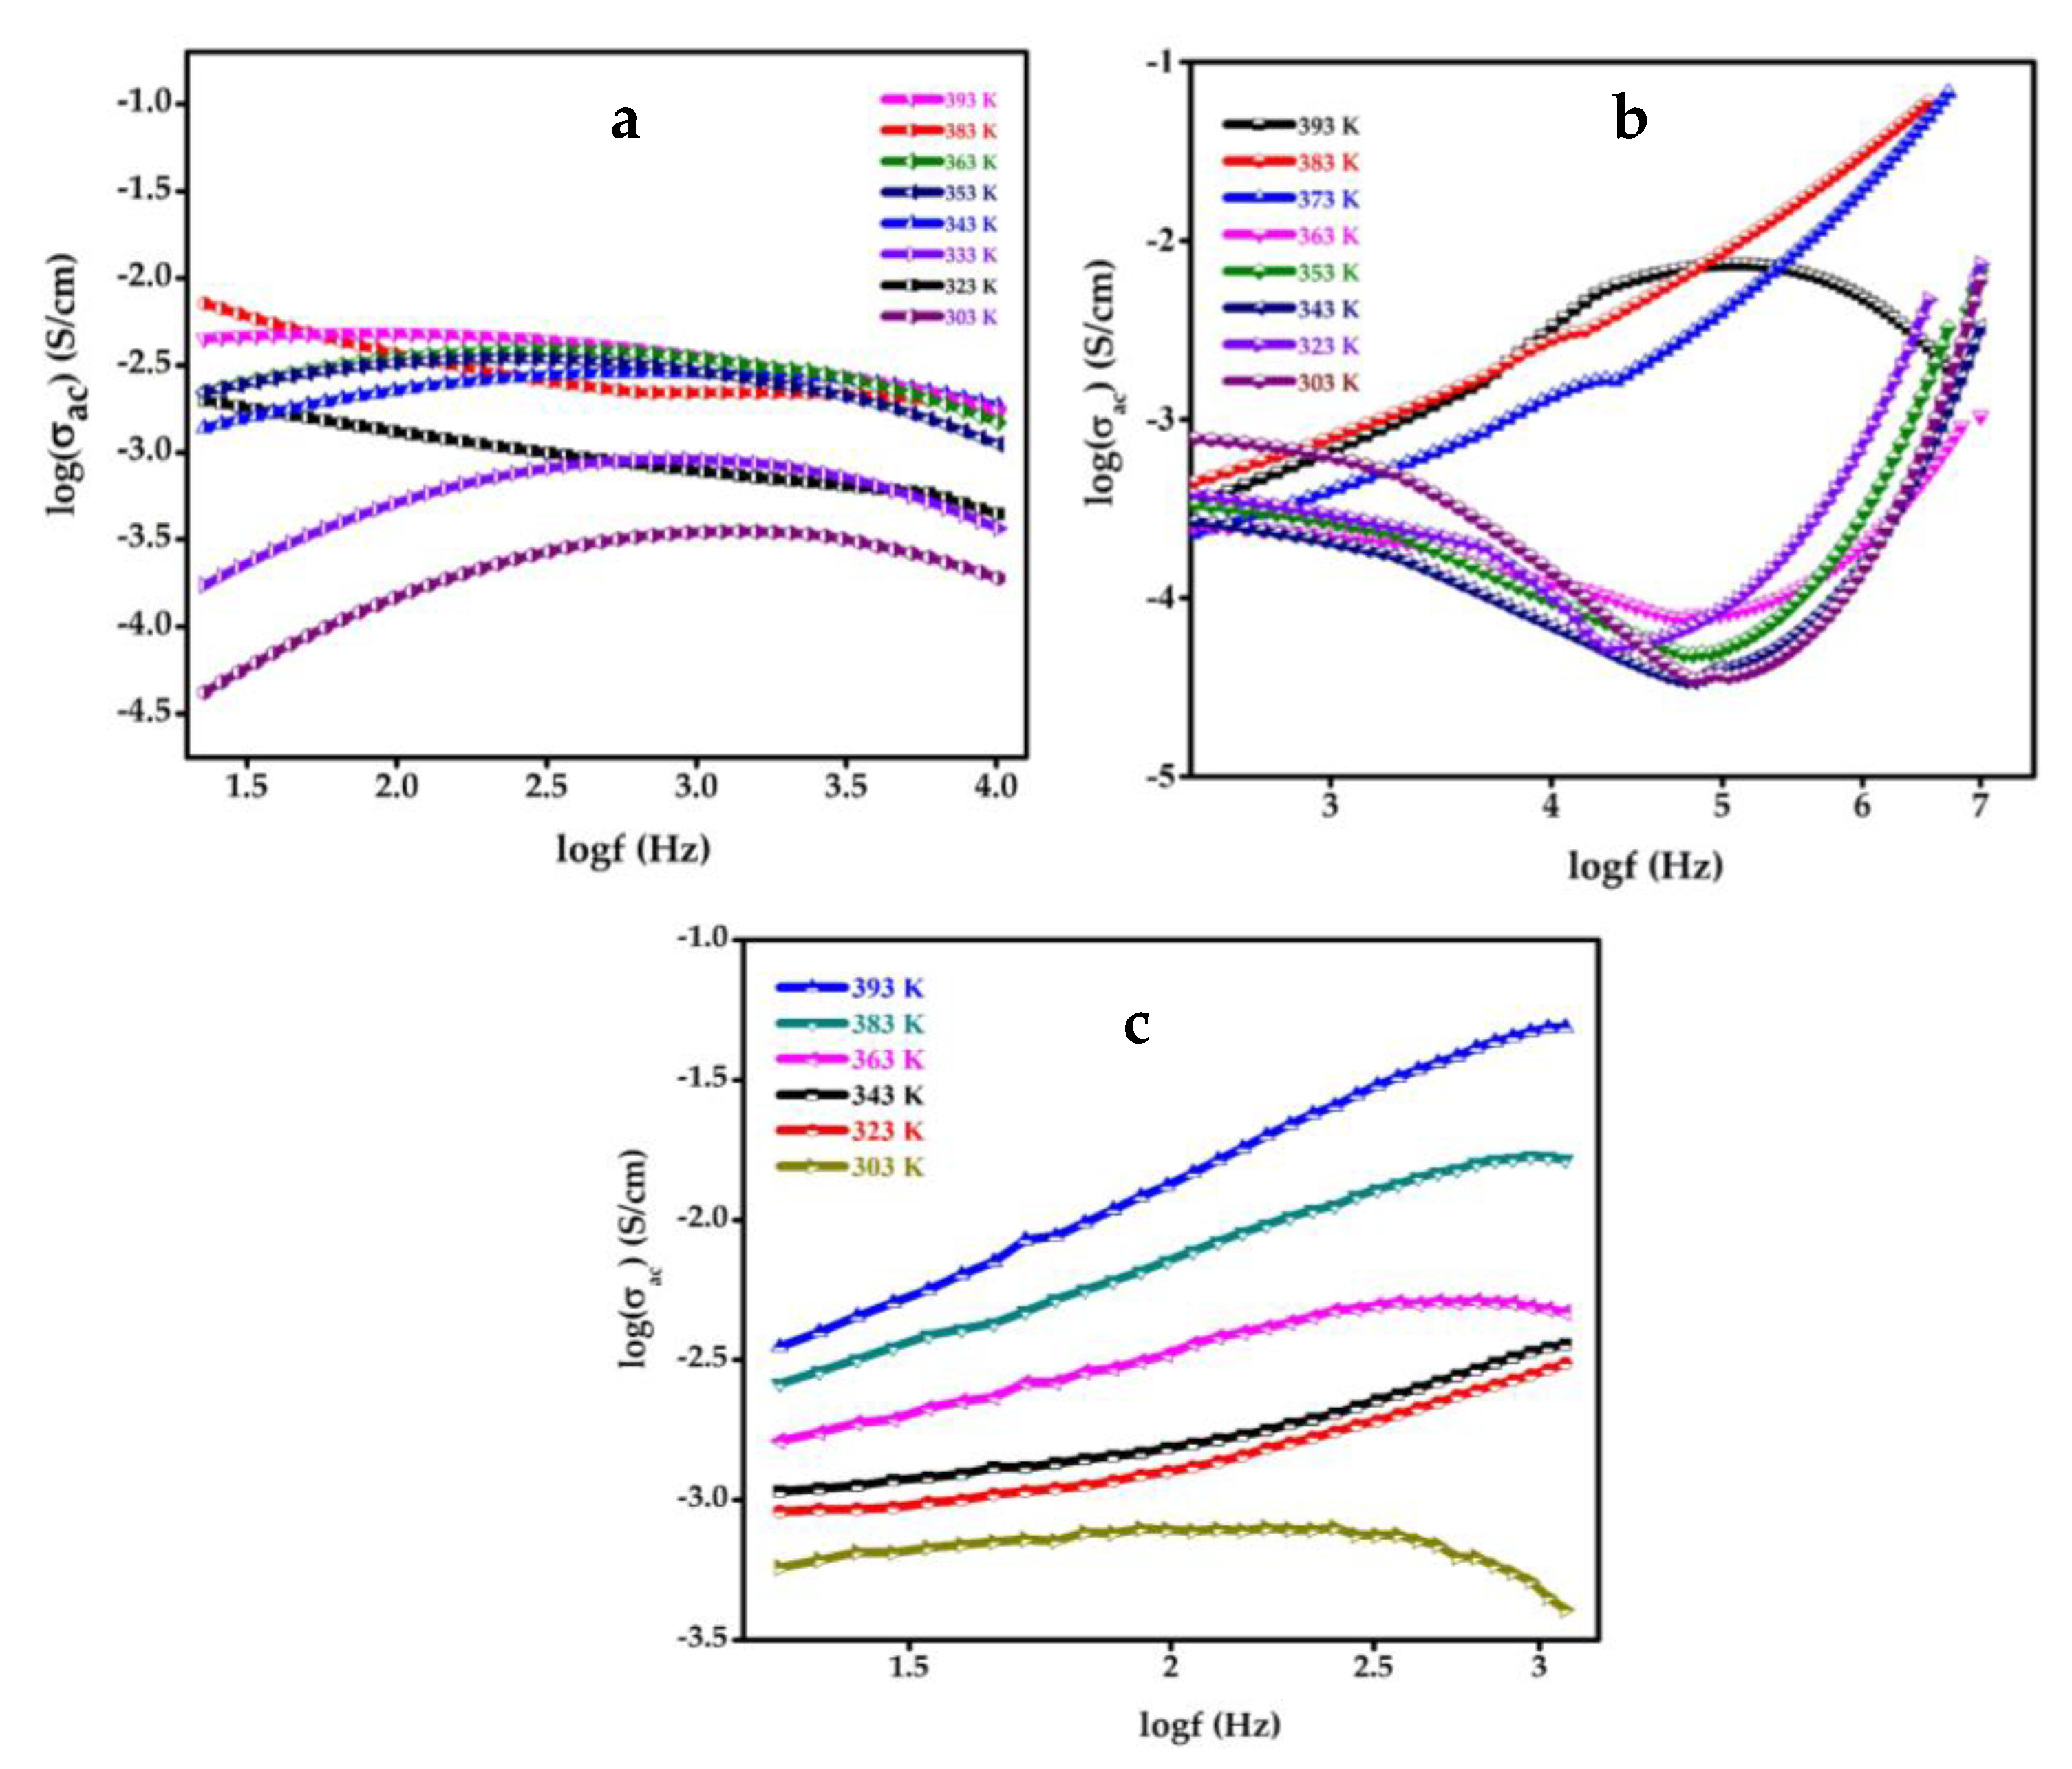
4.9. Dielectric Study of SnO2, GO, SGP2 Composite Film
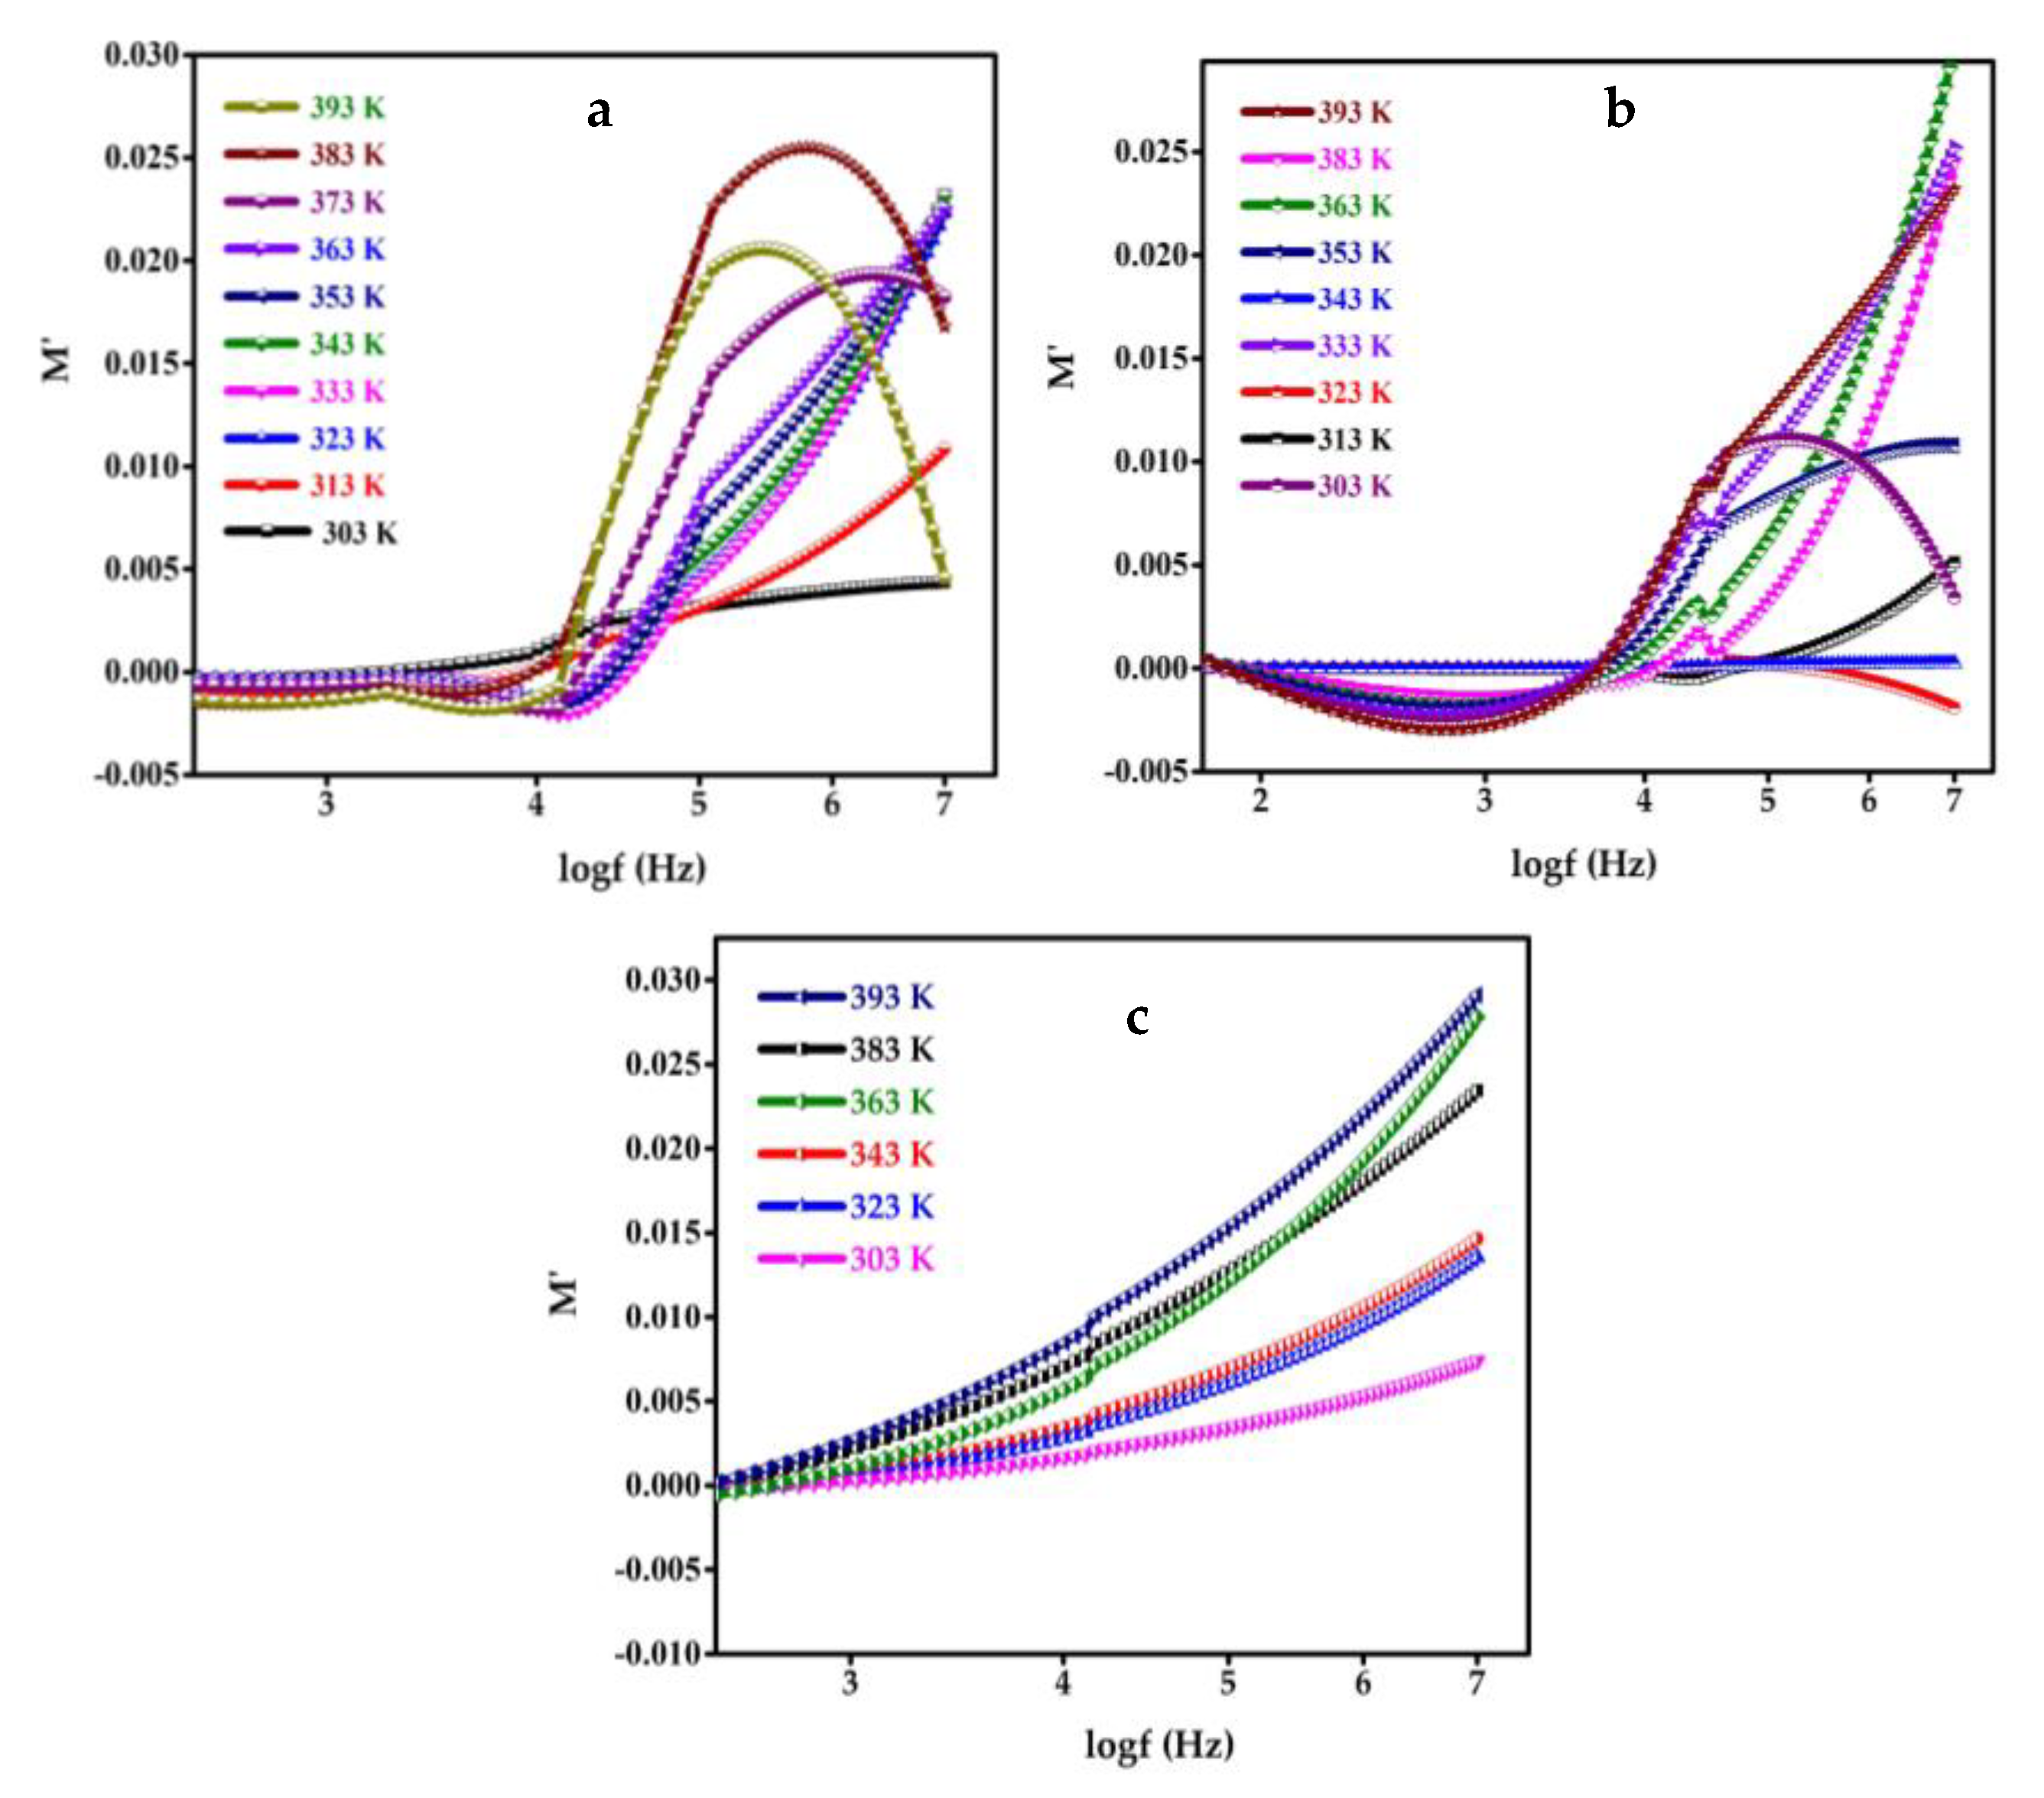
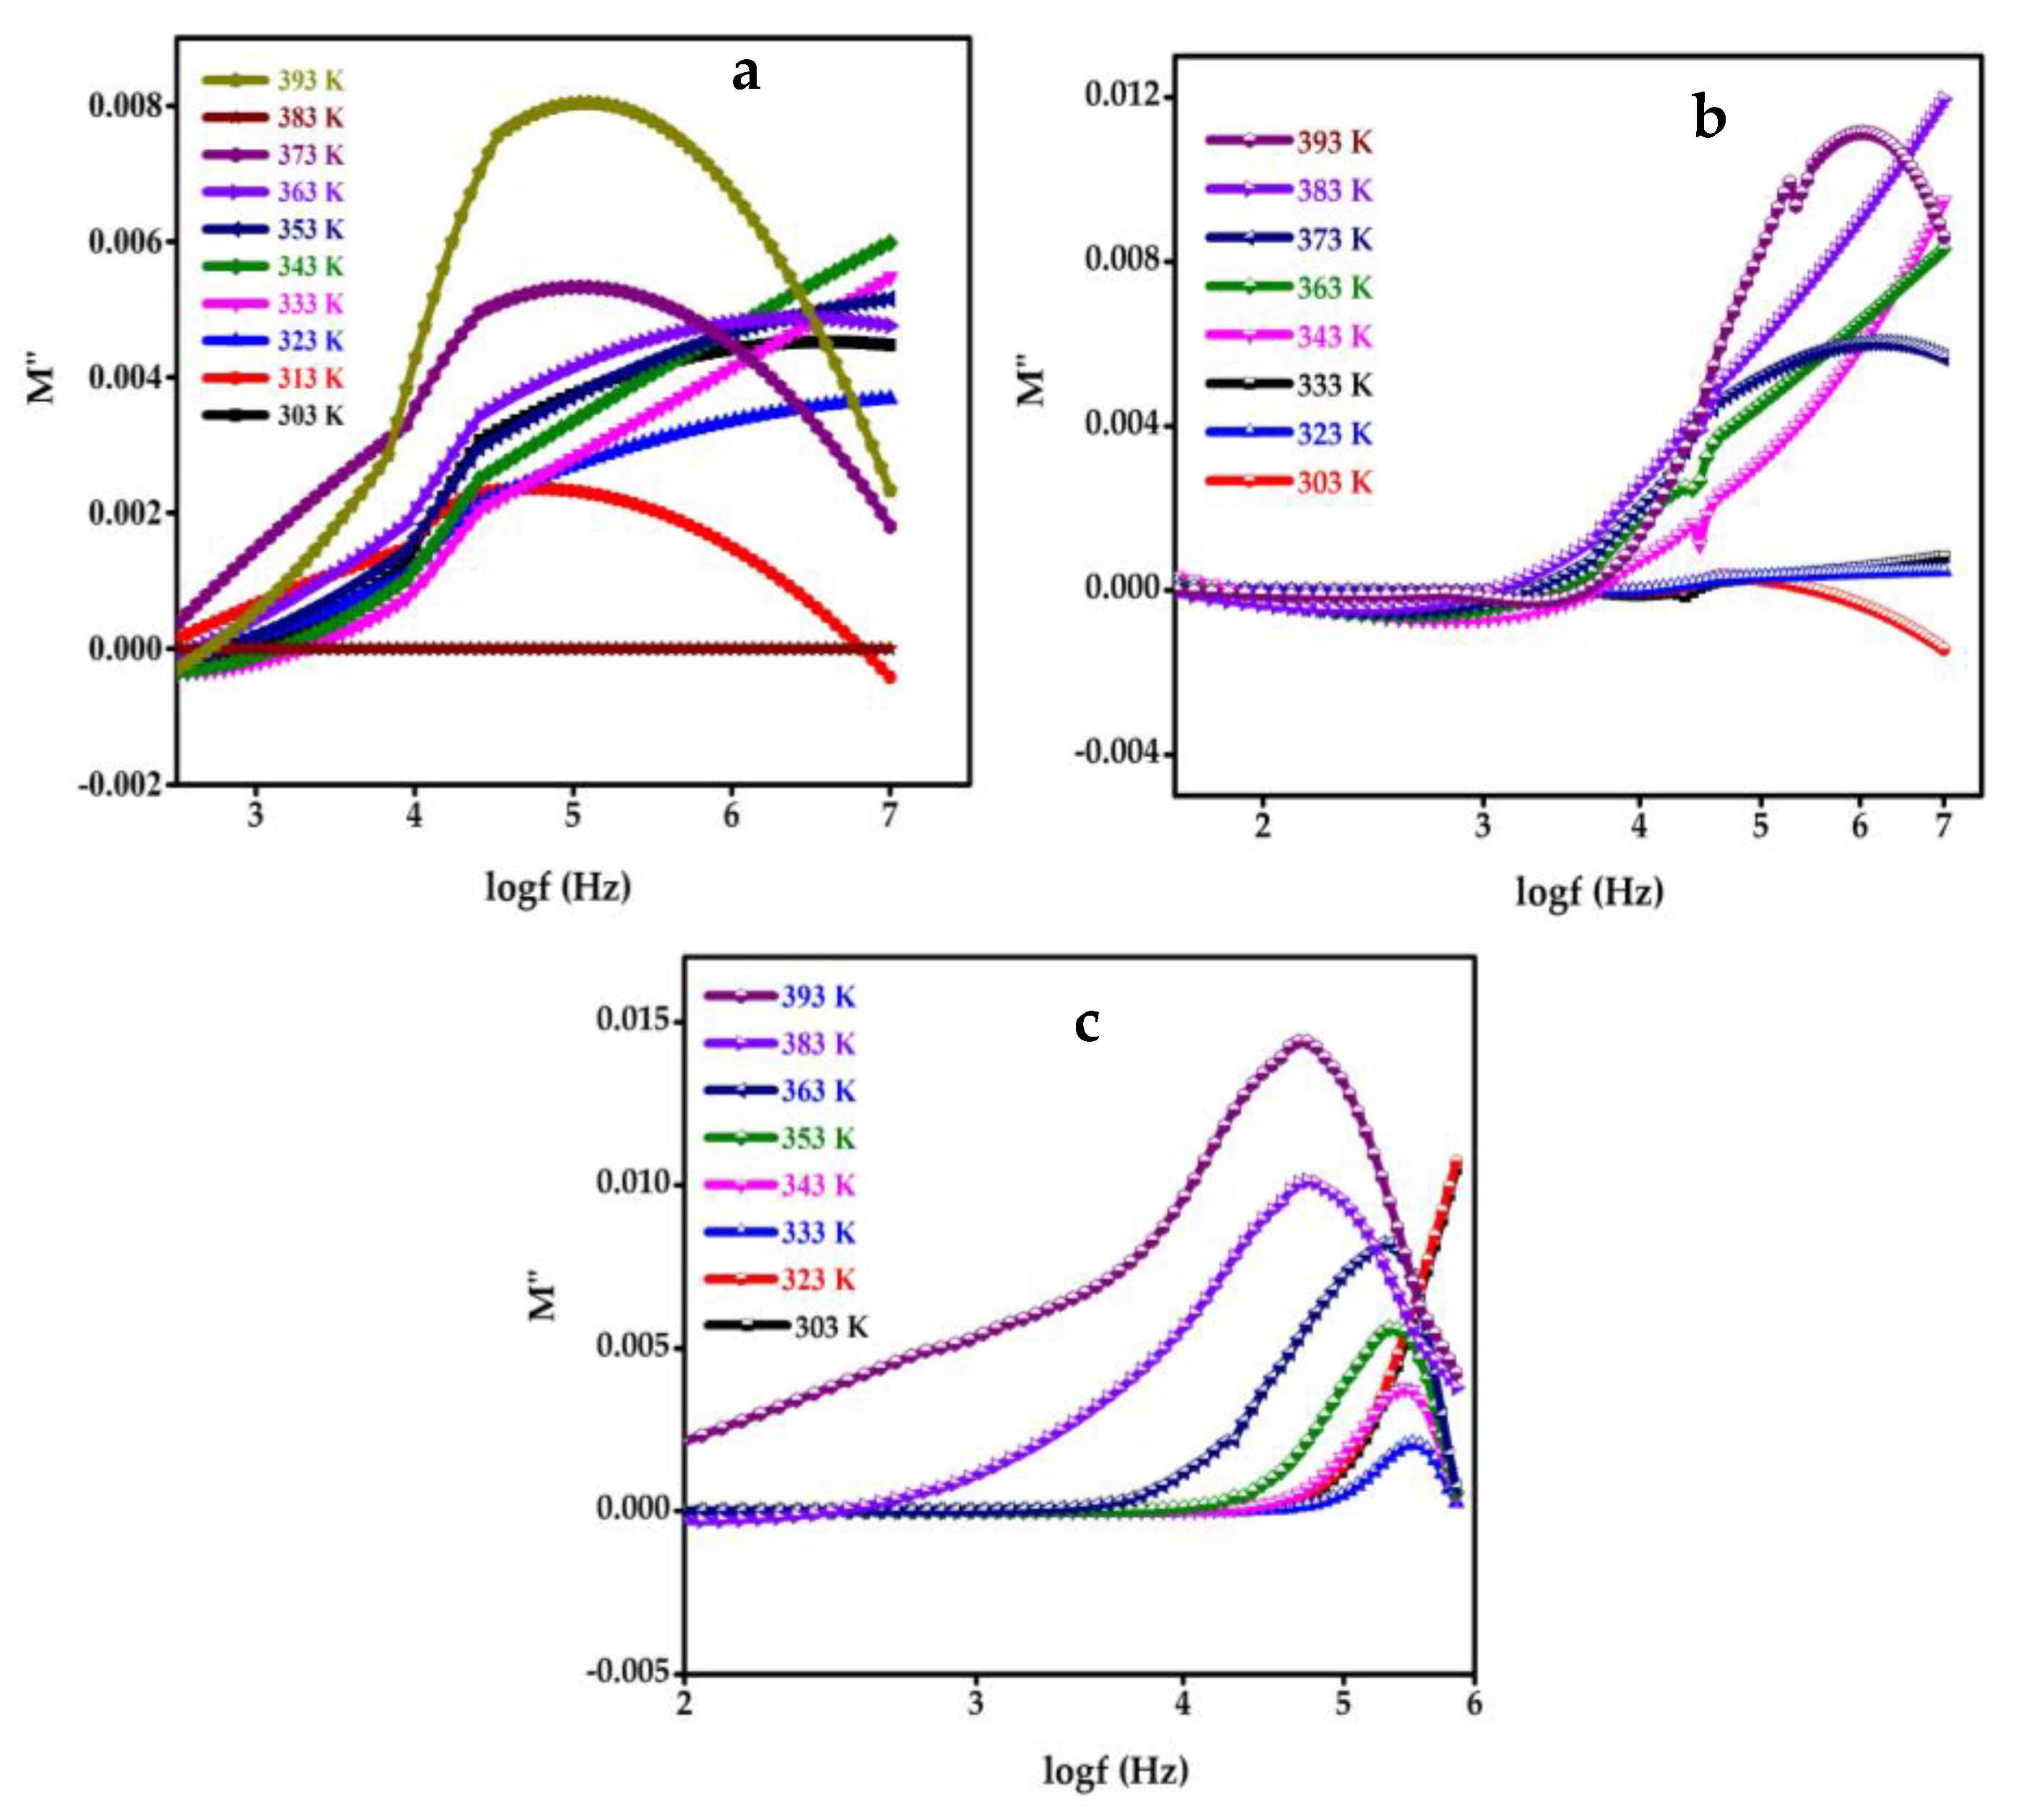
5. Modulus Study
6. Conclusions
Author Contributions
Funding
Institutional Review Board Statement
Informed Consent Statement
Data Availability Statement
Acknowledgments
Conflicts of Interest
References
- Kumar, J.S.; Murmu, N.C.; Kuila, T. Recent trends in the graphene-based sensors for the detection of hydrogen peroxide. AIMS Mater. Sci. 2018, 5, 422–466. [Google Scholar] [CrossRef]
- Halliwell, B.; Clement, M.V.; Long, L.H. Hydrogen peroxide in the human body. FEBS Lett. 2000, 486, 10–13. [Google Scholar] [CrossRef]
- Yusoff, N.; Rameshkumar, P.; Mehmood, M.S.; Pandikumar, A.; Lee, H.W.; Huang, N.M. Ternary nanohybrid of reduced graphene oxide-nafion@silver nanoparticles for boosting the sensor performance in non-enzymatic amperometric detection of hydrogen peroxide. Biosens. Bioelectron. 2017, 87, 1020–1028. [Google Scholar] [CrossRef] [PubMed]
- Gurusamy, T.; Rajaram, R.; Murugan, R.; Ramanujam, K. A web of poly (bisbenzimidazolatocopper (ii)) around multiwalled carbon nanotubes for the electrochemical detection of hydrogen peroxide. New J. Chem. 2022, 46, 1222–1231. [Google Scholar] [CrossRef]
- Xing, L.; Zhang, W.; Fu, L.; Lorenzo, J.M.; Hao, Y. Fabrication and application of electrochemical sensor for analyzing hydrogen peroxide in food system and biological samples. Food Chem. 2022, 385, 132555. [Google Scholar] [CrossRef] [PubMed]
- Tsiafoulis, C.G.; Trikalitis, P.N.; Prodromidis, M.I. Synthesis, characterization and performance of vanadium hexacyanoferrate as electrocatalyst of H2O2. Electrochem. Commun. 2005, 7, 1398–1404. [Google Scholar] [CrossRef]
- Ma, J.; Song, W.; Chen, C.; Ma, W.; Zhao, J.; Tang, Y. Fenton degradation of organic compounds promoted by dyes under visible irradiation. Environ. Sci. Technol. 2005, 39, 5810–5815. [Google Scholar] [CrossRef]
- Jiang, G.; Tang, H.; Zhu, L.; Zhang, J.; Lu, B. Improving electrochemical properties of liquid phase deposited TiO2 thin films by doping sodium dodecylsulfonate and its application as bioelectrocatalytic sensor for hydrogen peroxide. Sens. Actuators B Chem. 2009, 138, 607–612. [Google Scholar] [CrossRef]
- Lou, X.; Zhu, C.; Pan, H.; Ma, J.; Zhu, S.; Zhang, D.; Jiang, X. Cost-effective three-dimensional graphene/Ag aerogel composite for high-performance sensing. Electrochim. Acta 2016, 205, 70–76. [Google Scholar] [CrossRef]
- Cheng, C.; Huang, Y.; Wang, N.; Jiang, T.; Hu, S.; Zheng, B.; Yuan, H.; Xiao, D. Facile Fabrication of Mn2O3 Nanoparticle-Assembled Hierarchical Hollow Spheres and Their Sensing for Hydrogen Peroxide. ACS Appl. Mater. Interfaces 2015, 7, 9526–9533. [Google Scholar] [CrossRef]
- Zhao, D.; Xu, C. A nanoporous palladium-nickel alloy with high sensing performance towards hydrogen peroxide and glucose. J. Colloid Interface Sci. 2015, 447, 50–57. [Google Scholar] [CrossRef] [PubMed]
- Vijeth, H.; Ashokkumar, S.P.; Yesappa, L.; Vandana, M.; Devendrappa, H. Camphor sulfonic acid surfactant assisted polythiophene nanocomposite for efficient electrochemical hydrazine sensor. Mater. Res. Express 2020, 6, 125375. [Google Scholar]
- Xu, F.; Liu, Y.; Ding, G.; Deng, M.; Chen, S.; Wang, L. Three dimensional macroporous poly(3,4-ethylenedioxythiophene) structure: Electrodeposited preparation and sensor application. Electrochim. Acta 2014, 150, 223–231. [Google Scholar] [CrossRef]
- Harlin, A.; Ferenets, M. Introduction to conductive materials. In Intelligent Textiles and Clothing; Elsevier: Amsterdam, The Netherlands, 2006; pp. 217–238. [Google Scholar]
- Skompska, M. Hybrid conjugated polymer/semiconductor photovoltaic cells. Synth. Met. 2010, 160, 1–15. [Google Scholar] [CrossRef]
- Harraz, F.A. Electrochemical formation of a novel porous silicon/polypyrrole hybrid structure with enhanced electrical and optical characteristics. J. Electroanal. Chem. 2014, 729, 68–74. [Google Scholar] [CrossRef]
- Najib, S.; Baken, F.; Abdullayeva, N.; Bahariqushchi, R.; Kasap, S.; Franzò, G.; Sankir, M.; Sankir, N.D.; Mirabella, S.; Erdem, E. Tailoring morphology to control defect structures in ZnO electrodes for high-performance supercapacitor devices. Nanoscale 2020, 12, 16162–16172. [Google Scholar] [CrossRef]
- Vandana, M.; Veeresh, S.; Ganesh, H.; Nagaraju, Y.S.; Vijeth, H.; Basappa, M.; Davendrappa, H. Graphene oxide decorated SnO2 quantum dots/polypyrrole ternary composites towards symmetric supercapacitor application. J. Energy Storage 2022, 46, 103904. [Google Scholar] [CrossRef]
- Zhu, H.; Yang, D.; Yu, G.; Zhang, H.; Yao, K. A simple hydrothermal route for synthesizing SnO2quantum dots. Nanotechnology 2006, 17, 2386–2389. [Google Scholar] [CrossRef]
- Lee, E.J.H.; Ribeiro, C.; Giraldi, T.R.; Longo, E.; Leite, E.R.; Varela, J.A. Photoluminescence in quantum-confined SnO2 nanocrystals: Evidence of free exciton decay. Appl. Phys. Lett. 2004, 84, 1745–1747. [Google Scholar] [CrossRef]
- Sato, T. Science, Technology and Advanced Application of Supercapacitors; BoD—Books on Demand: Norderstedt, Germany, 2019. [Google Scholar]
- Hu, Y.; Li, F.; Han, D.; Niu, L. Biocompatible Graphene for Bioanalytical Applications; Springer: Berlin/Heidelberg, Germany, 2014. [Google Scholar]
- Kang, X.; Wang, J.; Wu, H.; Aksay, I.A.; Liu, J.; Lin, Y. Glucose oxidase-graphene-chitosan modified electrode for direct electrochemistry and glucose sensing. Biosens. Bioelectron. 2009, 25, 901–905. [Google Scholar] [CrossRef] [PubMed]
- He, J.; Jiang, Y.; Peng, J.; Li, C.; Yan, B.; Wang, X. Fast synthesis of hierarchical cuprous oxide for nonenzymatic glucose biosensors with enhanced sensitivity. J. Mater. Sci. 2016, 51, 9696–9704. [Google Scholar] [CrossRef]
- Zhang, X.; Wang, J.; Liu, J.; Wu, J.; Chen, H.; Bi, H. Design and preparation of a ternary composite of graphene oxide/carbon dots/polypyrrole for supercapacitor application: Importance and unique role of carbon dots. Carbon 2017, 115, 134–146. [Google Scholar] [CrossRef]
- Singh, M.K.; Mathpal, M.C.; Agarwal, A. Optical properties of SnO2 quantum dots synthesized by laser ablation in liquid. Chem. Phys. Lett. 2012, 536, 87–91. [Google Scholar] [CrossRef]
- Wazir, A.H.; Kundi, I.W. Synthesis of Graphene Nano Sheets by the Rapid Reduction of Electrochemically Exfoliated Graphene Oxide Induced by Microwaves. J. Chem. Soc. Pak. 2016, 38, 11–16. [Google Scholar]
- Vishnuvardhan, T.K.; Kulkarni, V.R.; Basavaraja, C.; Raghavendra, S.C. Synthesis, characterization and a.c. conductivity of polypyrrole/Y2O3 composites. Bull. Mater. Sci. 2006, 29, 77–83. [Google Scholar] [CrossRef]
- Wang, W.; Hao, Q.; Lei, W.; Xia, X.; Wang, X. Graphene/SnO2/polypyrrole ternary nanocomposites as supercapacitor electrode materials. RSC Adv. 2012, 2, 10268–10274. [Google Scholar] [CrossRef]
- Kendall, O.; Wainer, P.; Barrow, S.; van Embden, J.; Gaspera, E.D. Fluorine-doped tin oxidecolloidal nanocrystals. Nanomaterials 2020, 10, 863. [Google Scholar] [CrossRef]
- Gupta, B.; Kumar, N.; Panda, K.; Kanan, V.; Joshi, S.; Visoly-Fisher, I. Role of oxygen functional groups in reduced graphene oxide for lubrication. Sci. Rep. 2017, 7, 45030. [Google Scholar] [CrossRef]
- Liu, H.; Chen, Z.; Wang, H.; Ye, F.; Ma, J.; Zheng, X.; Gui, P.; Xiong, L.; Wen, J.; Fang, G. A facile room temperature solution synthesis of SnO2 quantum dots for perovskite solar cells. J. Mater. Chem. A Mater. Energy Sustain. 2019, 7, 10636–10643. [Google Scholar] [CrossRef]
- Yuan, Y.-G.; Gurunathan, S. Combination of graphene oxide-silver nanoparticle nanocomposites and cisplatin enhances apoptosis and autophagy in human cervical cancer cells. Int. J. Nanomed. 2017, 12, 6537–6558. [Google Scholar] [CrossRef]
- Liu, Y.; Wang, L.; Yang, L.; Zhan, Y.; Zou, L.; Ye, B. Nonenzymatic H2 O2 electrochemical sensor based on SnO2 -NPs coated polyethylenimine functionalized graphene. Electroanalysis 2017, 29, 2044–2052. [Google Scholar] [CrossRef]
- Salimi, A.; Hallaj, R.; Soltanian, S.; Mamkhezri, H. Nanomolar detection of hydrogen peroxide on glassy carbon electrode modified with electrodeposited cobalt oxide nanoparticles. Anal. Chim. Acta 2007, 594, 24–31. [Google Scholar] [CrossRef] [PubMed]
- Xu, C.; Sun, F.; Gao, H.; Wang, J. Nanoporous platinum-cobalt alloy for electrochemical sensing for ethanol, hydrogen peroxide, and glucose. Anal. Chim. Acta 2013, 780, 20–27. [Google Scholar] [CrossRef] [PubMed]
- Zhang, T.; Yuan, R.; Chai, Y.; Li, W.; Ling, S. A Novel Nonenzymatic Hydrogen Peroxide Sensor Based on a Polypyrrole Nanowire-Copper Nanocomposite Modified Gold Electrode. Sensors 2008, 8, 5141–5152. [Google Scholar] [CrossRef]
- Rashed, M.A.; Faisal, M.; Harraz, F.A.; Jalalah, M.; Alsaiari, M.; Alsareii, S.A. A highly efficient nonenzymatic hydrogen peroxide electrochemical sensor using mesoporous carbon doped ZnO nanocomposite. J. Electrochem. Soc. 2021, 2, 027512. [Google Scholar] [CrossRef]
- Asif, S.A.B.; Khan, S.B.; Asiri, A.M. Electrochemical sensor for H2O2 using a glassy carbon electrode modified with a nanocomposite consisting of graphene oxide, cobalt (III) oxide, horseradish peroxidase and nafion. Microchim. Acta 2016, 11, 3043–3052. [Google Scholar] [CrossRef]
- Akhtar, M.A.; Hayat, A.; Iqbal, N.; Marty, J.L.; Nawaz, M.H. Functionalized graphene oxide–polypyrrole–chitosan (fGO–PPy–CS) modified screen-printed electrodes for non-enzymatic hydrogen peroxide detection. J. Nanopart. Res. 2017, 19, 334. [Google Scholar] [CrossRef]
- Sun, Y.; He, K.; Zhang, Z.; Zhou, A.; Duan, H. Real-time electrochemical detection of hydrogen peroxide secretion in live cells by Pt nanoparticles decorated graphene-carbon nanotube hybrid paper electrode. Biosens. Bioelectron. 2015, 68, 358–364. [Google Scholar] [CrossRef]
- Rosas-Laverde, N.M.; Pruna, A.I.; Busquets-Mataix, D. Graphene Oxide-Polypyrrole Coating for Functional Ceramics. Nanomaterials 2020, 10, 1188. [Google Scholar] [CrossRef]
- Khan, S.; Zulqifar; Khan, T.; Khan, R.; Khan, M.; Khattak, S.A.; Khan, G. Investigation of structural, optical, electrochemical and dielectric properties of SnO2/GO nanocomposite. J. Mater. Sci. Mater. Electron. 2019, 30, 10202–10210. [Google Scholar] [CrossRef]
- Sagadevan, S.; Podder, J. Optical and electrical properties of nanocrystalline SnO2 thin films synthesized by chemical bath deposition method. Soft Nanosci. Lett. 2015, 5, 55–64. [Google Scholar] [CrossRef]
- Peng, H.; Wang, X.; Zhao, Y.; Tan, T.; Bakenov, Z.; Zhang, Y. Synthesis of a Flexible Freestanding Sulfur/Polyacrylonitrile/Graphene Oxide as the Cathode for Lithium/Sulfur Batteries. Polymers 2018, 10, 399. [Google Scholar] [CrossRef] [PubMed]
- Sebastian, B.; Thomas, G.C.; Manoj, B. Impedance, electrical and dielectric behaviour of tin oxide nanoparticle doped with graphite, graphene oxide and reduced graphene oxide. Int. J. Electrochem. Sci. 2021, 16, 210810. [Google Scholar] [CrossRef]
- Fatima, T.; Sankarappa, T.; Ramanna, R. Electrical Transport Studies in PPy/SnO2 Composites. Int. J. Adv. Res. Phys. Sci. 2016, 3, 7–12. [Google Scholar]


| Electrode Materials | Sensing Performance | Reference | ||
|---|---|---|---|---|
| Sensitivity | Detection Limit | Linear Range | ||
| MWCNT/(BIM–Cu2+)n@GCE | 5 nA μM cm−2 | 0.78 µM | - | [4] |
| Meso-C/ZnO | 0.04648 μA μM cm−2 | 6.25 μM | 50 μM to 981 μM | [38] |
| HRP/GO-Co3O4 | 0.5 μA mM−1 | 2 mM | 1 mM to 30 mM, | [39] |
| fGO–PPy–CS | - | 1.95 μM | 2.5–200 μM | [40] |
| Pt/rGO–CNT paper | 1.41 μA μM cm−2 | 0.01 μM | 0.1–25 μM | [41] |
| SGP2 modified GCE | 11.69 µA mM cm−2 | 0.758 µM | 0.5 mM to 7.0 mM | This Work |
Publisher’s Note: MDPI stays neutral with regard to jurisdictional claims in published maps and institutional affiliations. |
© 2022 by the authors. Licensee MDPI, Basel, Switzerland. This article is an open access article distributed under the terms and conditions of the Creative Commons Attribution (CC BY) license (https://creativecommons.org/licenses/by/4.0/).
Share and Cite
Molahalli, V.; Sharma, A.; Shetty, A.; Hegde, G. SnO2QDs Deposited on GO/PPy-Modified Glassy Carbon Electrode for Efficient Electrochemical Hydrogen Peroxide Sensor. Biosensors 2022, 12, 983. https://doi.org/10.3390/bios12110983
Molahalli V, Sharma A, Shetty A, Hegde G. SnO2QDs Deposited on GO/PPy-Modified Glassy Carbon Electrode for Efficient Electrochemical Hydrogen Peroxide Sensor. Biosensors. 2022; 12(11):983. https://doi.org/10.3390/bios12110983
Chicago/Turabian StyleMolahalli, Vandana, Aman Sharma, Apoorva Shetty, and Gurumurthy Hegde. 2022. "SnO2QDs Deposited on GO/PPy-Modified Glassy Carbon Electrode for Efficient Electrochemical Hydrogen Peroxide Sensor" Biosensors 12, no. 11: 983. https://doi.org/10.3390/bios12110983
APA StyleMolahalli, V., Sharma, A., Shetty, A., & Hegde, G. (2022). SnO2QDs Deposited on GO/PPy-Modified Glassy Carbon Electrode for Efficient Electrochemical Hydrogen Peroxide Sensor. Biosensors, 12(11), 983. https://doi.org/10.3390/bios12110983