Article

Real-Time Monitoring of Breath Biomarkers with A Magnetoelastic Contactless Gas Sensor: A Proof of Concept

by
Alvaro Peña
1,*,
Juan Diego Aguilera
1,
Daniel Matatagui
1,2,3,*,
Patricia de la Presa
1,2,
Carmen Horrillo
3,
Antonio Hernando
1,4,5,6 and
Pilar Marín
1,2
1
Instituto de Magnetismo Aplicado (IMA), Universidad Complutense de Madrid-Administrador de Infraestructuras Ferroviarias (UCM-ADIF), 28230 Las Rozas, Spain
2
Departamento de Física de Materiales, Universidad Complutense de Madrid (UCM), 28040 Madrid, Spain
3
Grupo de Tecnología de Sensores Avanzados (SENSAVAN), Instituto de Tecnologías Físicas y de la Información (ITEFI), Consejo Superior de Investigaciones Científicas (CSIC), 28006 Madrid, Spain
4
Donostia International Physics Center, 20018 Donostia, Spain
5
Instituto Madrileño de Estudios Avanzados (IMDEA) Nanociencia, 28049 Madrid, Spain
6
Departamento de Ingeniería, Universidad de Nebrija, 28015 Madrid, Spain
*
Authors to whom correspondence should be addressed.
Biosensors 2022, 12(10), 871; https://doi.org/10.3390/bios12100871
Submission received: 19 August 2022 / Revised: 26 September 2022 / Accepted: 10 October 2022 / Published: 13 October 2022
(This article belongs to the Special Issue Feature Issue of Biosensors and Bioelectronic Devices Section)

Abstract

:
In the quest for effective gas sensors for breath analysis, magnetoelastic resonance-based gas sensors (MEGSs) are remarkable candidates. Thanks to their intrinsic contactless operation, they can be used as non-invasive and portable devices. However, traditional monitoring techniques are bound to slow detection, which hinders their application to fast bio-related reactions. Here we present a method for real-time monitoring of the resonance frequency, with a proof of concept for real-time monitoring of gaseous biomarkers based on resonance frequency. This method was validated with a MEGS based on a Metglass 2826 MB microribbon with a polyvinylpyrrolidone (PVP) nanofiber electrospun functionalization. The device provided a low-noise (RMS = 1.7 Hz), fast (<2 min), and highly reproducible response to humidity (Δf = 46–182 Hz for 17–95% RH), ammonia (Δf = 112 Hz for 40 ppm), and acetone (Δf = 44 Hz for 40 ppm). These analytes are highly important in biomedical applications, particularly ammonia and acetone, which are biomarkers related to diseases such as diabetes. Furthermore, the capability of distinguishing between breath and regular air was demonstrated with real breath measurements. The sensor also exhibited strong resistance to benzene, a common gaseous interferent in breath analysis.

Graphical Abstract

1. Introduction

Several gaseous pollutants, such as nitrogen dioxide, carbon monoxide, and volatile organic compounds (VOCs), are known to cause or exacerbate respiratory or other health-related problems [1,2,3,4]. Devices capable of quickly detecting these gases, even at low concentrations, are critical to minimizing exposure and, thus, preventing the associated hazards to human health [5,6].
In recent years, attention to technologies able to detect molecules in gaseous environments has awakened an enormous interest in the scientific community, especially in health-related applications [7,8,9,10]. Similarly, interest in technologies that allow development of low-cost devices with high sensitivity and low dimensionality able to detect molecules in gaseous environments has engendered substantial interest in the scientific community, especially in health-related applications. Among the most developed technologies, the solid-state chemical sensors stand out, which are based on different physical magnitudes as impedance, resistivity, and piezoelectricity [1,2,3,4], as well as those based on acoustic waves [11,12] where the detection process is based on the changes caused by acoustic waves propagating through a piezoelectric substrate where the frequency variation makes it possible to quantify the concentration of gas in the sensor environment. They show high sensitivity, fast response, low cost, and work at room temperature, but require a complex instrumentation (electrical wiring), which limits application possibilities.
The challenge is to establish new analytical systems with sufficient ability and portability as an alternative to the conventional analytical systems [13], which are accurate, but bulky, expensive, and require highly qualified operators. These facts lead to the conventional systems not being used for applications where an analytical study is required, such as air quality, safety, or medicine [14]. Among medical applications, sensing of gaseous biomarkers, molecules found in exhaled human breath which are related to abnormal biological processes or exogenous factors, is a handy tool for early diagnosis and monitoring of diseases [15,16]. Furthermore, presence of these molecules may be affected by factors such as smoking, drugs, age, diet, or body mass index [17,18,19].
For instance, ammonia generates great interest as a biomarker [20]. Abnormal ammonia concentrations in the exhaled breath have been mainly related to type 2 diabetes [21] and bacterial infection [22], kidney malfunction [23], or asthma [24].
Acetone is another important biomarker related to blood glucose concentration in diabetic patients [25,26]. Therefore, ammonia and acetone detection as gaseous biomarkers, as opposed to blood glucose meters that require punctures, could represent a non-invasive, convenient, and harmless alternative in the day-to-day monitoring of diabetic patients [21,27].
Other biomarkers may originate from exogenous factors, such as benzene. For example, significant benzene concentrations have been detected in breath as a result of smoking habits or air pollution. In such cases, this biomarker manifests the benzene accumulated in the body [18,19]. However, the particular interest in benzene stems from the fact that it can act as an interferent and disturb the operation of gas sensors targeting different biomarkers.
Another interesting analyte for gas sensors is water in the gas phase. The body naturally generates it in high concentrations; therefore, humidity sensors have become a powerful tool in biomedical applications. For example, real-time humidity monitoring allows discrimination between exhaled and regular ambient air; therefore, these biosensors would help detect irregular breathing due to sleep apnea, asthma, or cardiac arrest [10,28].
As it is well known, magnetoelastic devices greatly appeal to sensor development in biological and medical applications owing to their intrinsic wireless operation properties [29,30]. They are usually made from amorphous ferromagnetic ribbons [31] or wires [32], primarily iron-rich alloys with a combination of high mechanical strength (~1000–1700 MPa), a high magnetoelastic coupling coefficient (k), up to 0.98, and magnetostriction on the order of 10−5 (dimensionless) [33,34]. For magnetoelastic microribbons, the highest k values have been obtained by thermal annealing under a magnetic field perpendicular to the ribbon’s axis that induces a transverse homogeneous easy axis [35]. The high magnetoelastic coupling, which depends upon the ease of rotation of magnetization, allows an efficient conversion from magnetic to elastic energy and vice versa. The magnetization variation leads to the generation of mechanical stresses and deformations (Villari or magnetostrictive effect [36]) and, at the same time, the application of mechanical stresses can lead to changes in its magnetic properties, mainly related to the anisotropy and susceptibility (Joule or magnetoelastic effect [37]).
Under an alternating magnetic field, a periodic shape modification, i.e., a vibration, can be achieved. When the stationary mechanical wave matches the length of the propagation axis in the solid (such as L = n (λ/2), with n being an integer other than zero), the magnetoelastic resonance frequency appears [38]. This resonance can be extremely sensitive to several external parameters and, consequently, the transducer can act as a standalone sensor for monitoring temperature and magnetic fields [39,40], density and viscosity of a medium [41,42,43], or mechanical stresses, including tension, torsion, or pressure [33,44,45].
However, the most exciting applications for these transducers are achieved upon functionalization with sensitive layers. These layers typically consist of a material that responds to external parameters by changing its mass. As the mass of the active layer changes with an external parameter, the resonant frequency of the transducer also varies. This principle has been used to develop magnetoelastic sensors (MESs) for viruses [46], bacteria [47,48,49], biomolecules [50,51], biological processes [52,53], or gaseous molecules [54,55,56].
Magnetoelastic resonance-based gas sensors (MEGSs) are particularly appealing for breath analysis applications, as previously discussed, owing to their low cost, remote operation, and unneeded integrated power source, as they only operate under the externally applied magnetic field [38,57]. In addition, this enormous advantage means they can be easily miniaturized or made into portable sensors [58,59].
Effective diagnosis requires detecting a mixture of biomarkers, called exhaled breath profiles, which can contain more than 3000 compounds [60]. This task often requires devices with an array of sensors with different selectivity. However, such complexity falls out of the scope of the present work, which mainly focuses on the potential of MEGSs for developing real-time monitoring of exhaled breath biomarkers.
Typical MEGSs operation relies on a magnetic field frequency sweep to find the resonance frequency [54,55,56,61]. Although this technique reveals several magnetoelastic parameters, it slows down the resonant frequency monitoring (steps of tens of seconds at best), making it unable to monitor fast reactions in real time and, consequently, impeding its use in practical breath analysis applications.
This work presents a proof of concept of the development of a magnetoelastic transducer and a measuring setup able to characterize resonant frequency in real time. This transducer was functionalized with nanofibers of a sensitive polymer, polyvinylpyrrolidone (PVP), to build a sensor capable of distinguishing between regular air and exhaled breath, as well as of quantitative and reproducible detection of relative humidity (RH), acetone, and ammonia in gaseous environments in a contactless, remote manner. In addition, benzene was used to test the sensor selectivity capacity.

2. Materials and Methods

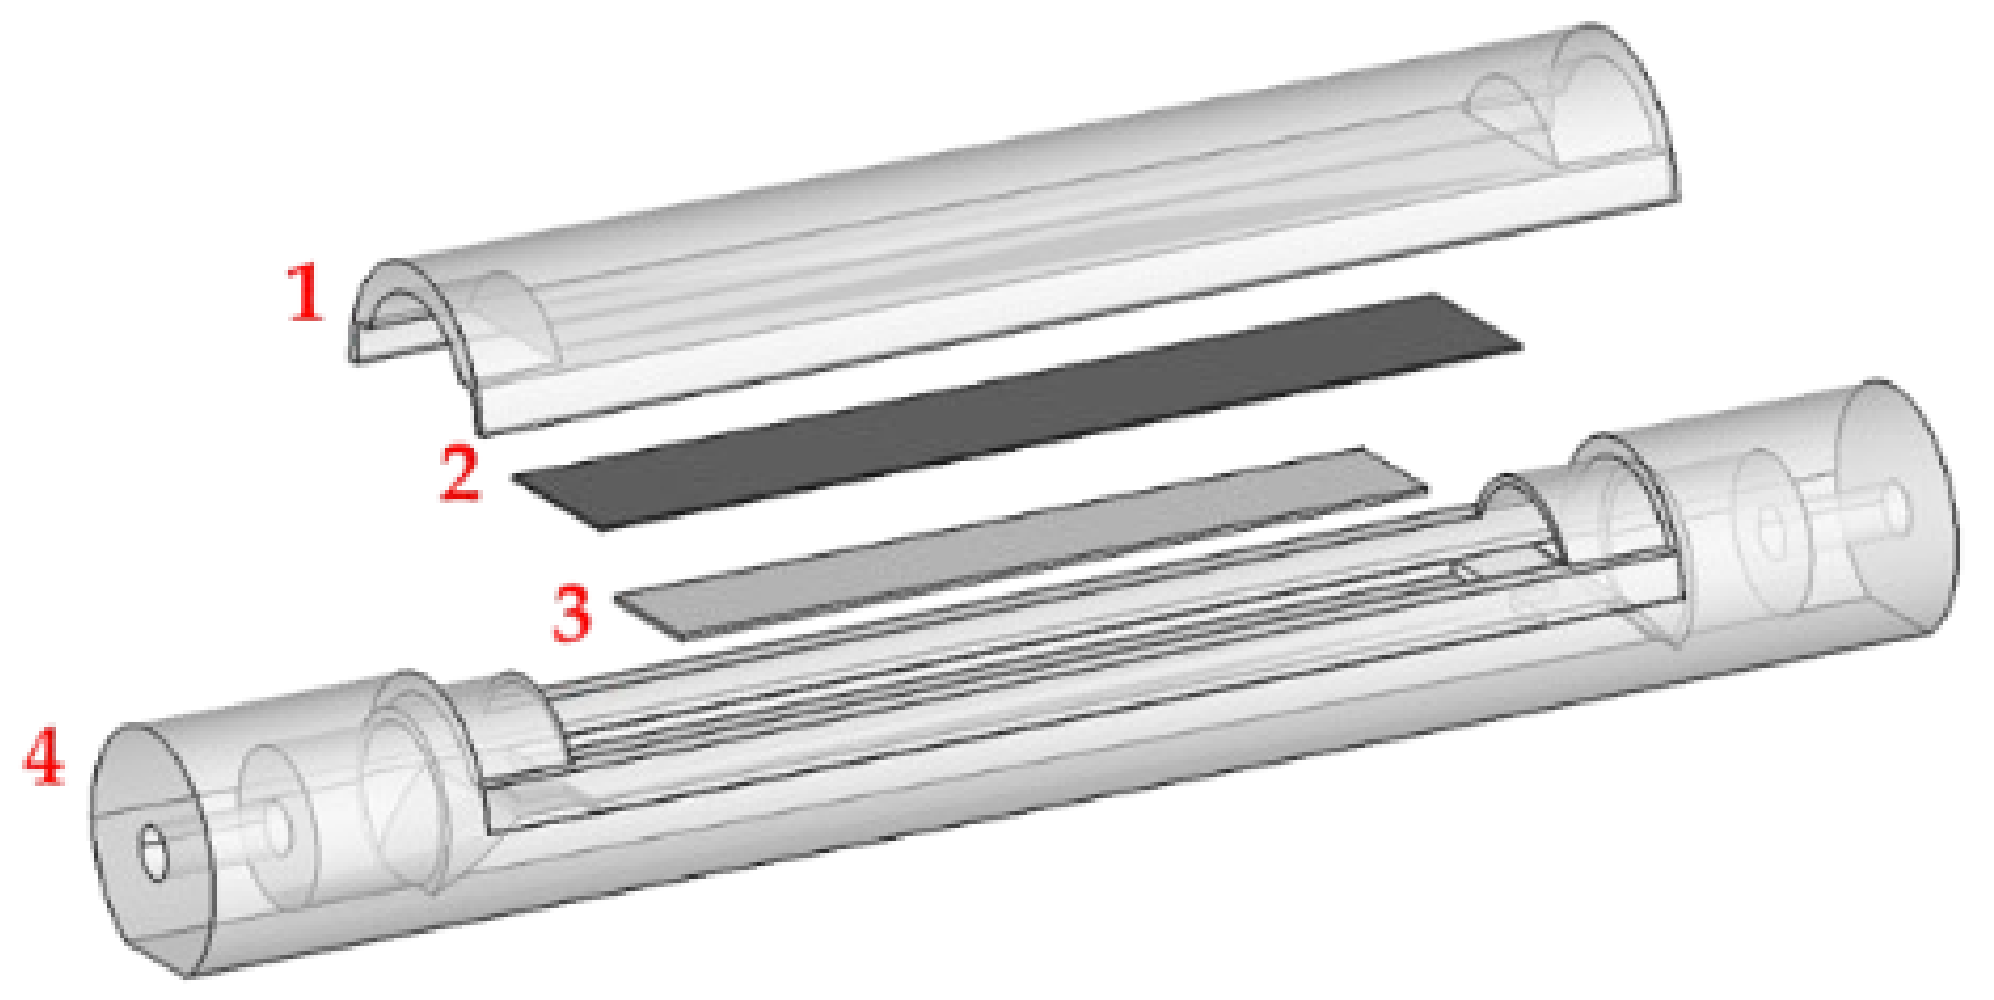
2.1. Magnetoelastic Sensor Device

The transducer used for this work was a 37.00 × 6.60 × 0.02 mm magnetoelastic microribbon (2826MB, Metglas, Conway, SC, USA).
The sensitive layer consisted of electrospun PVP nanofibers directly deposited over the microribbon with an electrospinning method. First, PVP (Mw = 360,000 g/mol, ref: 81440 Sigma-Aldrich, Burlington, MA, USA) was dissolved in distilled water at a 1:4 weight ratio and stirred until homogeneous. The solution was then degasified under vacuum conditions until any visible air bubbles were removed. Next, the solution was loaded into a syringe with a metal needle connected to a high-voltage power supply and placed at a 14 cm distance from the microribbon that acted as the grounded collector. Finally, the solution was extruded at a flow rate of 5 μL/min for 30 min at a voltage of 14 kV. The electrospinning parameters were chosen according to an optimum configuration [62].
The morphology and distribution of the PVP nanofibers were studied with scanning electron microscopy (JEOL JSM 6335F, Centro Nacional de Microscopía Electrónica, Madrid Spain).

2.2. Sensor Cell

The MEGS based on the functionalized transducer was placed, with the deposited side up, in a custom-made 3D-printed PLA airtight cell (with a volume of ~15 mL) connected to an automatized gas sample generator. Inside the cell was a 30.85 × 6.00 × 0.05 mm permanent magnet (~517 A/m) (Figure 1). The magnet creates a bias field near the ribbon’s anisotropy field, which induces magnetization in the transducer, typically between 200 and 900 A/m [63]. This magnetization maximizes the magnetoelastic coupling coefficient value and improves magnetoelastic effect detection [35,64] (Figure 1).

2.3. Magnetoelastic Resonance Oscillator Circuit

An oscillator circuit was designed around the sensor cell to allow real-time monitoring of the resonance frequency (Figure 2a). Due to the characteristic change in the susceptibility of the magnetoelastic transducer, the circuit will oscillate, with a radiofrequency (RF) signal travelling the loop that matches the transducer’s resonance frequency [65]. The oscillator system comprised of three basic circuit blocks:
  • An amplifier;
  • A feedback network (magnetostrictive resonator);
  • A passive bandpass filter.
The amplifier was connected to a power source, and was the only active element of the loop. Amplifier noise induces random multiple-frequency signals in the loop, from which the resonance frequency is the only one allowed to travel through the entire loop. The Barkhausen criteria should be satisfied, with a total phase shift of 2πn (with n being an integer other than zero) and a loop gain equal to the unity to ensure that the system works as an oscillator. When these criteria are fulfilled, the frequency of the oscillator circuit is autonomously and immediately synchronized upon any disturbance in the transducer.
The magnetostrictive oscillator included the sensor cell and a set of twin coils, with a diameter of 12 mm, a length of 17 mm, and 300 turns of 0.15 mm copper wire. These coils were coupled on the cell’s sides and acted as input and output RF ports. This configuration of lateral coils, instead of the traditional concentrical disposition [40], was chosen so that the prototype could exploit the contactless nature of the device operation.
Finally, the passive band filter selected the second resonance frequency harmonic and excluded interferent signals from external sources.

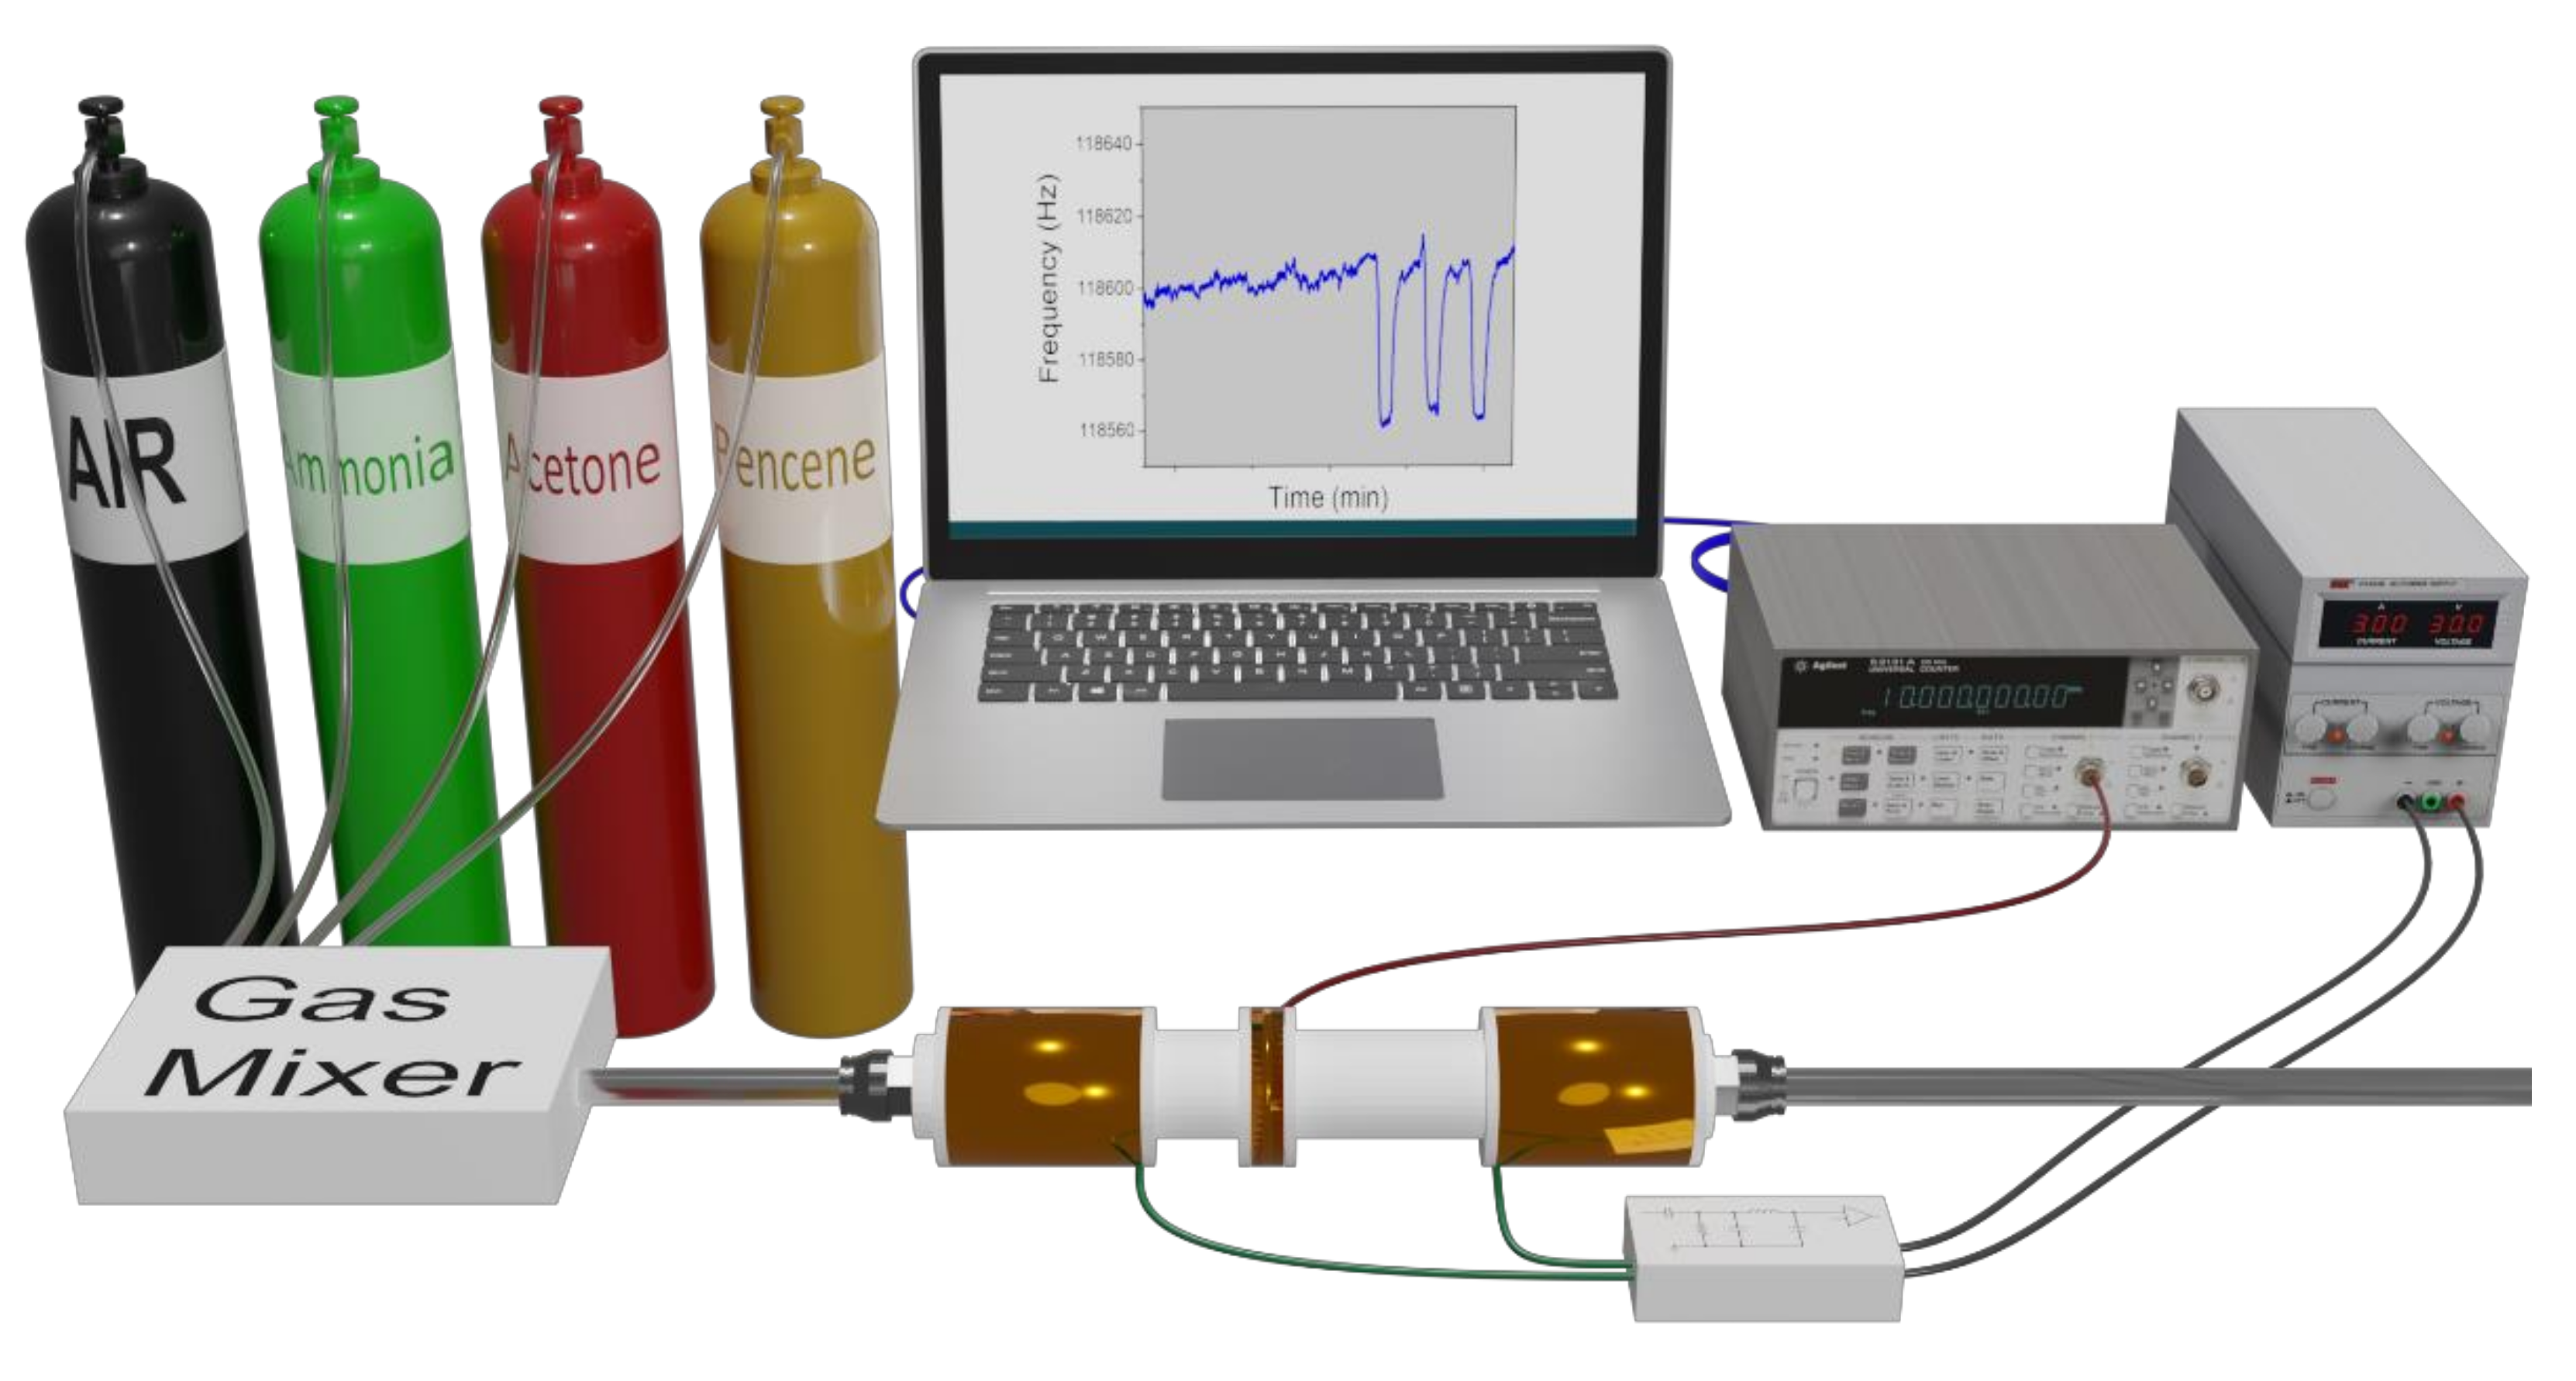
2.4. Electrical Characterization and Data Acquisition

2.4.1. Magnetoelastic Resonance Analysis

For the magnetoelastic characterization, a Red Pitaya device (SDRlab 125-14, Red Pitaya, Solkan, Slovenia) was controlled through a custom-made LabView-based program, as used in a previous report [40] (Figure 2b). Briefly, the Red-Pitaya-based system generates an alternating magnetic field through any of the twin coils previously described that, in this configuration, acts as an exciting coil while simultaneously collecting the signal induced in the other coil, working as a pick-up coil in this configuration (Figure 2b). The system sweeps the frequency over a predefined range and provides the frequency spectra (amplitude (dB) vs. frequency (Hz)).

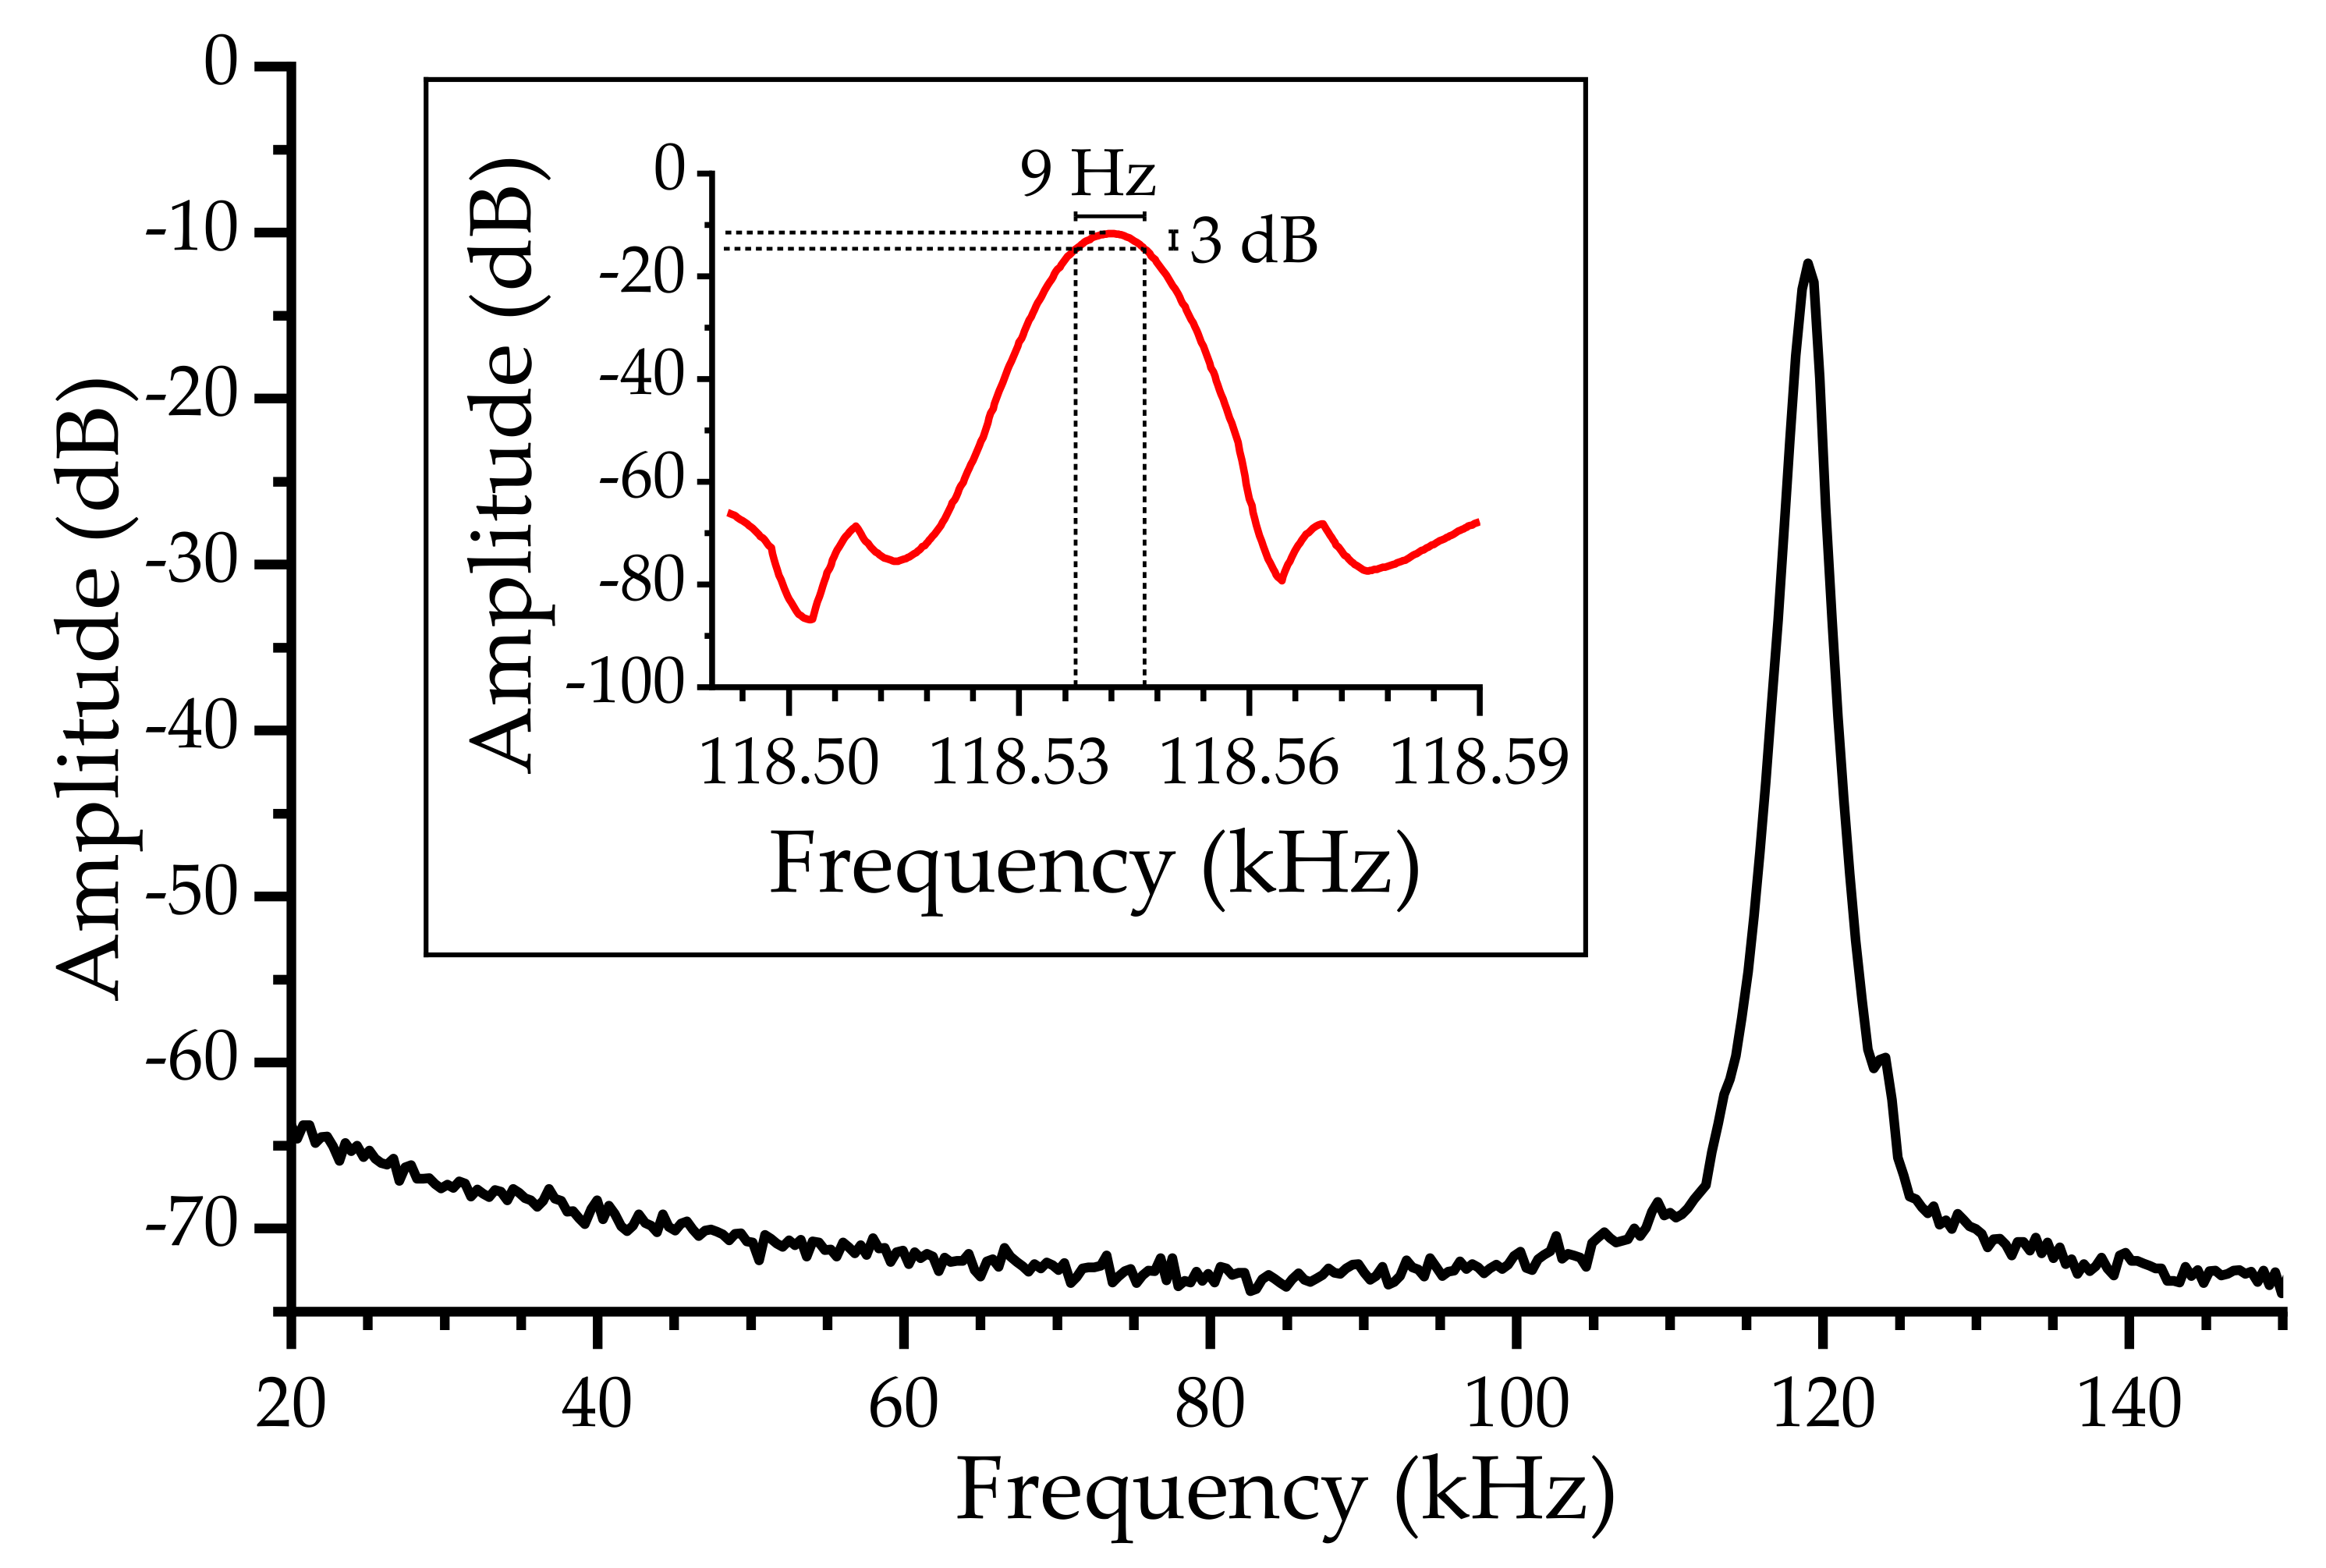
2.4.2. Q Factor Determination

The Q factor, also called the quality factor, is the parameter that measures the ratio between the energy stored and the energy dissipated during a complete signal cycle. A high factor indicates a low rate of energy loss relative to the energy stored by the resonator (Equation (1)) [66,67]:
Q = def 2 π × e n e r g y   s t o r e d e n e r g y   d i s s i p a t e d   p e r   c y c l e
The quality factor can be estimated experimentally as Equation (2):
Q = f c B W
where f c is the peak center and B W is the 3 dB bandwidth (from the maximum amplitude). A high Q factor value indicates a sharp resonance peak and, therefore, good resolution when determining frequency shifts [67].
Under continuous-wave operation, the amplifier can compensate for the losses of the magnetoelastic resonator in the oscillator. When such gain is considered, the Q factor relates to the whole oscillator system instead of the magnetoelastic resonator alone. For the determination of the effective Q factor, high-resolution measurements of the line width of the frequency spectrum were obtained with a spectrum analyzer (9320A, Agilent, Santa Clara, CA, USA). The configuration for these measurements was similar to the one shown in Figure 2c, substituting the frequency meter with the spectrum analyzer.
For the real-time monitoring during the sensor operation, the signal travelling through the oscillator system was detected using a pick-up coil, with a diameter of 12 mm, length of 2 mm, and 35 turns of 0.15 mm copper wire, connected to a frequency meter (53131A, Agilent, Santa Clara, CA, USA). The pick-up coil included a low-pass filter to block the 50 Hz range (Figure 2c). Note that the pick-up coil samples the alternating field travelling through the loop emitted by the coils. As such, it could be placed in a different configuration.
Finally, to illustrate the effect of the magnetoelastic resonance on the oscillator system, computational simulations were carried out over the magnetoelastic microribbon and the twin coils with COMSOL Multiphysics (version 5.5, AC/DC module, Barcelona, Spain). Susceptibility was parametrized with a relatively high value for the resonance case and a relatively low value for the non-resonance case, both values being arbitrary.

2.5. Sensors Evaluation

The sensor was tested with sequences consisting of a baseline step, where only synthetic dry air was flushed in the sensor chamber, cycles with an exposure phase, where the sensor was tested with the gas mixture containing the analyte, and a purge phase, where the device was again exposed only to the carrier gas.
For the humidity test, synthetic air was passed through a water bubbler and mixed with the carrier to create different humidity conditions to which to expose the device. The mix was calibrated with a humidity and temperature meter (RS 1364, RS Components, London, UK) to achieve the desired RH values. The sequence consisted of a 60 min baseline step followed by three cycles at each RH level (17%, 36%, 54%, 73%, and 95%). Each cycle had a 5 min exposure and a 10 min purge phase.
For the acetone, ammonia, and benzene tests, the analytes (from 50 ppm balance air cylinders) were mixed, and synthetic dry air used as a carrier at a concentration of 40 ppm. The sequences consisted of three different runs, one for each analyte, with a 60 min baseline step and three cycles, with a 2 min exposure phase and a 5 min purge phase.
The experiments were performed in a temperature-controlled room at 25 °C. The airflow inside the cell was set to 100 mL∙min−1 in all cases. All gases were provided by Nippon Gases, Madrid, Spain. The complete experimental setup is illustrated in Figure 3.
Three parameters were used to evaluate the sensor’s performance: response, limit of detection (LoD), and τ90.
The sensor’s response was defined as the frequency shift value (Δf) between the exposure phase beginning (fi) and end (ff) (Equation (3)):
f = f r f i
LoD represents the minimum concentration of the analyte that can be reliably detected. It can be calculated from the sensitivity using the following Equation (4):
L o D R M S n o i s e ,   Sensitivity = 3     R M S n o i s e S e n s i t i v i t y
The RMS noise is the root mean squared noise of a 60 min baseline, i.e., under the continuous flush of the carrier gas in the chamber with no analyte present. The LoD error (ΔLoD) was calculated from Equation (4) using uncertainty propagation.
Finally, τ90 was used to evaluate the responsiveness time. It was defined as the time needed to achieve the 90% of the response.

2.6. In-Situ Breath Detection

The breath monitoring capability of the device was evaluated by exposing the sensor to the breath of a researcher who breathed normally at 5 cm from the sensor.
The experiment was carried out with the same configuration used for Q factor determination, i.e., with the spectrum analyzer and the cover of the gas chamber removed. This configuration was used, instead of the oscillator system, to detect any damping on the oscillation amplitude or signal distortion.

3. Results and Discussion

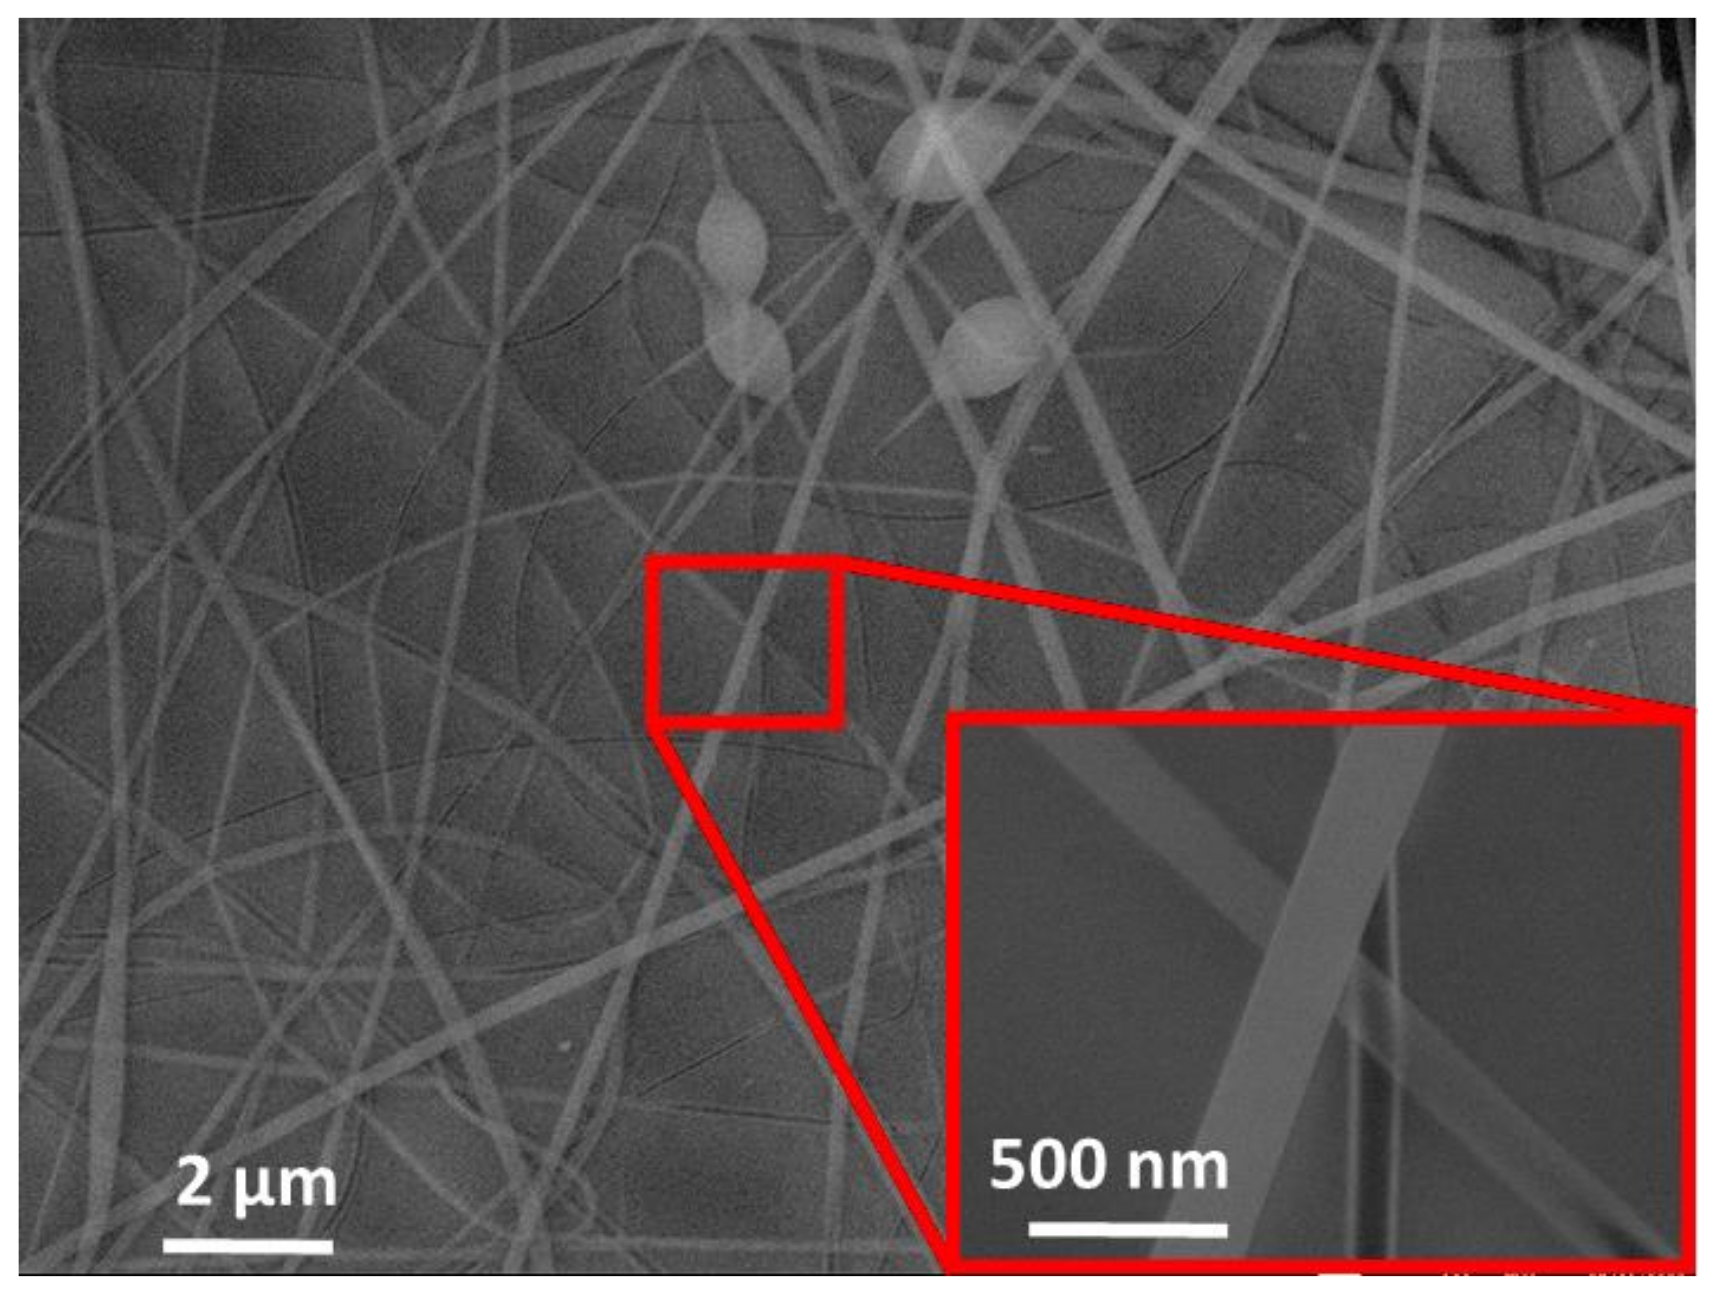
3.1. Sensitive Layer Deposit

The sensitive layer was successfully deposited over the transducer. Due to the characteristics of the electrospinning technique, the water-based PVP solution dried and formed polymeric nanofibers, with a thickness in the 100 nm range, on the target (Figure 4).
The nanofibers were evenly deposited on the transducer’s surface mainly due to the good electrical conductivity of the magnetoelastic microribbon, which promoted a homogeneous electric field distribution during the electrospinning process.

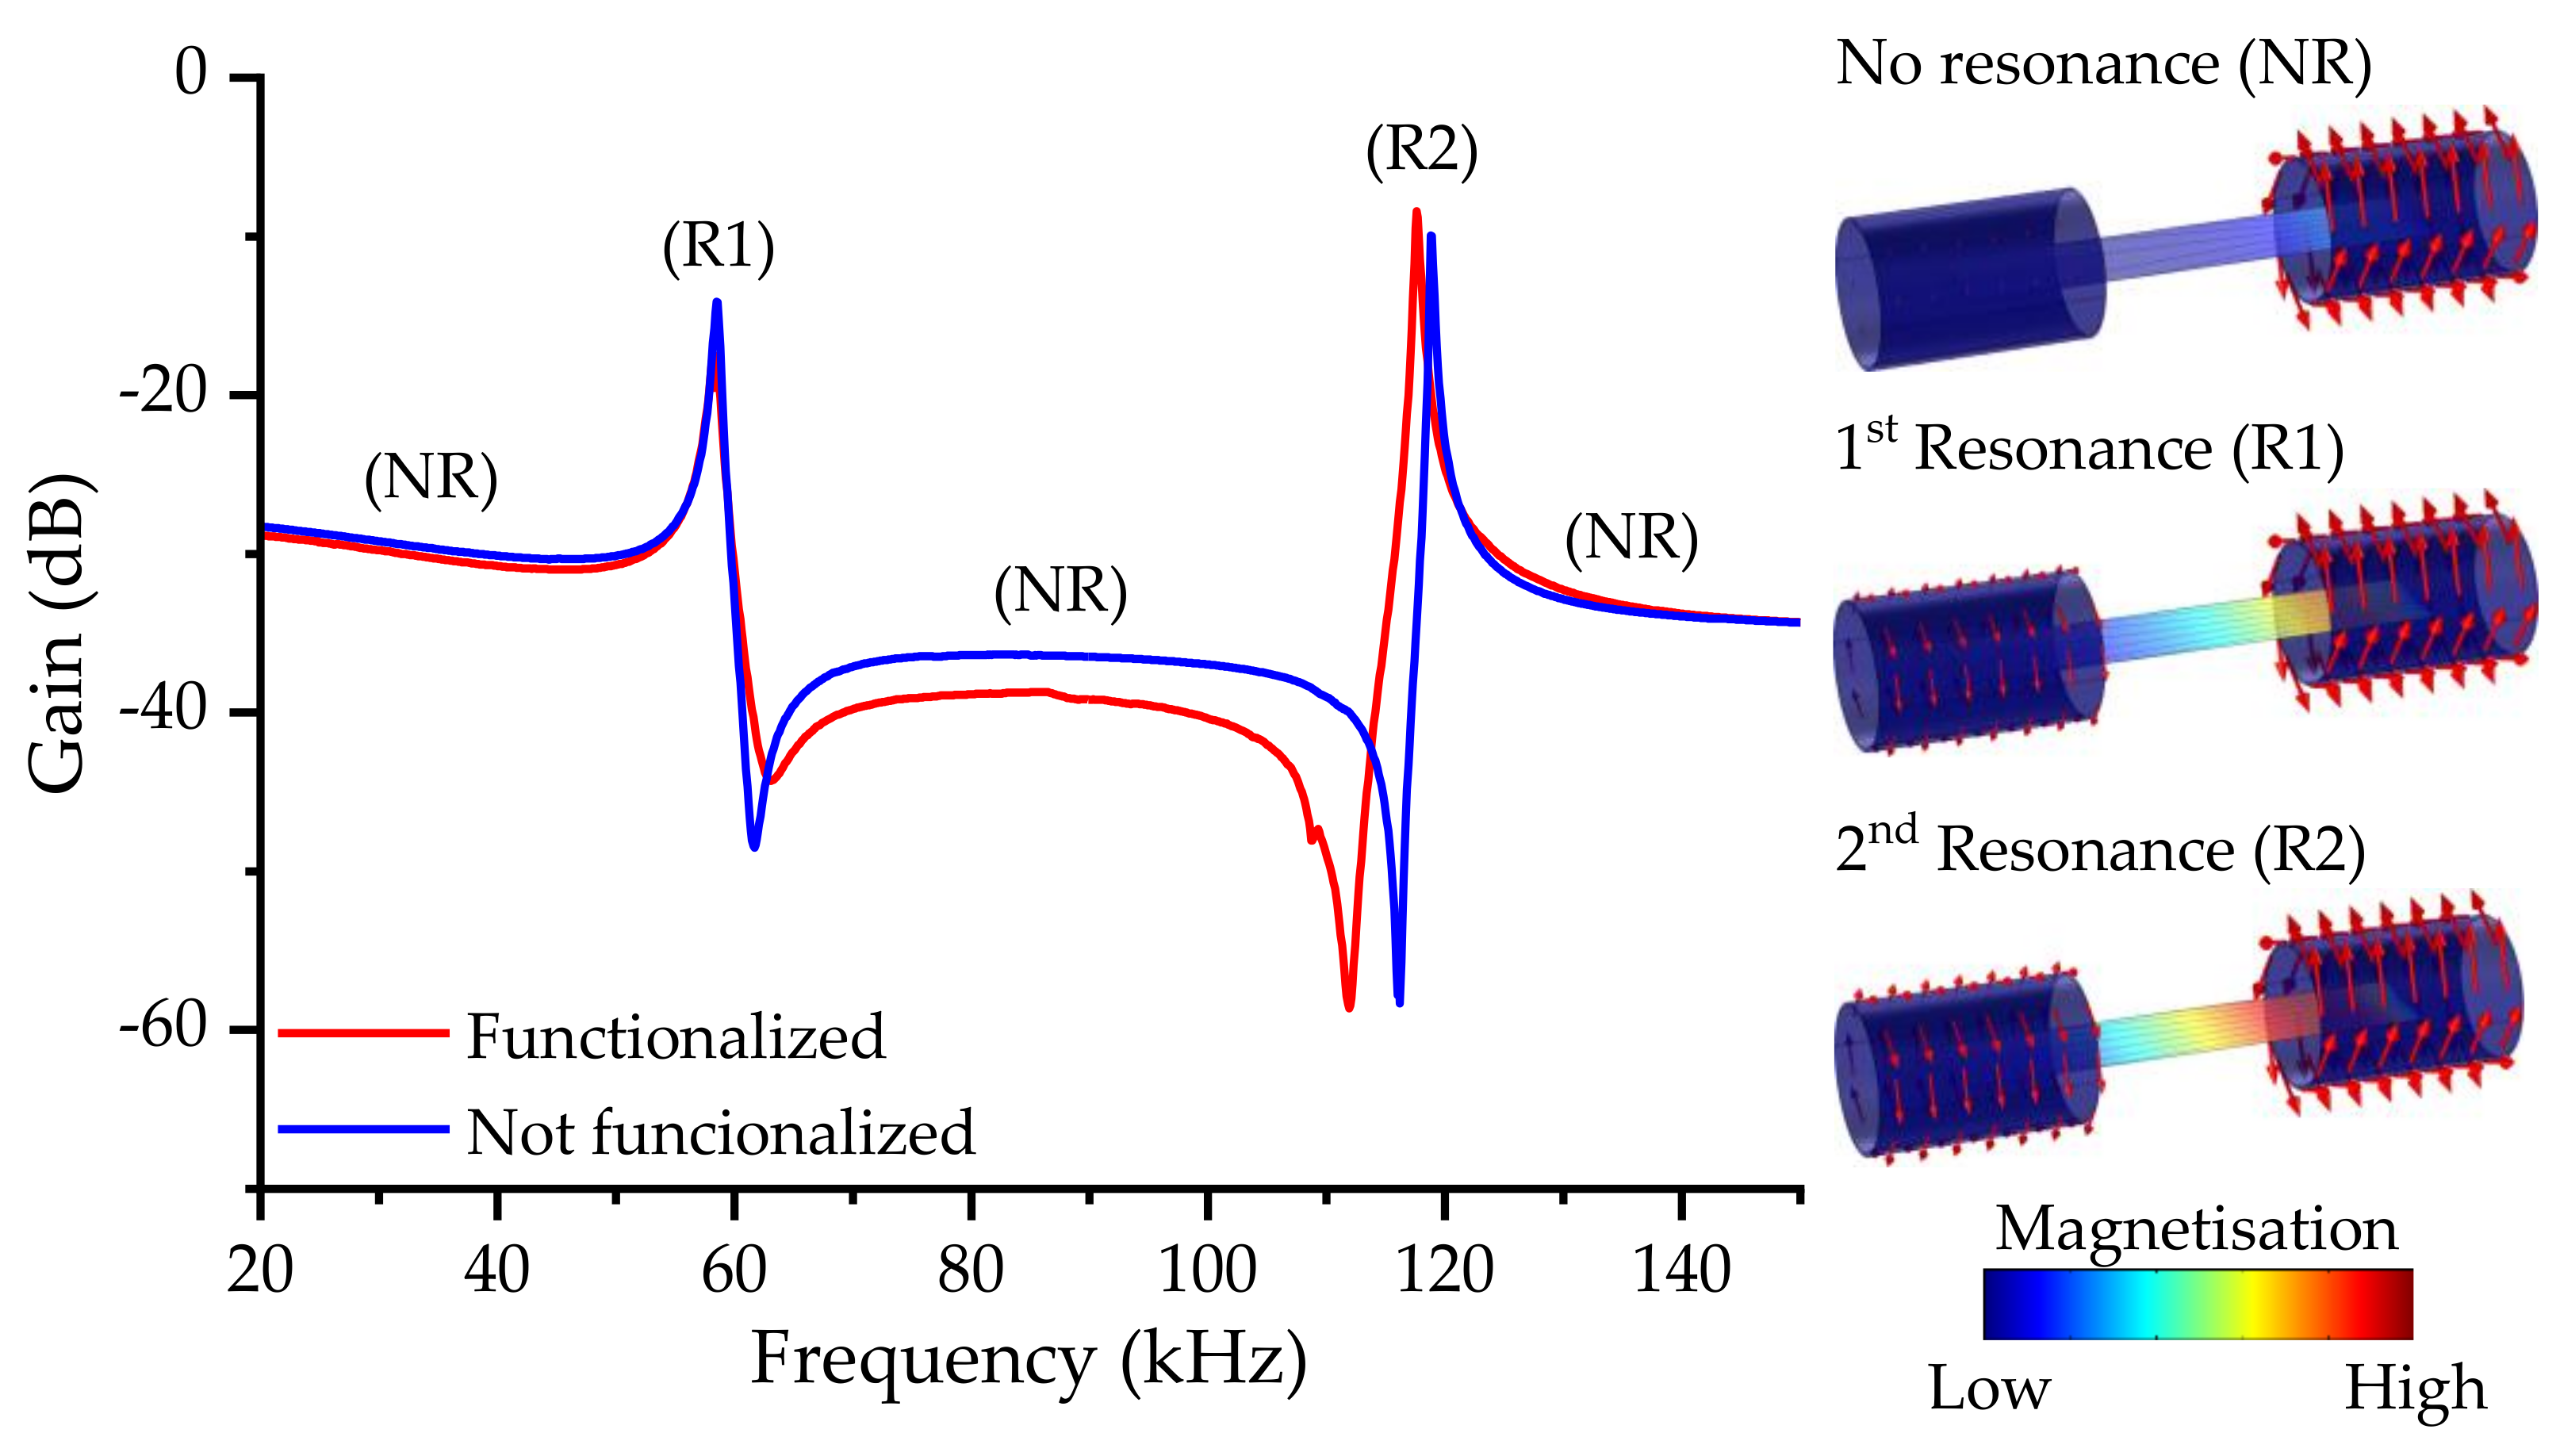
3.2. Magnetoelastic Resonance Characterization

During the frequency sweep, as the magnetoelastic resonance is achieved, the change of the magnetic susceptibility leads to an increase in its magnetization and, consequently, to a higher induced current, or gain, in the pick-up coil [66]. Thus, the magnetoelastic resonance appeared as amplitude maxima in the frequency sweep spectra (Figure 5).
In general, the first harmonic is usually greater when centered coils are used, but, in this case, due to the placement of the coils on the magnetoelastic ribbon sides, the second harmonic was favored against the first.
Furthermore, as the different harmonics have a different displacement distribution in terms of the oscillation, they also have areas with higher sensitivity, often called hot sensing areas, which, for the first harmonic, are located in the tips of the ribbon [38] (see Figure 6).
For the reference transducer, i.e., without functionalization, the first harmonic was located at 58.6 kHz, whereas the second harmonic was located at 118.8 kHz, roughly twice the value. These values agree with the ones calculated from the mechanical parameters of the magnetoelastic microribbon (Equation (5)) [57]:
f r = n 2 L E ρ 1 υ 2
Considering the length of the microribbon and its mechanical properties (E = 152 GPa; density = 7900 kg/m3; Poisson ratio = 0.33) [68], the theoretical f r values were 62.8 kHz and 125.6 kHz for n = 1 and n = 2, respectively. Differences between the theoretical and experimental values may be explained by the fact that Equation (5) does not consider the magnetic variation of the mechanical parameters [69], nor does it consider deviations in the materials parameters, because of the manufacturing process.
As the functionalization process adds mass to the transducer, a shift in the resonance frequency is expected according to Equation (6):
f = f 0 m 2 m 0
where m 0 and f 0 are the mass and resonant frequency of the magnetoelastic material, respectively, prior to the coating [57]. It should be noted that, although Equation (2) assumes that the coating has rigidly adhered to the substrate, it is uniformly distributed on the transducer surface, and the deposited mass is relatively small compared to m 0 , which may not always be satisfied [70]. Nevertheless, the general assumption that an increment in the sensor’s mass leads to a negative frequency shift is commonly accepted. This shift was confirmed with the frequency sweep spectra of a transducer with and without the functionalization.
At the same time, the deposit had a neglectable effect on the dampening of the resonance amplitude, which remained largely unaltered, indicating the robustness of the magnetoelastic strips as a transducer for MEGSs.
The second harmonic of f r was chosen for the MEGS operation because of its higher amplitude, which should also improve the sensing performance, and its intrinsic higher sensitivity (higher f 0 , Equation (6)).
The oscillator’s quality factor was calculated using Equation (2) and a high-resolution measure (Figure 7). With the linewidth of 9 Hz for a frequency of ~119 kHz, a high-quality factor of Qoscillator > 13,000 was obtained.

3.3. Gas Response Characterization

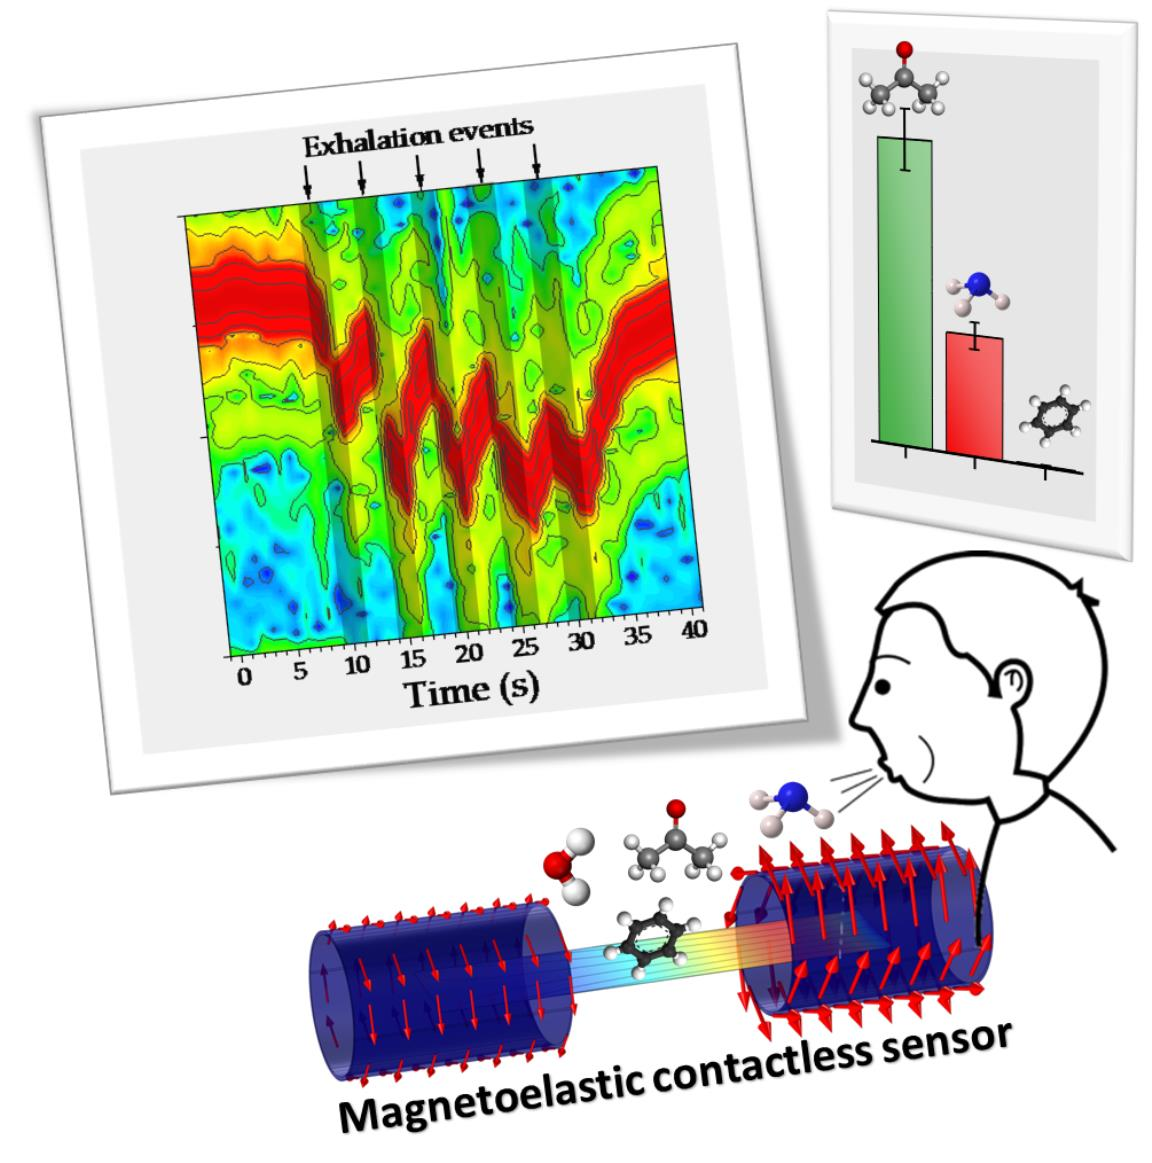
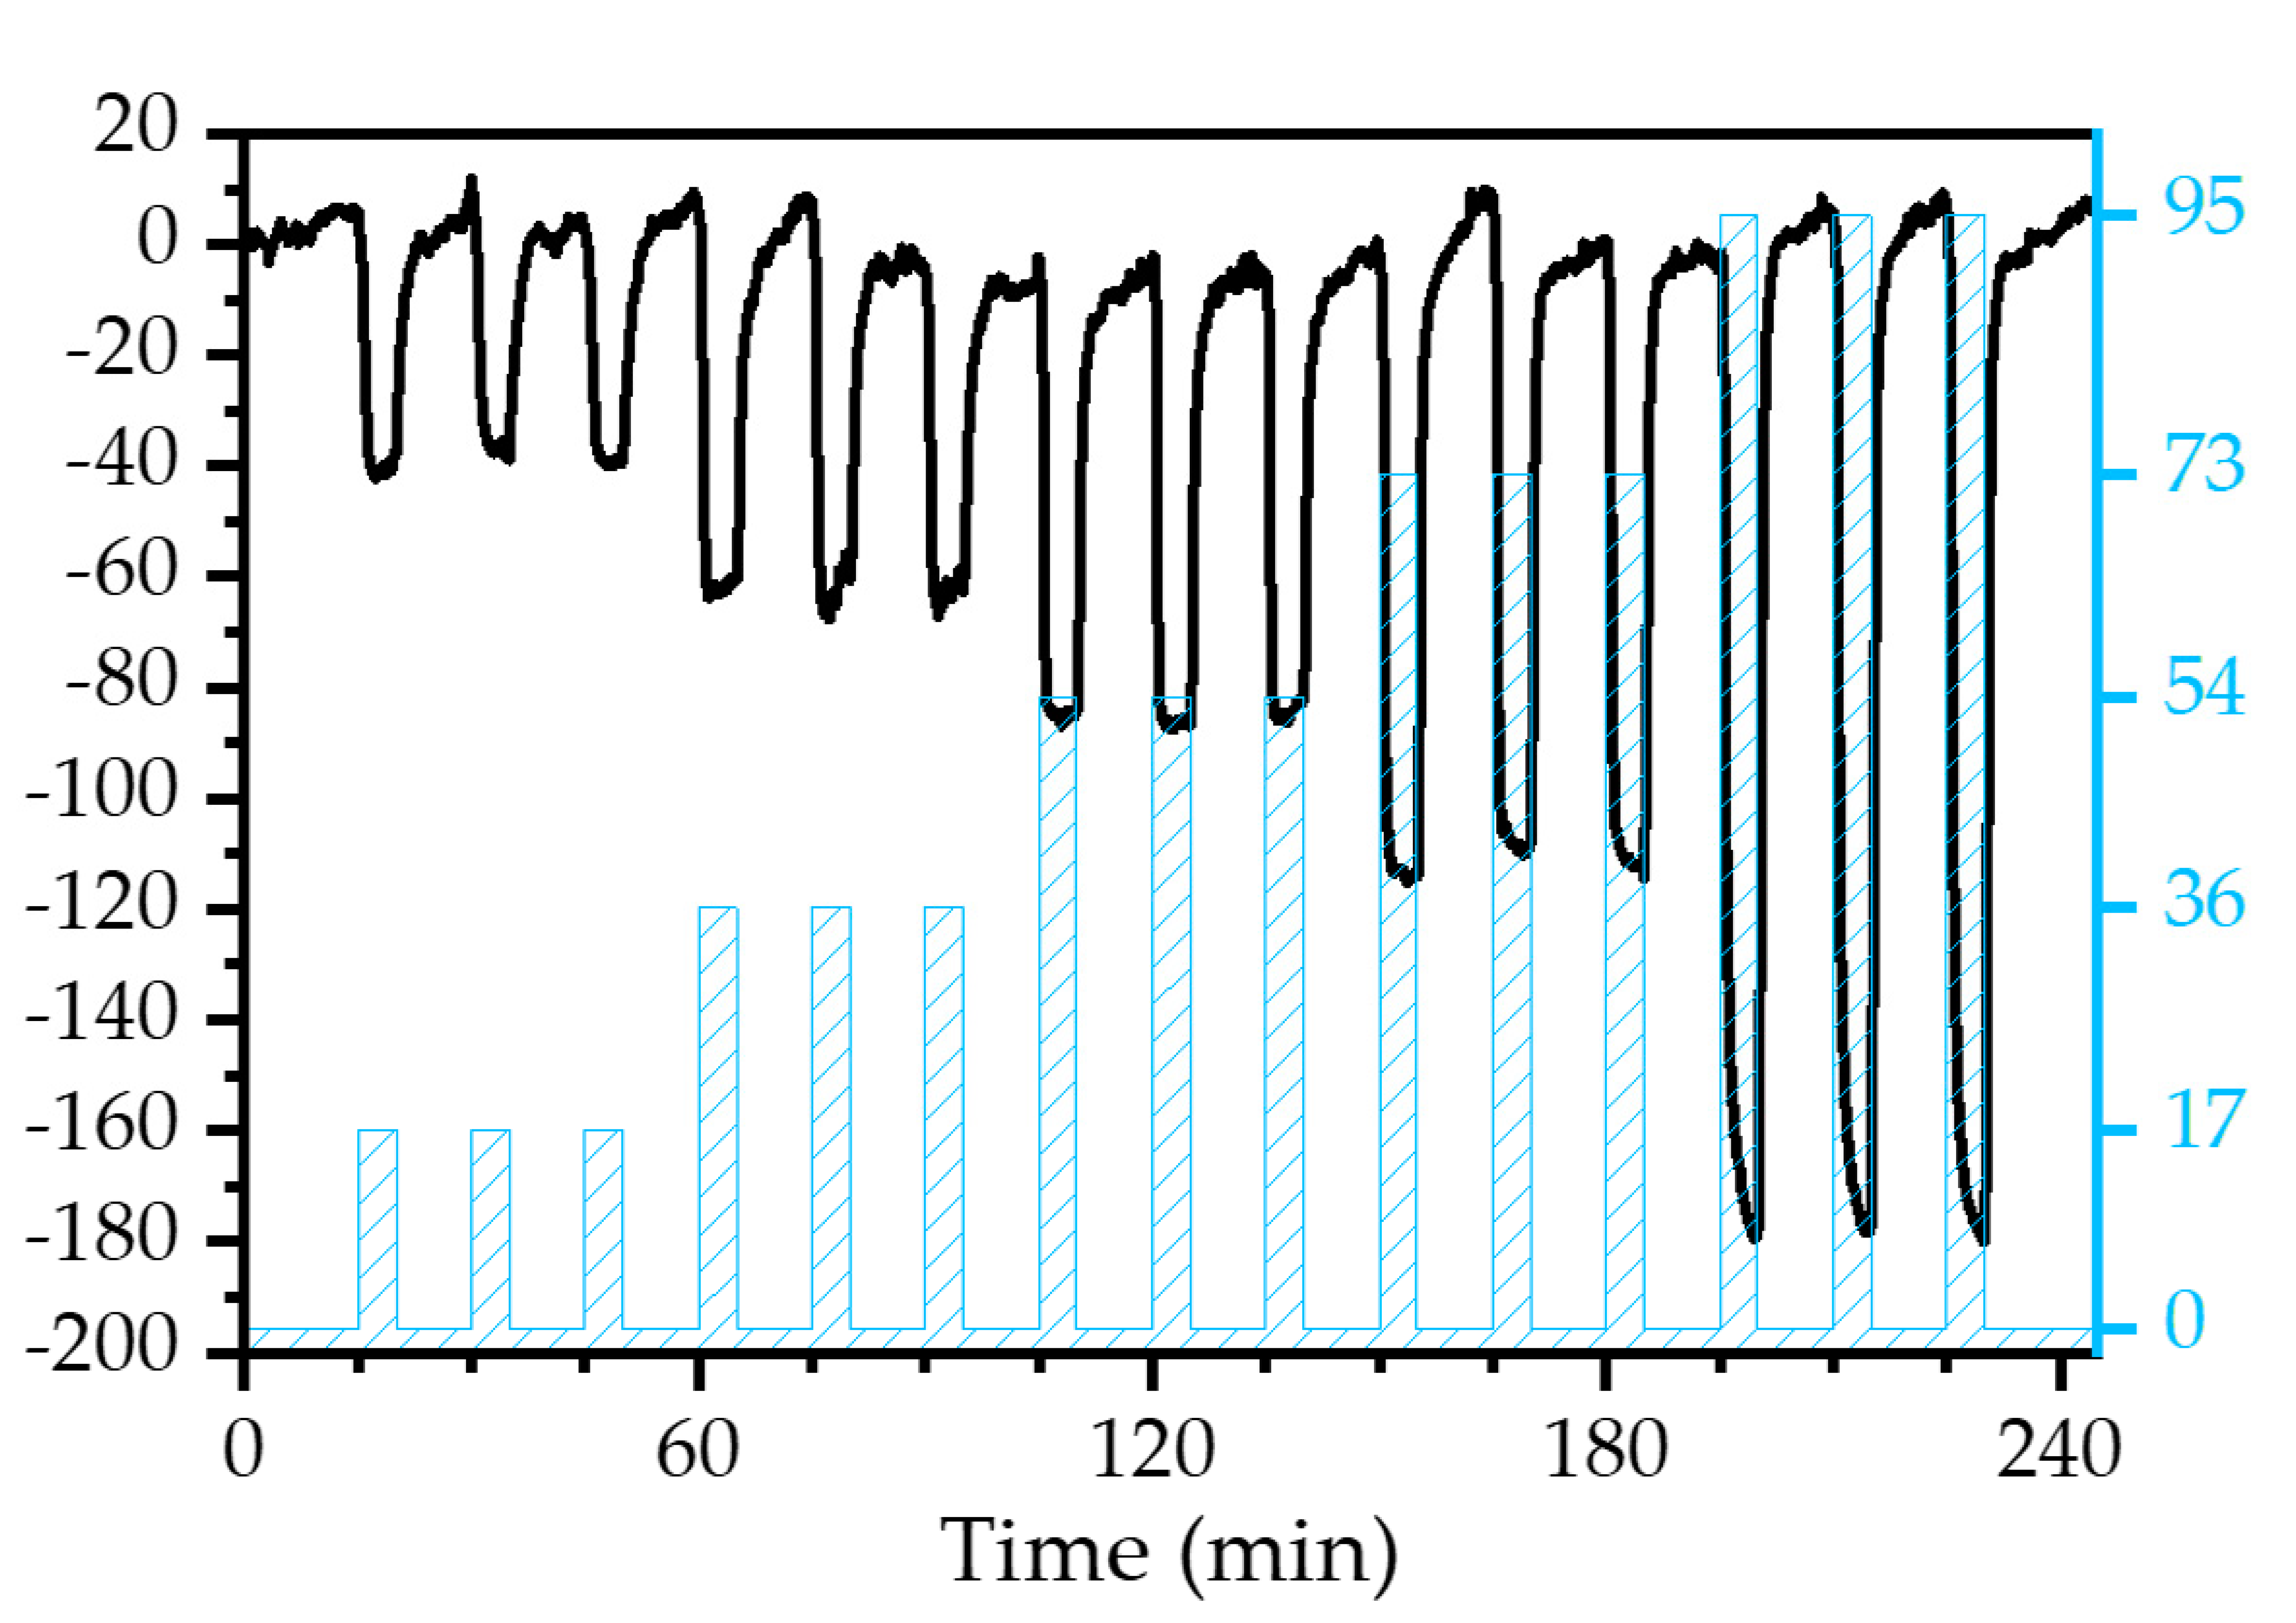
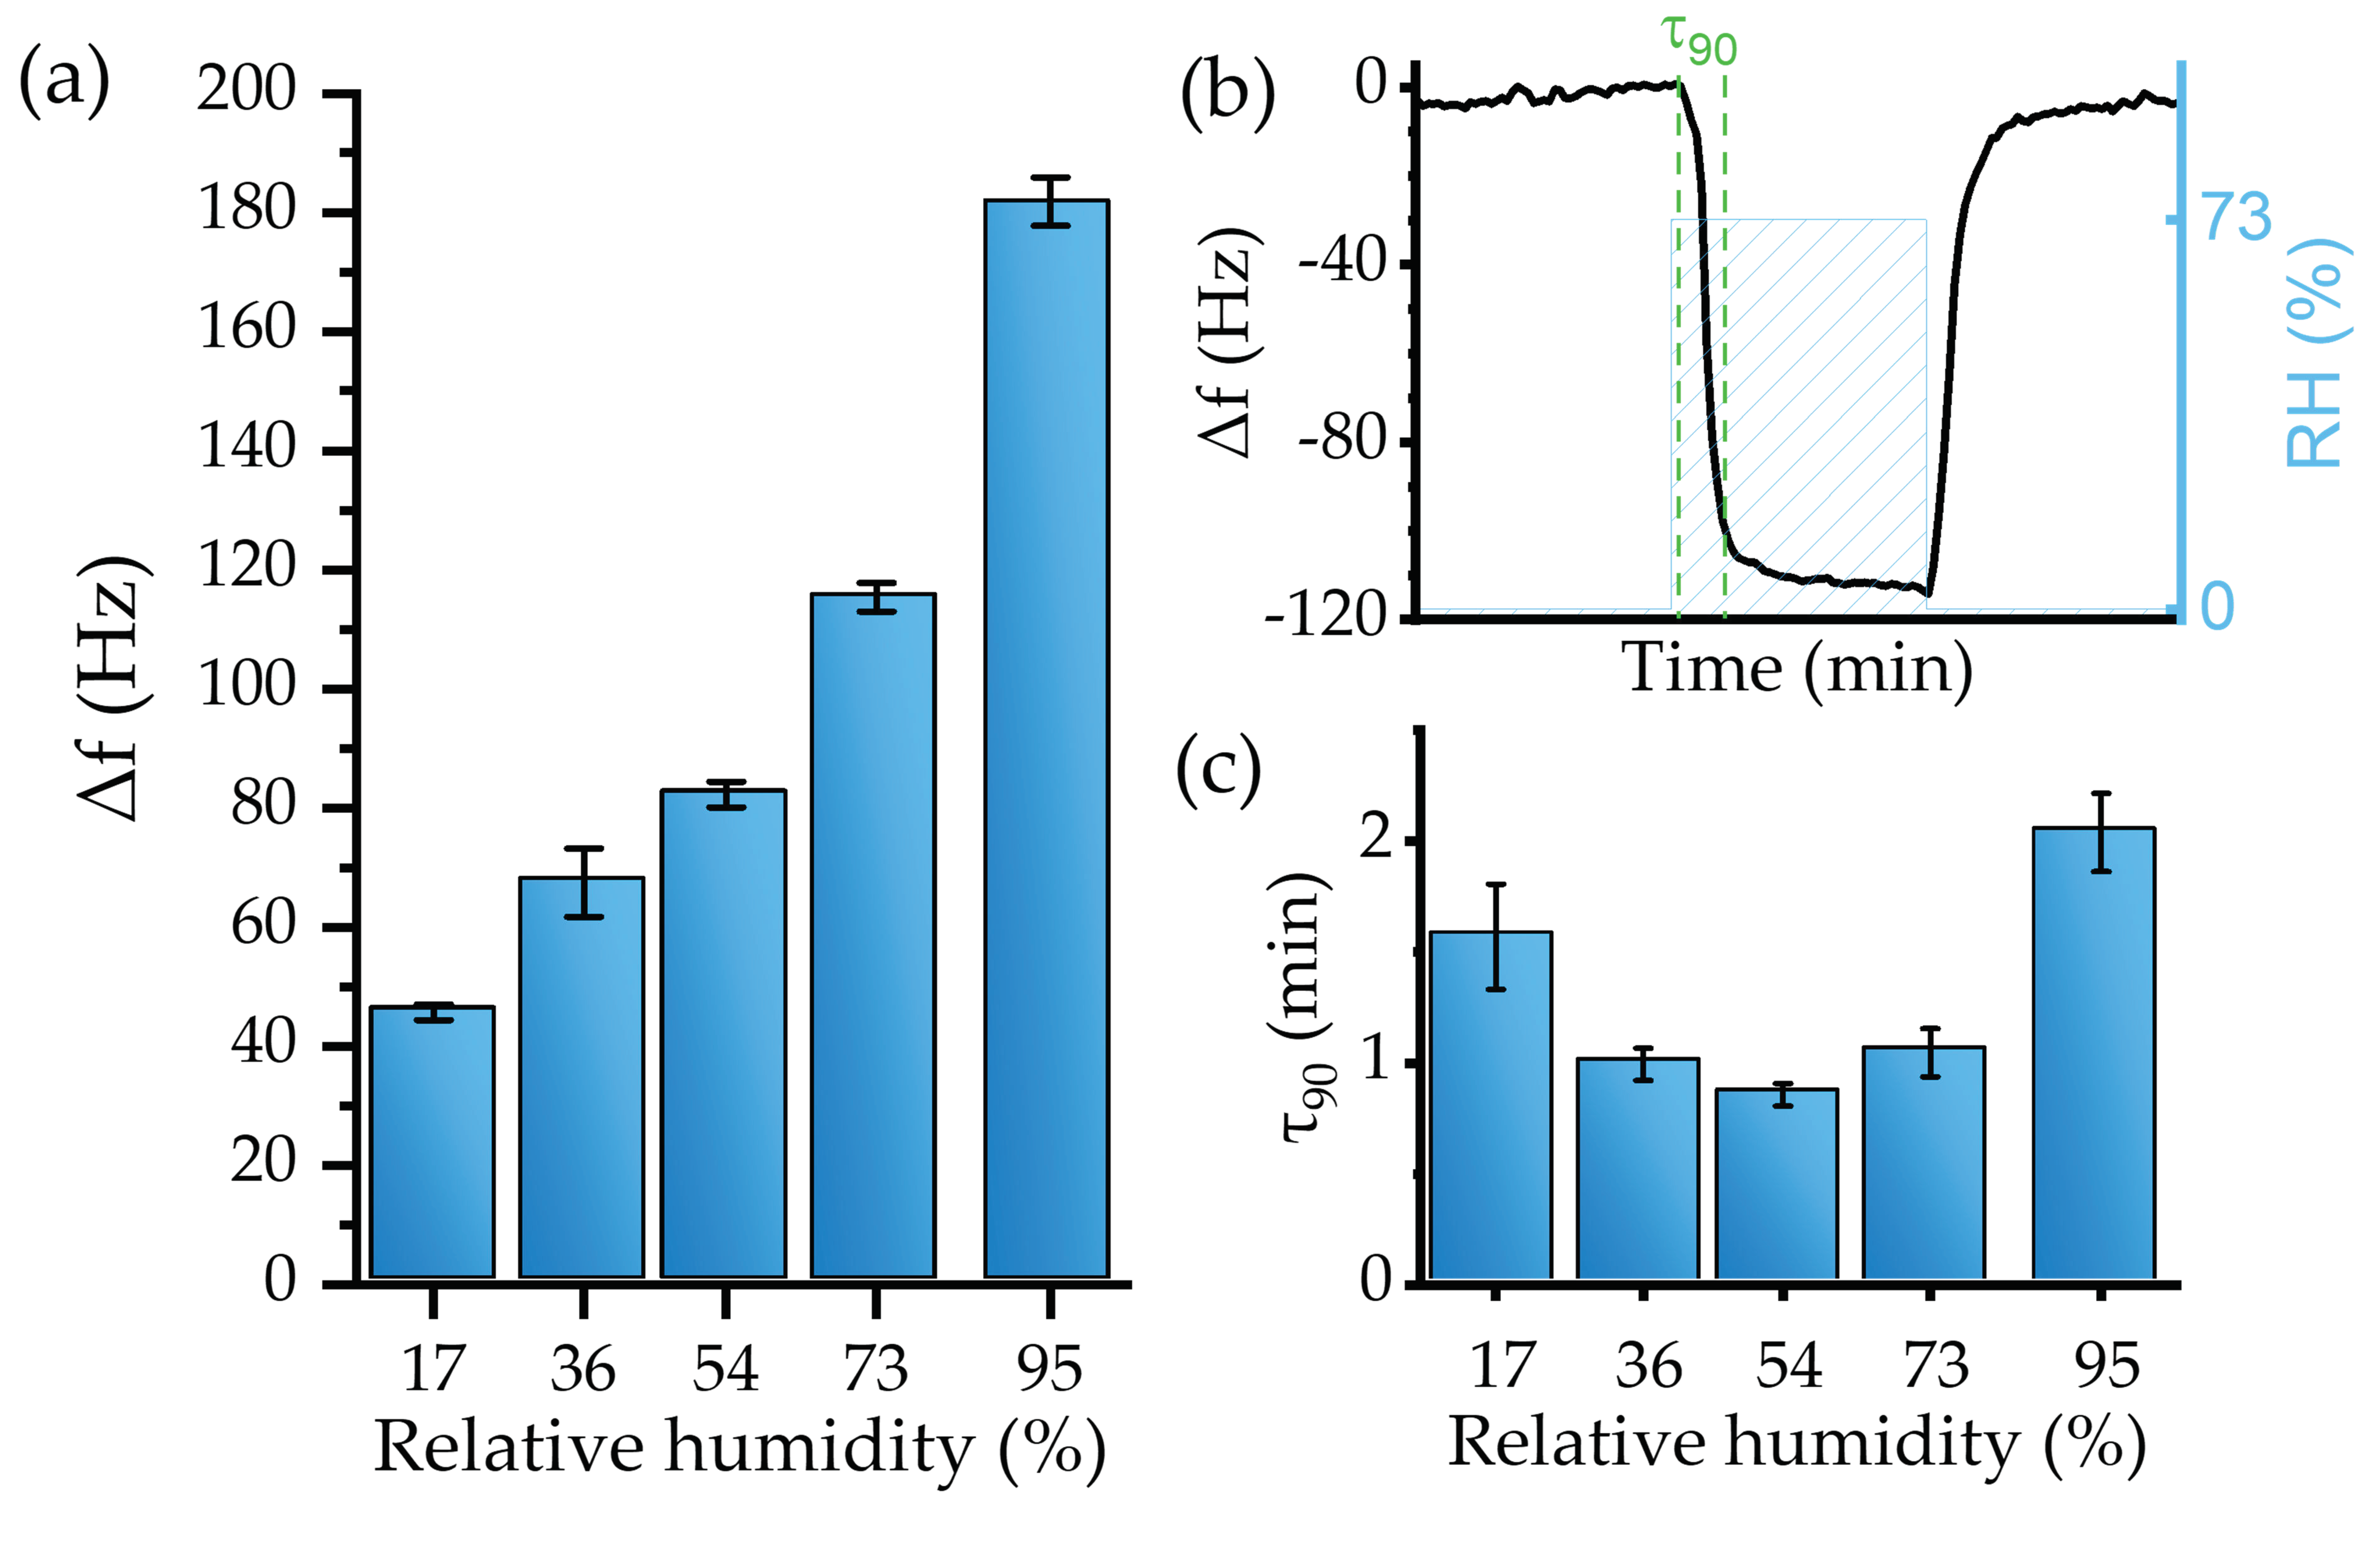
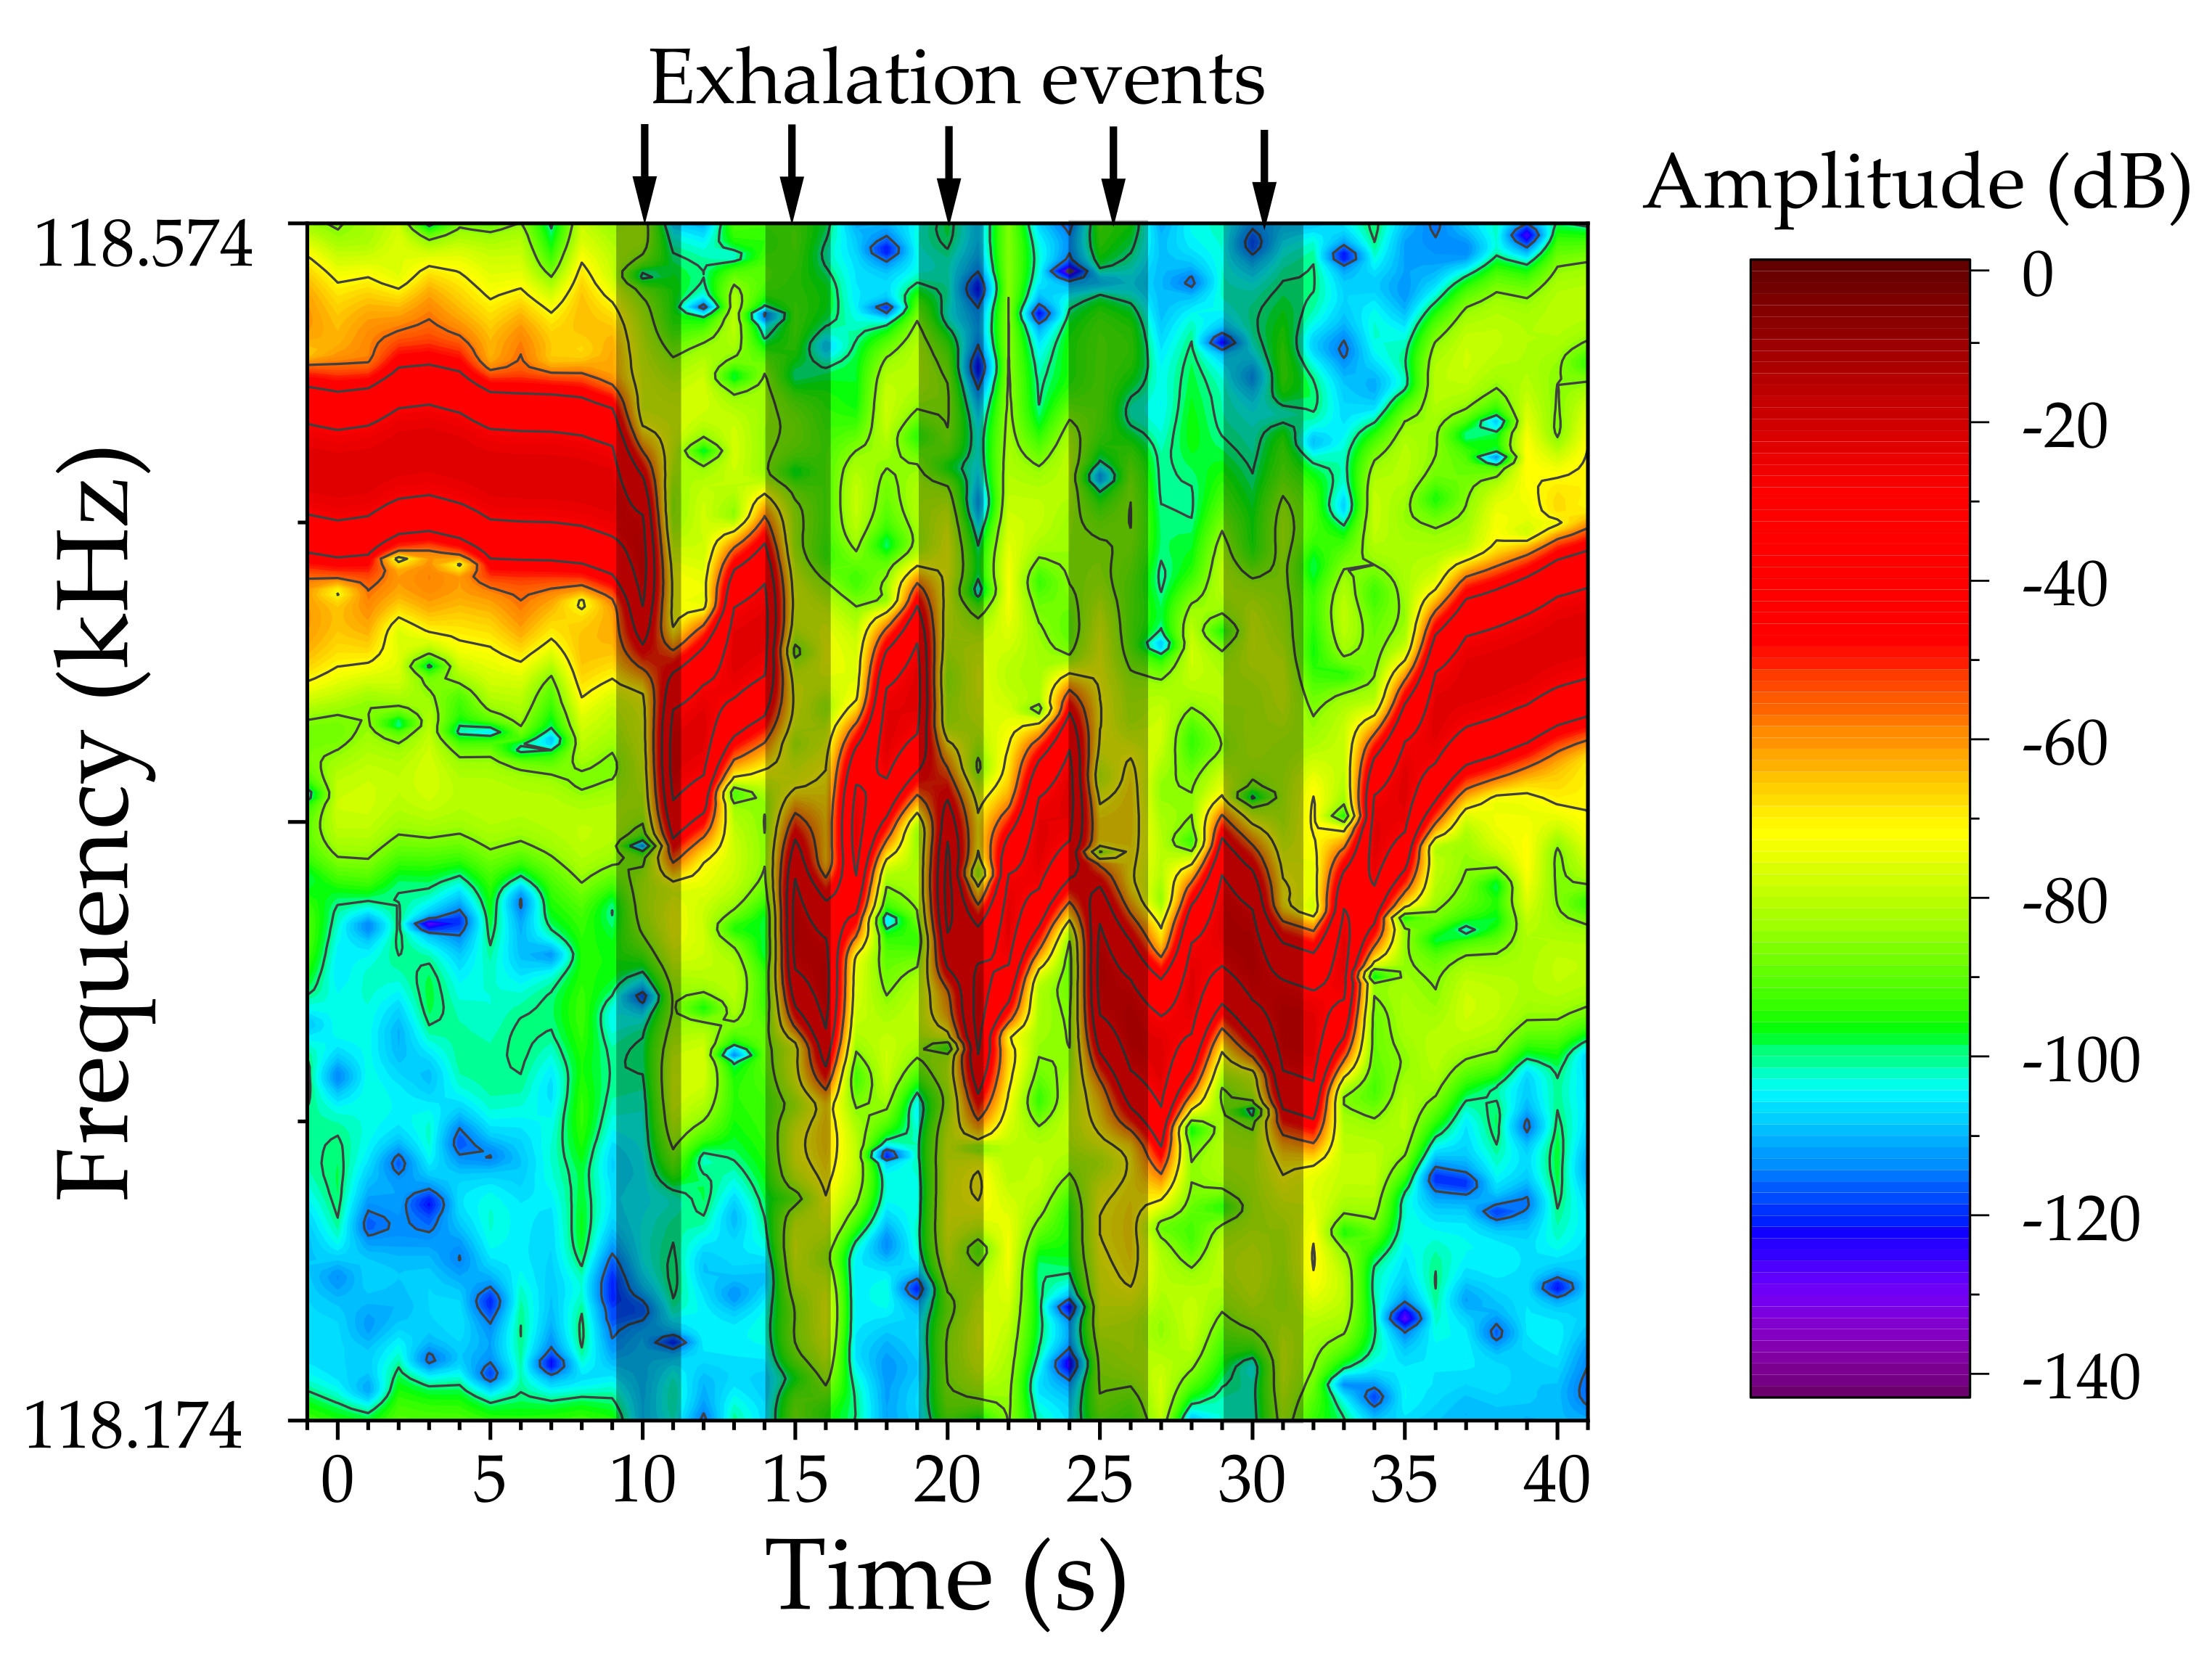
3.3.1. Humidity and Real Breath Monitoring

The viability of the experimental setup, including the sensor, was first evaluated toward gaseous water molecules detection, i.e., relative humidity measurement. As water acts as a solvent of PVP, H2O molecules are trapped in the sensitive material’s nanofibers, incrementing the deposited mass over the transducer. A negative resonant frequency shift, as predicted by Equation (6), was observed during the real-time monitoring under the exposure to different RH levels (Figure 8).
The sensor responded with high reproducibility. For instance, after three exposures to the same RH level, the relative standard deviation of the response was ≤4% (Figure 9a).
The sensitivity of the device, defined as the response to a specific concentration of the analyte (expressed in Hz/%), was obtained by fitting the values provided in Figure 9a. A linear response regime for levels up to RH = 73% was established. The linear fit provided a sensitivity of −1.17 ± 0.1 Hz/% (R2 of 0.97).
However, for high RH, i.e., 95%, the sensors’ behavior deviated from the linearity. This effect may be explained by a large total mass of the active layer relative to the mass of the transducer [70] or, most probably, by condensation effects. Mean values and standard deviation of the sensor’s response toward RH are presented in Figure 9a. The resulting LoD, calculated from Equation (4), was an RH level of 4.7 ± 0.4%.
The responsiveness time can be evaluated using the τ90 parameter, defined as the time required to achieve the 90% maximum frequency change (Figure 9b). In general, the sensor device showed a fast recovery with a low baseline drift for tested RH. For instance, Figure 10b shows sensor dynamics at 73% RH, where the response time was 1.04 min, which is similar to 1.04 min recovery time. Figure 9c shows that the sensor’s responsiveness toward water is fast, as 90% of the maximum change was achieved during the first two min or less.
Although the resulting τ90 indicated fast responsiveness, mixing the analyte and the effect of the water bubbler could significantly delay the device’s response, as was also observed during the calibration with the hygrometer.
The sensor was then exposed to natural breath; during this experiment, a researcher breathed normally onto the sensor. As the exhaled breath reached the device, an immediate response was observed. The response, consisting of a negative frequency shift, was most probably caused by a broad set of analytes in the breath, but mainly by its high humidity concentration (Figure 10). Although the exact compositional profile cannot be obtained with the current device, the excellent response to natural breath proved the utility of the sensor in breath analysis applications. Furthermore, the resonance amplitude remains largely unaltered, indicating that the transducer’s resonance did not suffer any noticeable damping or distortion during the breath exposures.

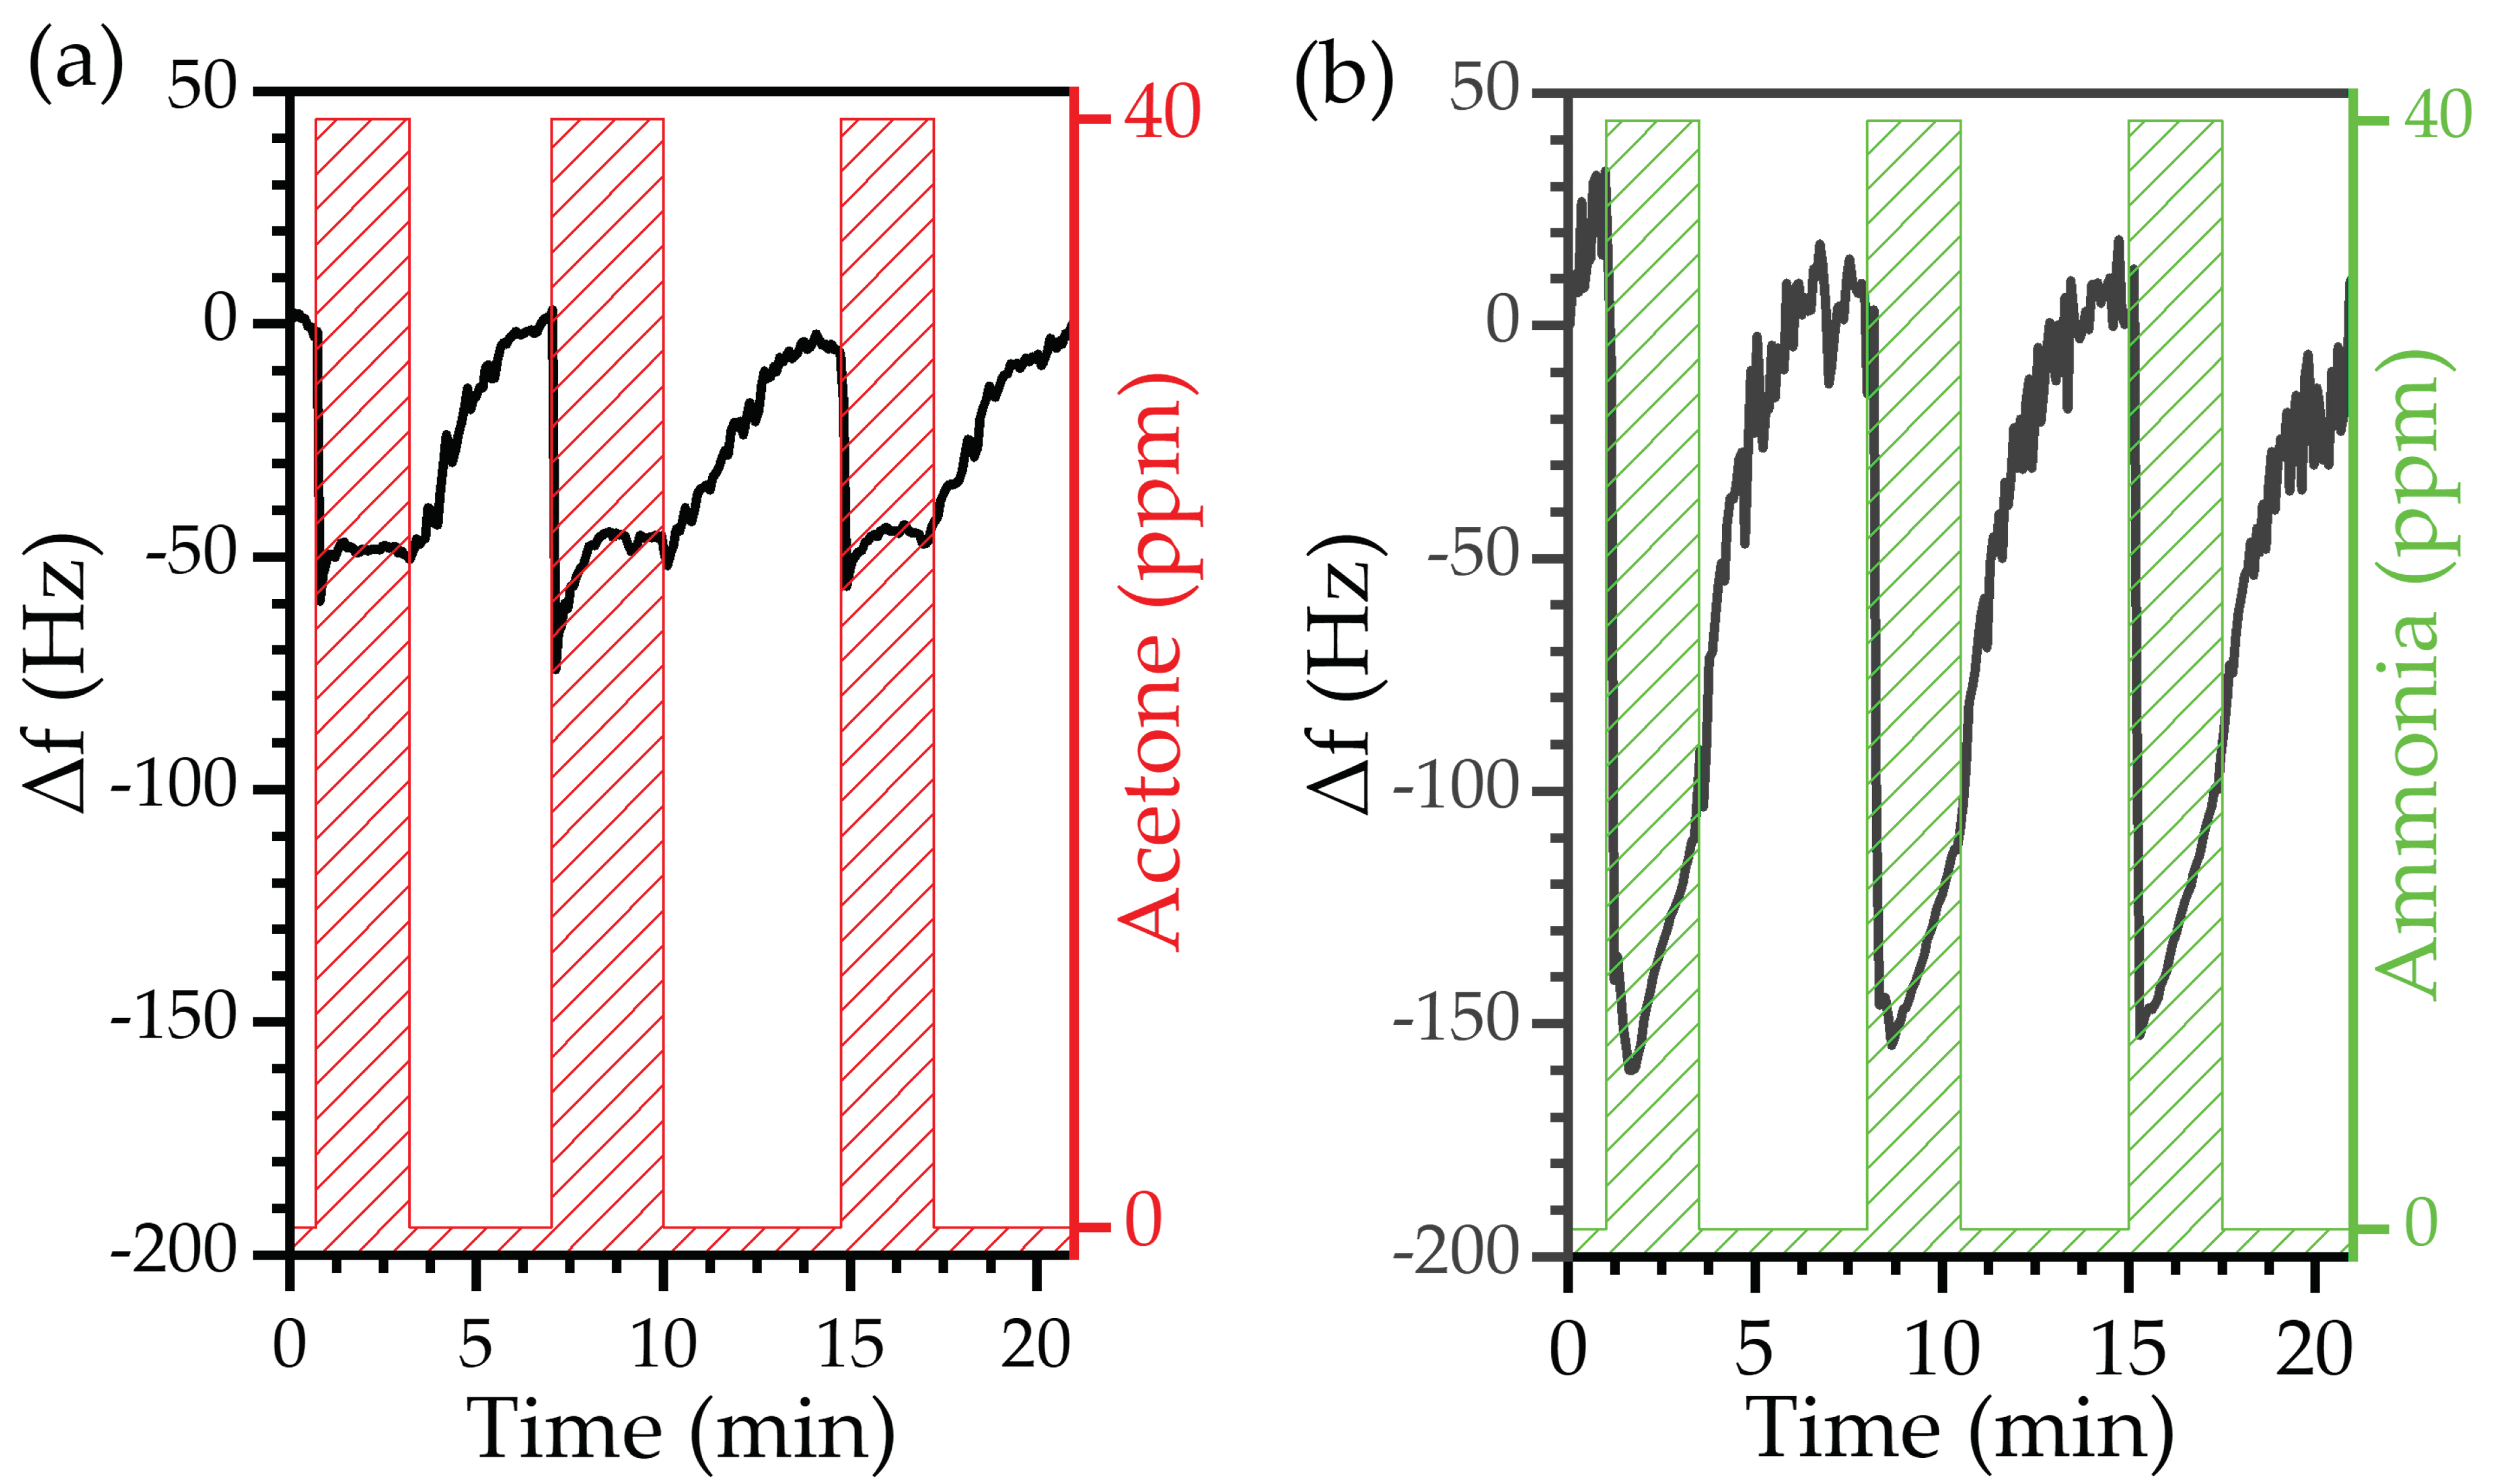
3.3.2. Endogenous Biomarkers: Acetone and Ammonia

The MEGS was then evaluated for acetone detection. The sensor responded to 40 ppm of gaseous acetone with a negative frequency shift, analogously to the behavior observed during the humidity detection test related to the absorption of acetone molecules in the sensitive layer (Figure 11a). Acetone detection exhibited high reproducibility with slight variation between exposure cycles. The mean response value was 44.1 ± 4.8 kHz.
The test was repeated for ammonia detection under the same conditions. The sensor’s response also indicated that the ammonia molecules became attached to the sensitive layer, as observed during the humidity or acetone tests (Figure 11b). The device exhibited a similar response among the three exposures, further confirming the excellent reproducibility of the MEGSs operation. The response was higher than that to the acetone exposure, with a mean value of 112.6 ± 11.0 kHz. The sensor showed an immediate response toward acetone and ammonia. However, a higher time was required to recover the base frequency; this is related to a slowing down of the diffusion of acetone and ammonia molecules within the PVP nanofibers with respect to water molecules.
Overall, the MEGS detected acetone and ammonia at a 40 ppm concentration. Furthermore, the sensor exhibited high reproducibility, mainly owing to the practically full recovery during the purge phase, i.e., the frequency achieved its initial value (frequency shift equal to zero), a phenomenon related to good desorption dynamics.

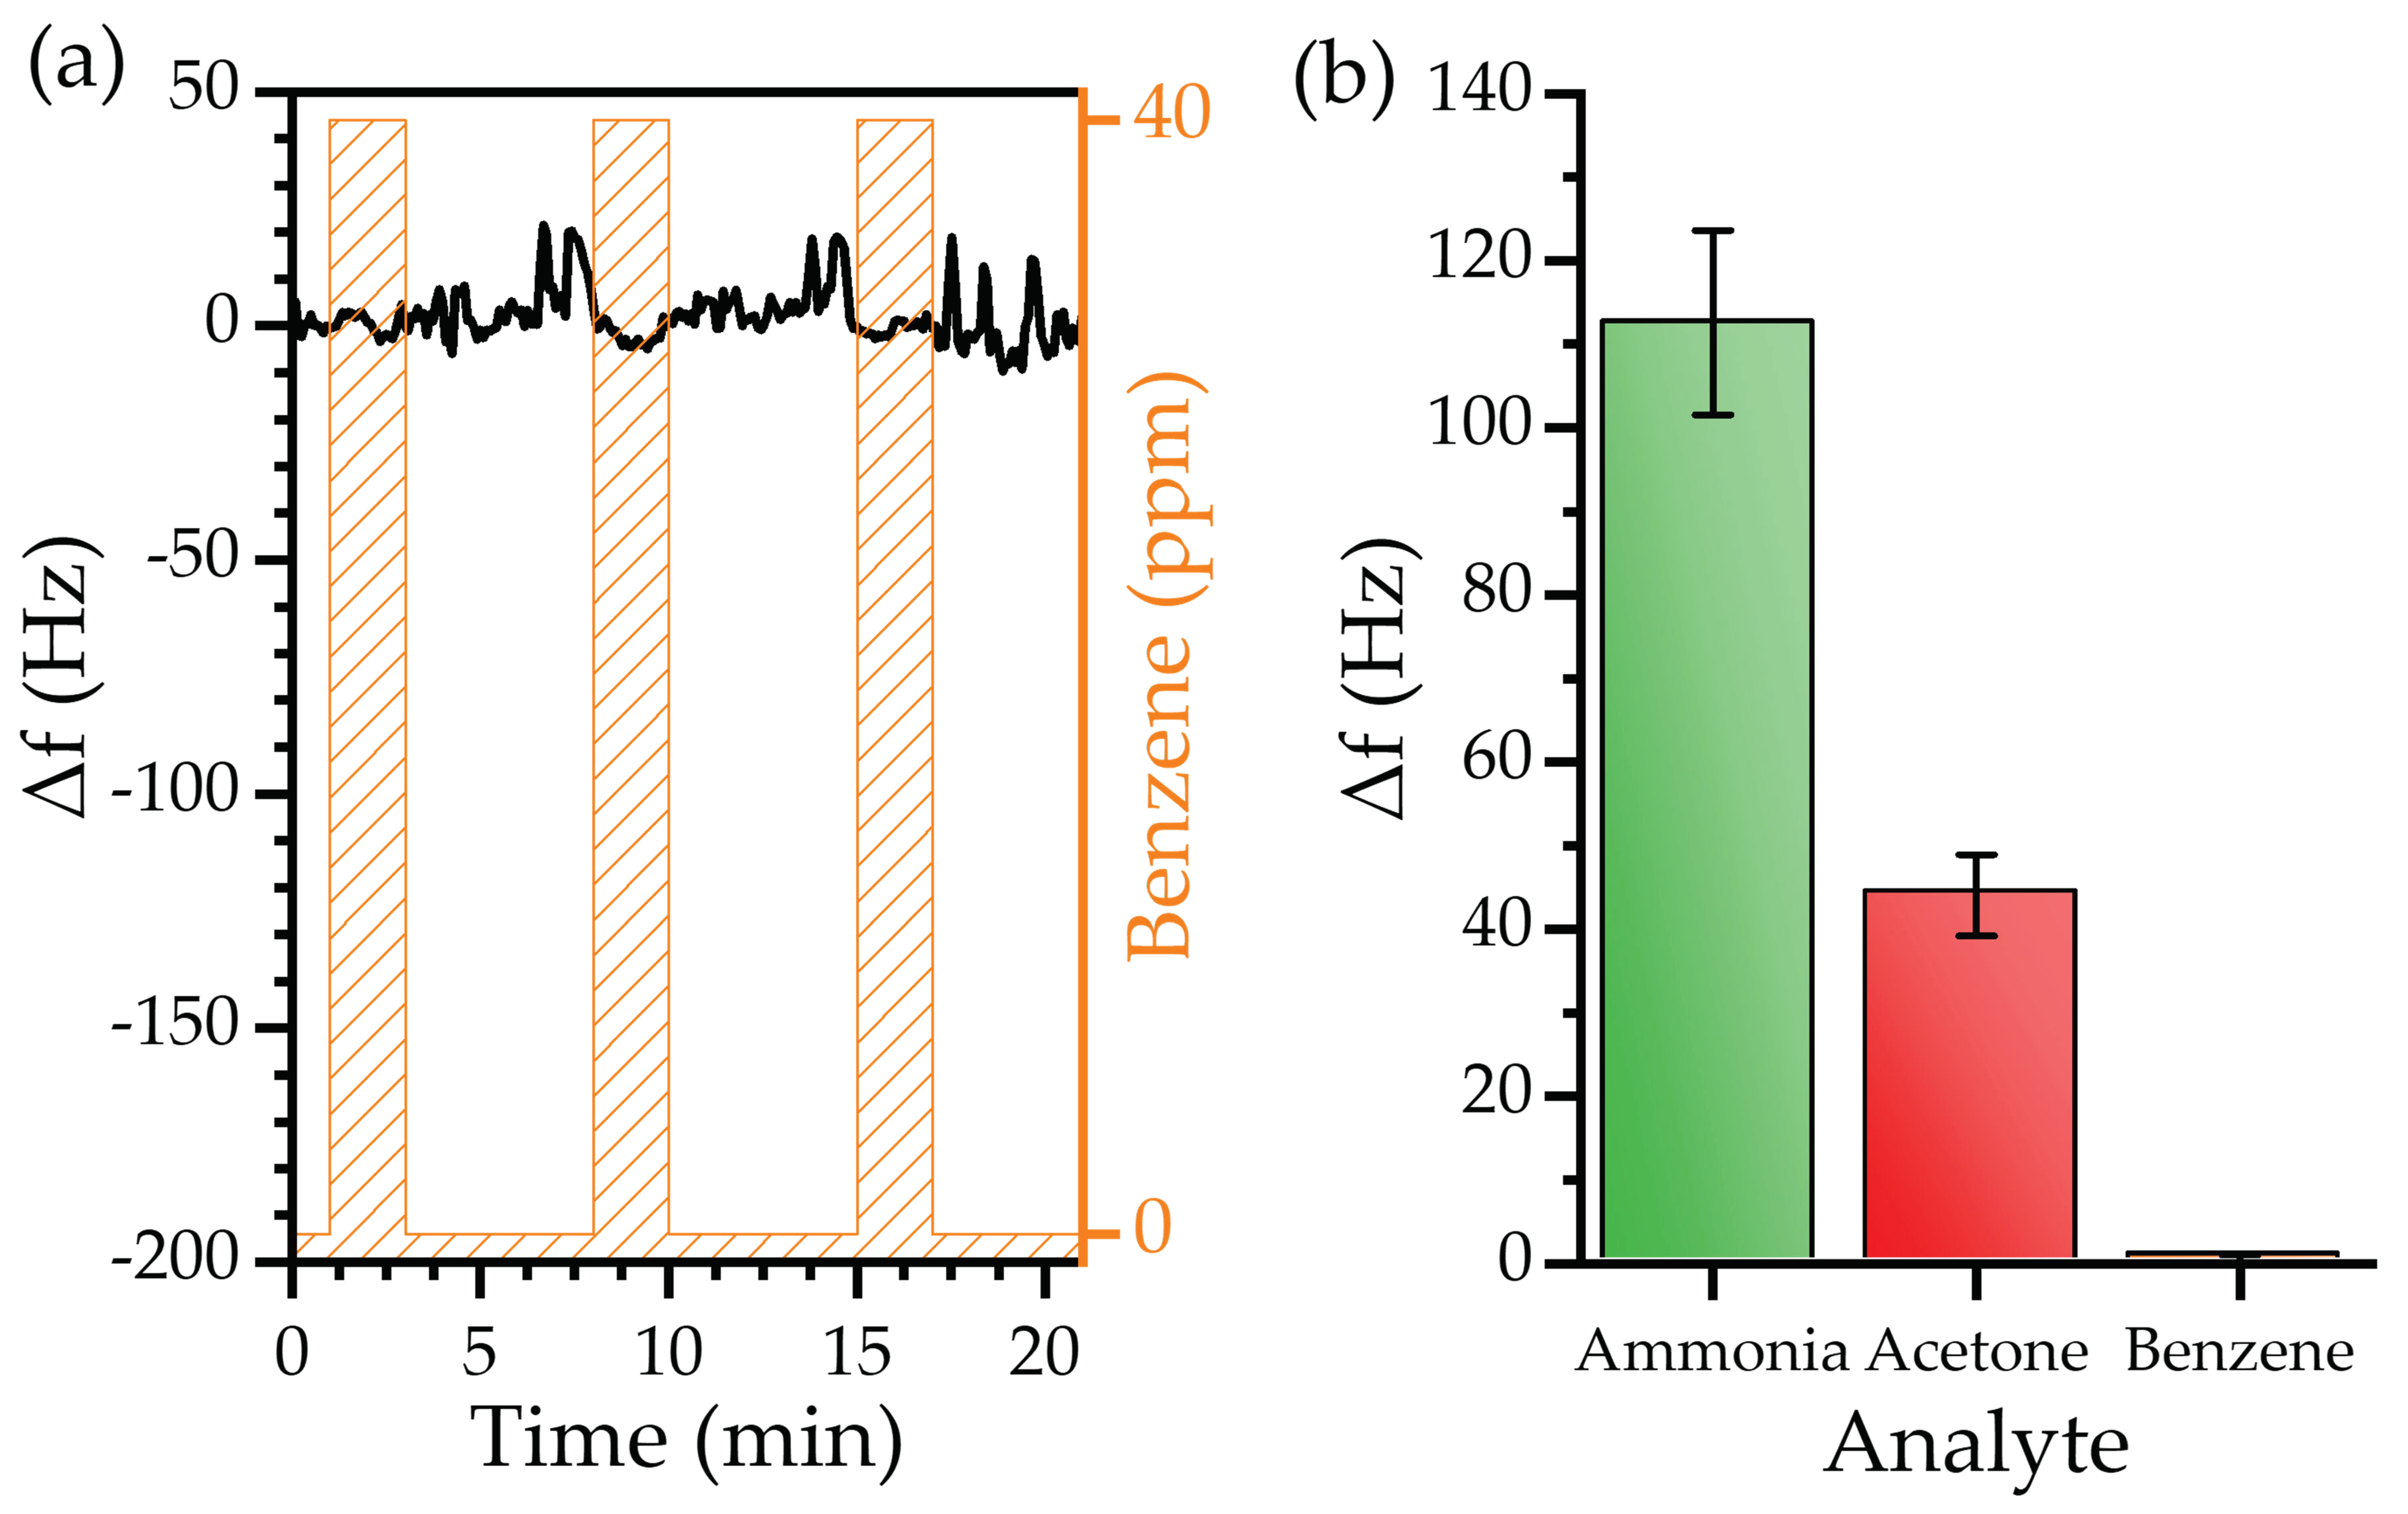
3.3.3. Exogeneous Biomarkers: Benzene

The last test was performed to study the effect of a common interferent biomarker in breath analysis, benzene (Figure 12a).
The MEGSs exhibited a neglectable response to 40 ppm of benzene, with a mean value of 0.5 ± 0.5 kHz. Compared to water, acetone, and ammonia, the sensor demonstrated an excellent performance, as the device showed an insignificant response to benzene. According to the relationship between the experimental responses, PVP nanofibers can bind with polar molecules, e.g., water, acetone, or ammonia with insignificant interaction with non-polar molecules such as benzene. In addition, the final selectivity is the product of many determinants of other solvation parameters [12,71]. The comparison between the three tested biomarkers highlights the fact that the device can target acetone and ammonia biomarkers without interference from benzene presence in exhaled breath (Figure 12b).
Table 1 presents a bibliographic compilation of gas sensors based on different technologies and compares them to our results. As it can be seen, the solution presented in this work and the high selectivity of the sensors open a new and promising field of research for magnetoelastic gas sensors, allowing the use of sensor arrays to classify diseases through exhaled breath.

4. Conclusions

In this work, we presented the development of a magnetoelastic resonance-based sensor with outstanding features like its real-time monitoring, contactless operation, low cost, and easy adaptability for monitoring of various gas biomarkers in exhaled breath. This proof of concept was based on three main components: a measuring system, a magnetoelastic ribbon transducer, and a sensitive layer.
The measuring system was designed for real-time monitoring of the resonance frequency and represents a significant breakthrough for the application of magnetoelastic resonance-based devices.
The sensitive layer consisted of PVP nanofibers electrospun on the magnetoelastic ribbon. With this functionalization, the device exhibited a good response toward humidity, acetone, and ammonia, with no effects from interferences like benzene.
The device was capable of relative humidity monitoring in a fast (<2 min) and reproducible manner. With a sensitivity linear up to 73% and a slope of −1.17% (0.1 Hz/%) added to a low RMS noise, the sensor’s limit of detection was as low as (5% RH). Moreover, the sensor showed an excellent response when exposed to human breath.
The sensor was able to detect up to 40 ppm of acetone or ammonia well within the exposure time (2 min), with excellent recovery and reproducibility. Future work will focus on improving the device toward sub-ppm detection by introducing modifications in the sensitive layer or in the transducer’s geometry.
It is worth noting that the device’s response was monitored in real time with swift data acquisition compared to traditional magnetoelastic sensors. This real-time monitoring sensor can pave the way for a new kind of sensor of gas biomarkers for medical applications.

Author Contributions

Conceptualization, A.P., D.M., C.H. and P.M.; methodology, A.P., J.D.A. and D.M.; computational simulations, J.D.A.; formal analysis, A.P., D.M. and A.H.; writing—original draft preparation, A.P. and D.M.; writing—review and editing, all authors; Project administration and funding acquisition, P.d.l.P., C.H. and P.M. All authors have read and agreed to the published version of the manuscript.

Funding

Author A.P. received funding from grant PRE2019-0875001234, Ministerio de Ciencia e Innovación (MCI), Spain. D.M. received funding from Comfuturo, Consejo Superior de Investigaciones Científicas, Spain. Authors A.P., D.M., P.M. and C.H. received funding from projects RTI2018-095856-B-C21 and RTI2018-095856-B-C22, Ministerio de Ciencia e Innovación, Spain. A.P. and P.M. received funding S2018/NMT-4321, Comunidad de Madrid. J.D.A received funding from Next Generation EU, Ministerio de Trabajo y Economía, Comunidad de Madrid, Spain, Programa Investigo from grant 96-UCM-INV.

Institutional Review Board Statement

Not applicable.

Informed Consent Statement

Informed consent was obtained from all subjects involved in the study.

Data Availability Statement

Not applicable.

Acknowledgments

A.P. acknowledges the assistance of Daniel Arranz from IMA during the real breath measurements.

Conflicts of Interest

The authors declare no conflict of interest.

References

  1. World Health Organization (WHO). Air Quality Guidelines for Europe, 2nd ed.; Theatkston, F., Ed.; WHO Regional Publications: Copenhagen, Denmark, 2000. [Google Scholar]
  2. Halios, C.H.; Landeg-Cox, C.; Lowther, S.D.; Middleton, A.; Marczylo, T.; Dimitroulopoulou, S. Chemicals in European Residences–Part I: A Review of Emissions, Concentrations and Health Effects of Volatile Organic Compounds (VOCs). Sci. Total Environ. 2022, 839, 156201. [Google Scholar] [CrossRef]
  3. Wieslander, G.; Norbäck, D.; Björnssonbjörnsson, E.; Janson, C.; Boman, G. Asthma and the Indoor Environment: The Significance of Emission of Formaldehyde and Volatile Organic Compounds from Newly Painted Indoor Surfaces. Swed. Int. Arch Occup. Environ. Health 1997, 69, 115–124. [Google Scholar] [CrossRef]
  4. Paterson, C.A.; Sharpe, R.A.; Taylor, T.; Morrissey, K. Indoor PM2.5, VOCs and Asthma Outcomes: A Systematic Review in Adults and Their Home Environments. Environ. Res. 2021, 202, 111631. [Google Scholar] [CrossRef]
  5. Matatagui, D.; López-Sánchez, J.; Peña, A.; Serrano, A.; del Campo, A.; de la Fuente, O.R.; Carmona, N.; Navarro, E.; Marín, P.; del Carmen Horrillo, M. Ultrasensitive NO2 Gas Sensor with Insignificant NH3-Interference Based on a Few-Layered Mesoporous Graphene. Sens. Actuators B Chem. 2021, 335, 129657. [Google Scholar] [CrossRef]
  6. Khan, M.A.H.; Rao, M.V.; Li, Q. Recent Advances in Electrochemical Sensors for Detecting Toxic Gases: NO2, SO2 and H2S. Sensors 2019, 19, 905. [Google Scholar] [CrossRef] [Green Version]
  7. Pandey, S.; Nanda, K.K. Au Nanocomposite Based Chemiresistive Ammonia Sensor for Health Monitoring. ACS Sens. 2016, 1, 55–62. [Google Scholar] [CrossRef]
  8. Liu, W.; Xu, L.; Sheng, K.; Zhou, X.; Dong, B.; Lu, G.; Song, H. A Highly Sensitive and Moisture-Resistant Gas Sensor for Diabetes Diagnosis with Pt@In2O3 Nanowires and a Molecular Sieve for Protection. NPG Asia Mater. 2018, 10, 293–308. [Google Scholar] [CrossRef] [Green Version]
  9. Nasiri, N.; Clarke, C. Nanostructured Gas Sensors for Medical and Health Applications: Low to High Dimensional Materials. Biosensors 2019, 9, 43. [Google Scholar] [CrossRef] [Green Version]
  10. Tai, H.; Wang, S.; Duan, Z.; Jiang, Y. Evolution of Breath Analysis Based on Humidity and Gas Sensors: Potential and Challenges. Sens. Actuators B Chem. 2020, 318, 128104. [Google Scholar] [CrossRef]
  11. Länge, K. Bulk and Surface Acoustic Wave Sensor Arrays for Multi-Analyte Detection: A Review. Sensors 2019, 19, 5382. [Google Scholar] [CrossRef]
  12. Matatagui, D.; Martí, J.; Fernández, M.J.; Fontecha, J.L.; Gutiérrez, J.; Grcia, I.; Cané, C.; Horrillo, M.C. Chemical Warfare Agents Simulants Detection with an Optimized SAW Sensor Array. Sens. Actuators B Chem. 2011, 154, 199–205. [Google Scholar] [CrossRef]
  13. Fragoso-Mora, J.R.; Matatagui, D.; Bahos, F.A.; Fontecha, J.; Fernandez, M.J.; Santos, J.P.; Sayago, I.; Gràcia, I.; Horrillo, M.C. Gas Sensors Based on Elasticity Changes of Nanoparticle Layers. Sens. Actuators B Chem. 2018, 268, 93–99. [Google Scholar] [CrossRef]
  14. di Natale, C.; Macagnano, A.; Martinelli, E.; Paolesse, R.; D’Arcangelo, G.; Roscioni, C.; Finazzi-Agrò, A.; D’Amico, A. Lung Cancer Identification by the Analysis of Breath by Means of an Array of Non-Selective Gas Sensors. Biosens. Bioelectron. 2003, 18, 1209–1218. [Google Scholar] [CrossRef]
  15. Güntner, A.T.; Abegg, S.; Königstein, K.; Gerber, P.A.; Schmidt-Trucksäss, A.; Pratsinis, S.E. Breath Sensors for Health Monitoring. ACS Sens. 2019, 4, 268–280. [Google Scholar] [CrossRef] [PubMed]
  16. Kaloumenou, M.; Skotadis, E.; Lagopati, N.; Efstathopoulos, E.; Tsoukalas, D. Breath Analysis: A Promising Tool for Disease Diagnosis—The Role of Sensors. Sensors 2022, 22, 1238. [Google Scholar] [CrossRef] [PubMed]
  17. Nakhleh, M.K.; Amal, H.; Jeries, R.; Broza, Y.Y.; Aboud, M.; Gharra, A.; Ivgi, H.; Khatib, S.; Badarneh, S.; Har-Shai, L.; et al. Diagnosis and Classification of 17 Diseases from 1404 Subjects via Pattern Analysis of Exhaled Molecules. ACS Nano 2017, 11, 112–125. [Google Scholar] [CrossRef] [PubMed] [Green Version]
  18. Wallace, L.; Buckley, T.; Pellizzari, E.; Gordon3, S. Breath Measurements as Volatile Organic Compound Biomarkers. Environ. Health Perspect. 1996, 104, 861–869. [Google Scholar]
  19. Blanchet, L.; Smolinska, A.; Baranska, A.; Tigchelaar, E.; Swertz, M.; Zhernakova, A.; Dallinga, J.W.; Wijmenga, C.; van Schooten, F.J. Factors That Influence the Volatile Organic Compound Content in Human Breath. J. Breath. Res. 2017, 11, 016013. [Google Scholar] [CrossRef] [PubMed]
  20. Hibbard, T.; Killard, A.J. Breath Ammonia Analysis: Clinical Application and Measurement. Crit. Rev. Anal. Chem. 2011, 41, 21–35. [Google Scholar] [CrossRef]
  21. Dixit, K.; Fardindoost, S.; Ravishankara, A.; Tasnim, N.; Hoorfar, M. Exhaled Breath Analysis for Diabetes Diagnosis and Monitoring: Relevance, Challenges and Possibilities. Biosensors 2021, 11, 476. [Google Scholar] [CrossRef] [PubMed]
  22. Kearney, D.J.; Hubbard, T.; Putnam, D. Breath Ammonia Measurement in Helicobacter Pylori Infection. Dig. Dis. Sci. 2002, 47, 2523–2530. [Google Scholar] [CrossRef] [PubMed]
  23. Narasimhan, L.R.; Goodman, W.; Kumar, C.; Patel, N. Correlation of Breath Ammonia with Blood Urea Nitrogen and Creatinine during Hemodialysis. Proc. Natl. Acad. Sci. USA 2001, 98, 4617–4621. [Google Scholar] [CrossRef] [PubMed] [Green Version]
  24. MacGregor, G.; Ellis, S.; Andrews, J.; Imrie, M.; Innes, A.; Greening, A.P.; Cunningham, S. Breath Condensate Ammonium Is Lower in Children with Chronic Asthma. Eur. Respir. J. 2005, 26, 271–276. [Google Scholar] [CrossRef] [Green Version]
  25. Turner, C.; Walton, C.; Hoashi, S.; Evans, M. Breath Acetone Concentration Decreases with Blood Glucose Concentration in Type i Diabetes Mellitus Patients during Hypoglycaemic Clamps. J. Breath. Res. 2009, 3, 046004. [Google Scholar] [CrossRef] [PubMed]
  26. Wang, D.; Zhang, F.; Prabhakar, A.; Qin, X.; Forzani, E.S.; Tao, N. Colorimetric Sensor for Online Accurate Detection of Breath Acetone. ACS Sens. 2021, 6, 450–453. [Google Scholar] [CrossRef] [PubMed]
  27. Wang, Z.; Wang, C. Is Breath Acetone a Biomarker of Diabetes? A Historical Review on Breath Acetone Measurements. J Breath. Res. 2013, 7, 037109. [Google Scholar] [CrossRef] [PubMed] [Green Version]
  28. Simić, M.; Stavrakis, A.K.; Sinha, A.; Premčevski, V.; Markoski, B.; Stojanović, G.M. Portable Respiration Monitoring System with an Embroidered Capacitive Facemask Sensor. Biosensors 2022, 12, 339. [Google Scholar] [CrossRef] [PubMed]
  29. Ren, L.; Yu, K.; Tan, Y. Applications and Advances of Magnetoelastic Sensors in Biomedical Engineering: A Review. Materials 2019, 12, 1135. [Google Scholar] [CrossRef] [Green Version]
  30. Rivero, G.; Multigner, M.; Spottorno, J. Magnetic Sensors for Biomedical Applications. In Magnetic Sensors; Kuang, K., Ed.; IntechOpen: London, UK, 2012; pp. 125–150. [Google Scholar]
  31. Marín, P.; López, M.; Agudo, P.; Vázquez, M.; Hernando, A. Applications of Amorphous Samples Presenting High Magnetomechanical Coupling during the First Stages of Nanocrystallisation Process. Sens Actuators A Phys. 2001, 91, 218–222. [Google Scholar] [CrossRef]
  32. Marín, P.; Vázquez, M.; Olofinjana, A.; Davies, H.A. Influence of Cu and Nb on Relaxation and Crystallization of Amorphous FeSiB(CuNb) Wires. Nanostruct. Mater. 1998, 10, 299–310. [Google Scholar] [CrossRef]
  33. Coben, A.F.; Zhukov, A.P.; Pina, E.; Blanco, J.M.; Gonzalez, J.; Barandiaran, J.M. Sensitive Magnetoelastic Properties of Amorphous Ribbon for Magnetoelastic Sensors. J. Magn. Magn. Mater. 2000, 215, 743–745. [Google Scholar] [CrossRef]
  34. O’Handley, R.C. Modern Magnetic Materials: Principles and Applications; Wiley-Interscience: New York, NY, USA, 2000. [Google Scholar]
  35. Gutiérrez, J.; Muto, V.; Squire, P.T. Induced Anisotropy and Magnetoelastic Properties in Fe-Rich Metallic Glasses. J. Non Cryst. Solids 2001, 287, 417–420. [Google Scholar] [CrossRef]
  36. Villari, E. Intorno alle modificazioni del momento magnetico di una verga di ferro e di acciaio, prodotte per la trazione della medesima e pel passaggio di una corrente attraverso la stessa. Il Nuovo Cimento 1864, 20, 317–362. [Google Scholar] [CrossRef]
  37. Joule, J.P. XVII. On the Effects of Magnetism upon the Dimensions of Iron and Steel Bars. Lond. Edinb. Dublin Philos. Mag. J. Sci. 1847, 30, 76–87. [Google Scholar] [CrossRef] [Green Version]
  38. Saiz, P.G.; Fernández De Luis, R.; Lasheras, A.; Arriortua, M.I.; Lopes, A.C. Magnetoelastic Resonance Sensors: Principles, Applications, and Perspectives. ACS Sens. 2022, 7, 1248–1268. [Google Scholar] [CrossRef]
  39. Mungle, C.; Grimes, C.A.; Dreschel, W.R. Magnetic Field Tuning of the Frequency and Temperature Response of a Magnetoelastic Sensor. Sens. Actuators A 2002, 101, 143–149. [Google Scholar] [CrossRef]
  40. Peña, A.; Matatagui, D.; Marín, P.; Cruz, C.; Horrillo, C. Study of Magnetoelastic Resonance for Chemical Sensors: Ribbons vs. Microwires. In Proceedings of the 2021 13th Spanish Conference on Electron Devices (CDE), Sevilla, Spain, 9–11 June 2021. [Google Scholar] [CrossRef]
  41. Grimes, C.A.; Kouzoudis, D.; Mungle, C. Simultaneous Measurement of Liquid Density and Viscosity Using Remote Query Magnetoelastic Sensors. Rev. Sci. Instrum. 2000, 71, 3822–3824. [Google Scholar] [CrossRef]
  42. Atalay, S.; Kolat, V.S.; Bayri, N.; Izgi, T. Magnetoelastic Sensor Studies on Amorphous Magnetic FeSiB Wire and the Application in Viscosity Measurement. J. Supercond. Nov. Magn. 2016, 29, 1551–1556. [Google Scholar] [CrossRef]
  43. Marín, P.; Marcos, M.; Hernando, A. High Magnetomechanical Coupling on Magnetic Microwire for Sensors with Biological Applications. Appl. Phys. Lett. 2010, 96, 11–14. [Google Scholar] [CrossRef] [Green Version]
  44. Kouzoudis, D.; Grimes, C.A. The Frequency Response of Magnetoelastic Sensors to Stress and Atmospheric Pressure. Smart Mater. Struct. 2000, 9, 885–889. [Google Scholar] [CrossRef]
  45. Hernando, A.; Vazquez, M.; Barandiaran, J.M. Metallic Glasses and Sensing Applications. J. Phys. E Sci. Instrum. 1988, 21, 1129–1139. [Google Scholar] [CrossRef]
  46. Guo, X.; Sang, S.; Guo, J.; Jian, A.; Duan, Q.; Ji, J.; Zhang, Q.; Zhang, W. A Magnetoelastic Biosensor Based on E2 Glycoprotein for Wireless Detection of Classical Swine Fever Virus E2 Antibody. Sci. Rep. 2017, 7, 15626. [Google Scholar] [CrossRef] [PubMed] [Green Version]
  47. Huang, S.J.; Wang, Y.J.; Cai, Q.Y.; Fang, J. de Detection of Staphylococcus Aureus in Different Liquid Mediums Using Wireless Magnetoelastic Sensor. Chin. J. Anal. Chem. 2010, 38, 105–108. [Google Scholar] [CrossRef]
  48. Pang, P.; Xiao, X.; Cai, Q.; Yao, S.; Grimes, C.A. A Wireless Magnetoelastic-Sensing Device for in Situ Evaluation of Pseudomonas Aeruginosa Biofilm Formation. Sens. Actuators B Chem. 2008, 133, 473–477. [Google Scholar] [CrossRef]
  49. Ruan, C.; Zeng, K.; Varghese, O.K.; Grimes, C.A. Magnetoelastic Immunosensors: Amplified Mass Immunosorbent Assay for Detection of Escherichia Coli O157:H7. Anal. Chem. 2003, 75, 6494–6498. [Google Scholar] [CrossRef]
  50. Gao, X.; Yang, W.; Pang, P.; Liao, S.; Cai, Q.; Zeng, K.; Grimes, C.A. A Wireless Magnetoelastic Biosensor for Rapid Detection of Glucose Concentrations in Urine Samples. Sens. Actuators B Chem. 2007, 128, 161–167. [Google Scholar] [CrossRef]
  51. Cai, Q.; Zeng, K.; Ruan, C.; Desai, T.A.; Grimes, C.A. A Wireless, Remote Query Glucose Biosensor Based on a PH-Sensitive Polymer. Anal. Chem. 2004, 76, 4038–4043. [Google Scholar] [CrossRef]
  52. Puckett, L.G.; Barrett, G.; Kouzoudis, D.; Grimes, C.; Bachas, L.G. Monitoring Blood Coagulation with Magnetoelastic Sensors. Biosens. Bioelectron. 2003, 18, 675–681. [Google Scholar] [CrossRef]
  53. Holmes, H.R.; Tan, E.L.; Ong, K.G.; Rajachar, R.M. Fabrication of Biocompatible, Vibrational Magnetoelastic Materials for Controlling Cellular Adhesion. Biosensors 2012, 2, 57–69. [Google Scholar] [CrossRef] [PubMed] [Green Version]
  54. Baimpos, T.; Gora, L.; Nikolakis, V.; Kouzoudis, D. Selective Detection of Hazardous VOCs Using Zeolite/Metglas Composite Sensors. Sens. Actuators A Phys. 2012, 186, 21–31. [Google Scholar] [CrossRef]
  55. Cai, Q.Y.; Jain, M.K.; Grimes, C.A. A Wireless, Remote Query Ammonia Sensor. Sens. Actuators B 2001, 77, 614–619. [Google Scholar] [CrossRef]
  56. Cai, Q.Y.; Cammers-Goodwin, A.; Grimes, C.A. A Wireless, Remote Query Magnetoelastic CO2 Sensor. J. Environ. Monit. 2000, 2, 556–560. [Google Scholar] [CrossRef]
  57. Grimes, C.A.; Roy, S.C.; Rani, S.; Cai, Q. Theory, Instrumentation and Applications of Magnetoelastic Resonance Sensors: A Review. Sensors 2011, 11, 2809–2844. [Google Scholar] [CrossRef]
  58. Sang, S.; Li, Y.; Guo, X.; Zhang, B.; Xue, X.; Zhuo, K.; Zhao, C.; Zhang, W.; Yuan, Z. A Portable Device for Rapid Detection of Human Serum Albumin Using an Immunoglobulin-Coating-Based Magnetoelastic Biosensor. Biosens. Bioelectron. 2019, 141, 111399. [Google Scholar] [CrossRef]
  59. Ayazi, F.; Kim, C.-J. Institute of Electrical and Electronics Engineers. In Proceedings of the MEMS 2014: The 27th IEEE International Conference on Micro Electro Mechanical Systems, San Francisco, CA, USA, 26–30 January 2014. [Google Scholar]
  60. Phillips, M.; Herrera, J.; Krishnan, S.; Zain, M.; Greenberg, J.; Cataneo, R.N. Variation in Volatile Organic Compounds in the Breath of Normal Humans. J. Chromatogr. B Biomed. Sci. Appl. 1999, 729, 75–78. [Google Scholar] [CrossRef]
  61. Jain, M.K.; Schmidt, S.; Ong, G.; Mungle, C.; Grimes, C.A. Magnetoacoustic Remote Query Temperature and Humidity Sensors. Smart Mater. Struct. 2000, 9, 502–510. [Google Scholar] [CrossRef]
  62. Matatagui, D.; Fernández, M.J.; Santos, J.P.; Fontecha, J.; Sayago, I.; Horrillo, M.C.; Gràcia, I.; Cané, C. Real-Time Characterization of Electrospun PVP Nanofibers as Sensitive Layer of a Surface Acoustic Wave Device for Gas Detection. J. Nanomater. 2014, 2014, 1–8. [Google Scholar] [CrossRef]
  63. Herrero-Gómez, C.; Marín, P.; Hernando, A. Bias Free Magnetomechanical Coupling on Magnetic Microwires for Sensing Applications. Appl. Phys. Lett. 2013, 103, 142414. [Google Scholar] [CrossRef] [Green Version]
  64. Apicella, V.; Clemente, C.S.; Davino, D.; Leone, D.; Visone, C. Magneto-Mechanical Optimization and Analysis of a Magnetostrictive Cantilever Beam for Energy Harvesting. J. Magn. Magn. Mater. 2019, 475, 401–407. [Google Scholar] [CrossRef]
  65. Gonzalez, G. Foundations of Oscillator Circuit Design, 1st ed.; Artech: Morristown, NJ, USA, 2007. [Google Scholar]
  66. Lopes, A.C.; Sagasti, A.; Lasheras, A.; Muto, V.; Gutiérrez, J.; Kouzoudis, D.; Barandiarán, J.M. Accurate Determination of the Q Quality Factor in Magnetoelastic Resonant Platforms for Advanced Biological Detection. Sensors 2018, 18, 887. [Google Scholar] [CrossRef] [PubMed]
  67. Sisniega, B.; Gutiérrez, J.; Muto, V.; García-Arribas, A. Improved Determination of q Quality Factor and Resonance Frequency in Sensors Based on the Magnetoelastic Resonance through the Fitting to Analytical Expressions. Materials 2020, 13, 4708. [Google Scholar] [CrossRef]
  68. Saiz, P.G.; Gandia, D.; Lasheras, A.; Sagasti, A.; Quintana, I.; Fdez-Gubieda, M.L.; Gutiérrez, J.; Arriortua, M.I.; Lopes, A.C. Enhanced Mass Sensitivity in Novel Magnetoelastic Resonators Geometries for Advanced Detection Systems. Sens. Actuators B Chem. 2019, 296, 126612. [Google Scholar] [CrossRef]
  69. Livingston, J.D. Magnetomechanical Properties of Amorphous Metals. Physica Status Solidi (a) 1982, 70, 591–596. [Google Scholar] [CrossRef]
  70. Sisniega, B.; Sedano, A.S.; Gutiérrez, J.; García-Arribas, A. Real Time Monitoring of Calcium Oxalate Precipitation Reaction by Using Corrosion Resistant Magnetoelastic Resonance Sensors. Sensors 2020, 20, 2802. [Google Scholar] [CrossRef] [PubMed]
  71. Hierlernann, A.; Zellers, E.T.; Ricco, A.J. Use of Linear Solvation Energy Relationships for Modeling Responses from Polymer-Coated Acoustic-Wave Vapor Sensors. Anal. Chem. 2001, 73, 3458–3466. [Google Scholar] [CrossRef]
  72. Song, X.; Hu, R.; Xu, S.; Liu, Z.; Wang, J.; Shi, Y.; Xu, J.; Chen, K.; Yu, L. Highly Sensitive Ammonia Gas Detection at Room Temperature by Integratable Silicon Nanowire Field-Effect Sensors. ACS Appl. Mater. Interfaces 2021, 13, 14377–14384. [Google Scholar] [CrossRef]
  73. Li, S.; Liu, A.; Yang, Z.; He, J.; Wang, J.; Liu, F.; Lu, H.; Yan, X.; Sun, P.; Liang, X.; et al. Room Temperature Gas Sensor Based on Tin Dioxide@ Polyaniline Nanocomposite Assembled on Flexible Substrate: Ppb-Level Detection of NH3. Sens. Actuators B Chem. 2019, 299, 126970. [Google Scholar] [CrossRef]
  74. Guo, Z.; Wang, B.; Wang, X.; Li, Y.; Gai, S.; Wu, Y.; Cheng, X. A High-Sensitive Room Temperature Gas Sensor Based on Cobalt Phthalocyanines and Reduced Graphene Oxide Nanohybrids for the Ppb-Levels of Ammonia Detection. RSC Adv. 2019, 9, 37518–37525. [Google Scholar] [CrossRef] [PubMed]
  75. Kim, K.; Choi, P.G.; Itoh, T.; Masuda, Y. Catalyst-Free Highly Sensitive SnO2 Nanosheet Gas Sensors for Parts per Billion-Level Detection of Acetone. ACS Appl. Mater. Interfaces 2020, 12, 51637–51644. [Google Scholar] [CrossRef] [PubMed]
  76. Kou, X.; Meng, F.; Chen, K.; Wang, T.; Sun, P.; Liu, F.; Yan, X.; Sun, Y.; Liu, F.; Shimanoe, K.; et al. High-Performance Acetone Gas Sensor Based on Ru-Doped SnO2 Nanofibers. Sens. Actuators B Chem. 2020, 320, 128292. [Google Scholar] [CrossRef]
  77. Wang, H.; Nie, S.; Li, H.; Ali, R.; Fu, J.; Xiong, H.; Li, J.; Wu, Z.; Lau, W.M.; Mahmood, N.; et al. 3D Hollow Quasi-Graphite Capsules/Polyaniline Hybrid with a High Performance for Room-Temperature Ammonia Gas Sensors. ACS Sens. 2019, 4, 2343–2350. [Google Scholar] [CrossRef] [PubMed]
  78. Escobedo, P.; Erenas, M.M.; López-Ruiz, N.; Carvajal, M.A.; Gonzalez-Chocano, S.; de Orbe-Payá, I.; Capitán-Valley, L.F.; Palma, A.J.; Martínez-Olmos, A. Flexible Passive near Field Communication Tag for Multigas Sensing. Anal. Chem. 2017, 89, 1697–1703. [Google Scholar] [CrossRef] [PubMed]
  79. Vásquez Quintero, A.; Molina-Lopez, F.; Smits, E.C.P.; Danesh, E.; van den Brand, J.; Persaud, K.; Oprea, A.; Barsan, N.; Weimar, U.; de Rooij, N.F.; et al. Smart RFID Label with a Printed Multisensor Platform for Environmental Monitoring. Flex. Print. Electron. 2016, 1, 025003. [Google Scholar] [CrossRef] [Green Version]
  80. Clément, P.; Ramos, A.; Lazaro, A.; Molina-Luna, L.; Bittencourt, C.; Girbau, D.; Llobet, E. Oxygen Plasma Treated Carbon Nanotubes for the Wireless Monitoring of Nitrogen Dioxide Levels. Sens. Actuators B Chem. 2015, 208, 444–449. [Google Scholar] [CrossRef]
  81. Atalay, S.; Izgi, T.; Kolat, V.S.; Erdemoglu, S.; Inan, O.O. Magnetoelastic Humidity Sensors with TiO2 Nanotube Sensing Layers. Sensors 2020, 20, 425. [Google Scholar] [CrossRef] [PubMed] [Green Version]
  82. Baimpos, T.; Boutikos, P.; Nikolakis, V.; Kouzoudis, D. A Polymer-Metglas Sensor Used to Detect Volatile Organic Compounds. Sens. Actuators A Phys. 2010, 158, 249–253. [Google Scholar] [CrossRef]
Figure 1. Schematics of the sensor cell, which includes cover (1), magnetoelastic microribbon (2), permanent magnet (3), and main body (4).
Biosensors 12 00871 g001
Figure 2. (a) Schematics of the oscillator circuit and electrical characterization setups for (b) frequency spectra and (c) real-time oscillator monitoring.
Biosensors 12 00871 g002
Figure 3. Experimental setup for the real-time monitoring of the magnetoelastic resonance-based gas sensor.
Biosensors 12 00871 g003
Figure 4. SEM images of the electrospun sensitive layer deposited over the transducer.
Biosensors 12 00871 g004
Figure 5. Frequency spectra of the transducer with and without the sensitive layer functionalization. Simulation results are used to illustrate the magnetoelastic resonance in the gain spectra for the no resonance state (NR) and the first (R1) and second (R2) harmonic of the magnetoelastic resonance.
Biosensors 12 00871 g005
Figure 6. Schematic representation of the hot sensing areas for (a) the first and (b) second harmonics of the magnetoelastic resonance.
Biosensors 12 00871 g006
Figure 7. High-resolution frequency spectra for the quality factor determination with 13 Hz steps (black line) and 0.2 Hz steps (red line).
Biosensors 12 00871 g007
Figure 8. Real-time frequency shift of the device exposed to different RH levels.
Biosensors 12 00871 g008
Figure 9. (a) Calibration curve, (b) τ90 calculation method, and (c) τ90 values for the sensor humidity test.
Biosensors 12 00871 g009
Figure 10. Breath detection test, the resonance frequency (red area) shifts to lower values as a response to exhalation events.
Biosensors 12 00871 g010
Figure 11. Real-time frequency shift of the device exposed to 40 ppm of (a) acetone (gas) and (b) ammonia (gas).
Biosensors 12 00871 g011
Figure 12. (a) Real-time frequency shift of the device exposed to 40 ppm of benzene (gas) and (b) comparison between the MEGS response to 40 ppm of ammonia, acetone, and benzene.
Biosensors 12 00871 g012
Table 1. Comparison table for different sensor technologies examples.
Techn.Main approachWirelessAnalyteMeasurementResponse/Recovery TimeRef.
CRSilicon nanowires arrayNoNH3/Air–100 ppbReal time~20 s both[72]
CRTin dioxide @polyaniline compositeNoNH3/Air–100 ppmReal time125 s/167 s[73]
CRCobalt phtalocyanines and reduced graphene oxide nanohybridsNoNH3/Air–100 ppbReal timeResponse time 45 s, UV light used to speed up recovery[74]
CRSnO2 nanosheetNoAcetone/Air–1 ppmReal time40 s/610 s[75]
CRRu-doped SnO2 nanofibersNoAcetone/Air–100 ppmReal time1 s/36 s[76]
CRHollow Quasi-Graphite capsules/Polyaniline hybridNoNH3/Air–100 ppmReal time34 s/42 s[77]
Opt.Near Field Communication (NFC) technology, white LED as excitation sourceYesNH3/N2–0.15% volReal time5.43 min/6.64 min[78]
Cap.HF RFID (High-Frequency Radiofrequency Identification) smart labelYesNH3/Air–5 ppm30 s each measure, 1 min period~30 min[79]
CRRH–20 to 40%5.43 min/6.64 min
CROxygen plasma-treated carbon nanotubesYesNH3/Air–0–5 ppm30 s each measure, 1 min period ~30 min[80]
METiO2 nanotubes on amorphous ribbonYesRH–20 to 40%4 s between each measurement5.43 min/6.64 min[81]
MEBAYHYDROL-110 on Metglas ribbonYesRH–10 to 80%1 min between each measurementFew min[82]
MEPoly (acrylic acid co-isooctylacrylate) on Metglas ribbonYesNH3/N2–0.8% vol1 min between each measurement~15 min[55]
RH–0 to 15%~1 min/several min
MEPVP nanofiber-functionalized micro ribbonYesRH–17 to 95%Real time<2 minThis work
Acetone/Air–40 ppm
NH3/Air–40 ppm
Benzene/Air–40 ppm
Abbreviations: CR: Chemoresistive sensors; Opt.: Optical; Cap.: Capacitive; ME: Magnetoelastic resonance-based sensors.
Publisher’s Note: MDPI stays neutral with regard to jurisdictional claims in published maps and institutional affiliations.

