Communication

Distinguishing Amyloid β-Protein in a Mouse Model of Alzheimer’s Disease by Label-Free Vibrational Imaging

Key Laboratory of Optoelectronic Devices and Systems of Guangdong Province and the Ministry of Education, College of Physics and Optoelectronic Engineering, Shenzhen University, Shenzhen 518000, China
*
Author to whom correspondence should be addressed.
Biosensors 2021, 11(10), 365; https://doi.org/10.3390/bios11100365
Submission received: 26 August 2021 / Revised: 26 September 2021 / Accepted: 27 September 2021 / Published: 30 September 2021

Abstract

:
Due to the increase in the average age of humans, Alzheimer’s disease (AD) has become one of the disorders with the highest incidence worldwide. Abnormal amyloid β protein (Aβ) accumulation is believed to be the most common cause of AD. Therefore, distinguishing the lesion areas can provide clues for AD diagnosis. Here, we present an optical spectroscopy and imaging approach based on coherent anti-Stokes Raman scattering (CARS). Label-free vibrational imaging of Aβ in a mouse model of AD was performed to distinguish the lesion areas by studying the spectra of regions with and without Aβ plaques. Raman spectra in Aβ and non-Aβ regions exhibited a specific difference in the intensity ratio of the wave peaks detected at 2850 and 2930 cm−1. In the non-Aβ region, the ratio of the peak intensity at 2850 cm−1 to that at 2930 cm−1 was approximately 1, whereas that in the Aβ region was 0.8. This label-free vibrational imaging may provide a new method for the clinical diagnosis and basic research of AD.

1. Introduction

Dementia is a progressive neurodegenerative disease characterized by a decline in memory, thinking, learning, and cognitive functions. Alzheimer’s disease (AD) is the most common form of dementia, accounting for approximately 60–70% of the cases. The pathological characteristic of AD is the abnormal deposition of the amyloid β protein (Aβ) in the cortex and hippocampus. However, how Aβ plaques form and how they affect the nervous system remain unclear. The current mainstream hypothesis regarding the pathogenic mechanism of Aβ is that the metabolism of the amyloid precursor protein (APP) and the subsequent condensation of Aβ are the major events driving AD. High levels of Aβ subsequently lead to a series of downstream pathological events, including the production of large intracellular neurofibrillary tangle (NFT) deposits, inflammation, oxidative stress, excitotoxicity, loss of synaptic connections, and cell death, which contribute to the clinical manifestations of AD [1,2,3,4]. Moreover, the underlying pathology of AD begins 10–20 years before the clinical symptoms appear [5]. Therefore, direct imaging of Aβ is of great significance in the diagnosis and prevention of AD. Several techniques have been developed to image Aβ plaques. For example, positron emission tomography (PET) can be used to clinically image Aβ deposition in vivo using various Aβ tracers, such as 11 C-labeled Pittsburgh compound-B [6,7]. In addition, magnetic resonance imaging (MRI) technology can also be used clinically to achieve non-invasive imaging of single plaques in vivo [8]. However, MRI is limited by its low spatial resolution, and PET relies on tracers and cannot achieve label-free imaging. In addition, several studies have shown that lipid metabolism in the brain of patients with AD is closely related to the formation of Aβ plaques [9,10].
Coherent anti-Stokes Raman scattering (CARS) microscopy is an emerging label-free vibrational imaging with chemical selection that has been widely applied in biology and medical research [11,12,13,14,15,16,17]. Because CARS can obtain spectral information while achieving unlabeled imaging, it is highly suitable for studying lipid metabolism and lipid distribution in the brain as well as for the identification of abnormal accumulation of Aβ in AD.
In this paper, we present an optical spectroscopy and imaging approach that is based on CARS imaging of lipid distribution by probing the intrinsic molecular vibrations. These vibrations allow the distinction of Aβ regions from non-Aβ regions based on the differences in the intensity ratio between 2850 and 2930 cm−1 in the CARS spectrum.

2. Materials and Methods

2.1. The CARS Microscope

Figure 1 provides a diagrammatic representation of the CARS microscope. The light source is a femtosecond (fs) laser (Chameleon Discovery, Coherent Inc.) with two outputs. One output generates a 1040 nm fs laser pulse (pulse width of 100 fs) with a repetition rate of 80 MHz, serving as the Stokes beam for the CARS imaging. The other output is tunable from 660 to 1320 nm (pulse width of 100 fs) and is used as the pump beam for the CARS imaging. We tuned the pump beam to 800 nm (Δω = 2850 cm−1) to match the CH2 vibration in lipids. The Stokes beam (1040 nm) was collinearly combined with the pump beam (800 nm) through a dichroic mirror and delivered to an upright laser scanning confocal microscope (MPM-SCAN4, Thorlabs Inc., America). The fs pump and Stokes laser beams were chirped using SF-57 glass rods with a length of 40.5 and 54 cm to generate a 2.0 picosecond (ps) pump beam and a 1.8 ps Stokes beam for hyperspectral CARS imaging, respectively, before they were combined with a dichroic mirror. The Raman shift differences between the pump and Stokes beams were scanned by controlling the time delay between the pump and Stokes pulses. A long-pass (680 nm) primary dichroic mirror was used to reflect the signal. Another long-pass (570 nm) secondary dichroic mirror was used to separate the signal to the CARS channel at 650 nm and to the two-photon excited fluorescence (TPEF) channel. After the application of a band-pass filter (650/10 nm, Thorlabs Inc., America), the CARS signal was detected using a photomultiplier tube (H7422-50, Hamamatsu photonics) and the TPEF signal was detected using another photomultiplier tube (H7422-40, Hamamatsu photonics). For CARS imaging, the output power of the pump light is ~50 mW, and for Stokes light, it is ~100 mW. The system was calibrated systematically. The depth of penetration is about 200 μm, which is measured in live imaging, and the field of view under a 20X water immersion objective is 810 × 810 μm. The spatial resolution is about 485 nm, and the spectral resolution is 23 cm−1.

2.2. Sample Preparation

Twelve-month-old transgenic mice (APP/PS1) were obtained from the Medical Animal Laboratory Center of Guangdong Province (permit number 44007200079864). All experiments were performed with approval of the Medical Department of Shenzhen University. The mice were euthanized by an intraperitoneal injection of 1% sodium pentobarbital (50 mg/kg, Sigma-Aldrich). Subsequently, 0.9% saline and 4% paraformaldehyde were perfused transcranially and chilled to 4 °C. Then, the brain was removed and fixed at 4 °C in 4% paraformaldehyde for 24 h, followed by staining with methoxy-X04(4,4′-[(2-methoxy-1,4-phenylene)di-(1E)-2,1-ethenediyl]bisphenol) (Xcess Biosciences Inc., CA 92109) at 10 µmol/L and paraffin embedding. A rotary microtome was used to cut the brain into five contiguous sections with a thickness of 6 µm.

3. Results

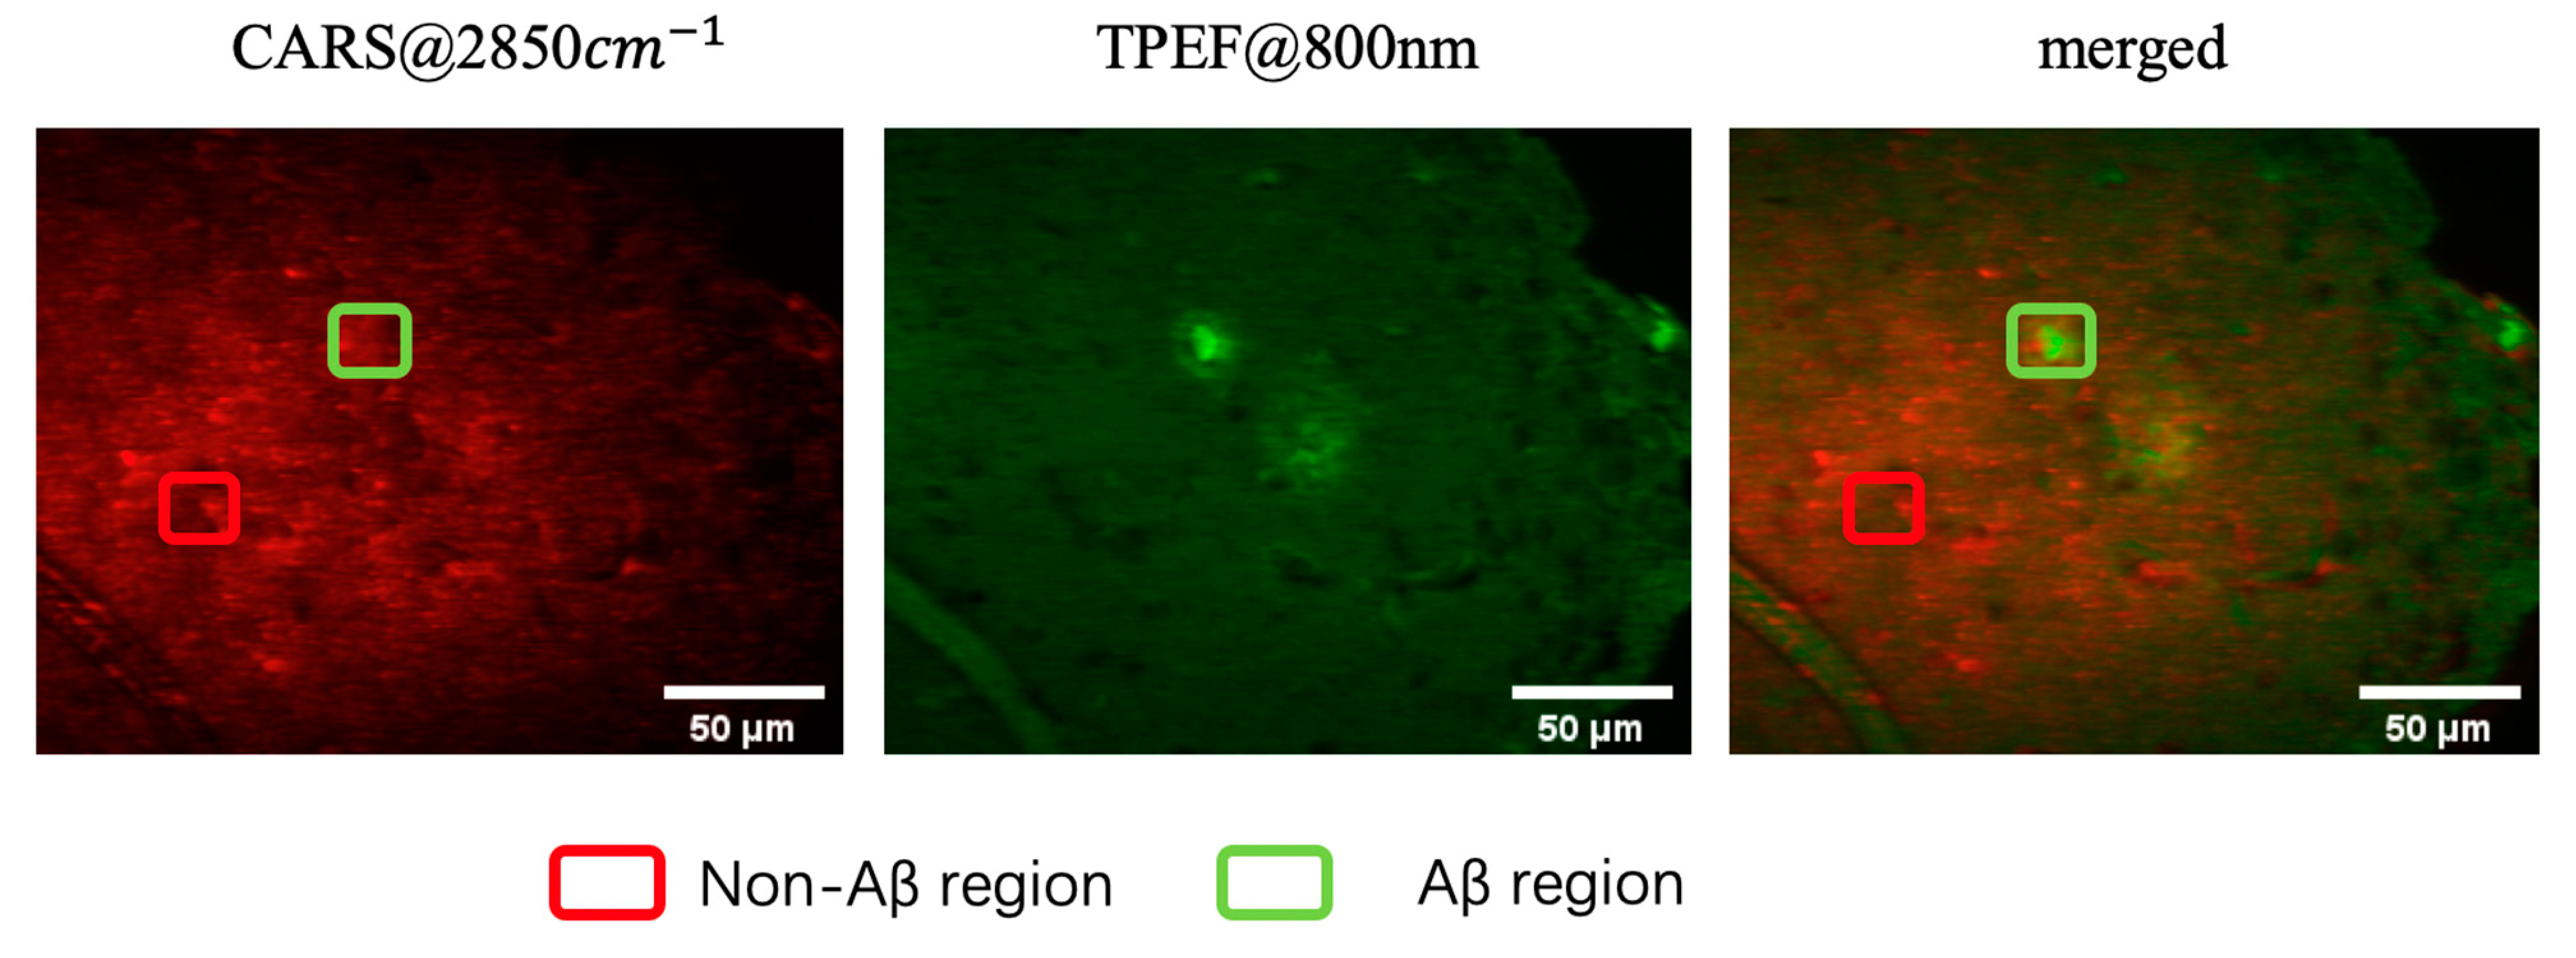
In this study, Aβ plaques in the brain slice of APP/PS1 transgenic mice were, first, stained by a fluorescent amyloid-β probe, methoxy-X04 [18,19,20,21], which emits strong TPEF. Then, the sample was imaged using TPEF and CARS, and the images were presented in green and red pseudo colors, respectively. The TPEF, CARS, and their merged images are shown in Figure 2. In this study, 20 samples from five different AD mouse are tested, with each mouse providing four samples. The imaging area was located in the cortex of the mouse brain. Lipid droplets in the brain tissue are excited by the CARS process. A prominent blood vessel can be observed in the lower-left area. However, the Aβ plaques were not detected in the CARS image. The middle panel of Figure 2 corresponds to the TPEF image of a brain tissue slice stained with methoxy-X04. Two Aβ plaques are clearly visible, one of which is not in the current focal plane. The merged image of TPEF and CARS (right panel in Figure 2) confirmed the location of the non-Aβ and Aβ regions.
CARS imaging generates contrast by probing the vibrational resonances in molecular bonds. In Raman spectroscopy, the spectrum is divided into three parts: the “fingerprint region,” from 400 to 1500 cm−1; the “silence region,” from 1500 to 2700 cm−1; the “C–H region,” from 2800 to 3100 cm−1. Most vibrational spectroscopy and microscopy approaches focus on the “C–H region” because the signal is stronger than that in the other regions. The C–H region contains strong CH2 and CH3 symmetrical and asymmetrical stretching modes. Lipids in each molecule typically contain long acyl chains with many C–H bonds. The analysis of the C–H region from 2800 to 3100 cm−1 allows the differentiation of molecular markers, such as lipids and proteins, based on the distinct ratio of the methylene CH2 to the methyl CH3 group. Moreover, the mouse brain tissue is rich in lipids and proteins that can produce strong CH2 and CH3 molecular vibration signals. The key aspect of multispectral CARS imaging is the acquisition of both highly spatially and spectrally resolved CARS images for subsequent analysis [22,23].
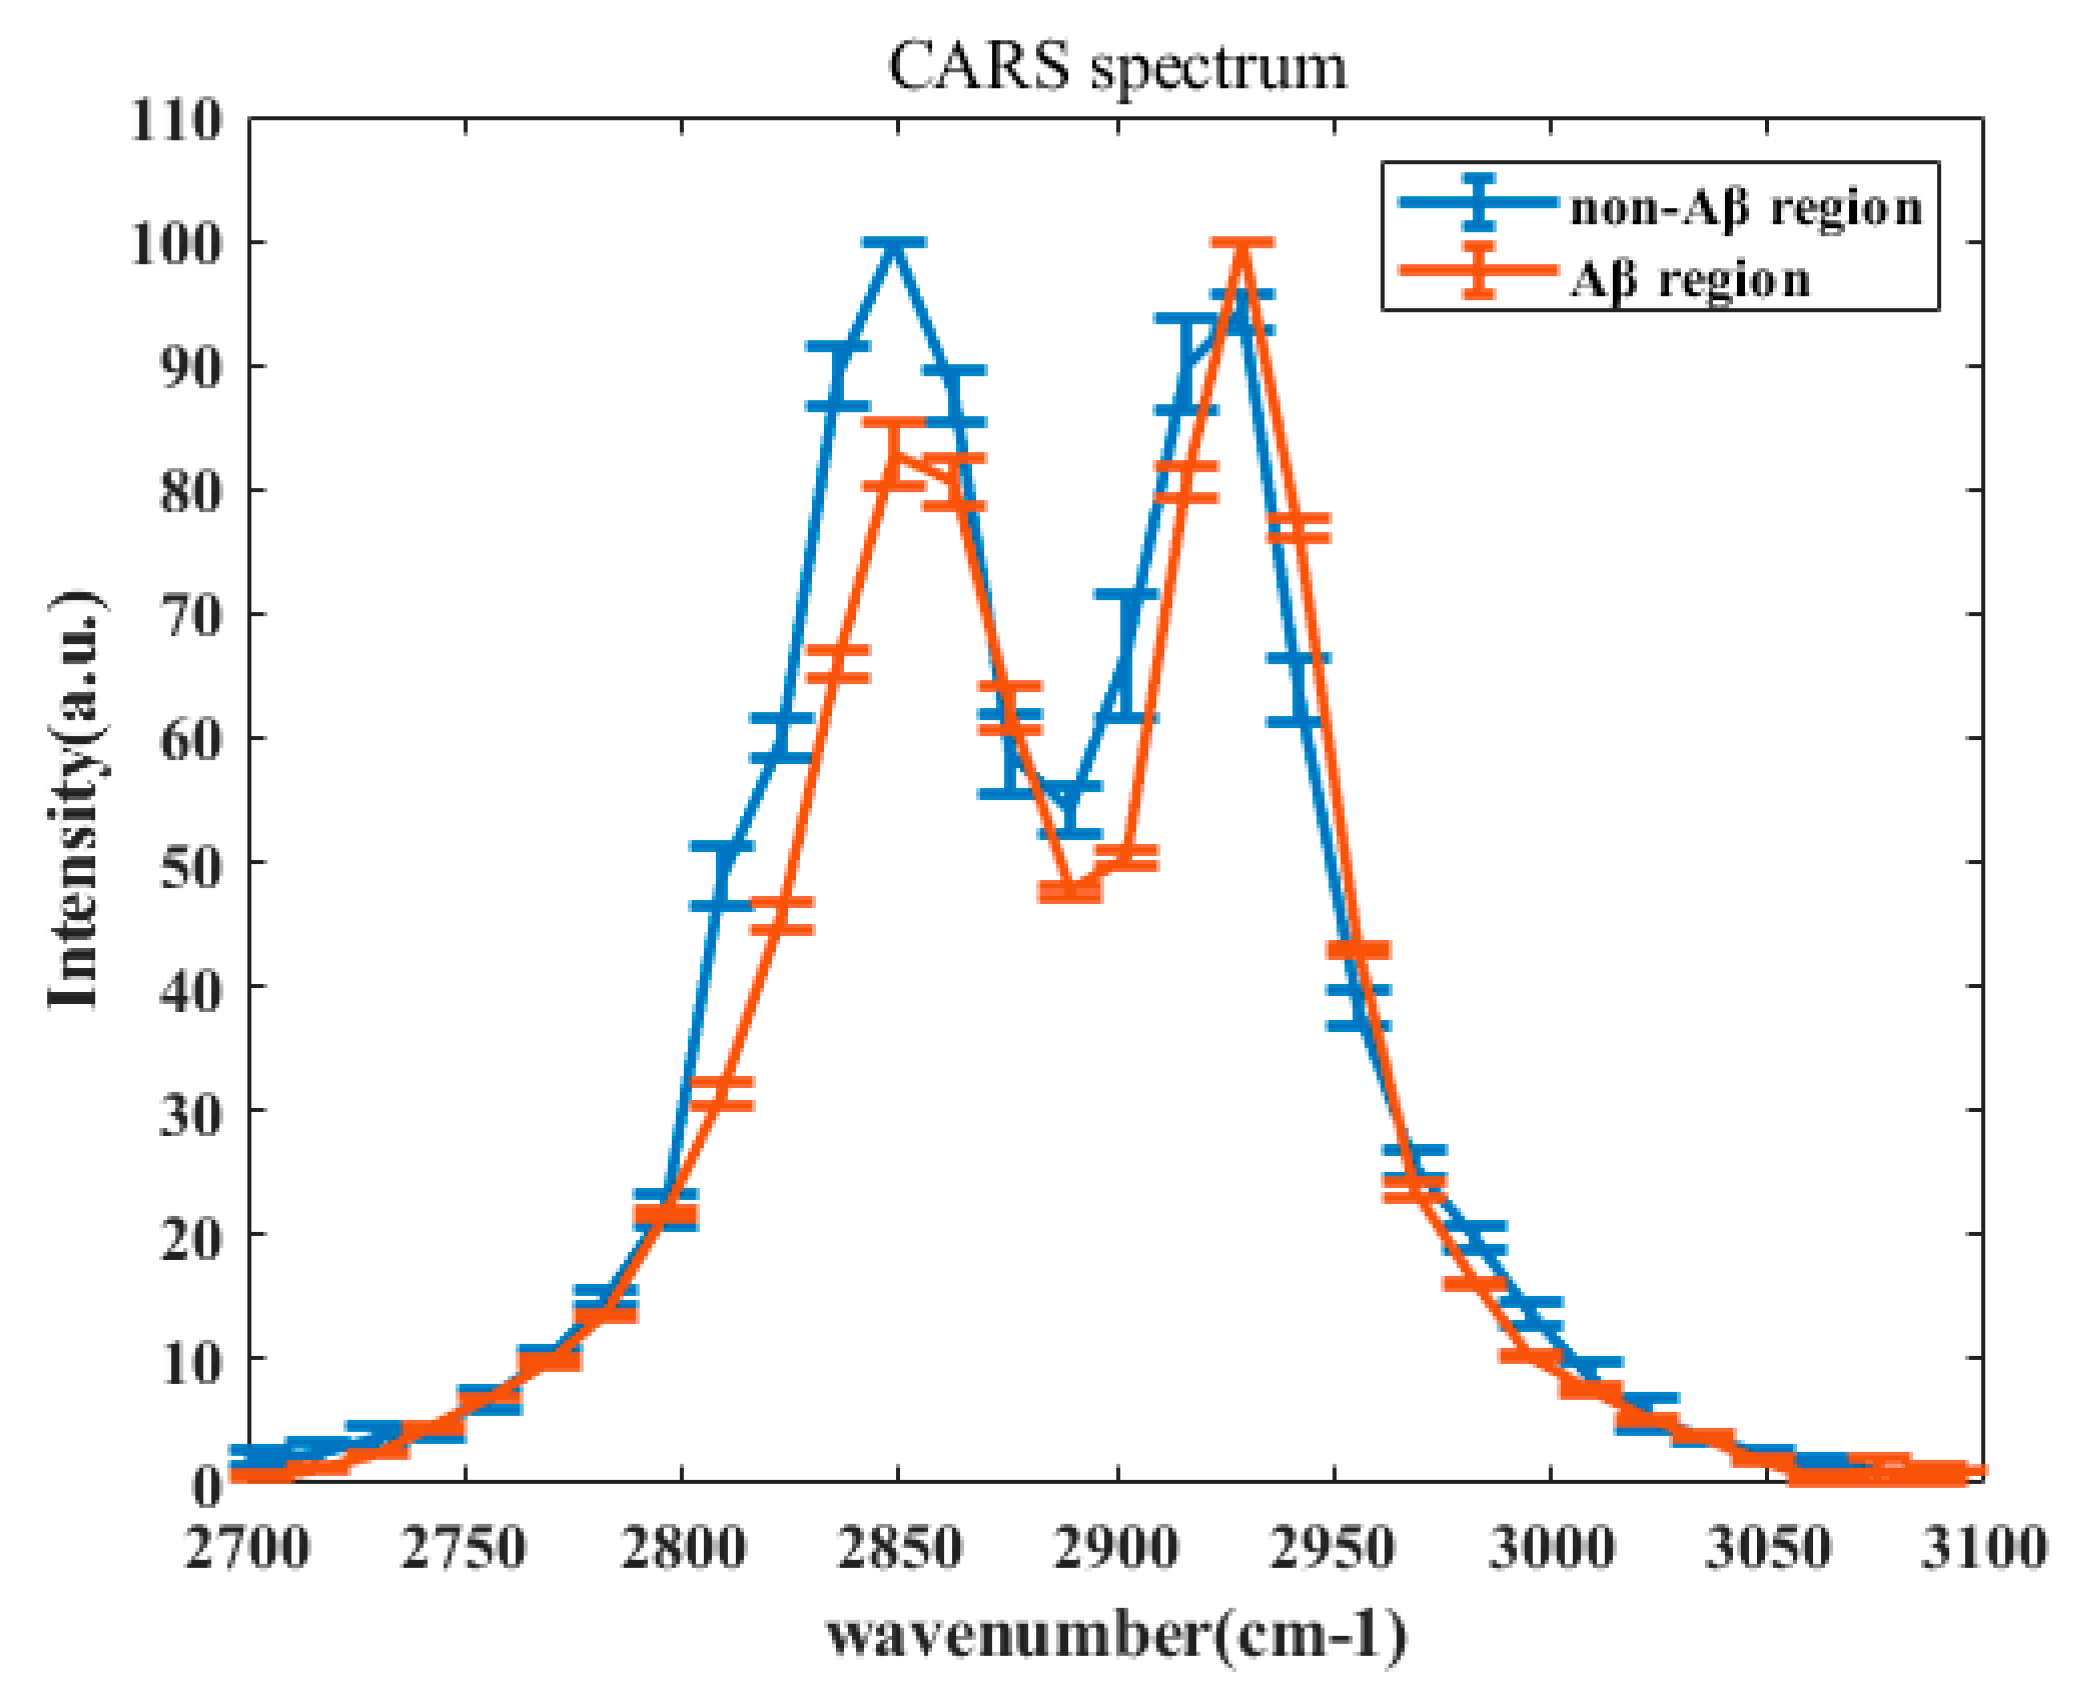
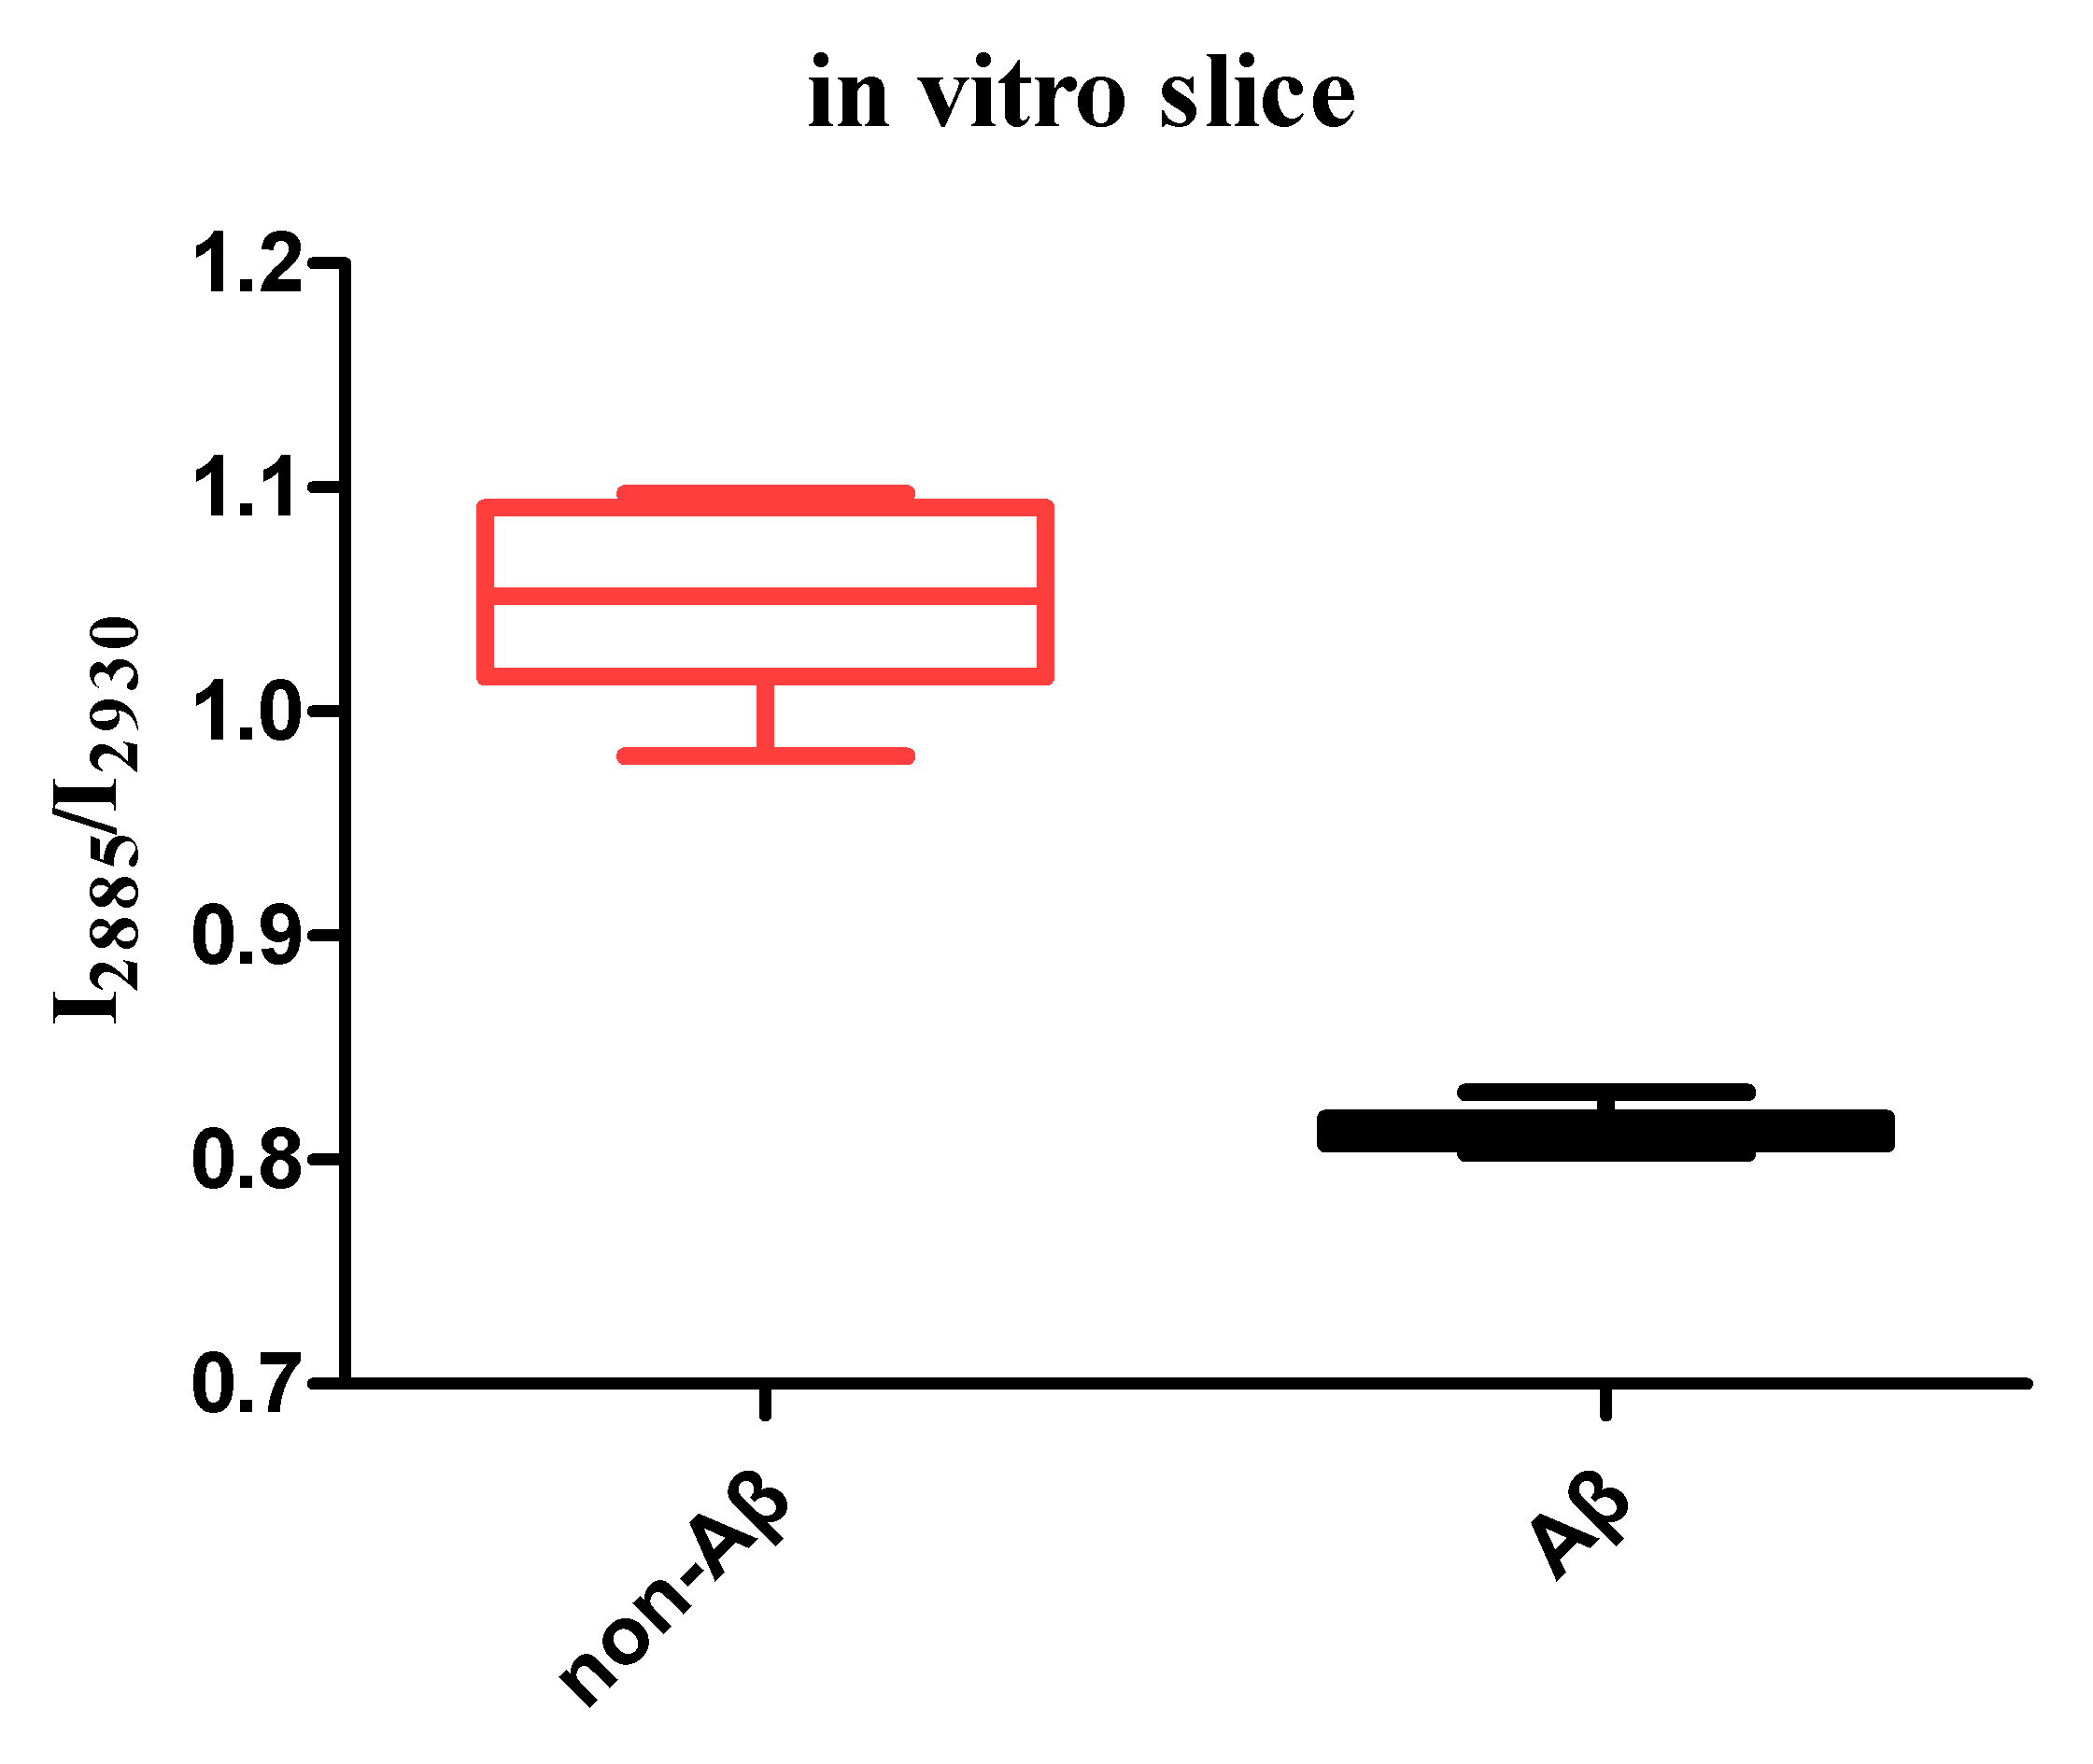
Next, we acquired and analyzed the CARS spectra of the mouse brain tissue in the non-Aβ and Aβ regions. To quantitatively analyze the differences in the spectra of the Aβ region (red line) and non-Aβ region (blue line), we normalized all data. The statistical results obtained after normalization are shown in Figure 3. The two areas exhibited peaks at 2850 and 2930 cm−1, respectively, corresponding to the vibrational mode of the methylene CH2 and methyl CH3 groups. Interestingly, we found that the intensity ratios between the peak at 2850 cm−1 and the one at 2930 cm−1 in the non-Aβ and Aβ region were quite different, as shown in Figure 4. In the non-Aβ region, the peak intensity at 2850 cm−1 was always as high as that at 2930 cm−1. However, in the Aβ region, the peak intensity at 2850 cm−1 was about four-fifths as strong as that at 2930 cm−1, indicating that the symmetric stretching vibrations of CH2 in the Aβ-enrichment region were suppressed. This observation suggests that the ratio of lipids to proteins in the Aβ-rich region is lower than that in the non-Aβ-rich region. According to the results of previous research, abnormal lipid metabolism affects the metabolism and deposition of Aβ, which leads to a series of negative effects and ultimately affects the pathogenesis of AD [9,10,24,25,26,27,28,29,30,31,32].
Previous studies have reported the relevance of lipids and Aβ proteins in AD based on coherent Raman scattering microscopy [33,34,35]. Lee et al. [34] studied AD brain samples using multimodal, multiphoton, nonlinear optical micro-spectroscopy. However, the objective of CARS imaging and spectra is γ-aminobutyric acid (GABA), which is a neurotransmitter that has been reported in many research papers, rather than the Aβ protein itself. Ji et al. [33] reported that the Raman shift between normal proteins and the Aβ protein is about 10 cm−1; based on this blue shift, his team used stimulated Raman scattering microscopy to image the amyloid plaques in the brain tissue of an AD mouse model. This method requires a coherent Raman scattering microscope with a very high spectral resolution. Moreover, his team mainly studied the spectrum of the amide I band, which is located in the fingerprint region.
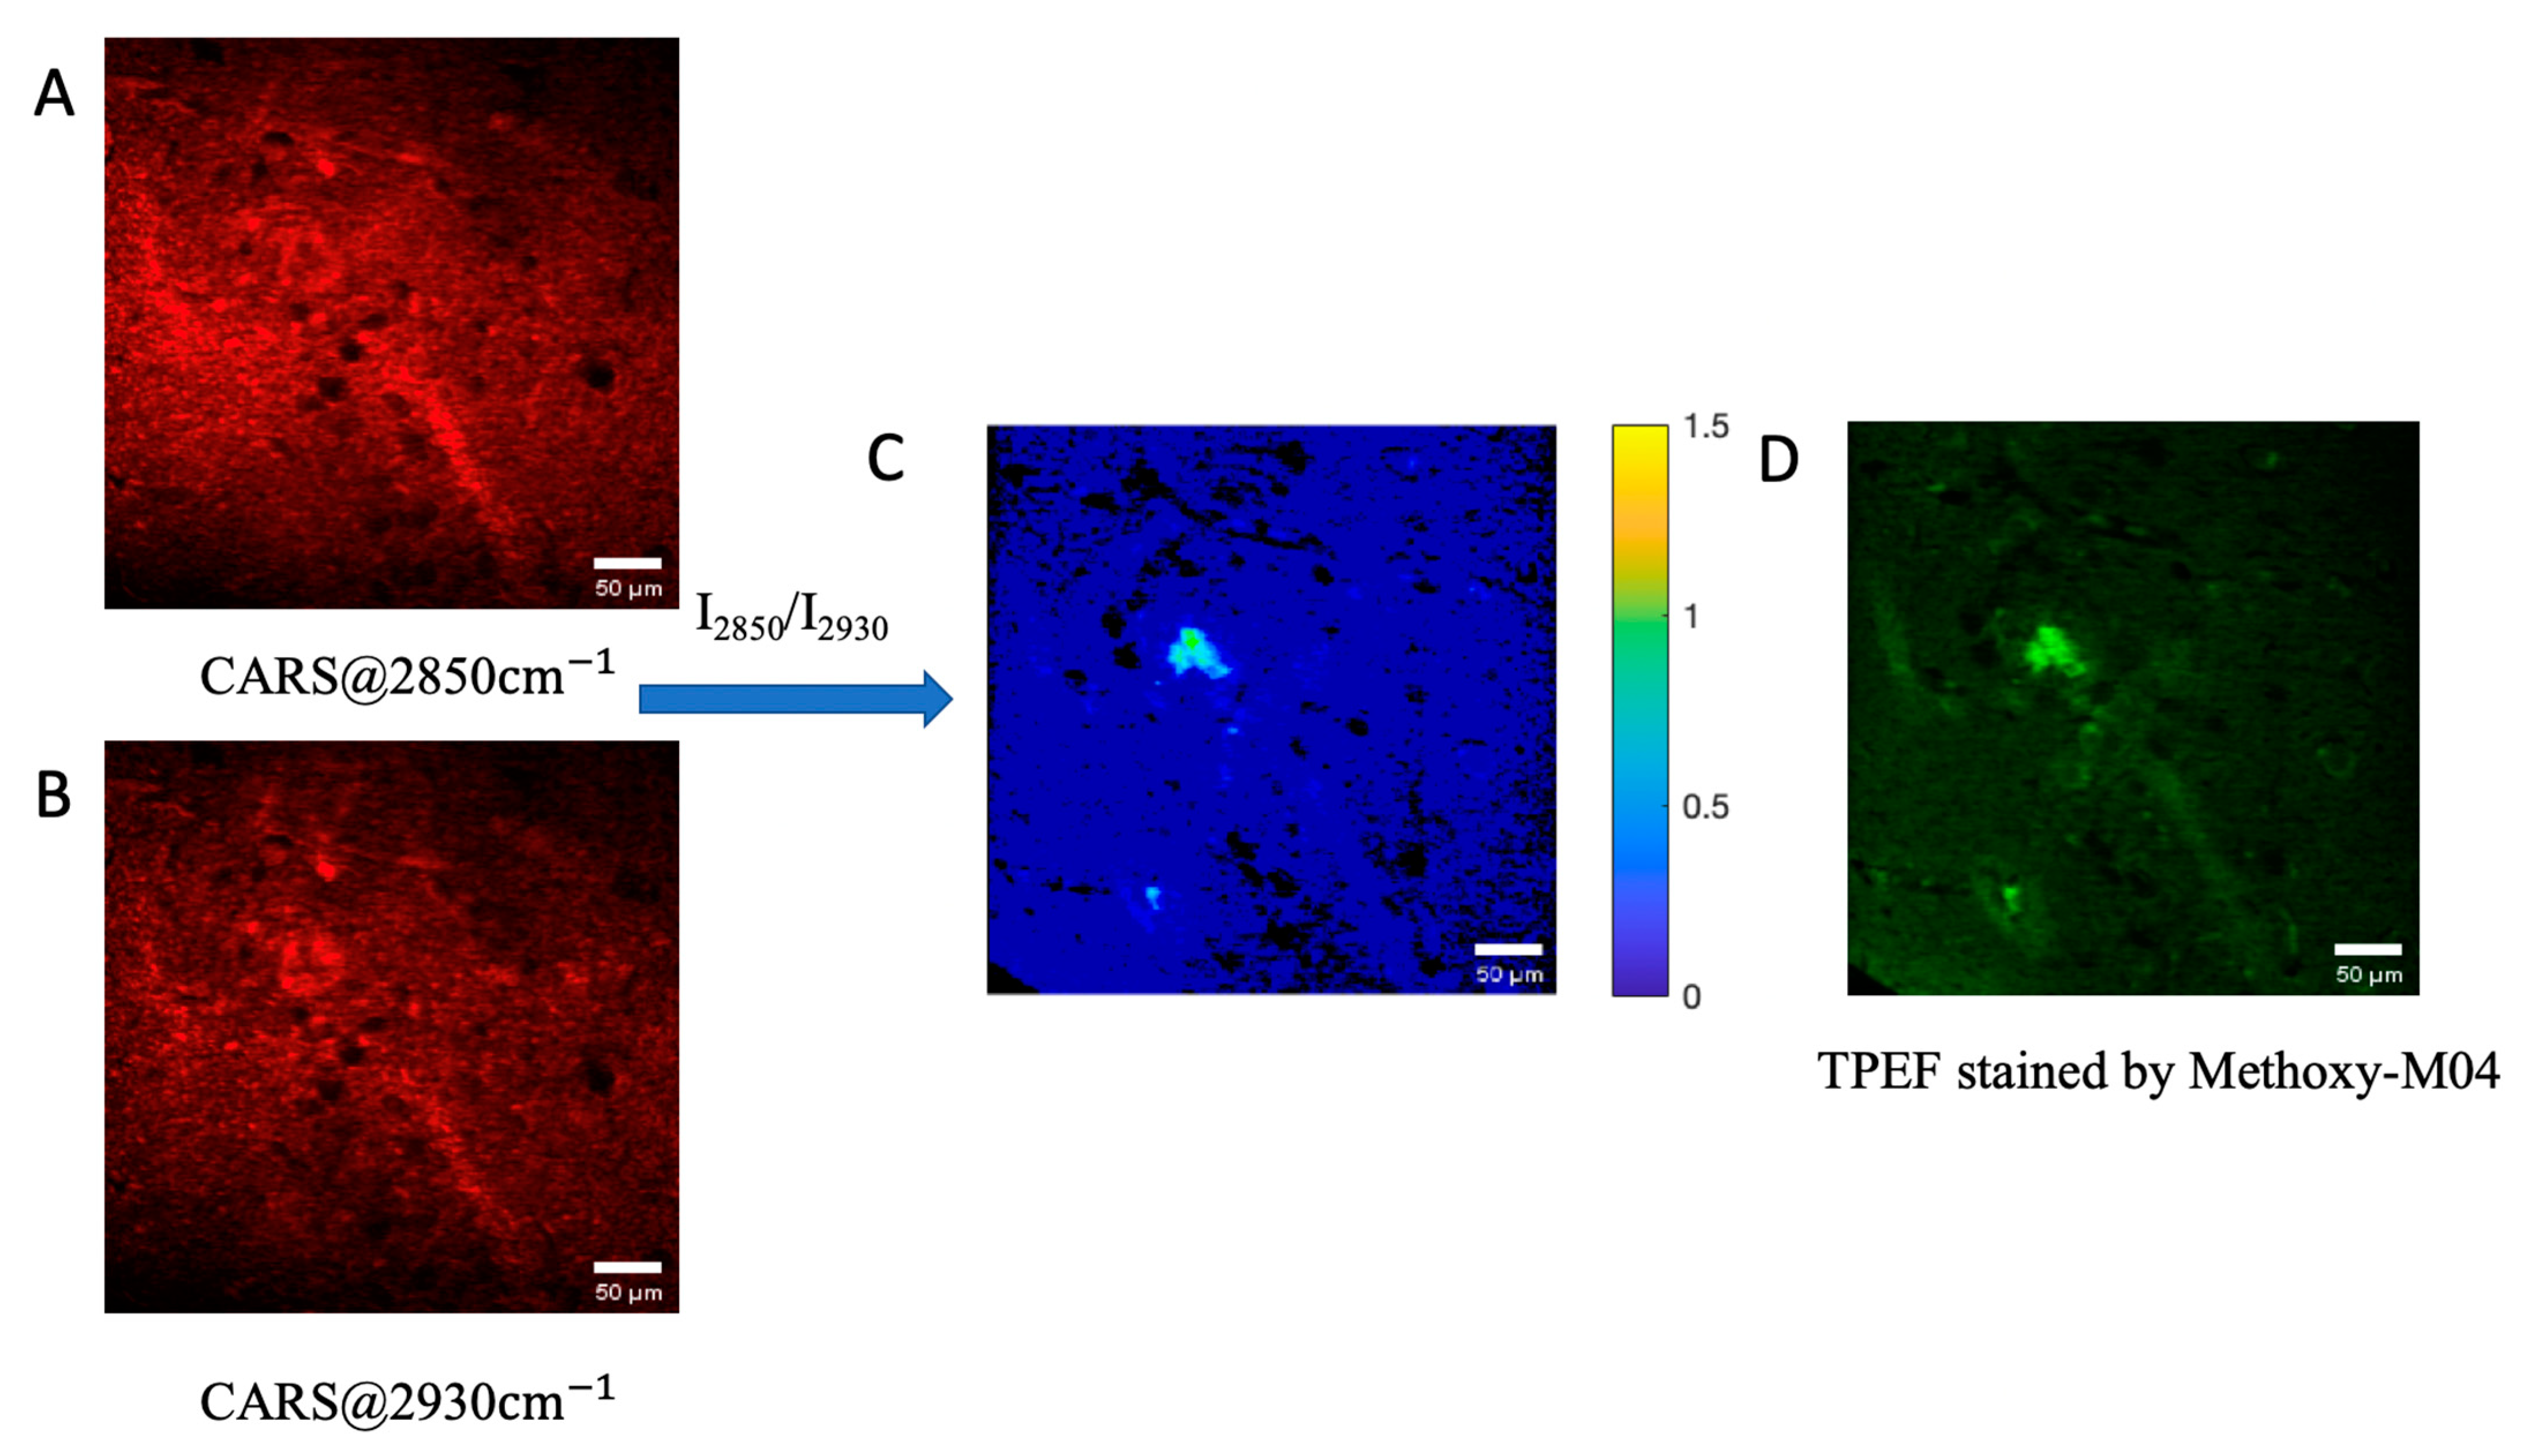
Finally, to verify the feasibility of this method, another set of data was analyzed. According to previous results, a home-built MATLAB procedure was used to calculate and process the hyperspectral CARS data; the results of this analysis are shown in Figure 5. The intensity of each pixel in the CARS image at 2850 cm−1 was divided by the corresponding CARS image at 2930 cm−1, and the result was shown using pseudo color (middle panel of Figure 5). As compared with the TPEF image of the brain slice stained with methoxy-X04, it is apparent that this method can be used to distinguish the non-Aβ region from the Aβ region in the AD brain tissue without labeling.

4. Conclusions

In this study, we developed an optical spectroscopy and imaging approach based on CARS imaging of the Aβ protein to distinguish the non-Aβ region from the Aβ region in the brain tissue of an AD mouse model.
Hyperspectral CARS images were obtained from spectral-focusing-based CARS microscopy. The spectrum of the C–H region contained strong CH2 and CH3 symmetrical and asymmetrical stretching modes, which can be used as a tool to analyze the lipid and protein components of biological tissues. Specifically, the ratio between the CH2 vibration mode at 2850 cm−1 and the CH3 vibration mode at 2930 cm−1 could be used to characterize the lipid or protein components of biological tissues. Moreover, Aβ plaques in the cerebral cortex could be imaged without labeling, and the imaging results are similar to those obtained by labeling with the two-photon dye methoxy-X04. We found that this ratio was about 0.8 in the region that contained the Aβ protein, which was confirmed by TPEF images stained by methoxy-X04. In contrast, the average ratio was about 1.0 in the non-Aβ region. Therefore, this approach is expected to provide a new method for the clinical diagnosis and basic research of AD.
There are two future directions for this research. On the one hand, the Raman spectral characteristics of amyloid in human brain slices should be studied and compared with the spectra in mice. The difficulty of this work lies in the fact that the components of human brain are much more complex than the mouse model, requiring further research. On the other hand, the Raman spectroscopic properties of amyloid in living mice should be investigated, extending the study from in vitro to in vivo. Another interesting future development of this method should be the use of various polynomial fitting methods to analyze the total contribution of CH2, CH3, and non-resonant background in the spectrum of the C–H region. We except that the results would reveal greater details of lipid metabolism, especially cholesterol metabolism, in the AD brain tissue.

Author Contributions

S.L., literature survey, writing, visualization, software; Z.L., R.Z., T.Z., H.X., literature survey, data curation, software; H.X., L.L. and J.Q., conceptualization, supervision, writing, review and editing. All authors have read and agreed to the published version of the manuscript.

Funding

This work has been supported in part by the National Natural Science Foundation of China (61620106016/61835009/61935012/61961136005) and the Shenzhen International Cooperation Project (GJHZ20190822095420249 and GJHZ20180928161811821).

Institutional Review Board Statement

Not applicable.

Informed Consent Statement

Not applicable.

Data Availability Statement

Not applicable.

Conflicts of Interest

The authors declare no conflict of interest.

References

  1. Small, S.A.; Duff, K. Linking Aβ and Tau in Late-Onset Alzheimer’s Disease: A Dual Pathway Hypothesis. Neuron 2008, 60, 534–542. [Google Scholar] [CrossRef] [Green Version]
  2. Hardy, J.; Selkoe, D.J. The Amyloid Hypothesis of Alzheimer’s Disease: Progress and Problems on the Road to Therapeutics. Science 2002, 297, 353–356. [Google Scholar] [CrossRef] [PubMed] [Green Version]
  3. Hardy, J.A.; Higgins, G.A. Alzheimer’s Disease: The Amyloid Cascade Hypothesis. Science 1992, 256, 184–186. [Google Scholar] [CrossRef] [PubMed]
  4. Hardy, J.; Allsop, D. Amyloid Deposition as the Central Event in the Aetiology of Alzheimer’s Disease. Trends Pharmacol. Sci. 1991, 12, 383–388. [Google Scholar] [CrossRef]
  5. Holtzman, D.M.; Morris, J.C.; Goate, A.M. Alzheimer’s Disease: The Challenge of the Second Century. Sci. Transl. Med. 2011, 3, 77sr1. [Google Scholar] [CrossRef] [PubMed] [Green Version]
  6. Nordberg, A. PET Imaging of Amyloid in Alzheimer’s Disease. Lancet Neurol. 2004, 3, 519–527. [Google Scholar] [CrossRef]
  7. Klunk, W.E.; Engler, H.; Nordberg, A.; Wang, Y.; Blomqvist, G.; Holt, D.P.; Långström, B.; Bergström, M.; Savitcheva, I.; Huang, G.F.; et al. Imaging Brain Amyloid in Alzheimer’s Disease with Pittsburgh Compound-B. Ann. Neurol. Off. J. Am. Neurol. Assoc. Child Neurol. Soc. 2004, 55, 306–319. [Google Scholar] [CrossRef]
  8. Nabuurs, R.J.; Natté, R.; de Ronde, F.M.; Hegeman-Kleinn, I.; Dijkstra, J.; van Duinen, S.G.; Webb, A.G.; Rozemuller, A.J.; van Buchem, M.A.; van der Weerd, L. MR Microscopy of Human Amyloid-β Deposits: Characterization of Parenchymal Amyloid, Diffuse Plaques, and Vascular Amyloid. J. Alzheimers Dis. 2013, 34, 1037–1049. [Google Scholar] [CrossRef] [PubMed] [Green Version]
  9. Liu, Q.; Zhang, J. Lipid metabolism in Alzheimer’s disease. Neurosci. Bull. 2014, 30, 331–345. [Google Scholar] [CrossRef] [Green Version]
  10. Hirsch-Reinshagen, V.; Burgess, B.L.; Wellington, C.L. Why lipids are important for Alzheimer disease? Mol. Cell Biochem. 2009, 326, 121–129. [Google Scholar] [CrossRef]
  11. Li, S.; Li, Y.; Yi, R.; Liu, L.; Qu, J. Coherent Anti-Stokes Raman Scattering Microscopy and Its Applications. Front. Phys. 2020, 8, 515. [Google Scholar] [CrossRef]
  12. Patel, I.I.; Steuwe, C.; Reichelt, S.; Mahajan, S. Coherent anti-Stokes Raman scattering for label-free biomedical imaging. J. Opt. 2013, 15, 094006. [Google Scholar] [CrossRef] [Green Version]
  13. Evans, C.L.; Xu, X.; Kesari, S.; Xie, X.S.; Wong, S.T.; Young, G.S. Chemically-selective imaging of brain structures with CARS microscopy. Opt. Express 2007, 15, 12076–12087. [Google Scholar] [CrossRef] [Green Version]
  14. Cheng, J.-X.; Xie, X.S. Coherent Anti-Stokes Raman Scattering Microscopy: Instrumentation, Theory, and Applications. J. Phys. Chem. B 2004, 108, 827–840. [Google Scholar] [CrossRef]
  15. Cheng, J.X.; Jia, Y.K.; Zheng, G.; Xie, X.S. Laser-scanning coherent anti-Stokes Raman scattering microscopy and applications to cell biology. Biophys. J. 2002, 83, 502–509. [Google Scholar] [CrossRef] [Green Version]
  16. Volkmer, A.; Cheng, J.-X.; Sunney Xie, X. Vibrational Imaging with High Sensitivity via Epidetected Coherent Anti-Stokes Raman Scattering Microscopy. Phys. Rev. Lett. 2001, 87, 023901. [Google Scholar] [CrossRef] [Green Version]
  17. Zumbusch, A.; Holtom, G.R.; Xie, X.S. Three-Dimensional Vibrational Imaging by Coherent Anti-Stokes Raman Scattering. Phys. Rev. Lett. 1999, 82, 4142–4145. [Google Scholar] [CrossRef] [Green Version]
  18. Chen, C.; Liang, Z.; Zhou, B.; Li, X.; Lui, C.; Ip, N.Y.; Qu, J.Y. In Vivo Near-Infrared Two-Photon Imaging of Amyloid Plaques in Deep Brain of Alzheimer’s Disease Mouse Model. ACS Chem. Neurosci. 2018, 9, 3128–3136. [Google Scholar] [CrossRef]
  19. Wang, S.; Lin, B.; Lin, G.; Sun, C.; Lin, R.; Huang, J.; Tao, J.; Wang, X.; Wu, Y.; Chen, L.; et al. Label-free multiphoton imaging of beta-amyloid plaques in Alzheimer’s disease mouse models. Neurophotonics 2019, 6, 045008. [Google Scholar] [CrossRef]
  20. Johansson, P.K.; Koelsch, P. Label-free imaging of amyloids using their intrinsic linear and nonlinear optical properties. Biomed. Opt. Express 2017, 8, 743–756. [Google Scholar] [CrossRef] [Green Version]
  21. Koronyo-Hamaoui, M.; Koronyo, Y.; Ljubimov, A.V.; Miller, C.A.; Ko, M.K.; Black, K.L.; Schwartz, M.; Farkas, D.L. Identification of amyloid plaques in retinas from Alzheimer’s patients and noninvasive in vivo optical imaging of retinal plaques in a mouse model. Neuroimage 2011, 54, S204–S217. [Google Scholar] [CrossRef] [Green Version]
  22. Bailey, K.A.; Klymenko, Y.; Feist, P.E.; Hummon, A.B.; Stack, M.S.; Schultz, Z.D. Chemical Analysis of Morphological Changes in Lysophosphatidic Acid-Treated Ovarian Cancer Cells. Sci. Rep. 2017, 7, 15295. [Google Scholar] [CrossRef] [Green Version]
  23. Meyer, T.; Chemnitz, M.; Baumgartl, M.; Gottschall, T.; Pascher, T.; Matthäus, C.; Romeike, B.F.; Brehm, B.R.; Limpert, J.; Tünnermann, A.; et al. Expanding Multimodal Microscopy by High Spectral Resolution Coherent Anti-Stokes Raman Scattering Imaging for Clinical Disease Diagnostics. Anal. Chem. 2013, 85, 6703–6715. [Google Scholar] [CrossRef]
  24. Hosseini, M.; Poljak, A.; Braidy, N.; Crawford, J.; Sachdev, P. Blood fatty acids in Alzheimer’s disease and mild cognitive impairment: A meta-analysis and systematic review. Ageing Res. Rev. 2020, 60, 101043. [Google Scholar] [CrossRef] [PubMed]
  25. Fonteh, A.N.; Cipolla, M.; Chiang, A.J.; Edminster, S.P.; Arakaki, X.; Harrington, M.G. Polyunsaturated fatty acid composition of cerebrospinal fluid fractions shows their contribution to cognitive resilience of a pre-symptomatic Alzheimer’s disease cohort. Front. Physiol. 2020, 11, 83. [Google Scholar] [CrossRef]
  26. Chew, H.; Solomon, V.A.; Fonteh, A.N. Involvement of Lipids in Alzheimer’s Disease Pathology and Potential Therapies. Front. Physiol. 2020, 11, 598. [Google Scholar] [CrossRef] [PubMed]
  27. Safieh, M.; Korczyn, A.D.; Michaelson, D.M. ApoE4: An emerging therapeutic target for Alzheimer’s disease. BMC Med. 2019, 17, 64. [Google Scholar] [CrossRef] [Green Version]
  28. Fonteh, A.N.; Cipolla, M.; Chiang, J.; Arakaki, X.; Harrington, M.G. Human cerebrospinal fluid fatty acid levels differ between supernatant fluid and brain-derived nanoparticle fractions, and are altered in Alzheimer’s disease. PLoS ONE 2014, 9, e100519. [Google Scholar] [CrossRef] [PubMed] [Green Version]
  29. Saido, T.C. Metabolism of amyloid β peptide and pathogenesis of Alzheimer’s disease. Proc. Jpn. Acad. Ser. B Phys. Biol. Sci. 2013, 89, 321–339. [Google Scholar] [CrossRef] [Green Version]
  30. Bakkour, A.; Morris, J.C.; Wolk, D.A.; Dickerson, B.C. The effects of aging and Alzheimer’s disease on cerebral cortical anatomy: Specificity and differential relationships with cognition. Neuroimage 2013, 76, 332–344. [Google Scholar] [CrossRef] [Green Version]
  31. Zinser, E.G.; Hartmann, T.; Grimm, M.O.W. Amyloid beta-protein and lipid metabolism. Biochim. et Biophys. Acta (BBA)-Biomembr. 2007, 1768, 1991–2001. [Google Scholar] [CrossRef] [PubMed] [Green Version]
  32. Wolozin, B. Cholesterol and the Biology of Alzheimer’s Disease. Neuron 2004, 41, 7–10. [Google Scholar] [CrossRef] [Green Version]
  33. Ji, M.B.; Arbel, M.; Zhang, L.; Freudiger, C.W.; Hou, S.S.; Lin, D.; Yang, X.; Bacskai, B.J.; Xie, X.S. Label-free imaging of amyloid plaques in Alzheimer’s disease with stimulated Raman scattering microscopy. Sci. Adv. 2018, 4, eaat7715. [Google Scholar] [CrossRef] [Green Version]
  34. Lee, J.H.; Kim, D.H.; Song, W.K.; Oh, M.K.; Ko, D.K. Label-free imaging and quantitative chemical analysis of Alzheimer’s disease brain samples with multimodal multiphoton nonlinear optical microspectroscopy. J. Biomed. Opt. 2015, 20, 56013. [Google Scholar] [CrossRef] [Green Version]
  35. Enejder, A.; Kiskis, J.; Fink, H.; Nyberg, L.; Thyr, J.; Li, J.Y. CARS microscopy of Alzheimer’s diseased brain tissue, in Multiphoton Microscopy in the Biomedical Sciences XIV. Int. Soc. Opt. Photonics 2014, 8948, 89480U. [Google Scholar]
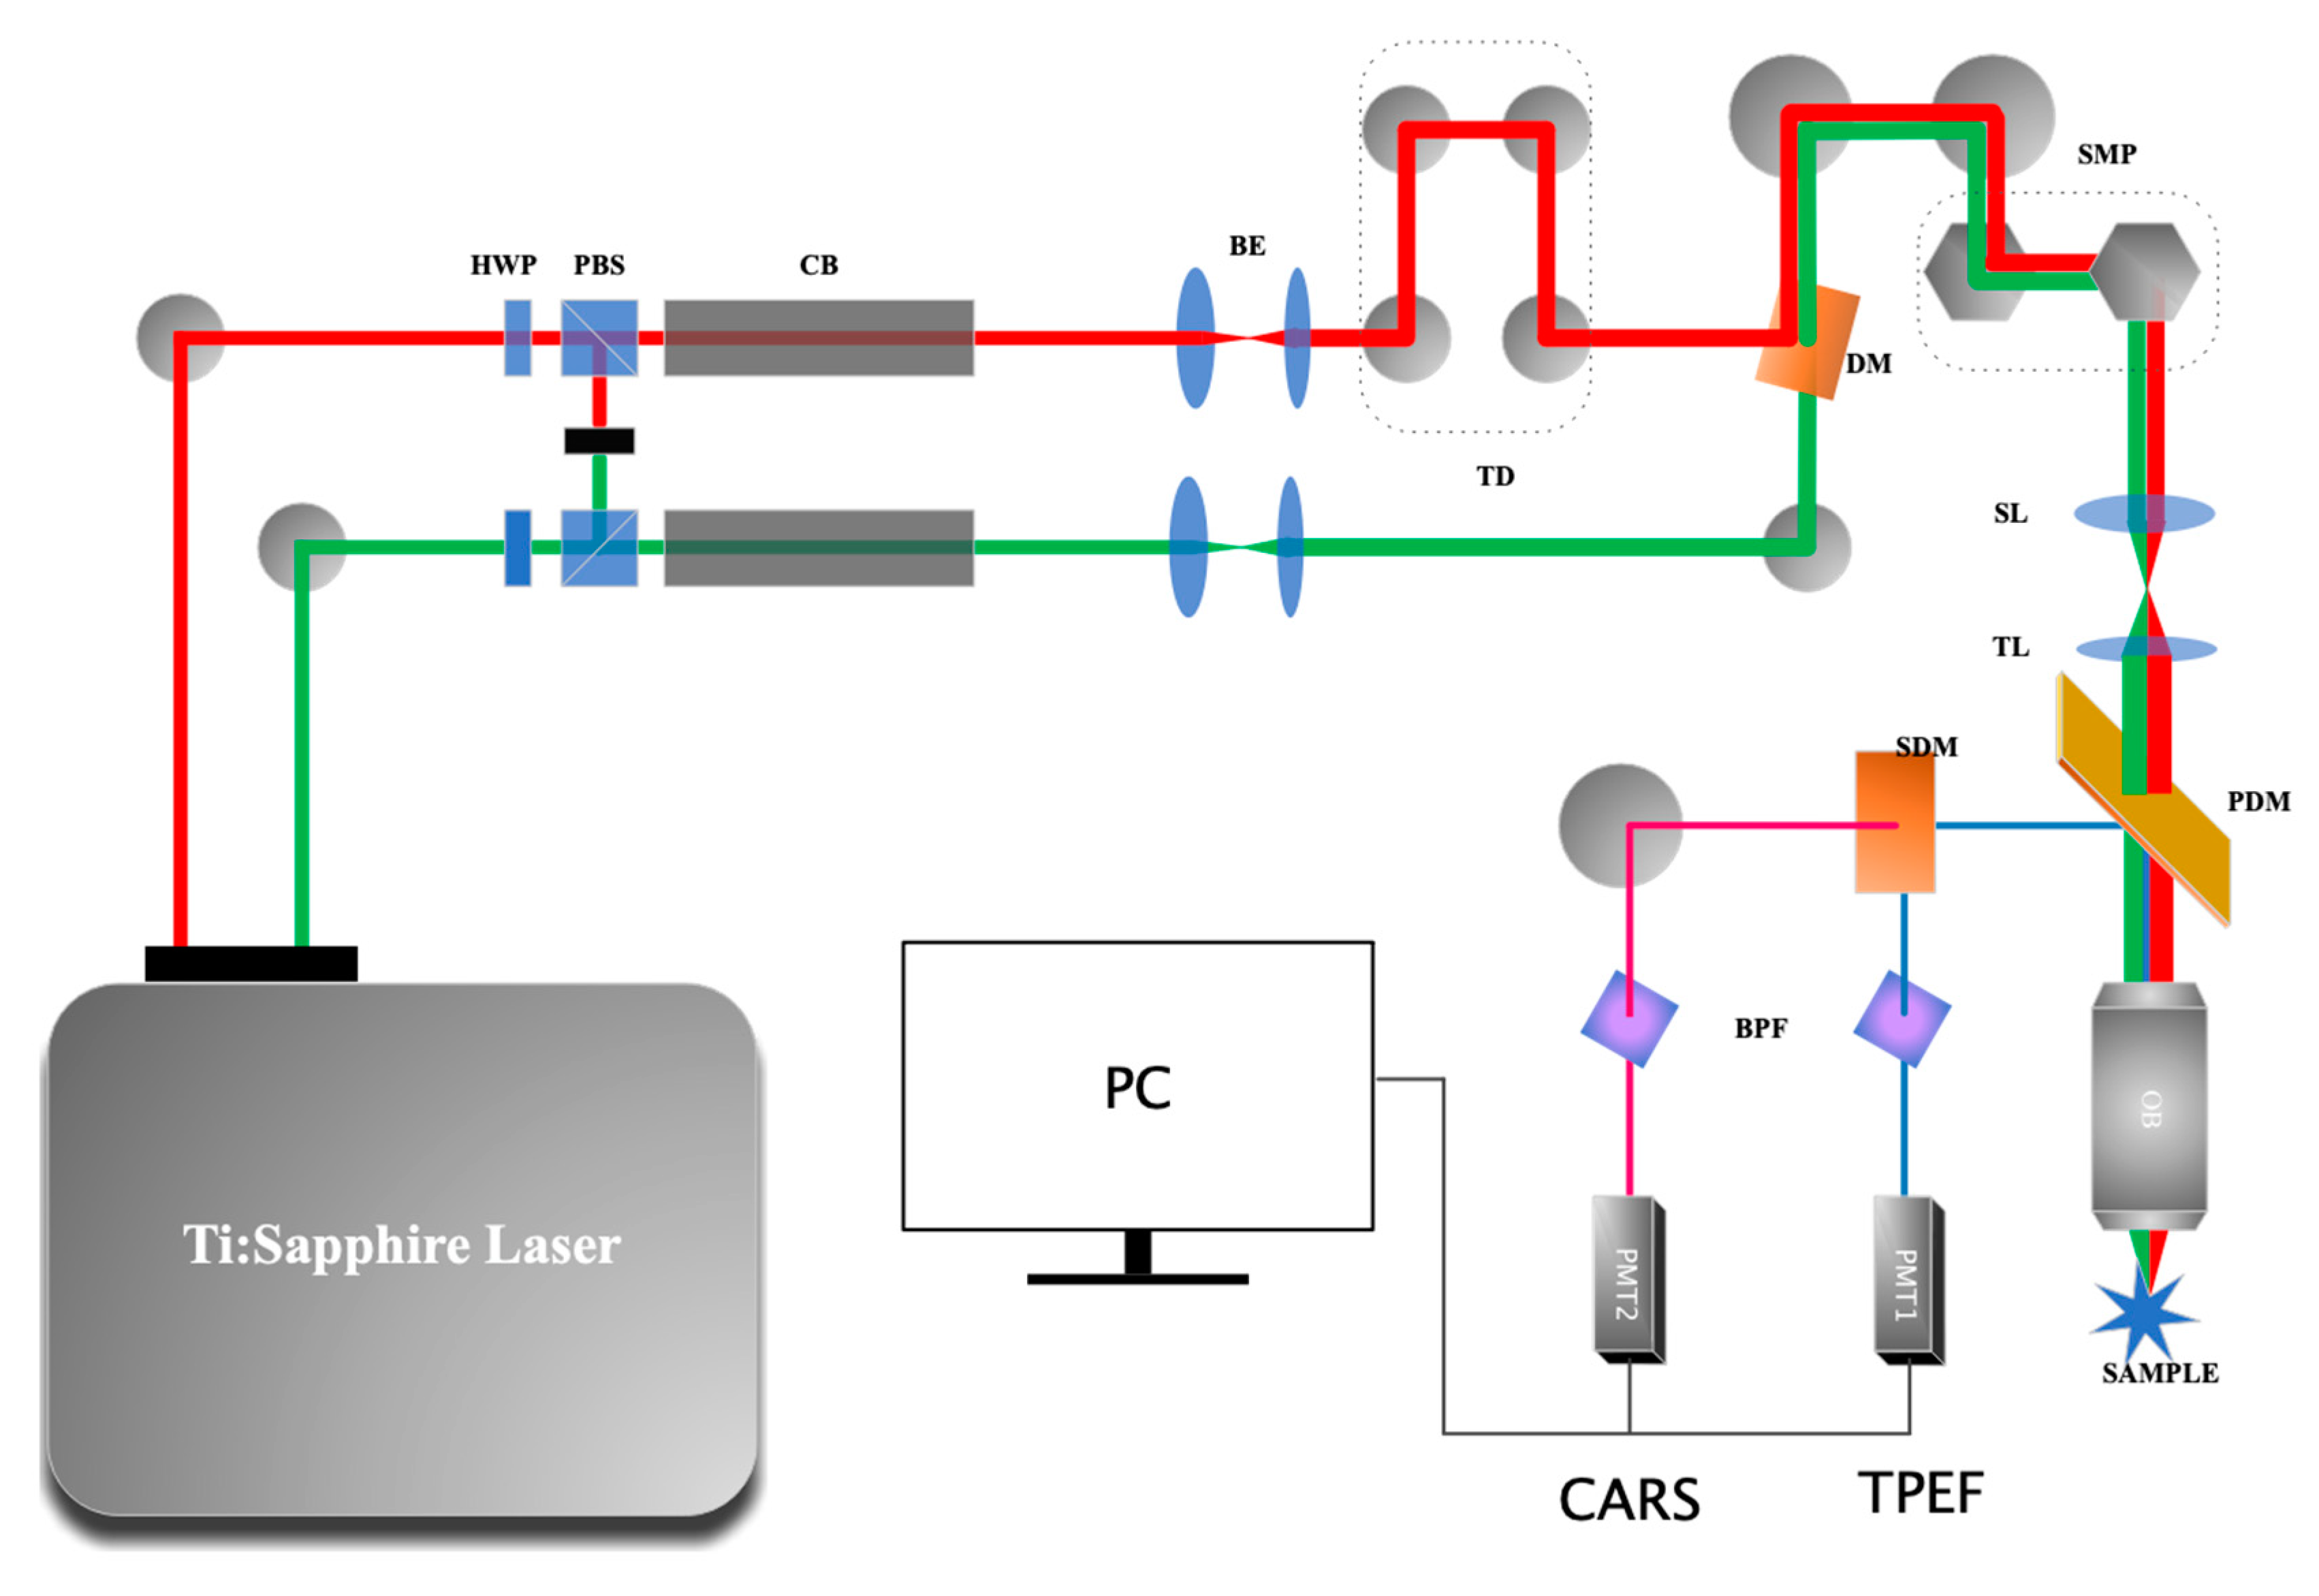
Figure 1. Schematic diagram of the CARS system. Ti: Sapphire Laser, titanium-doped sapphire solid-state laser with two outputs; HWP, half-wave plate; PBS, polarization beam splitter; CB, chirped block; BE, beam expander; TD, time delay; DM, dichroic mirror; SMP, scanning mirror pairs; SL, scan lens; TL, tube lens; PDM, primary dichroic mirror; OB, objective lens; SDM, secondary dichroic mirror; BPF, band-pass filter; PMT, photomultiplier.
Biosensors 11 00365 g001
Figure 2. CARS and TPEF images of brain tissue from a mouse model of AD: (Left) CARS image acquired at 2850 cm−1; (middle) TPEF image excited at 800 nm; (right) merged image. The red and green boxes represent the non-Aβ and Aβ regions, as indicated by the TPEF image shown in the middle panel. Scale bar, 50 μm.
Biosensors 11 00365 g002
Figure 3. Comparison of typical normalized CARS spectra of the non-Aβ region (blue line) and Aβ region (red line) in the C–H stretching vibration region. Both spectra exhibited two peaks at 2850 and 2930 cm−1. The standard errors are indicated by the horizontal solid lines.
Biosensors 11 00365 g003
Figure 4. Standard deviation of I2850/I2930 in the non-Aβ and Aβ regions. Each region contained 20 sets of data. Each set of data was collected from different slices in vitro.
Biosensors 11 00365 g004
Figure 5. Workflow that can be used to verify the feasibility of distinguishing non-Aβ region from Aβ region in the AD brain tissue without labeling. Individual CARS images are shown: (A) 2850 cm−1; (B) 2930 cm−1; (C) the result of the image in A divided by the image in B, pseudo color in (C) stands for the peak ratio of each pixel. We can find an unusual area in the middle which could be regarded as the Aβ region; (D) the TPEF image stained by Methoxy-X04, which is used to locate the Aβ plaques and the Aβ region.
Biosensors 11 00365 g005
Publisher’s Note: MDPI stays neutral with regard to jurisdictional claims in published maps and institutional affiliations.