Novel LDPE/Chitosan Rosemary and Melissa Extract Nanostructured Active Packaging Films

 ,
,  ,
, 
 ,
, 
Abstract
:
1. Introduction
2. Materials and Methods
2.1. Materials
2.2. Preparation of Active Films
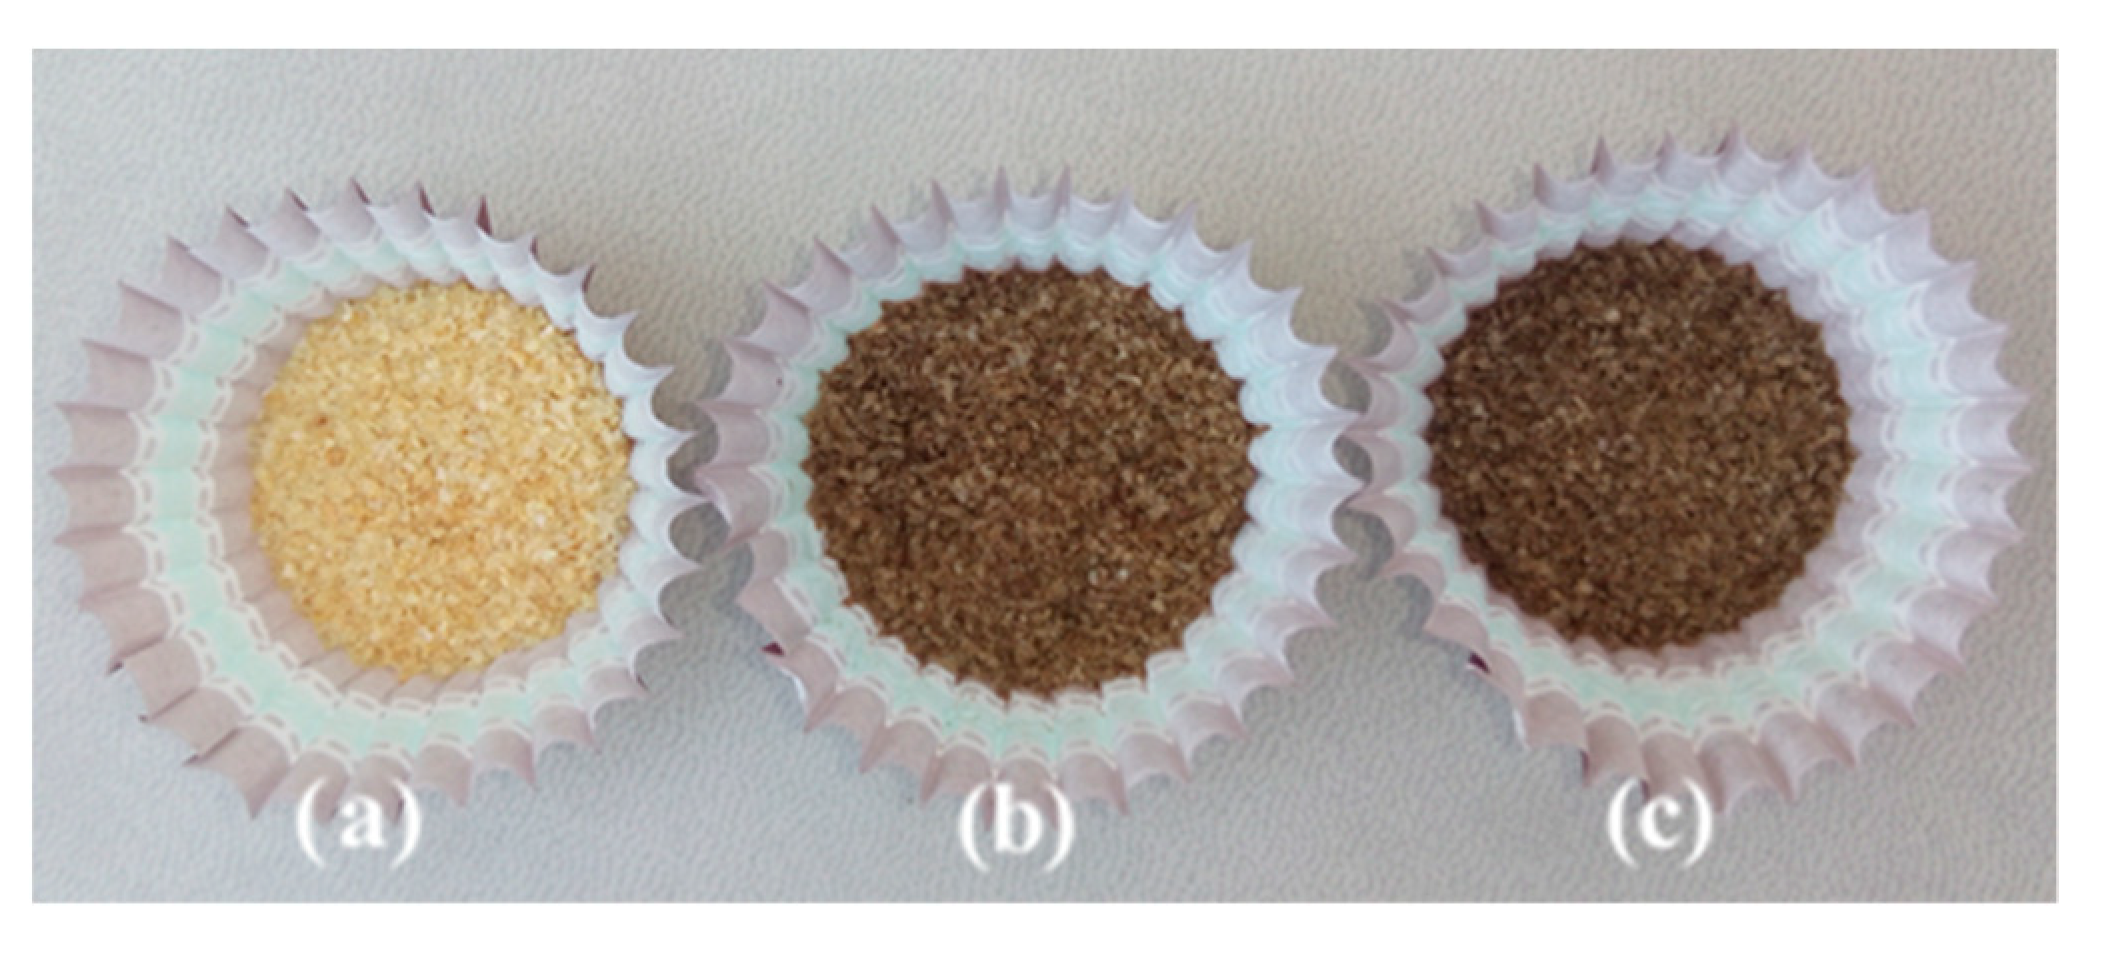
2.2.1. Preparation of CS_RO and CS_MO Hybrids
2.2.2. Preparation of Nanostructured Films
2.3. XRD Analysis
2.4. FTIR Spectrometry
2.5. Thermogravimetric/Differential Thermal Analysis
2.6. Tensile Properties
2.7. Water Sorption
2.8. Water Vapor Permeability (WVP)
2.9. Oxygen Permeability (OP)
2.10. Overall Migration Test
2.11. Antioxidant Activity
3. Results
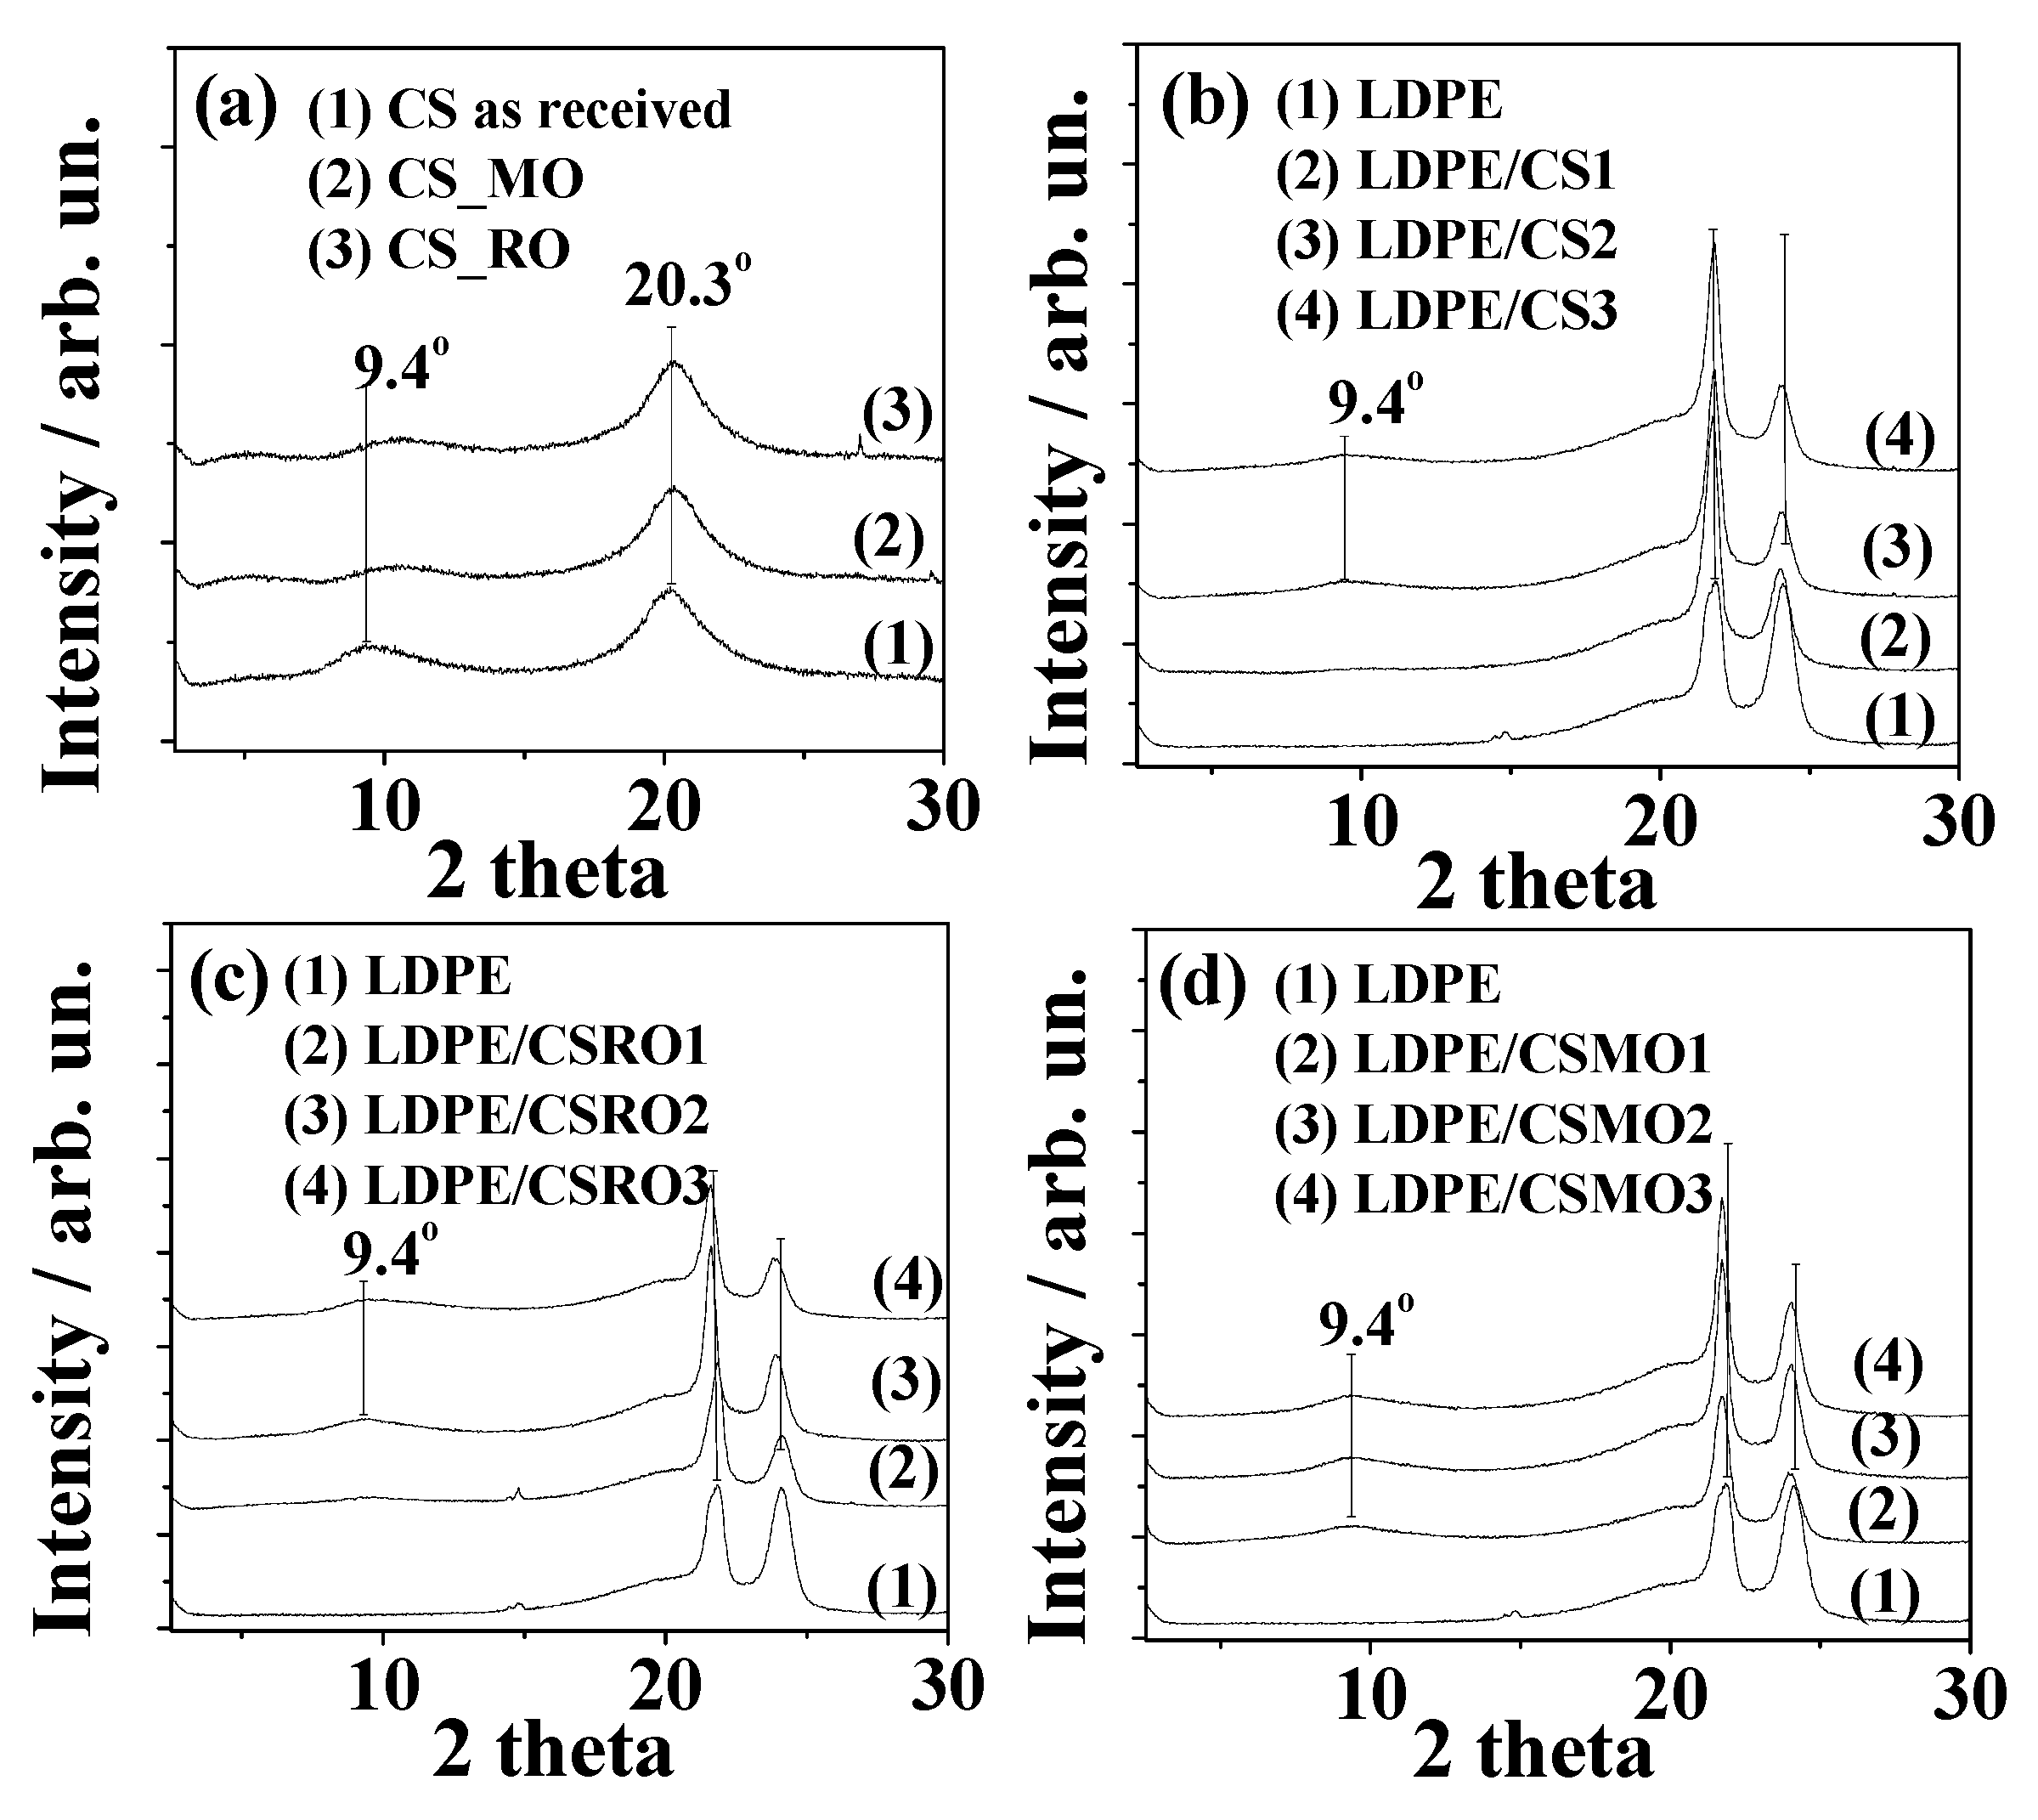
3.1. XRD
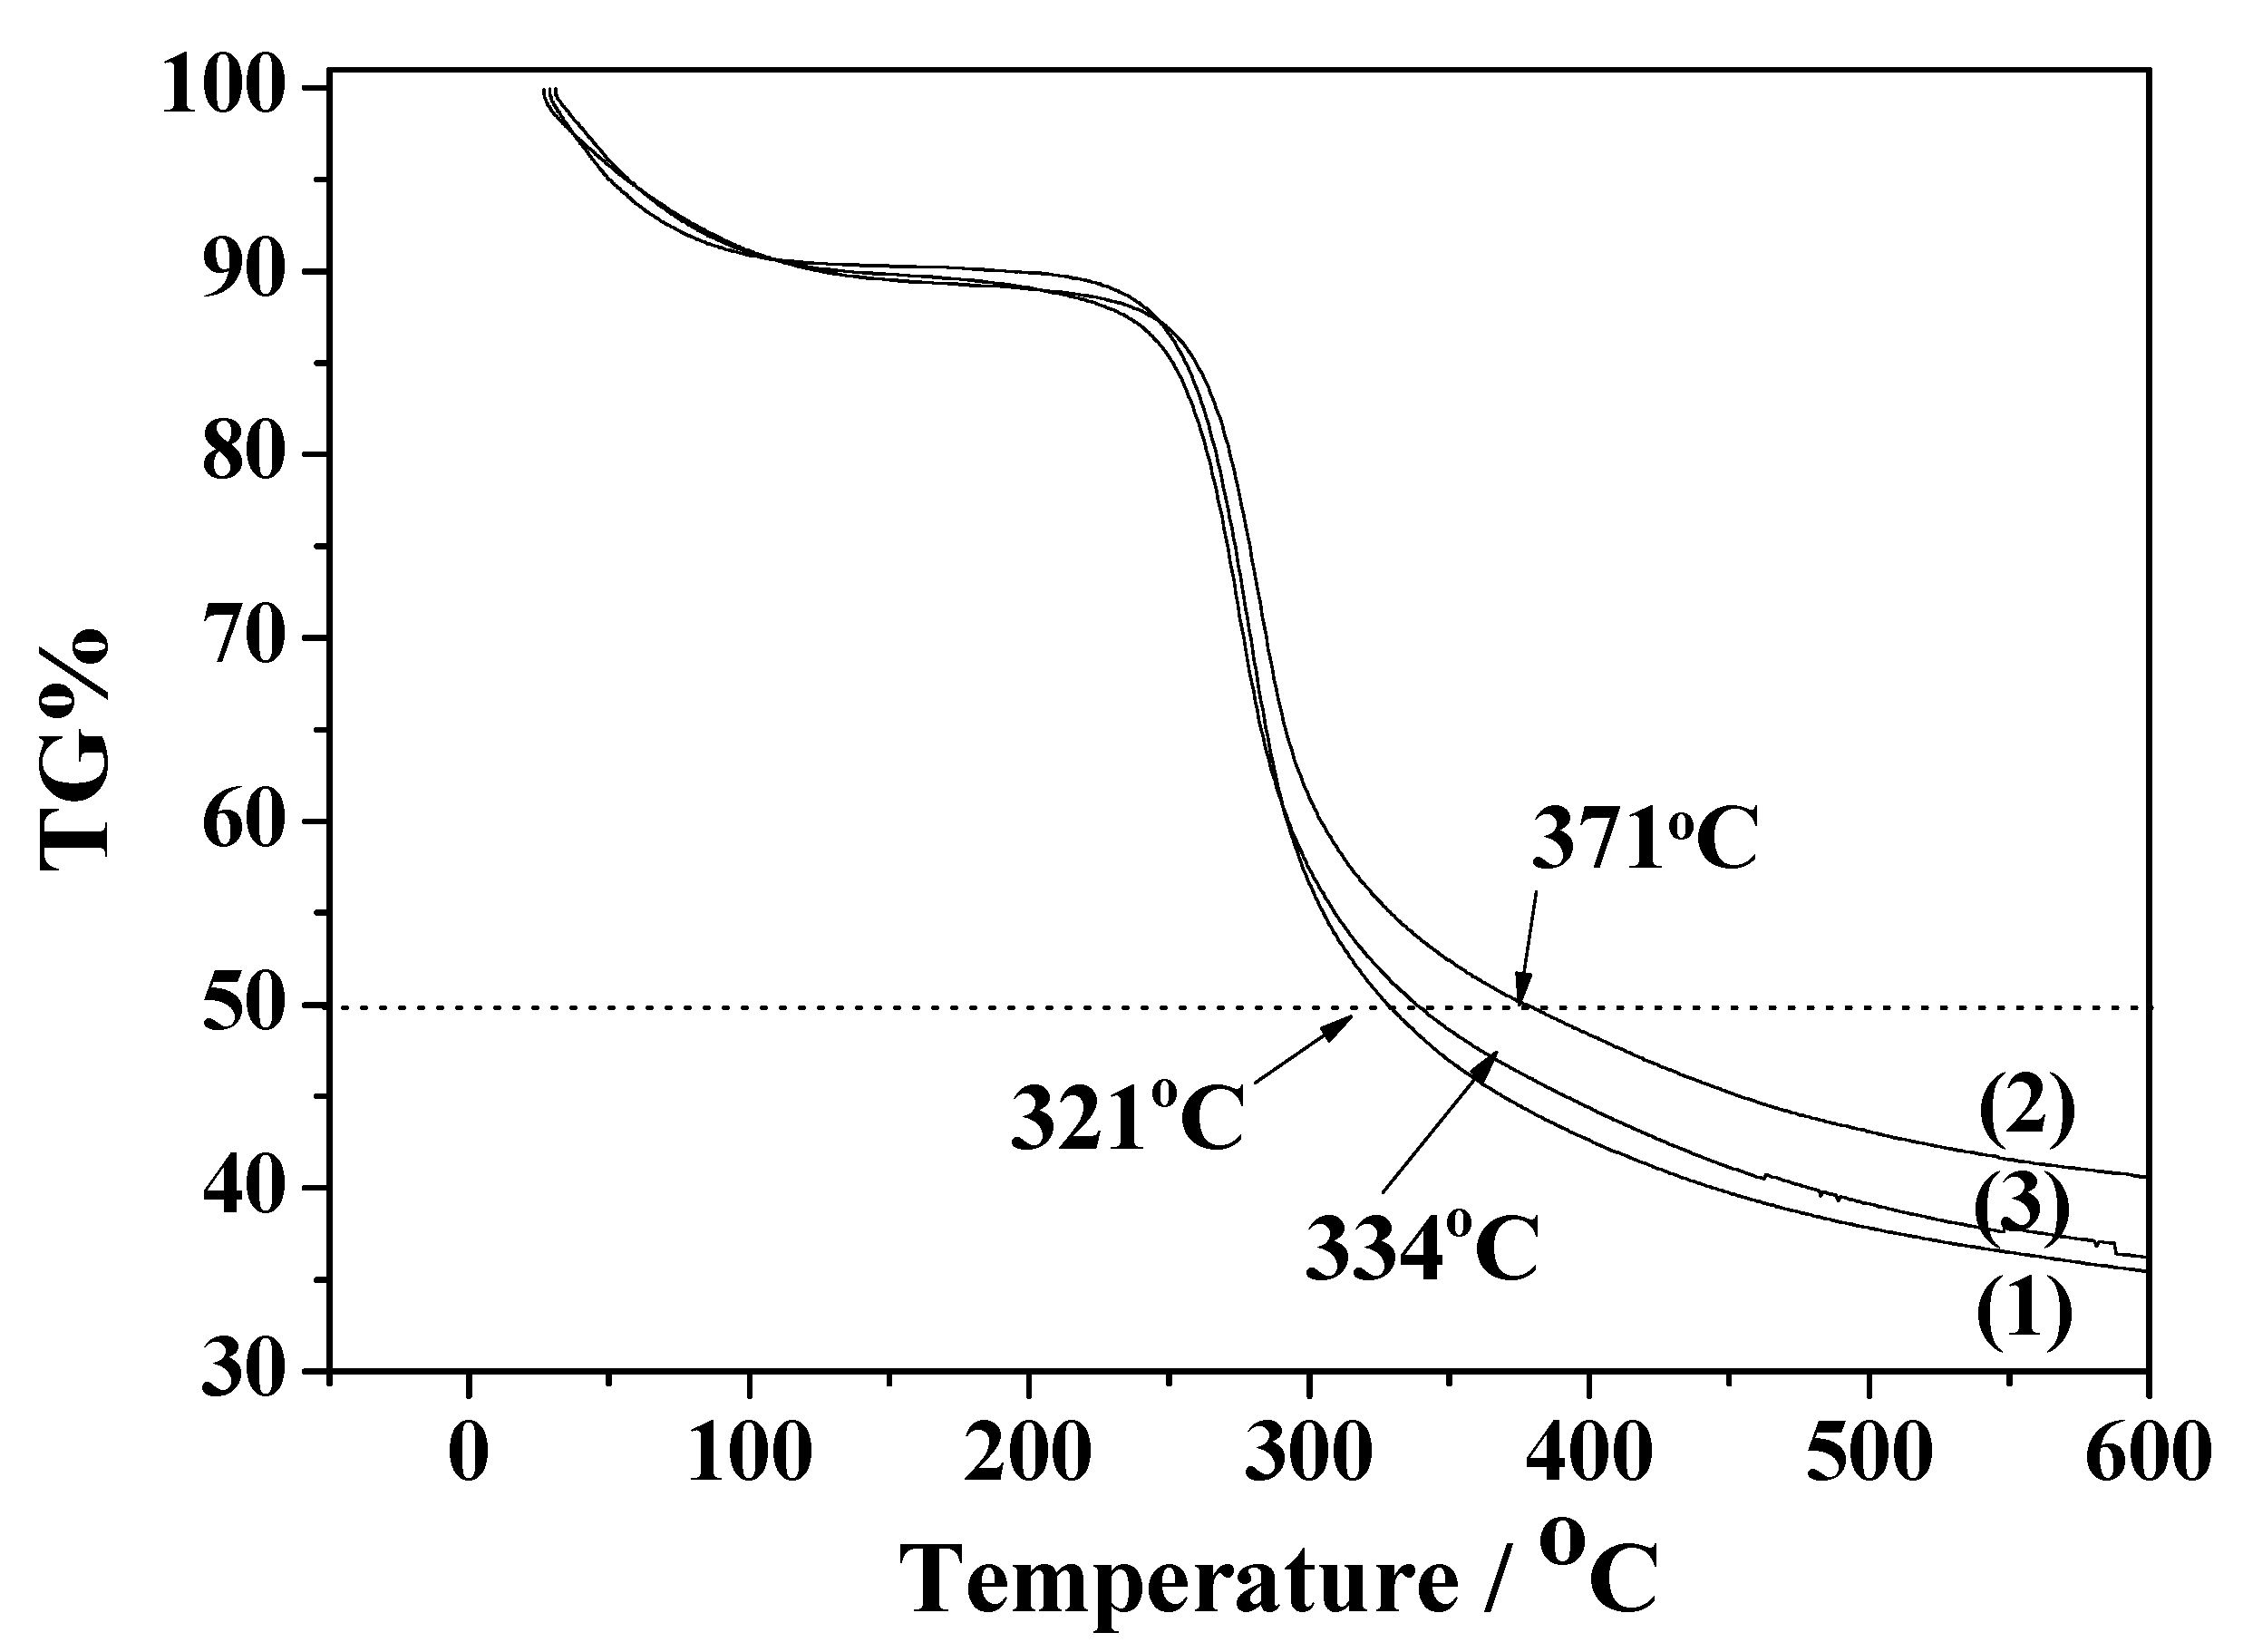
3.2. TG Results
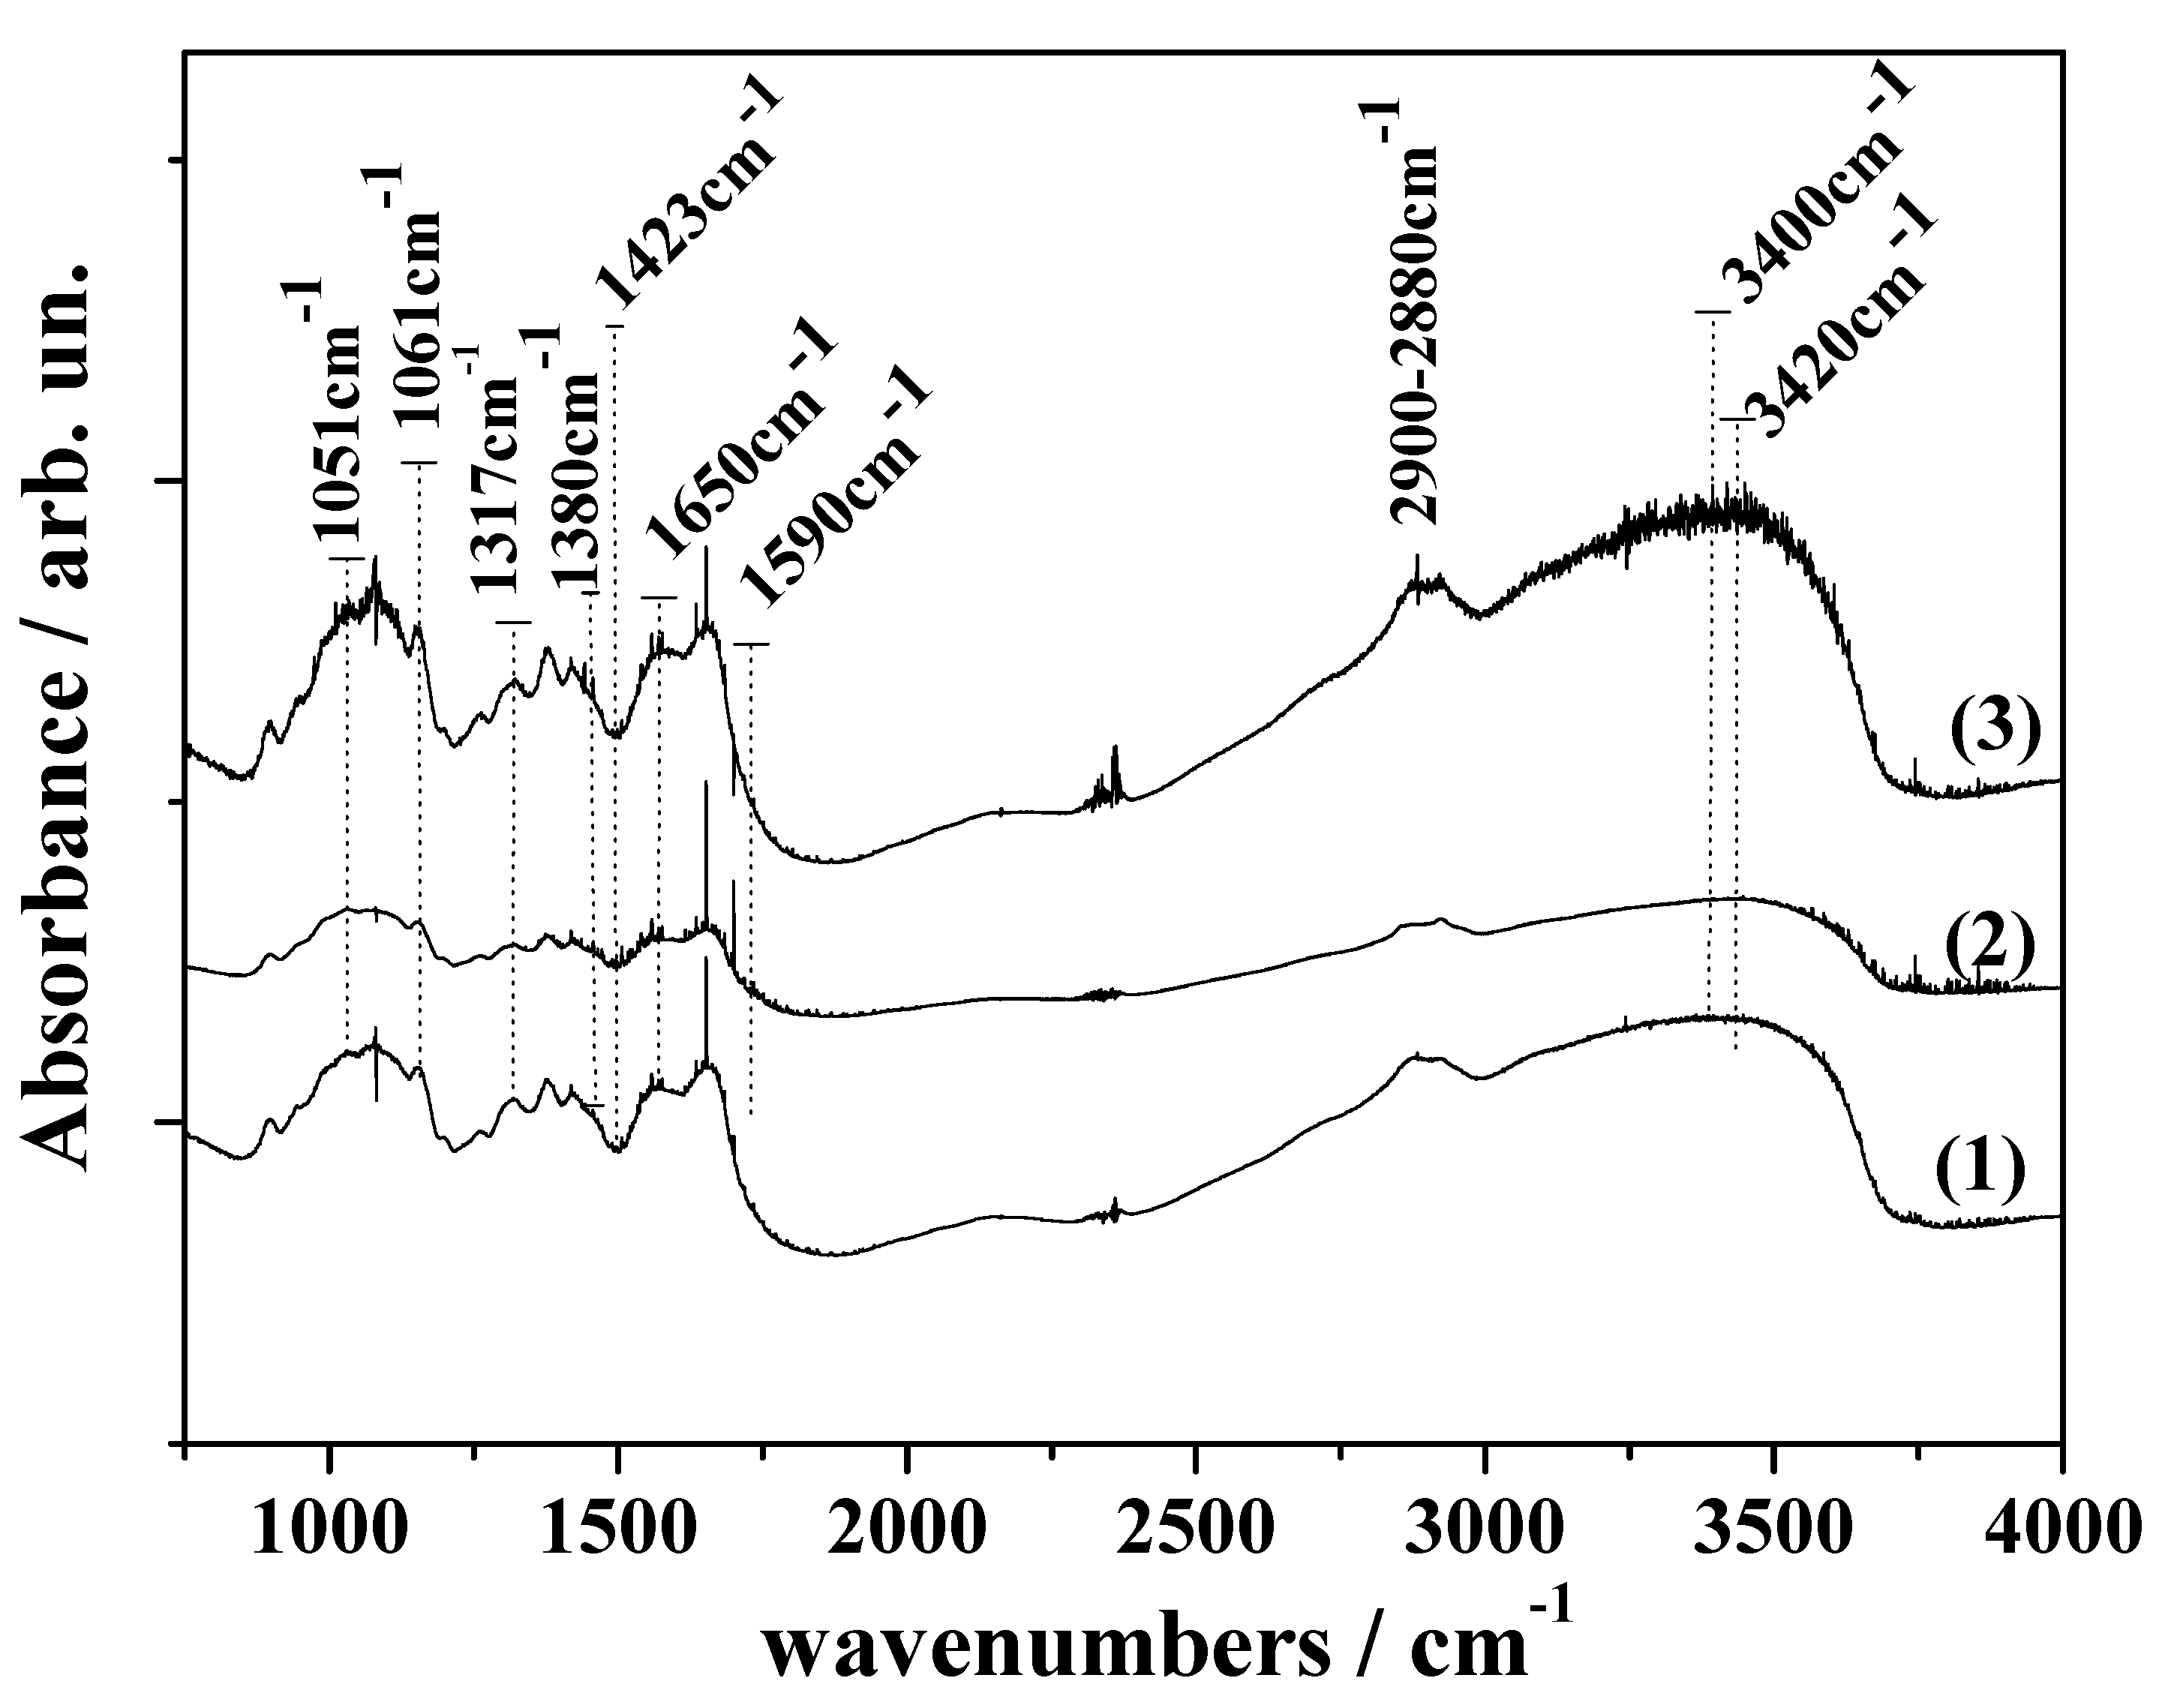
3.3. FTIR Results
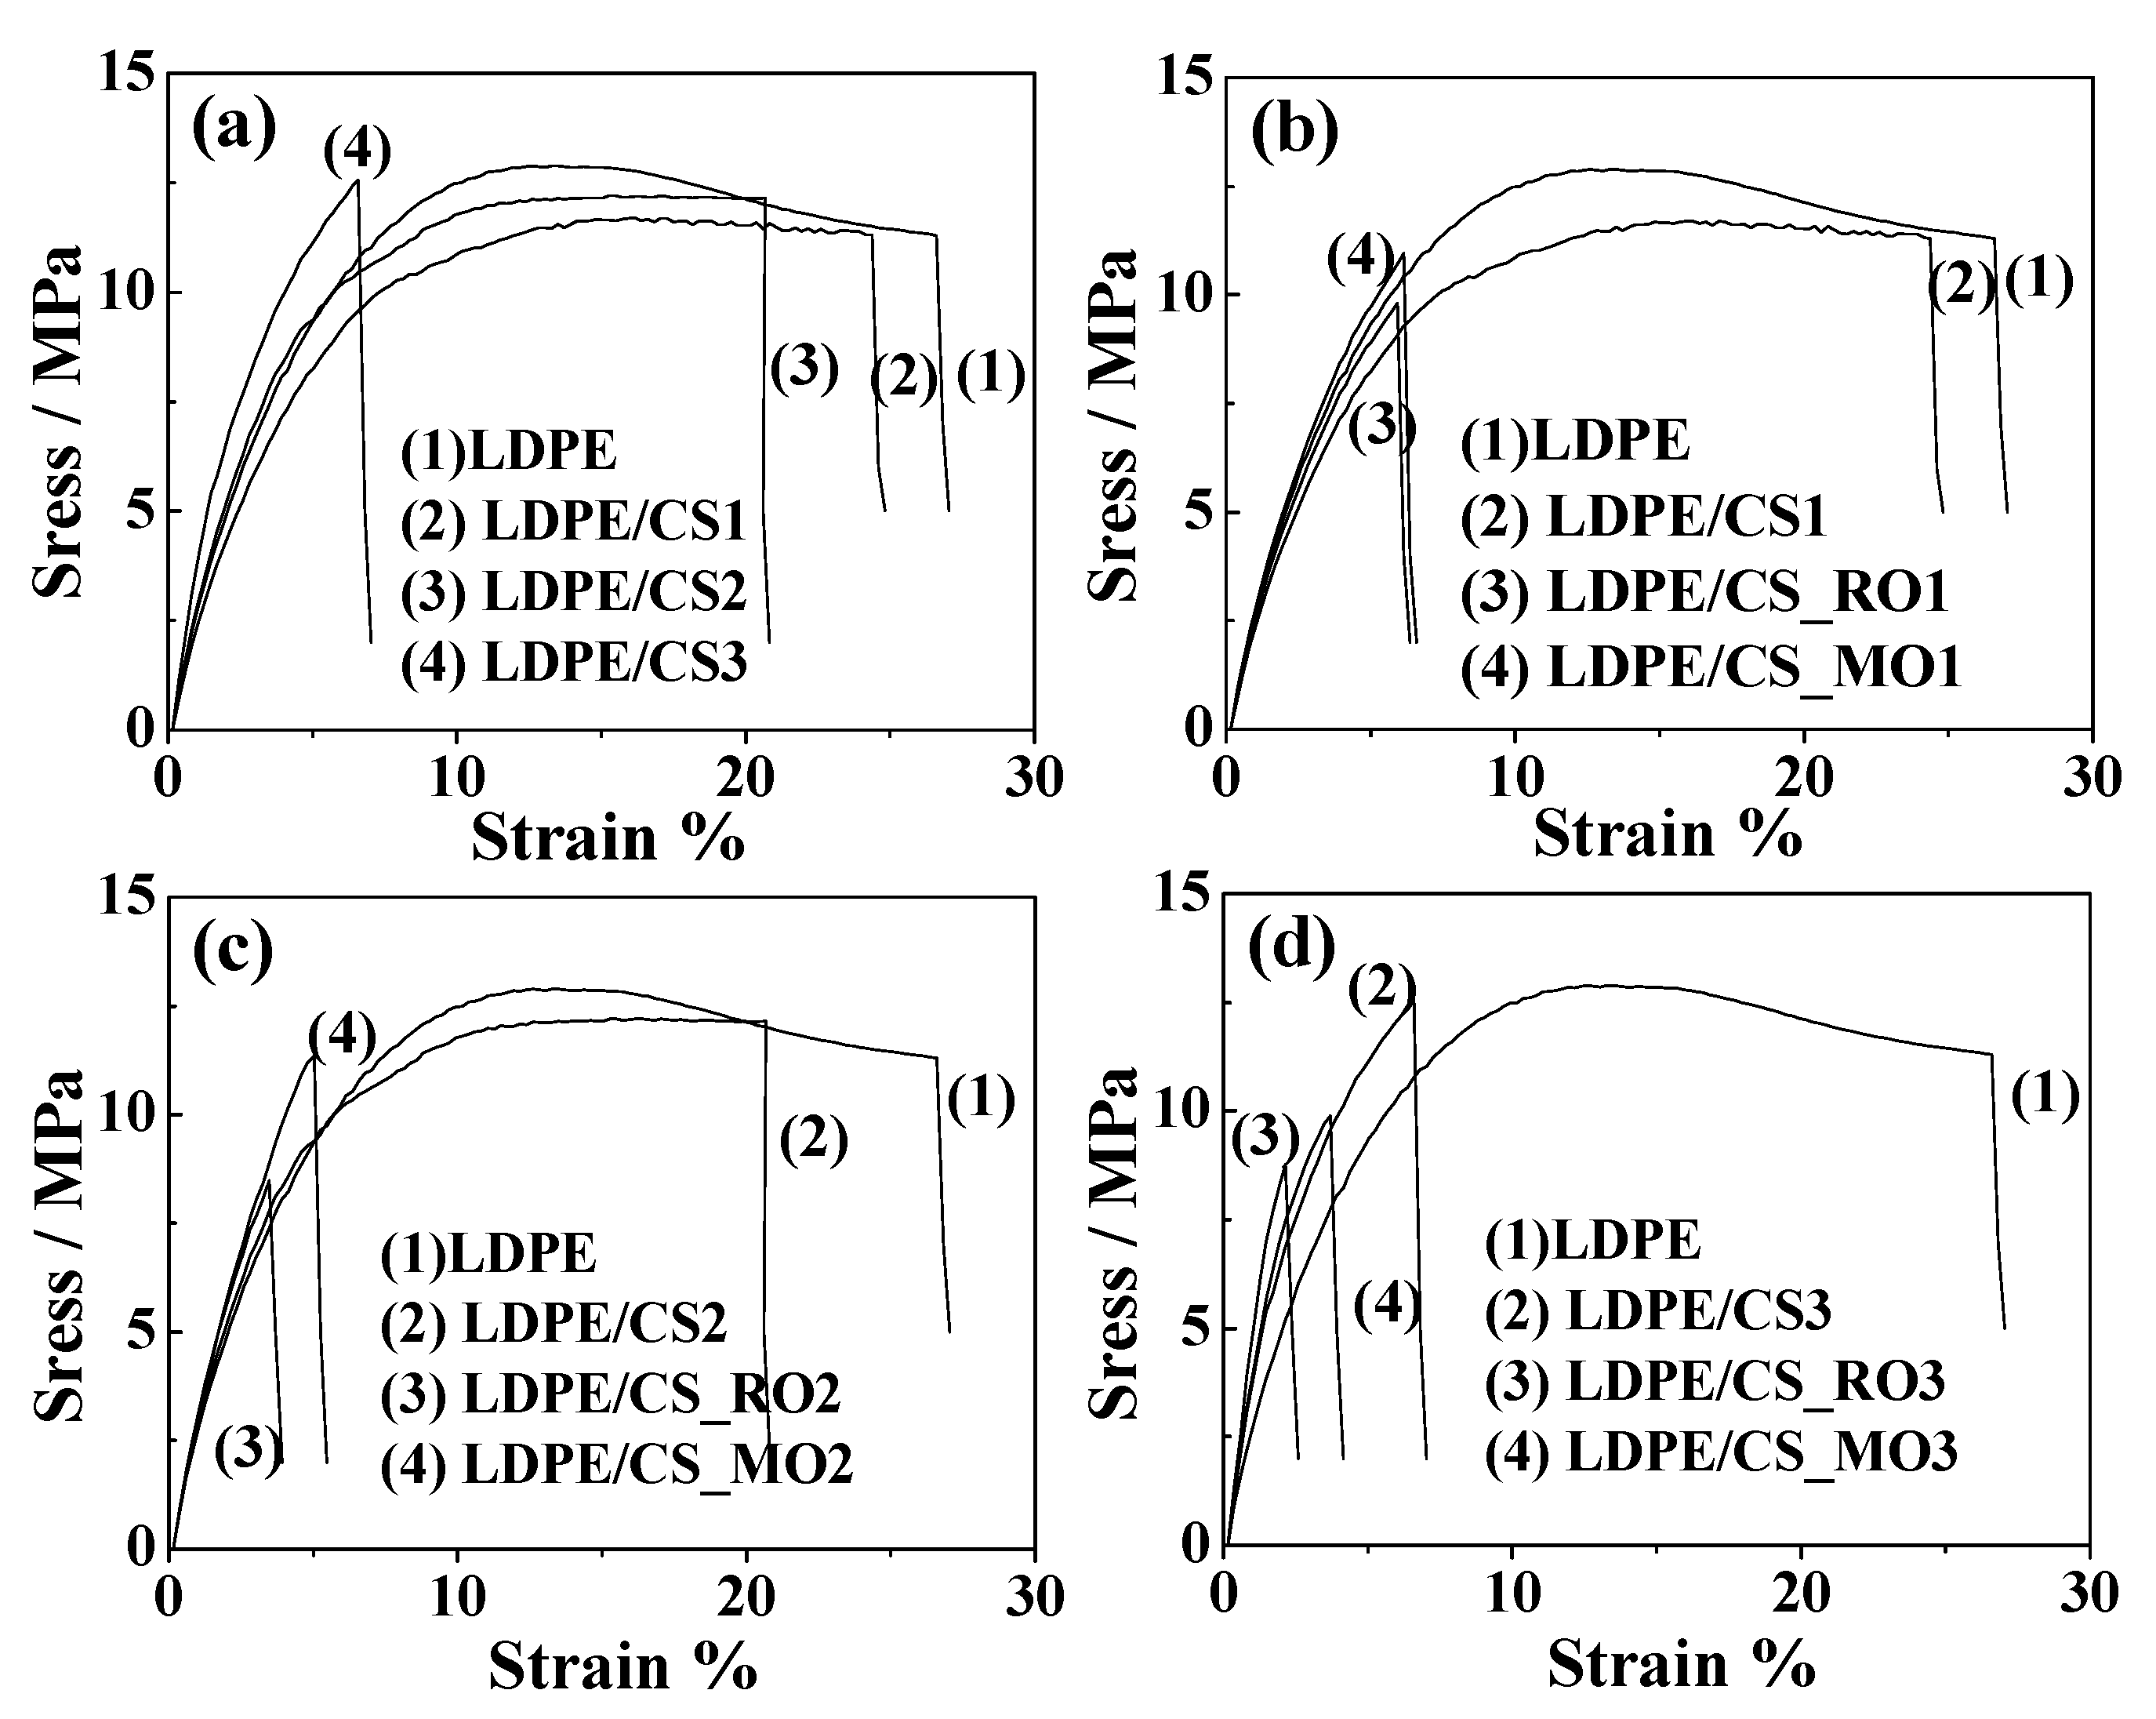
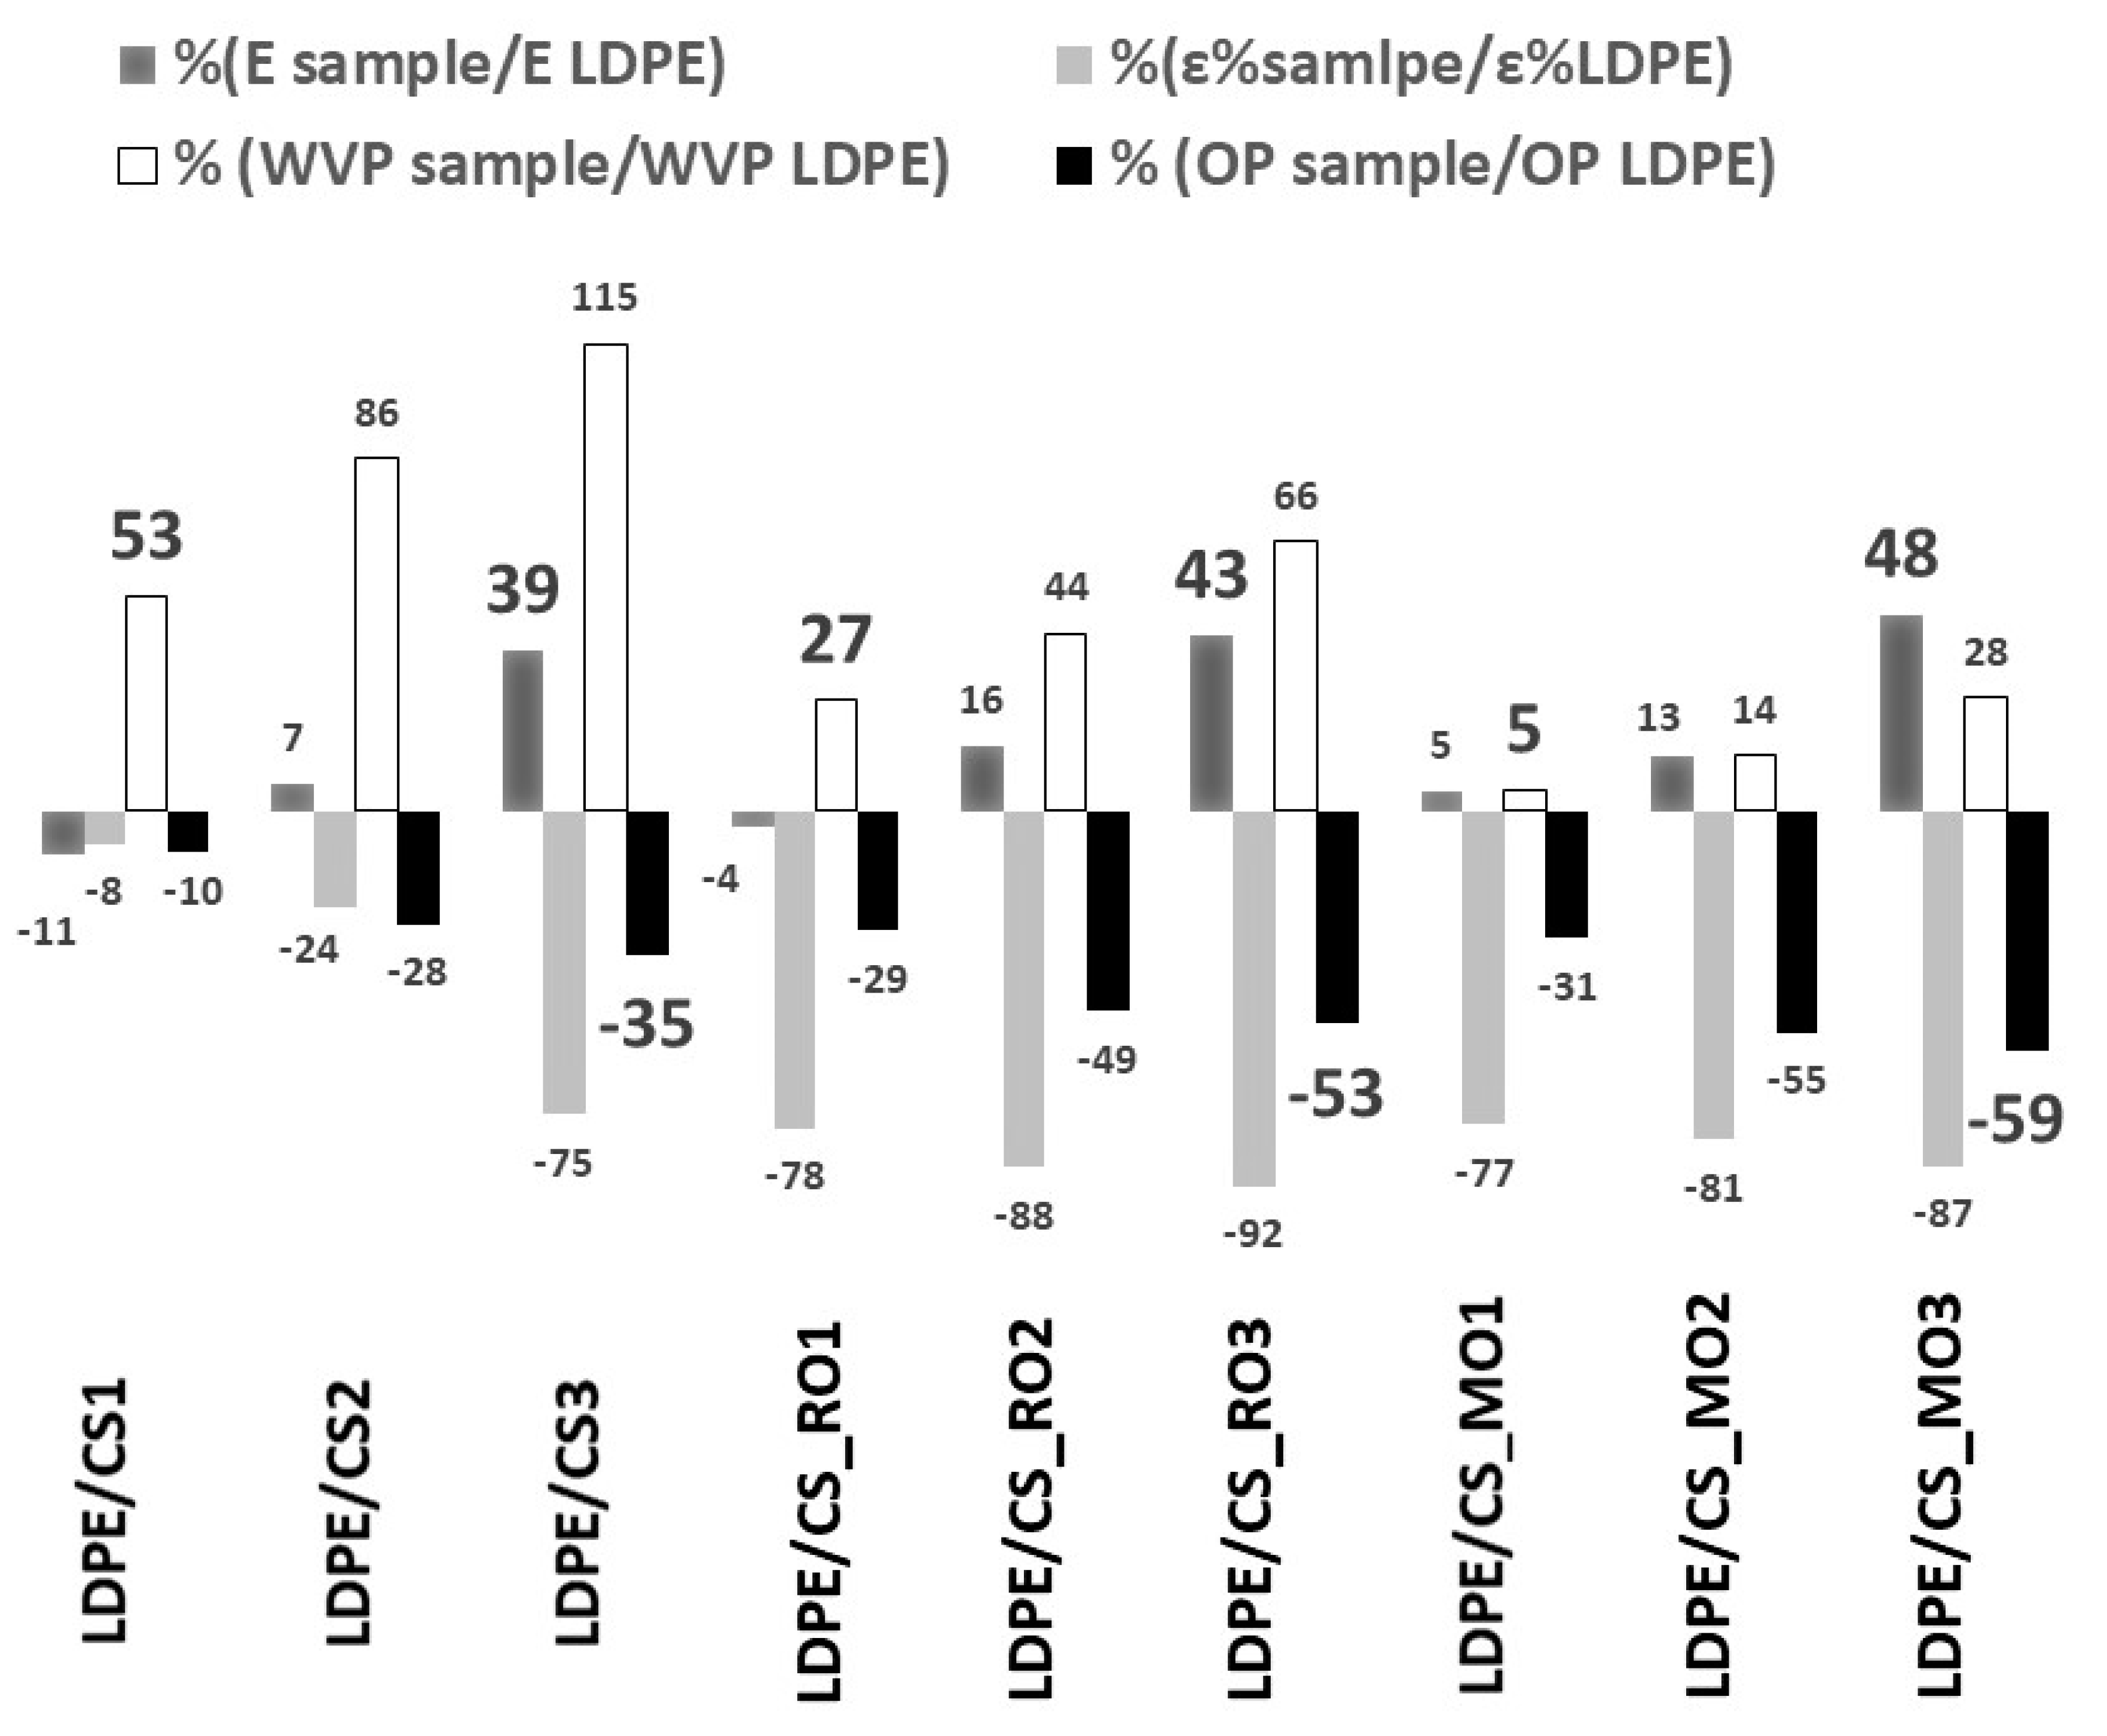
3.4. Tensile Properties
3.5. Water Barrier–Water Sorption
3.6. Oxygen Permeability
3.7. Overall Migration Rate
3.8. Antioxidant Activity
4. Conclusions
Author Contributions
Funding
Acknowledgments
Conflicts of Interest
References
- Siracusa, V. Food Packaging Permeability Behaviour: A Report. Int. J. Polym. Sci. 2012, 2012, 1–11. [Google Scholar] [CrossRef]
- Sunilkumar, M.; Francis, T.; Thachil, E.T.; Sujith, A. Low density polyethylene-chitosan composites: A study based on biodegradation. Chem. Eng. J. 2012, 204–205, 114–124. [Google Scholar] [CrossRef]
- Ozdemir, M.; Floros, J.D. Active food packaging technologies. Crit. Rev. Food Sci. Nutr. 2004, 44, 185–193. [Google Scholar] [CrossRef] [PubMed]
- Muzzarelli, R.A.A.; Boudrant, J.; Meyer, D.; Manno, N.; Demarchis, M.; Paoletti, M.G. Current views on fungal chitin/chitosan, human chitinases, food preservation, glucans, pectins and inulin: A tribute to Henri Braconnot, precursor of the carbohydrate polymers science, on the chitin bicentennial. Carbohydr. Polym. 2012, 87, 995–1012. [Google Scholar] [CrossRef]
- Muxika, A.; Zugasti, I.; Guerrero, P.; de la Caba, K. Applications of Chitosan in Food Packaging. In Reference Module in Food Science; Elsevier: Amsterdam, The Netherlands, 2018; pp. 1–12. [Google Scholar]
- Santos, A.P.; de Almeida de Melo, E.; Arroyo, B.J.; Boyano-Orozco, L.C.; Lins, L.; Campos, A. Bioactive Compounds and Their Potential Use as Ingredients for Food and Its Application in Food Packaging; Elsevier Inc.: Amsterdam, The Netherland, 2019; ISBN 9780128147740. [Google Scholar]
- Zanetti, M.; Carniel, T.K.; Dalcanton, F.; dos Anjos, R.S.; Gracher Riella, H.; de Araújo, P.H.H.; de Oliveira, D.; Antônio Fiori, M. Use of encapsulated natural compounds as antimicrobial additives in food packaging: A brief review. Trends Food Sci. Technol. 2018, 81, 51–60. [Google Scholar] [CrossRef]
- Samotyja, U.; Małecka, M. Effects of blackcurrant seeds and rosemary extracts on oxidative stability of bulk and emulsified lipid substrates. Food Chem. 2007, 104, 317–323. [Google Scholar] [CrossRef]
- Giannakas, A.; Grigoriadi, K.; Leontiou, A.; Barkoula, N.M.; Ladavos, A. Preparation, characterization, mechanical and barrier properties investigation of chitosan-clay nanocomposites. Carbohydr. Polym. 2014, 108, 103–111. [Google Scholar] [CrossRef] [PubMed]
- Jacquelot, E.; Espuche, E.; Gérard, J.F.; Duchet, J.; Mazabraud, P. Morphology and gas barrier properties of polyethylene-based nanocomposites. J. Polym. Sci. Part B Polym. Phys. 2006, 44, 431–440. [Google Scholar] [CrossRef]
- Perez, M.A.; Rivas, B.L.; Garrido-Miranda, K.A.; Campos-Requena, V.H.; Martinez, M.; Castano, J.; Maldonado, A. low density polyethylene (Ldpe) Nanocomposites with passive and active barrier properties. J. Chil. Chem. Soc. 2014, 59, 2442–2446. [Google Scholar]
- Reesha, K.V.; Satyen Kumar, P.; Bindu, J.; Varghese, T.O. Development and characterization of an LDPE/chitosan composite antimicrobial film for chilled fish storage. Int. J. Biol. Macromol. 2015, 79, 934–942. [Google Scholar] [CrossRef]
- Plascencia-Jatomea, M.; Rodríguez-Félix, D.E.; del Castillo-Castro, T.; Quiroz-Castillo, J.M.; Rodríguez-Félix, F.; Grijalva-Monteverde, H.; Herrera-Franco, P.J. Preparation of extruded polyethylene/chitosan blends compatibilized with polyethylene-graft-maleic anhydride. Carbohydr. Polym. 2013, 101, 1094–1100. [Google Scholar]
- Li, C.; Zhang, Y.; Zhang, Y. Melt grafting of maleic anhydride onto low-density polyethylene/polypropylene blends. Polym. Test. 2003, 22, 191–195. [Google Scholar] [CrossRef]
- Sailaja, R.R.N.; Mechanical, S.S. Thermal properties of ldpe-cellulose acetate phthalate blends—Effect of maleic anhydridegrafted ldpe compatibilizer. J. Appl. Polym. Sci. 2009, 112, 649–659. [Google Scholar] [CrossRef]
- Vasile, C.; Darie, R.N.; Cheaburu-Yilmaz, C.N.; Pricope, G.M.; Bračič, M.; Pamfil, D.; Hitruc, G.E.; Duraccio, D. Low density polyethylene-Chitosan composites. Compos. Part B Eng. 2013, 55, 314–323. [Google Scholar] [CrossRef]
- Martínez-Camacho, A.P.; Cortez-Rocha, M.O.; Graciano-Verdugo, A.Z.; Rodríguez-Félix, F.; Castillo-Ortega, M.M.; Burgos-Hernández, A.; Ezquerra-Brauer, J.M.; Plascencia-Jatomea, M. Extruded films of blended chitosan, low density polyethylene and ethylene acrylic acid. Carbohydr. Polym. 2013, 91, 666–674. [Google Scholar] [CrossRef] [PubMed]
- Park, S., II; Marsh, K.S.; Dawson, P. Application of chitosan-incorporated LDPE film to sliced fresh red meats for shelf life extension. Meat Sci. 2010, 85, 493–499. [Google Scholar] [CrossRef]
- Wang, B.H.; Chen, D.; Chuai, C. Chinese packaging institute—2014 conference mechanical and barrier properties of lldpe/Chitosan Blown Films for Packaging. Packag. Technol. Sci. 2015, 28, 915–923. [Google Scholar] [CrossRef]
- Srinivasa, P.C.; Prashanth, K.V.H.; Susheelamma, N.S.; Ravi, R.; Tharanathan, R.N. Storage studies of tomato and bell pepper using eco-friendly films. Sci. food Agric. 2006, 1224, 1216–1224. [Google Scholar] [CrossRef]
- Piñeros-Hernandez, D.; Medina-Jaramillo, C.; López-Córdoba, A.; Goyanes, S. Edible cassava starch films carrying rosemary antioxidant extracts for potential use as active food packaging. Food Hydrocoll. 2017, 63, 488–495. [Google Scholar] [CrossRef]
- Andrade, M.A.; Ribeiro-Santos, R.; Costa Bonito, M.C.; Saraiva, M.; Sanches-Silva, A. Characterization of rosemary and thyme extracts for incorporation into a whey protein based film. LWT 2018, 92, 497–508. [Google Scholar] [CrossRef]
- Jancikova, S.; Jamróz, E.; Kulawik, P.; Tkaczewska, J.; Dordevic, D. Furcellaran/gelatin hydrolysate/rosemary extract composite films as active and intelligent packaging materials. Int. J. Biol. Macromol. 2019, 131, 19–28. [Google Scholar] [CrossRef] [PubMed]
- Tsimogiannis, D.; Stavrakaki, M.; Oreopoulou, V. Isolation and characterisation of antioxidant components from oregano (Origanum heracleoticum). Int. J. Food Sci. Technol. 2006, 41, 39–48. [Google Scholar] [CrossRef]
- Prasanna, K.; Sailaja, R.R.N.S. Blends of LDPE/Chitosan Using Epoxy-Functionalized LDPE as Compatibilizer. J. Appl. Polym. Sci. 2012, 124, 3264–3275. [Google Scholar] [CrossRef]
- Giannakas, A.; Spanos, C.G.; Kourkoumelis, N.; Vaimakis, T.; Ladavos, A. Preparation, characterization and water barrier properties of PS/organo-montmorillonite nanocomposites. Eur. Polym. J. 2008, 44, 3915–3921. [Google Scholar] [CrossRef]
- Determination of Overall Migration Residue; USFDA: Hampton, VA, USA, 2014.
- Kumar, S.; Dutta, P.K.; Koh, J. International Journal of Biological Macromolecules A physico-chemical and biological study of novel chitosan—Chloroquinoline derivative for biomedical applications. Int. J. Biol. Macromol. 2011, 49, 356–361. [Google Scholar] [CrossRef] [PubMed]
- Rhim, J.W.; Hong, S.I.; Park, H.M.; Ng, P.K.W. Preparation and characterization of chitosan-based nanocomposite films with antimicrobial activity. J. Agric. Food Chem. 2006, 54, 5814–5822. [Google Scholar] [CrossRef] [PubMed]
- Kumar, D.; Pandey, J.; Kumar, P. Synthesis and characterization of modified chitosan via microwave route for novel antibacterial application. Int. J. Biol. Macromol. 2018, 107, 1388–1394. [Google Scholar] [CrossRef] [PubMed]
- Branca, C.; Angelo, G.D.; Crupi, C.; Khouzami, K.; Ri, S.; Ruello, G.; Wanderlingh, U. Role of the OH and NH vibrational groups in polysaccharide- nanocomposite interactions: A FTIR-ATR study on chitosan and chitosan/clay films. Polymer 2016, 99, 614–622. [Google Scholar] [CrossRef]
- Halász, K.; Csóka, L. Black chokeberry (Aronia melanocarpa) pomace extract immobilized in chitosan for colorimetric pH indicator film application. Food Packag. Shelf Life 2018, 16, 185–193. [Google Scholar] [CrossRef]
- Estevez-Areco, S.; Guz, L.; Candal, R.; Goyanes, S. Release kinetics of rosemary (Rosmarinus officinalis) polyphenols from polyvinyl alcohol (PVA) electrospun nanofibers in several food simulants. Food Packag. Shelf Life 2018, 18, 42–50. [Google Scholar] [CrossRef]
- Hamdi, M.; Nasri, R.; Li, S.; Nasri, M. Bioactive composite films with chitosan and carotenoproteins extract from blue crab shells: Biological potential and structural, thermal and mechanical characterization. Food Hydrocoll. 2019, 89, 802–812. [Google Scholar] [CrossRef]
- Vastag, B.K.; Flavonoids, D. Phenolic Acids as Potential Natural Antioxidants; Intech: London, UK, 2016; p. 13. [Google Scholar]
- Rajalakshmi, A.; Krithiga, N.; Jayachitra, A. Antioxidant Activity of the Chitosan Extracted from Shrimp Exoskeleton. Middle East J. Sci. Res. 2013, 16, 1446–1451. [Google Scholar]


| Code Name | LDPE (g) | PEGMA (g) | CS (g)–(%w/w) | CS_RO (g)–(%w/w) | CS_MO (g)–(%w/w) |
|---|---|---|---|---|---|
| LDPE/CS1 | 4.0 | 0.12 | 0.88–17.6 | ||
| LDPE/CS2 | 3.5 | 0.18 | 1.32–26.4 | ||
| LDPE/CS3 | 3.0 | 0.24 | 1.76–35.2 | ||
| LDPE/CS_RO1 | 4.0 | 0.12 | 0.88–17.6 | ||
| LDPE/CS_RO2 | 3.5 | 0.18 | 1.32–26.4 | ||
| LDPE/CS_RO3 | 3.0 | 0.24 | 1.76–35.2 | ||
| LDPE/CS_MO1 | 4.0 | 0.12 | 0.88–17.6 | ||
| LDPE/CS_MO2 | 3.5 | 0.18 | 1.32–26.4 | ||
| LDPE/CS_MO3 | 3.0 | 0.24 | 1.76–35.2 |
| E (MPa) | ε% | σ (uts) (MPa) | |
|---|---|---|---|
| LDPE | 305 ± 46 | 26.7 ± 6.7 | 12.3 ± 0.6 |
| LDPE/CS1 | 272 ± 34 | 24.5 ± 0.7 | 11.9 ± 0.8 |
| LDPE/CS2 | 325 ± 38 | 20.4 ± 3.9 | 12.3 ± 2.3 |
| LDPE/CS3 | 425 ± 12 | 6.8 ± 2.1 | 12.1 ± 1.1 |
| LDPE/CS_RO1 | 293 ± 27 | 5.9 ± 1.5 | 9.8 ± 1.6 |
| LDPE/CS_RO2 | 354 ± 60 | 3.3 ± 1.4 | 9.2 ± 2.3 |
| LDPE/CS_RO3 | 436 ± 13 | 2.0 ± 0.5 | 8.9 ± 0.3 |
| LDPE/CS_MO1 | 320 ± 56 | 6.1 ± 1.5 | 12.4 ± 2.1 |
| LDPE/CS_MO2 | 346 ± 63 | 5.1 ± 0.5 | 11.4 ± 26 |
| LDPE/CS_MO3 | 452 ± 10 | 3.4 ± 0.3 | 9.9 ± 0.6 |
| WVP (g/m2/day) | Water Sorption | OP cm3·mm/m2·day | Total Migration (mg/L) | Antioxidant Activity After 24 h | |
|---|---|---|---|---|---|
| LDPE | 17.7 ± 0.8 | n.d. | 185.5 ± 9.7 | 12.44 ± 0.01 | n.d. |
| LDPE/CS1 | 27.0 ± 0.6 | 4.8 ± 0.4 | 166.6 ± 8.7 | 23.23 ± 0.01 | 27.1 ± 1.1 |
| LDPE/CS2 | 33.0 ± 0.7 | 5.8 ± 0.3 | 133.6 ± 8.2 | 35.35 ± 0.01 | 33.9 ± 1.2 |
| LDPE/CS3 | 38.0 ± 0.8 | 7.1 ± 0.3 | 119.9 ± 8.3 | 47.16 ± 0.01 | 39.5 ± 1.3 |
| LDPE/CS_RO1 | 22.5 ± 0.5 | 4.8 ± 0.4 | 131.1 ± 7.6 | 23.44 ± 0.01 | 36.5 ± 1.5 |
| LDPE/CS_RO2 | 25.4 ± 0.7 | 5.1 ± 0.3 | 94.1 ± 7.1 | 36.22 ± 0.01 | 42.8 ± 1.1 |
| LDPE/CS_RO3 | 29.4 ± 0.8 | 5.9 ± 0.3 | 88.1 ± 7.2 | 45.16 ± 0.01 | 48.6 ± 1.8 |
| LDPE/CS_MO1 | 18.6 ± 0.8 | 3.2 ± 0.4 | 127.5 ± 6.8 | 24.25 ± 0.01 | 33.7 ± 1.8 |
| LDPE/CS_MO2 | 20.1 ± 0.6 | 4.2 ± 0.4 | 84.4 ± 6.5 | 34.23 ± 0.01 | 40.2 ± 1.5 |
| LDPE/CS_MO3 | 22.6 ± 0.7 | 5.1 ± 0.4 | 76.4 ± 6.4 | 44.22 ± 0.01 | 45.3 ± 1.6 |
© 2019 by the authors. Licensee MDPI, Basel, Switzerland. This article is an open access article distributed under the terms and conditions of the Creative Commons Attribution (CC BY) license (http://creativecommons.org/licenses/by/4.0/).
Share and Cite
Giannakas, A.; Salmas, C.; Leontiou, A.; Tsimogiannis, D.; Oreopoulou, A.; Braouhli, J. Novel LDPE/Chitosan Rosemary and Melissa Extract Nanostructured Active Packaging Films. Nanomaterials 2019, 9, 1105. https://doi.org/10.3390/nano9081105
Giannakas A, Salmas C, Leontiou A, Tsimogiannis D, Oreopoulou A, Braouhli J. Novel LDPE/Chitosan Rosemary and Melissa Extract Nanostructured Active Packaging Films. Nanomaterials. 2019; 9(8):1105. https://doi.org/10.3390/nano9081105
Chicago/Turabian StyleGiannakas, Aris, Constantinos Salmas, Areti Leontiou, Dimitrios Tsimogiannis, Antigoni Oreopoulou, and Joerg Braouhli. 2019. "Novel LDPE/Chitosan Rosemary and Melissa Extract Nanostructured Active Packaging Films" Nanomaterials 9, no. 8: 1105. https://doi.org/10.3390/nano9081105
APA StyleGiannakas, A., Salmas, C., Leontiou, A., Tsimogiannis, D., Oreopoulou, A., & Braouhli, J. (2019). Novel LDPE/Chitosan Rosemary and Melissa Extract Nanostructured Active Packaging Films. Nanomaterials, 9(8), 1105. https://doi.org/10.3390/nano9081105