Electrospun Bimetallic NiCr Nanoparticles@Carbon Nanofibers as an Efficient Catalyst for Hydrogen Generation from Ammonia Borane


Abstract
:1. Introduction
2. Experimental Section
2.1. Chemicals Used
2.2. Preparation of Catalytic Nano-Fibers
2.3. Catalytic Hydrolysis of Ammonia Borane Complex
2.4. Characterization Performed
3. Results
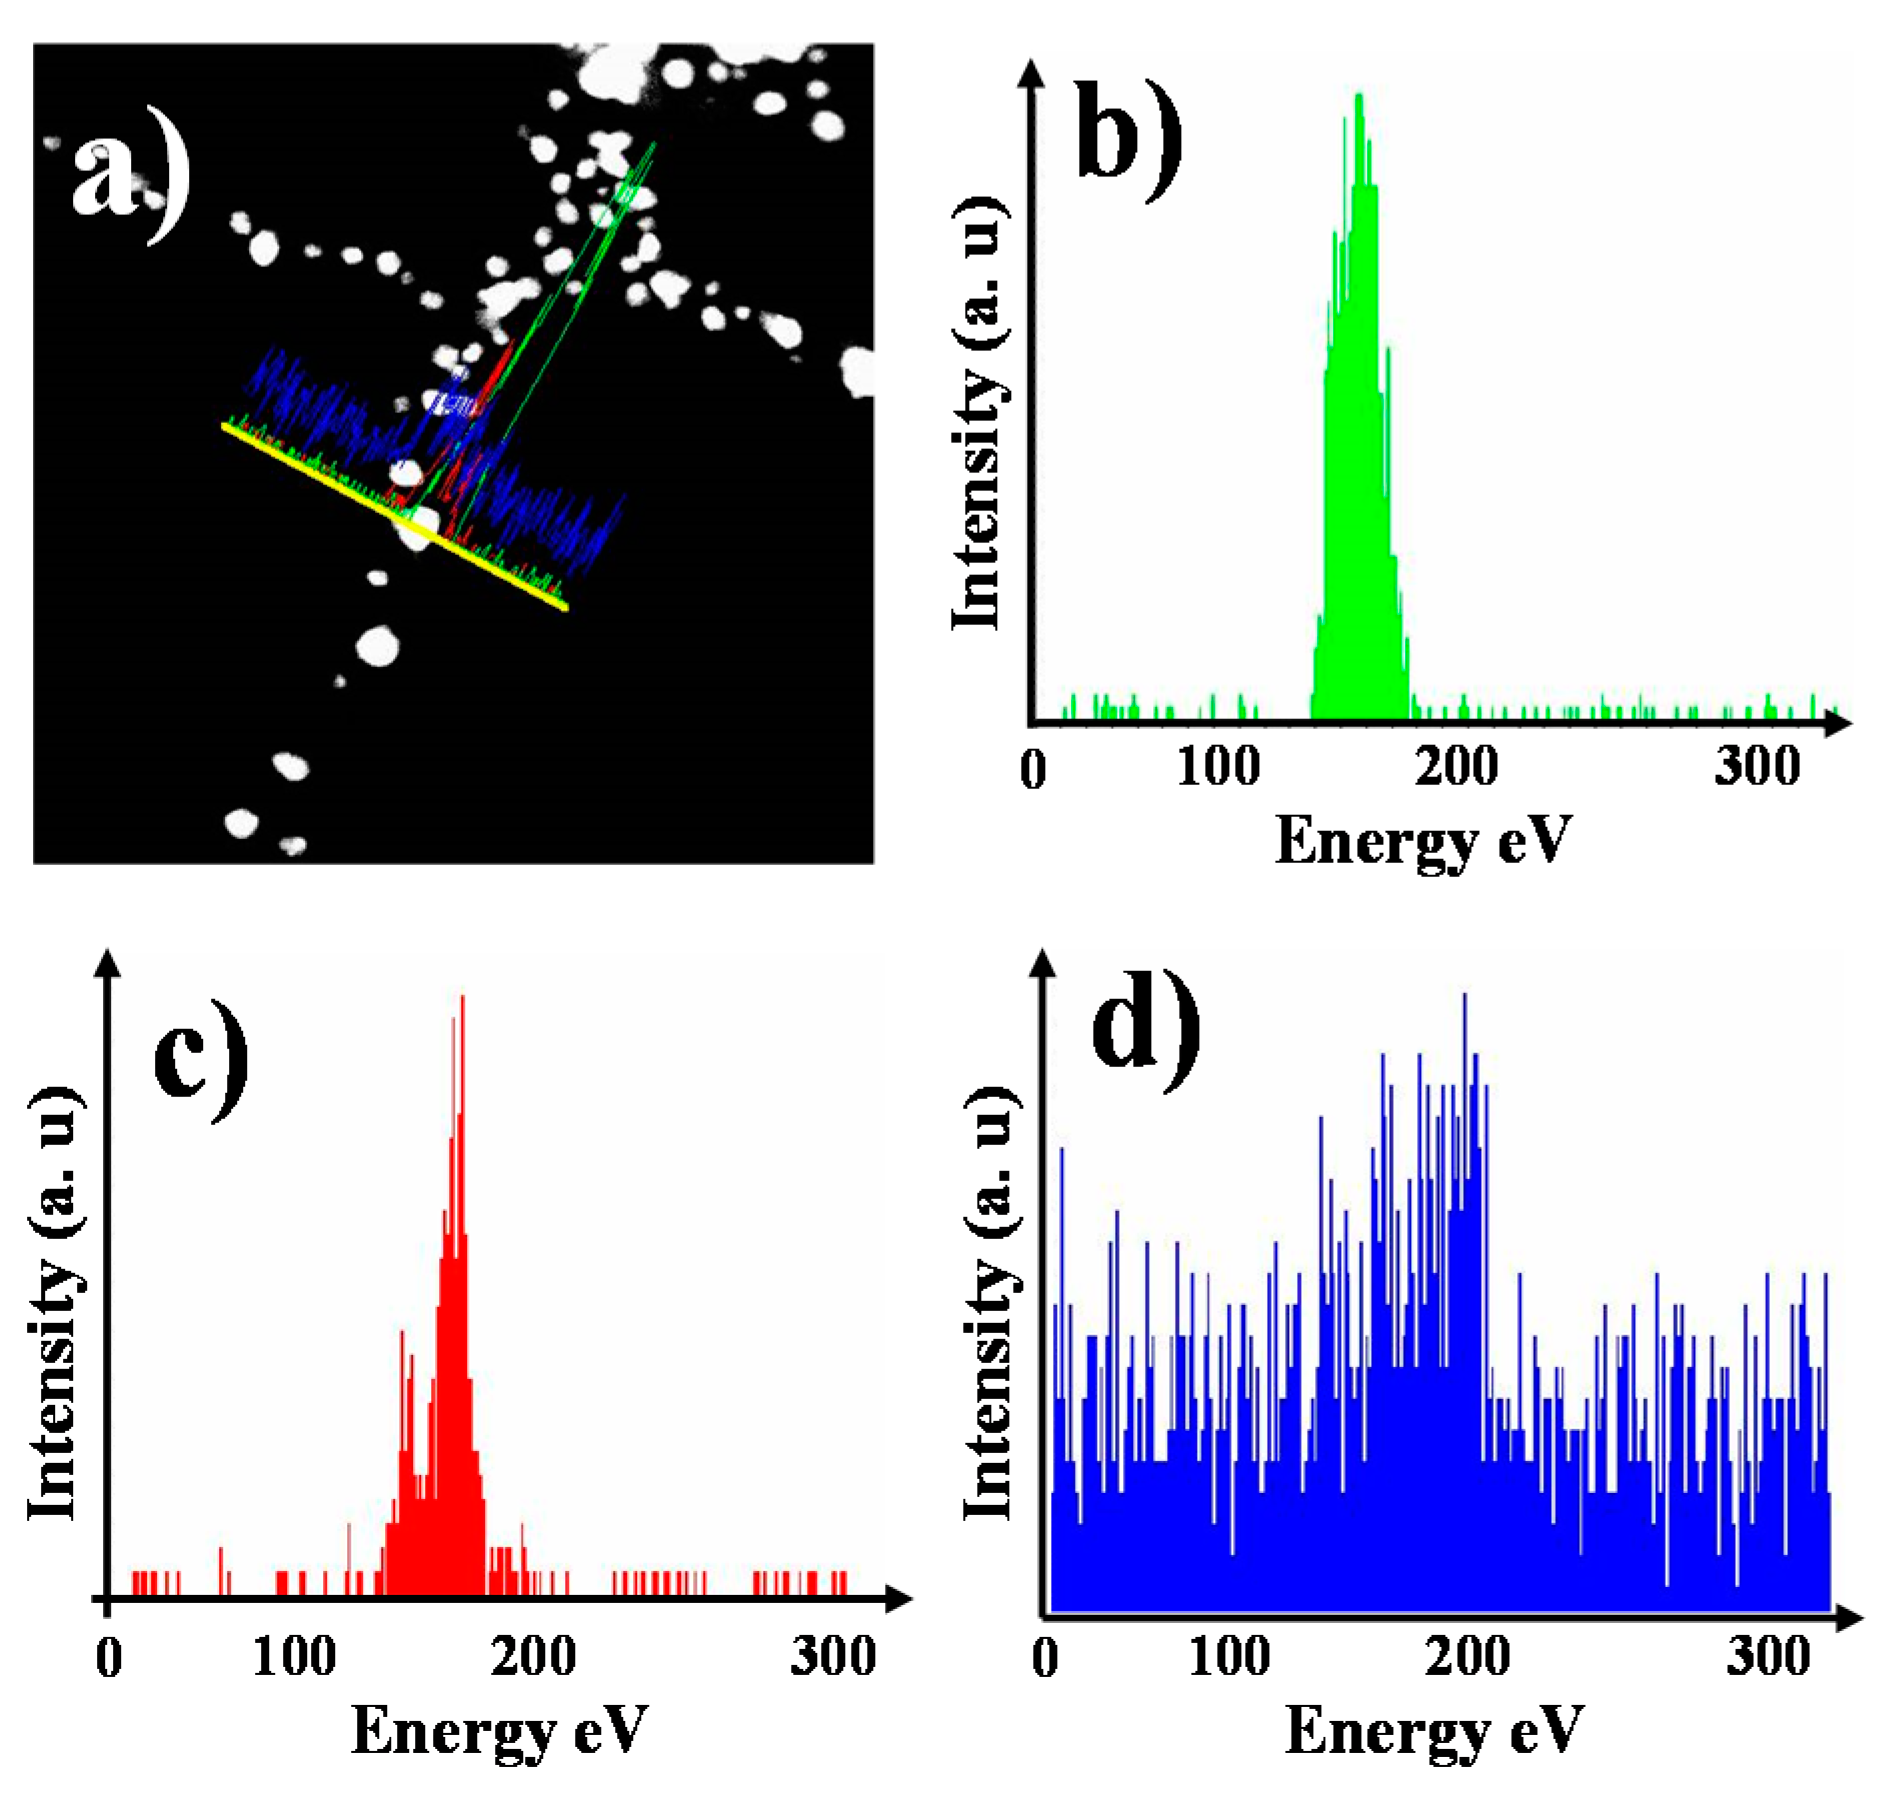
3.1. Physiochemical Characterization
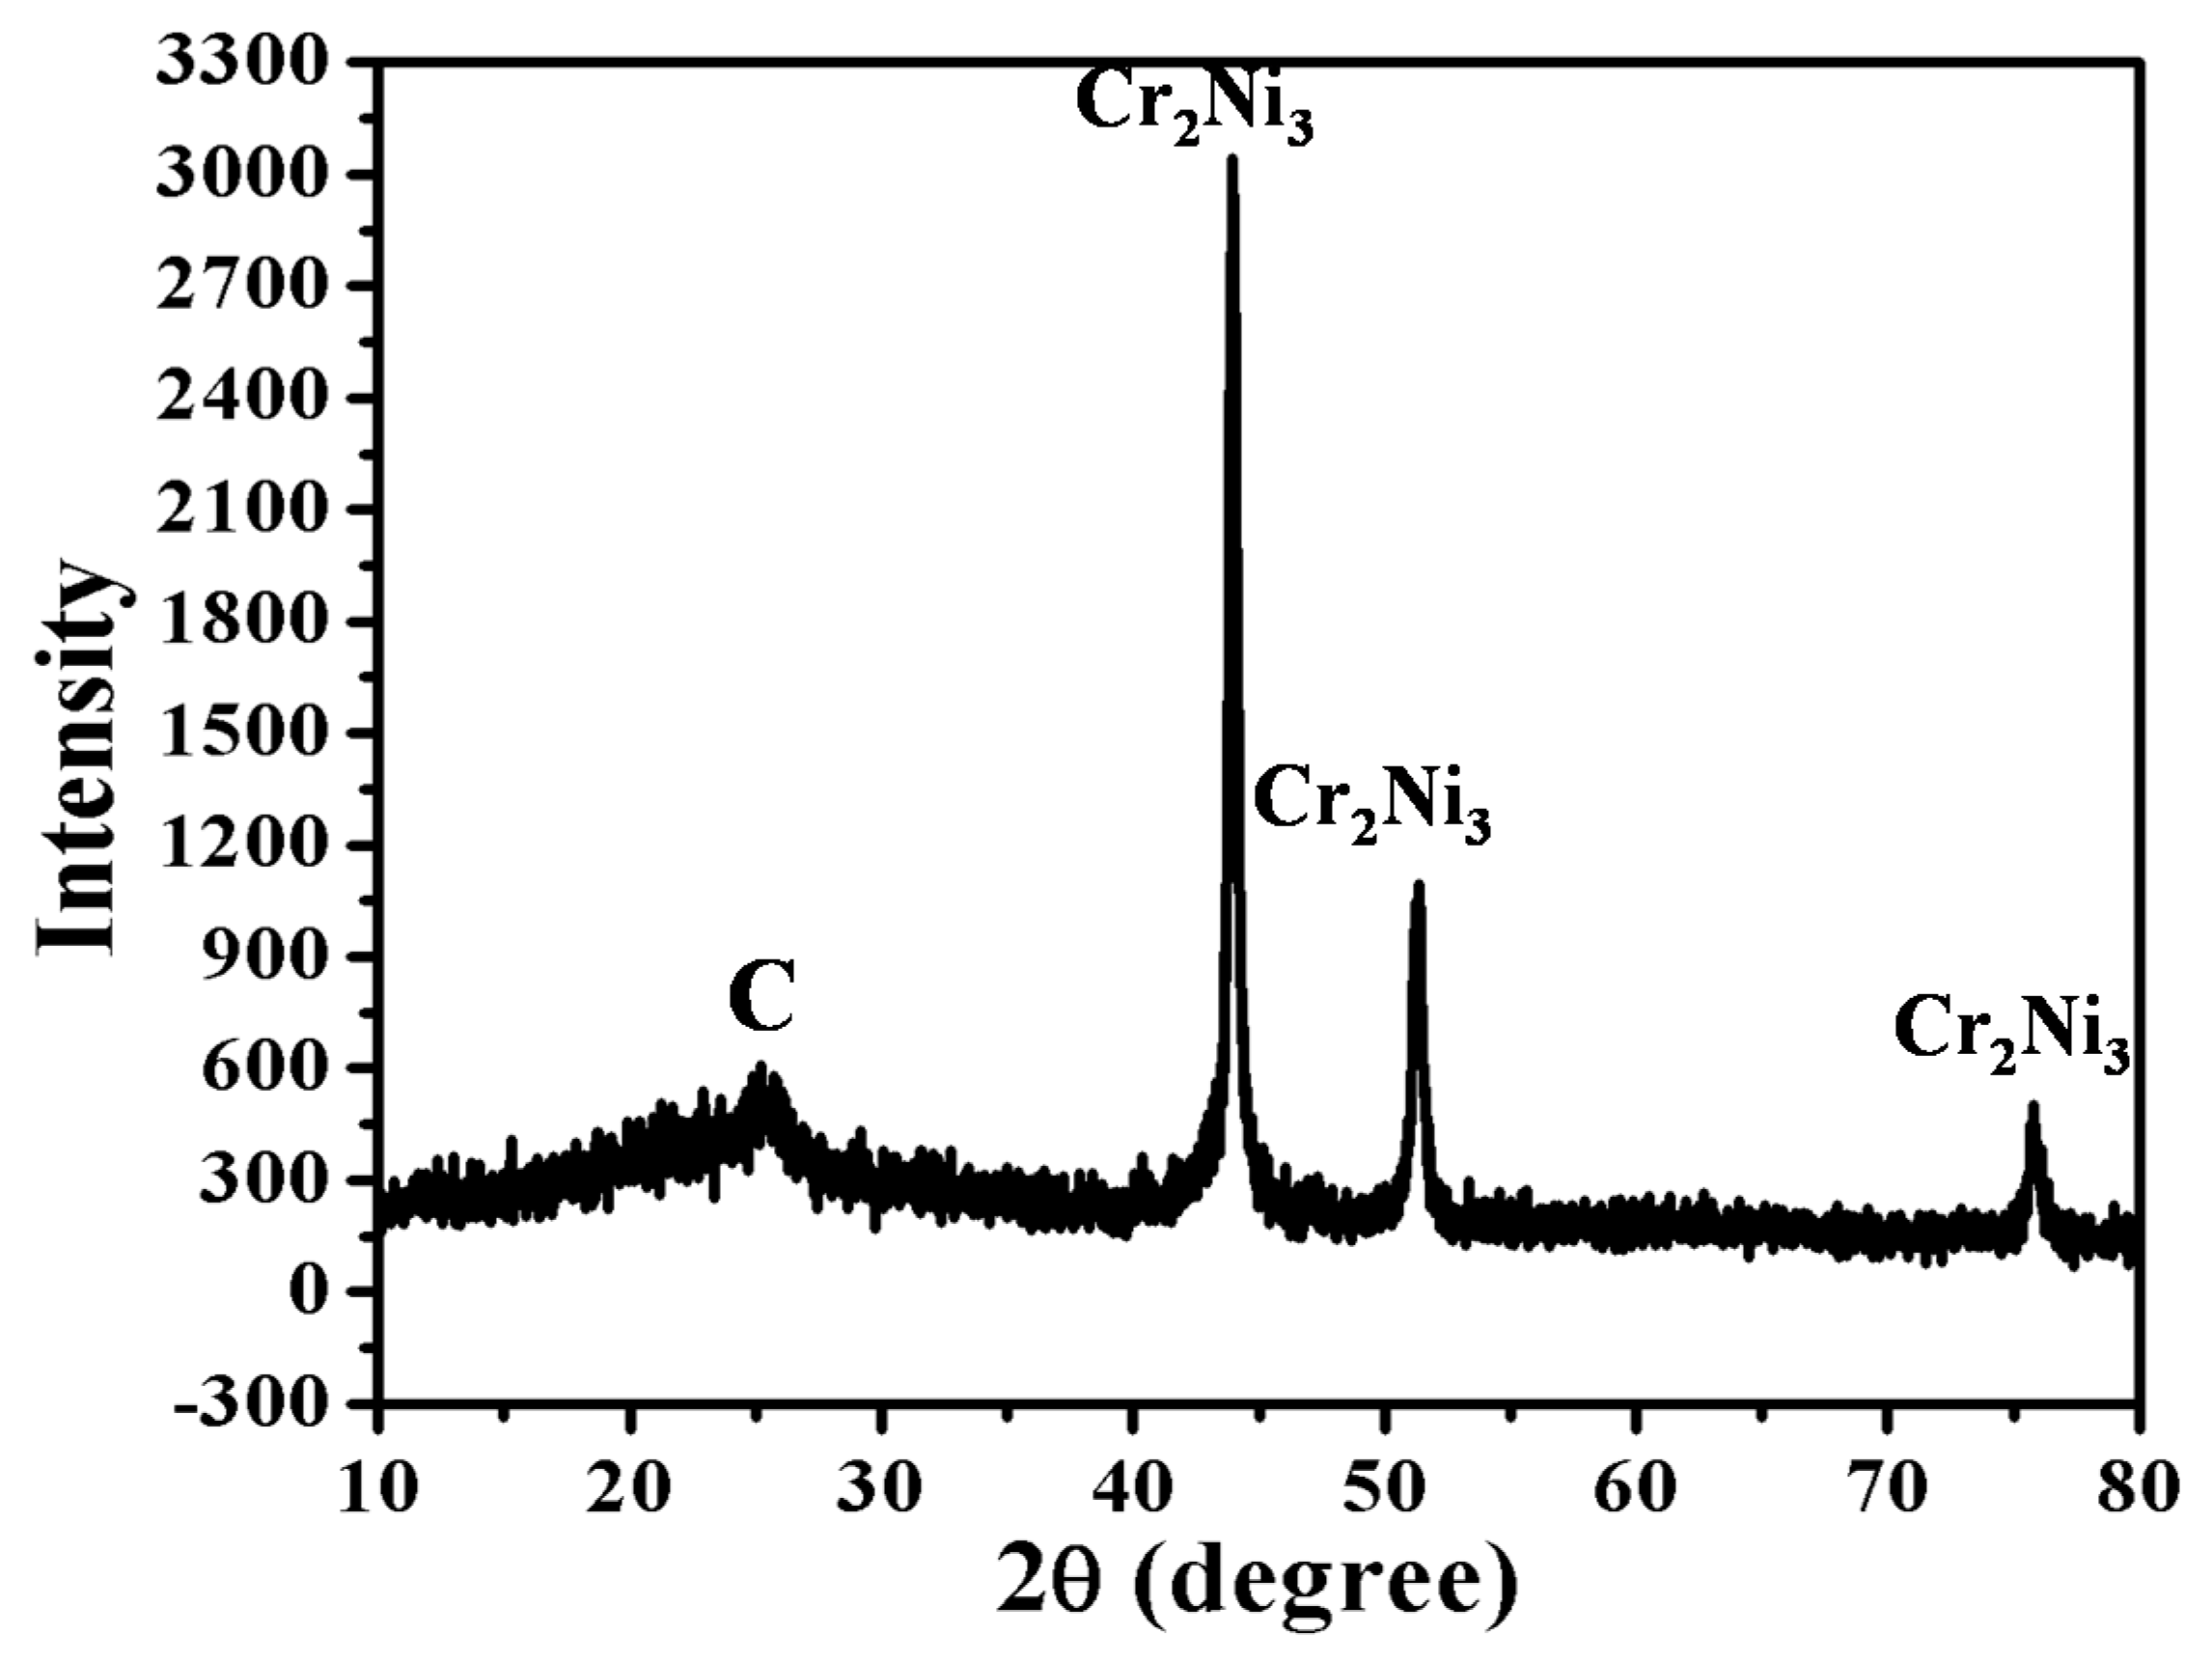
3.2. Crystal Structure
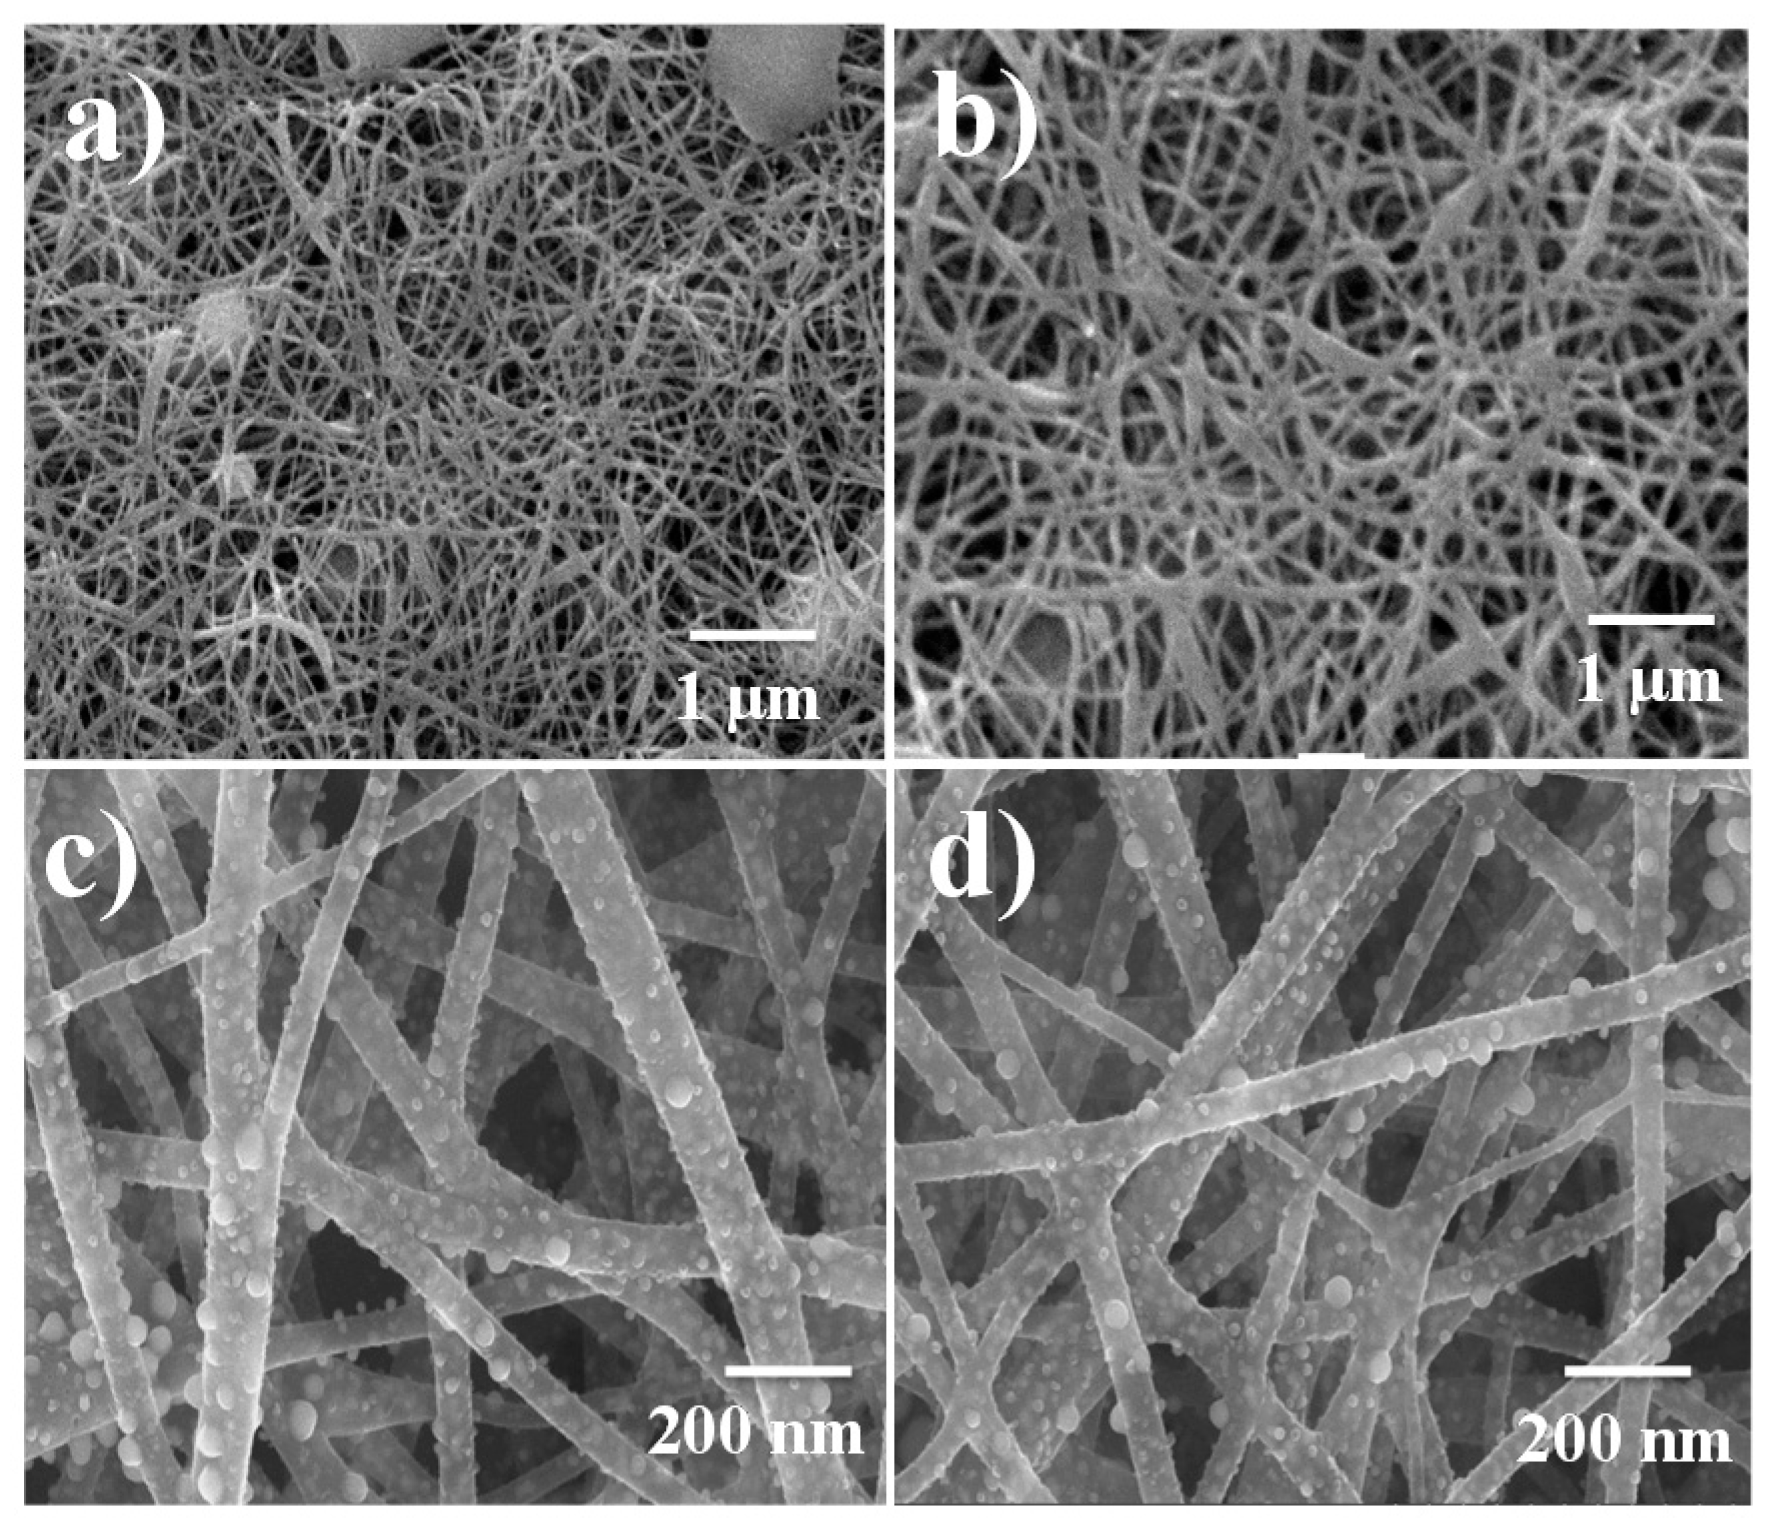
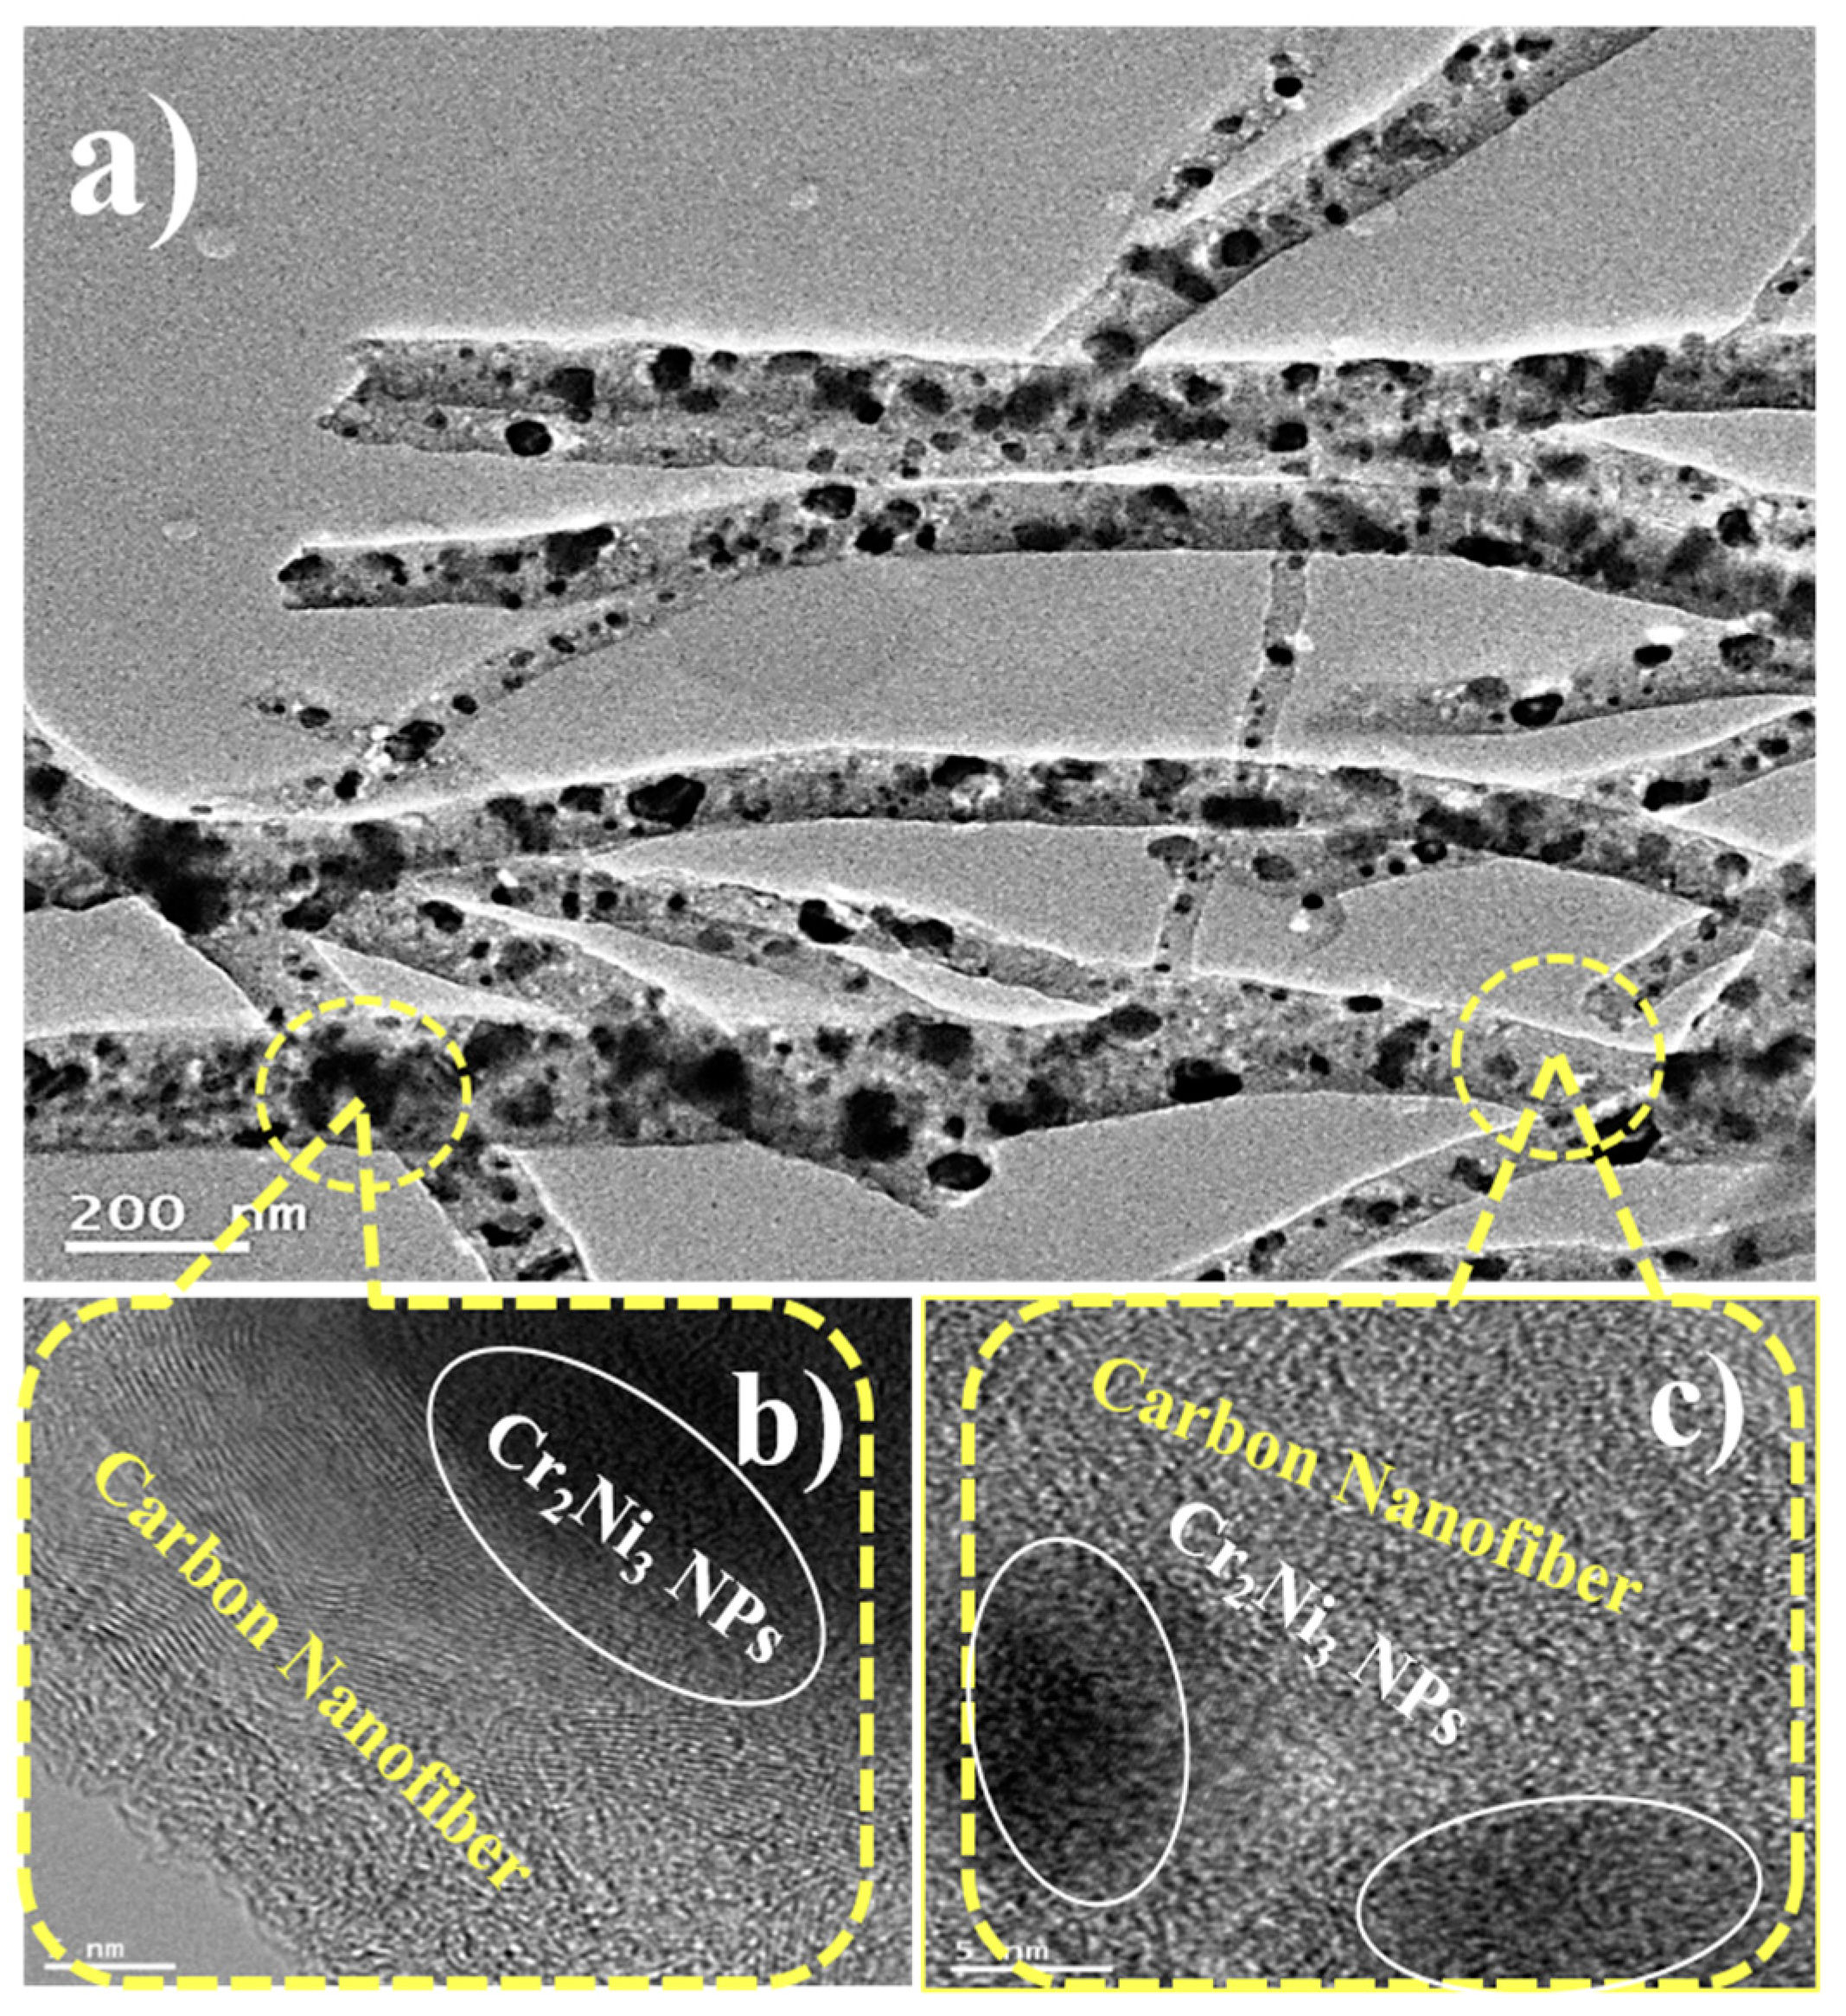
3.3. Internal Structure
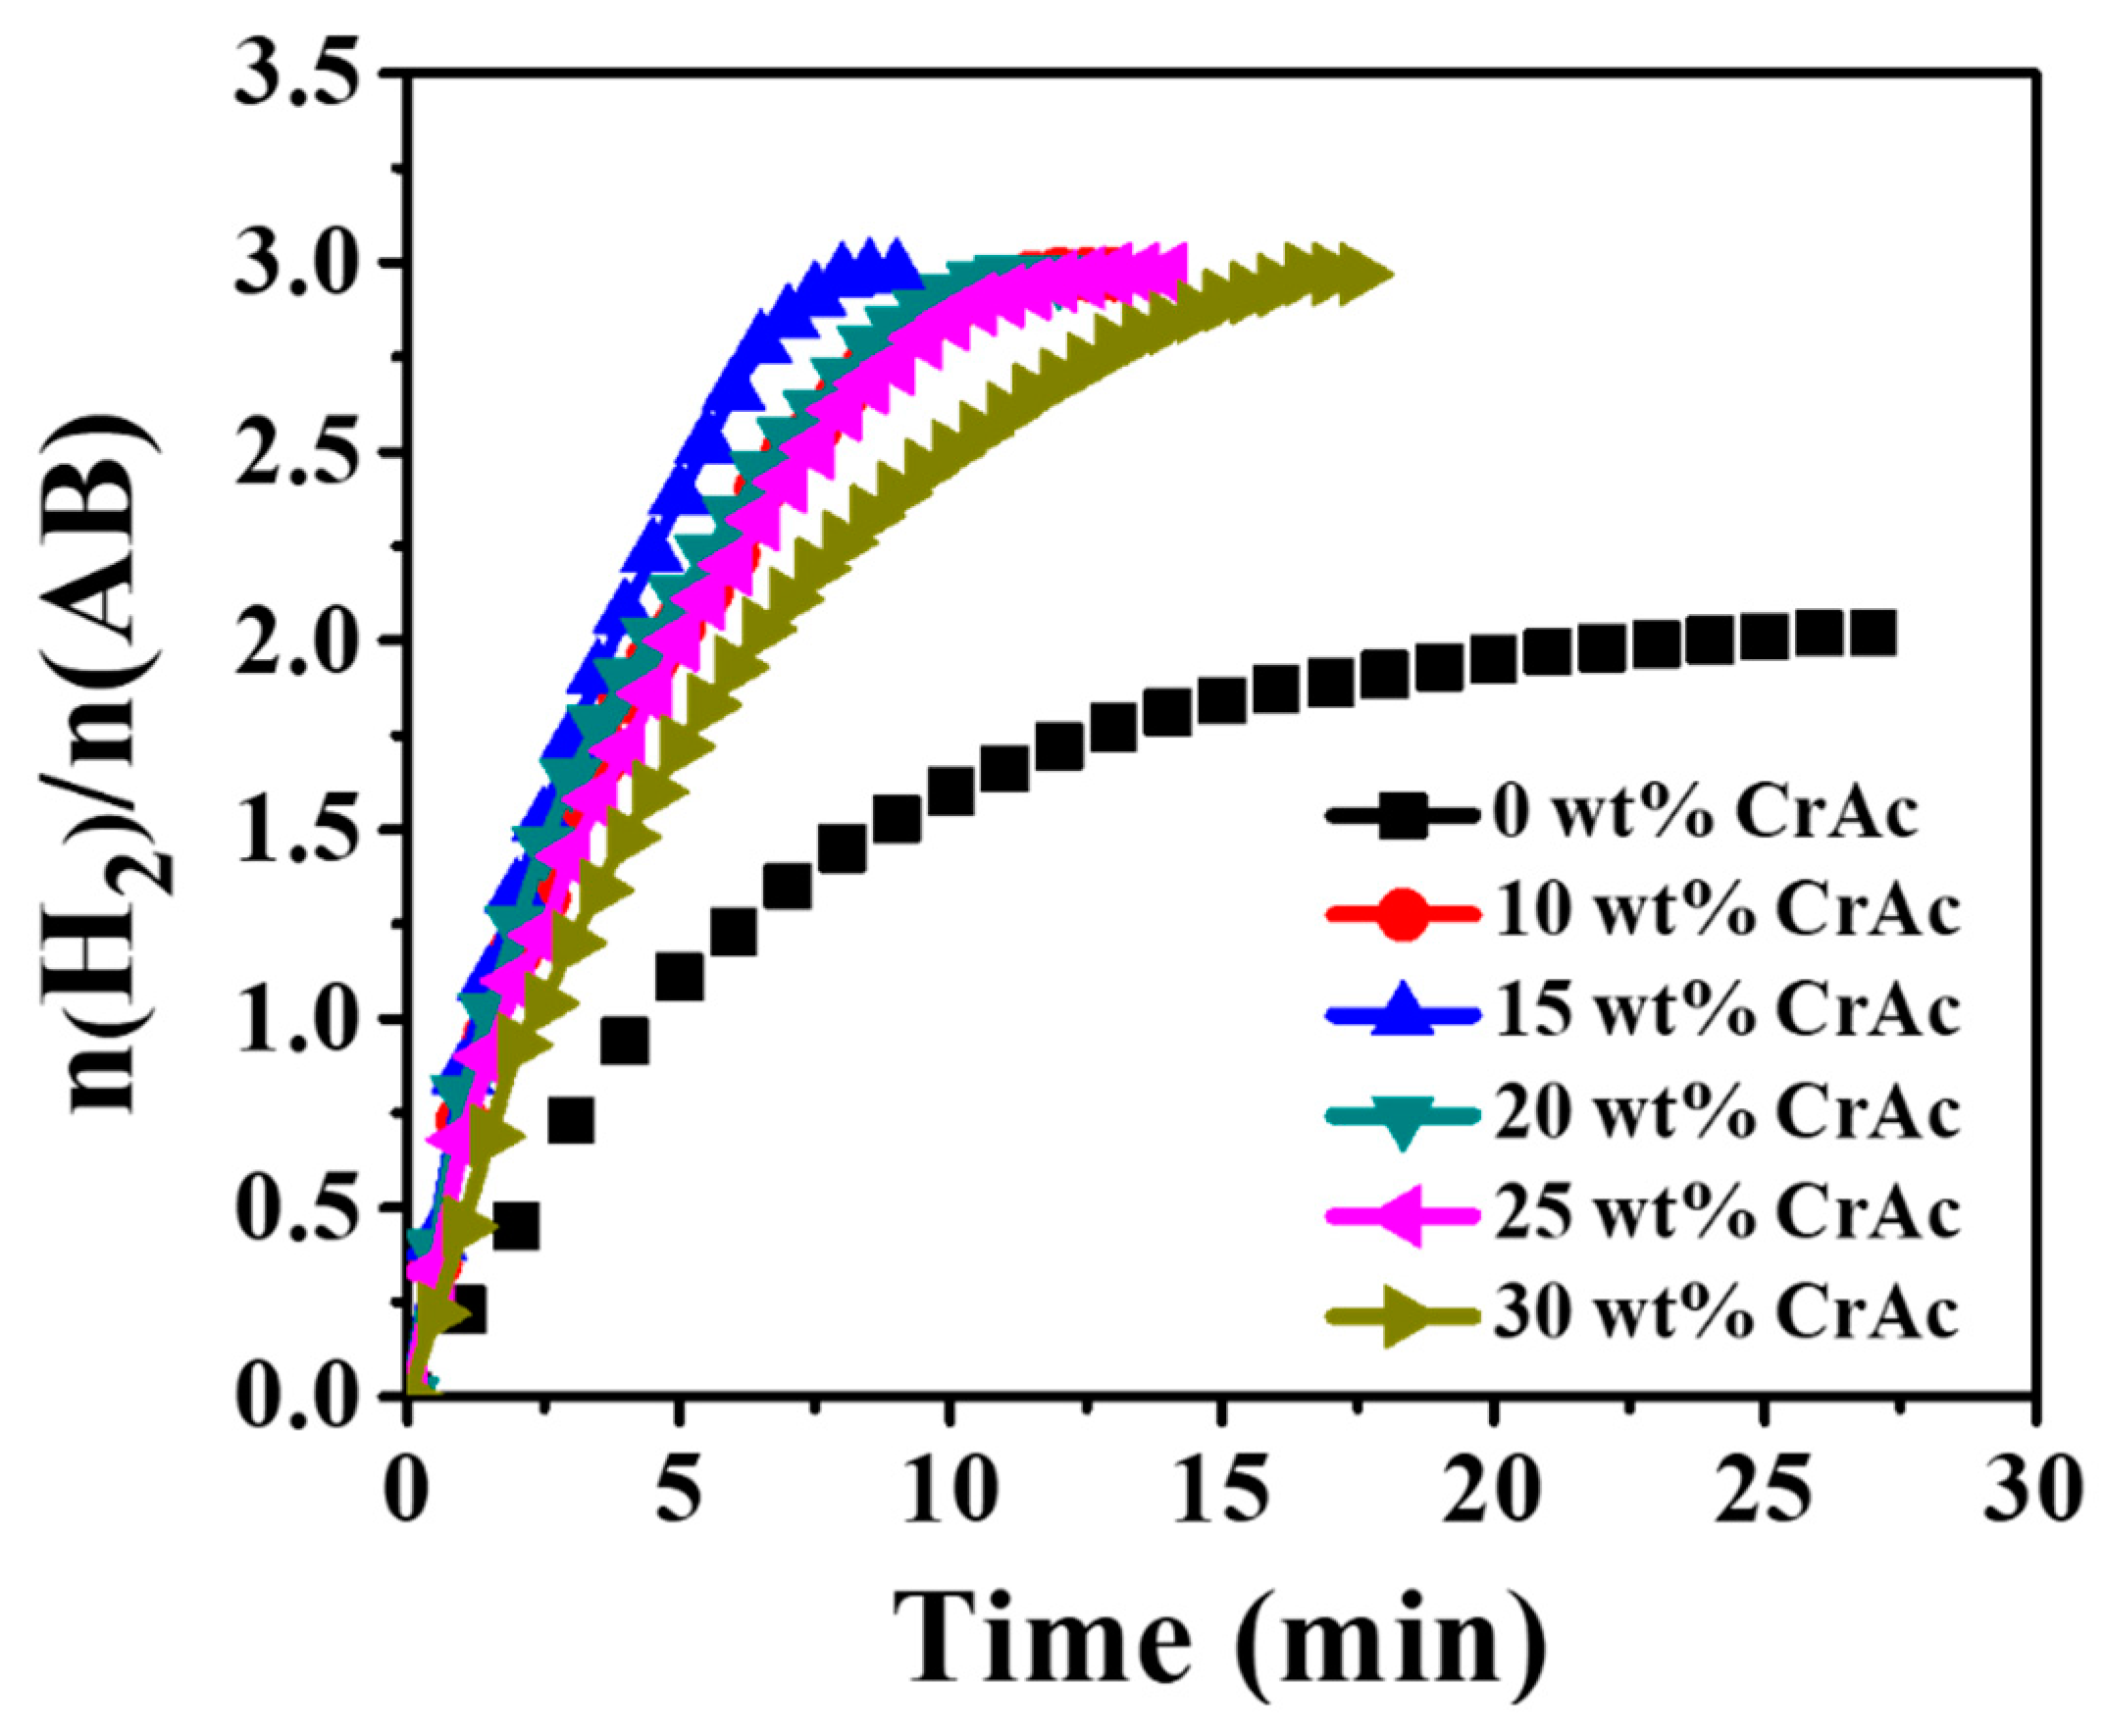
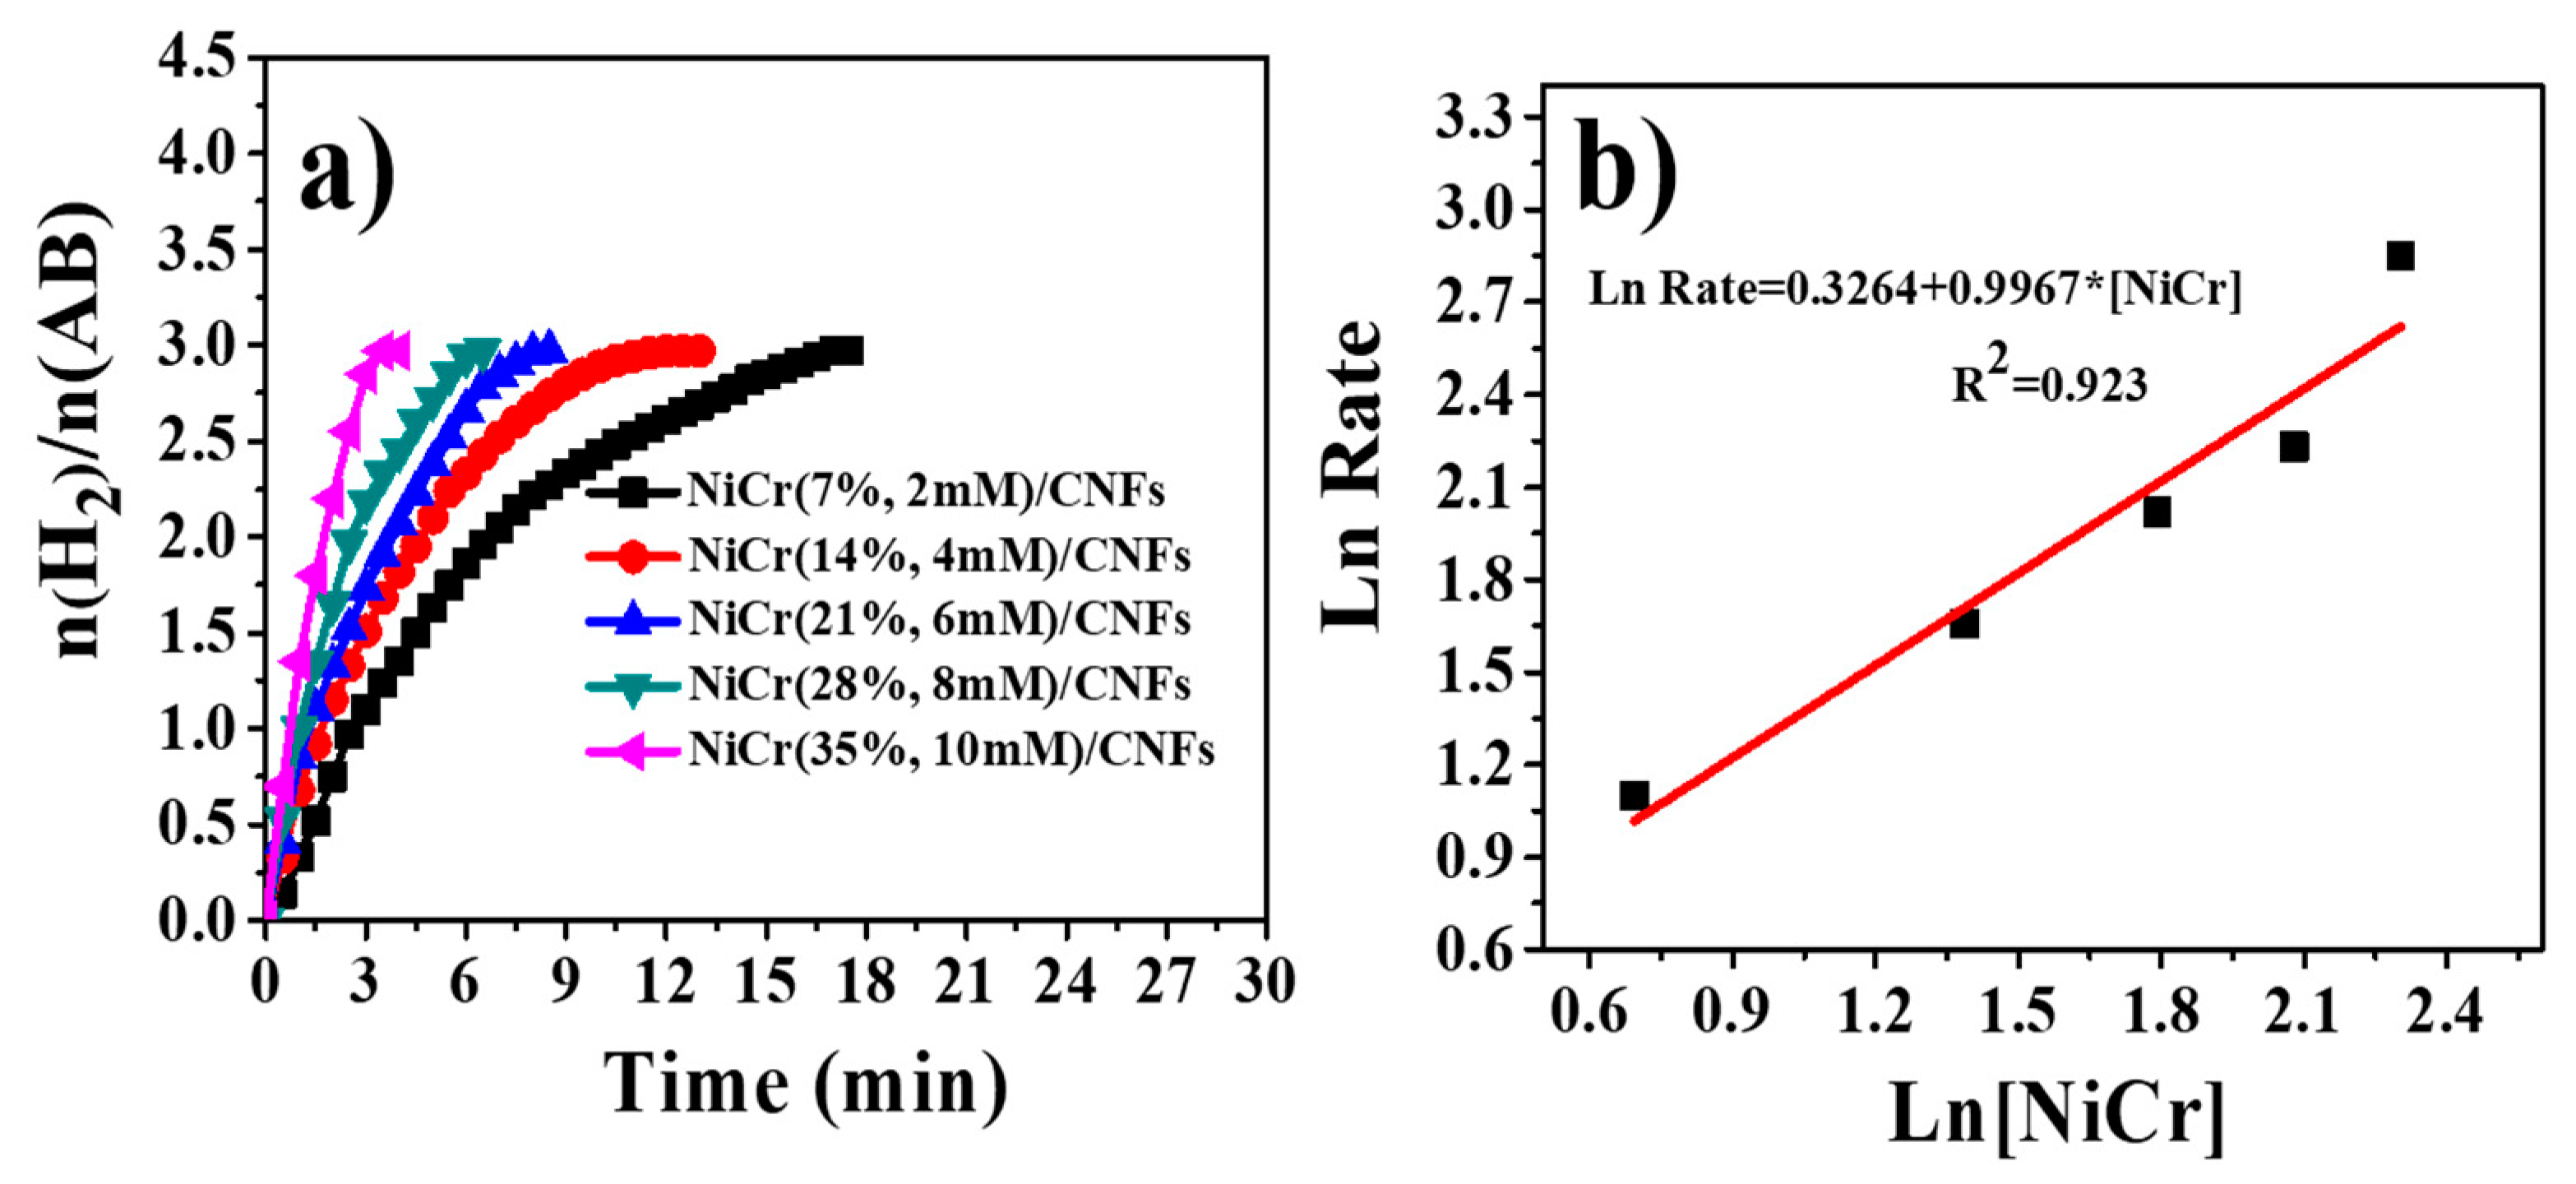
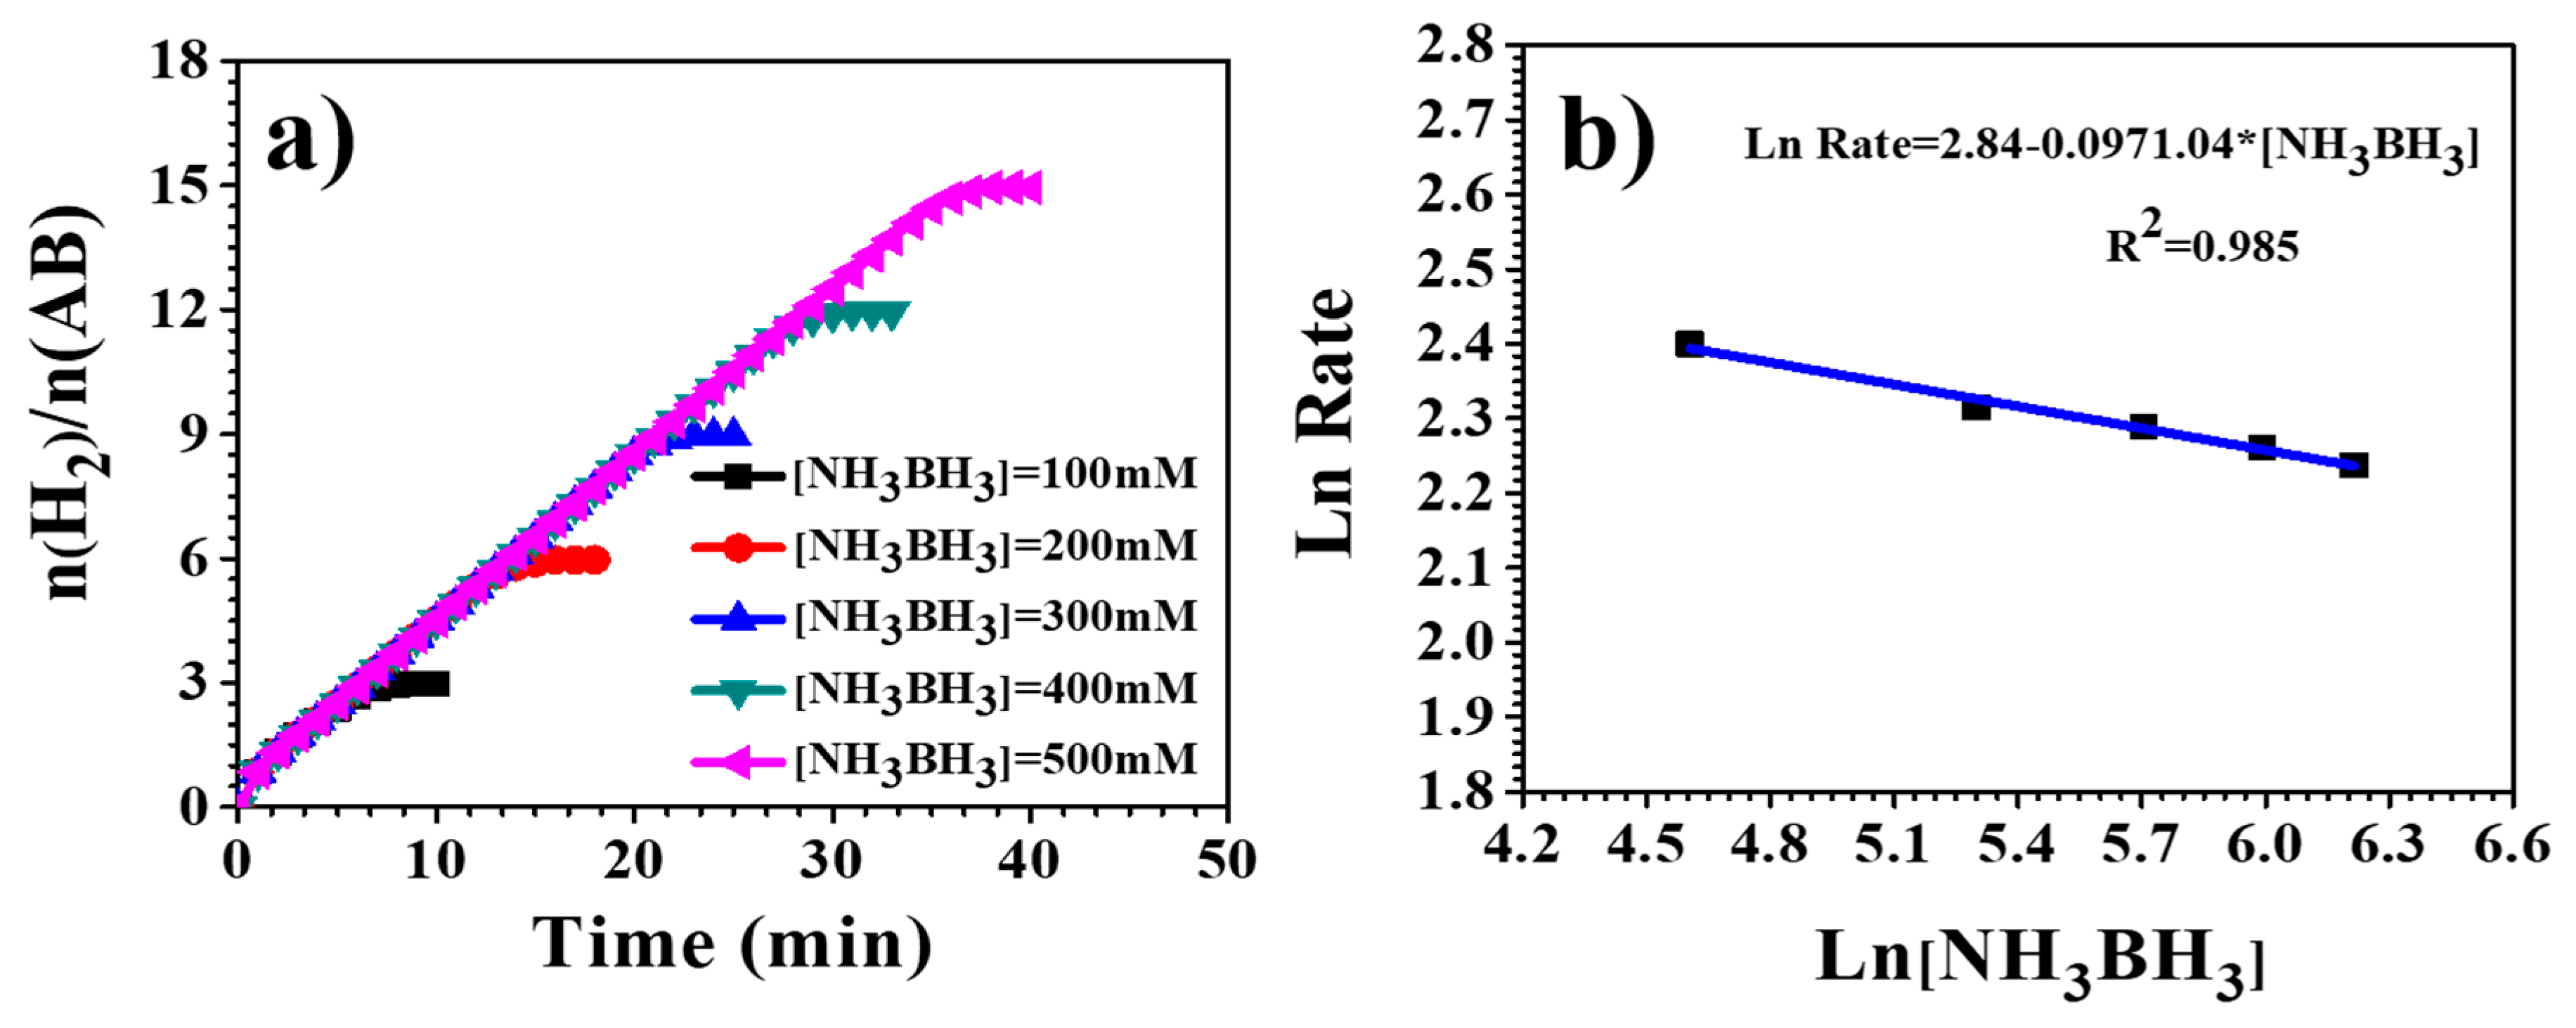
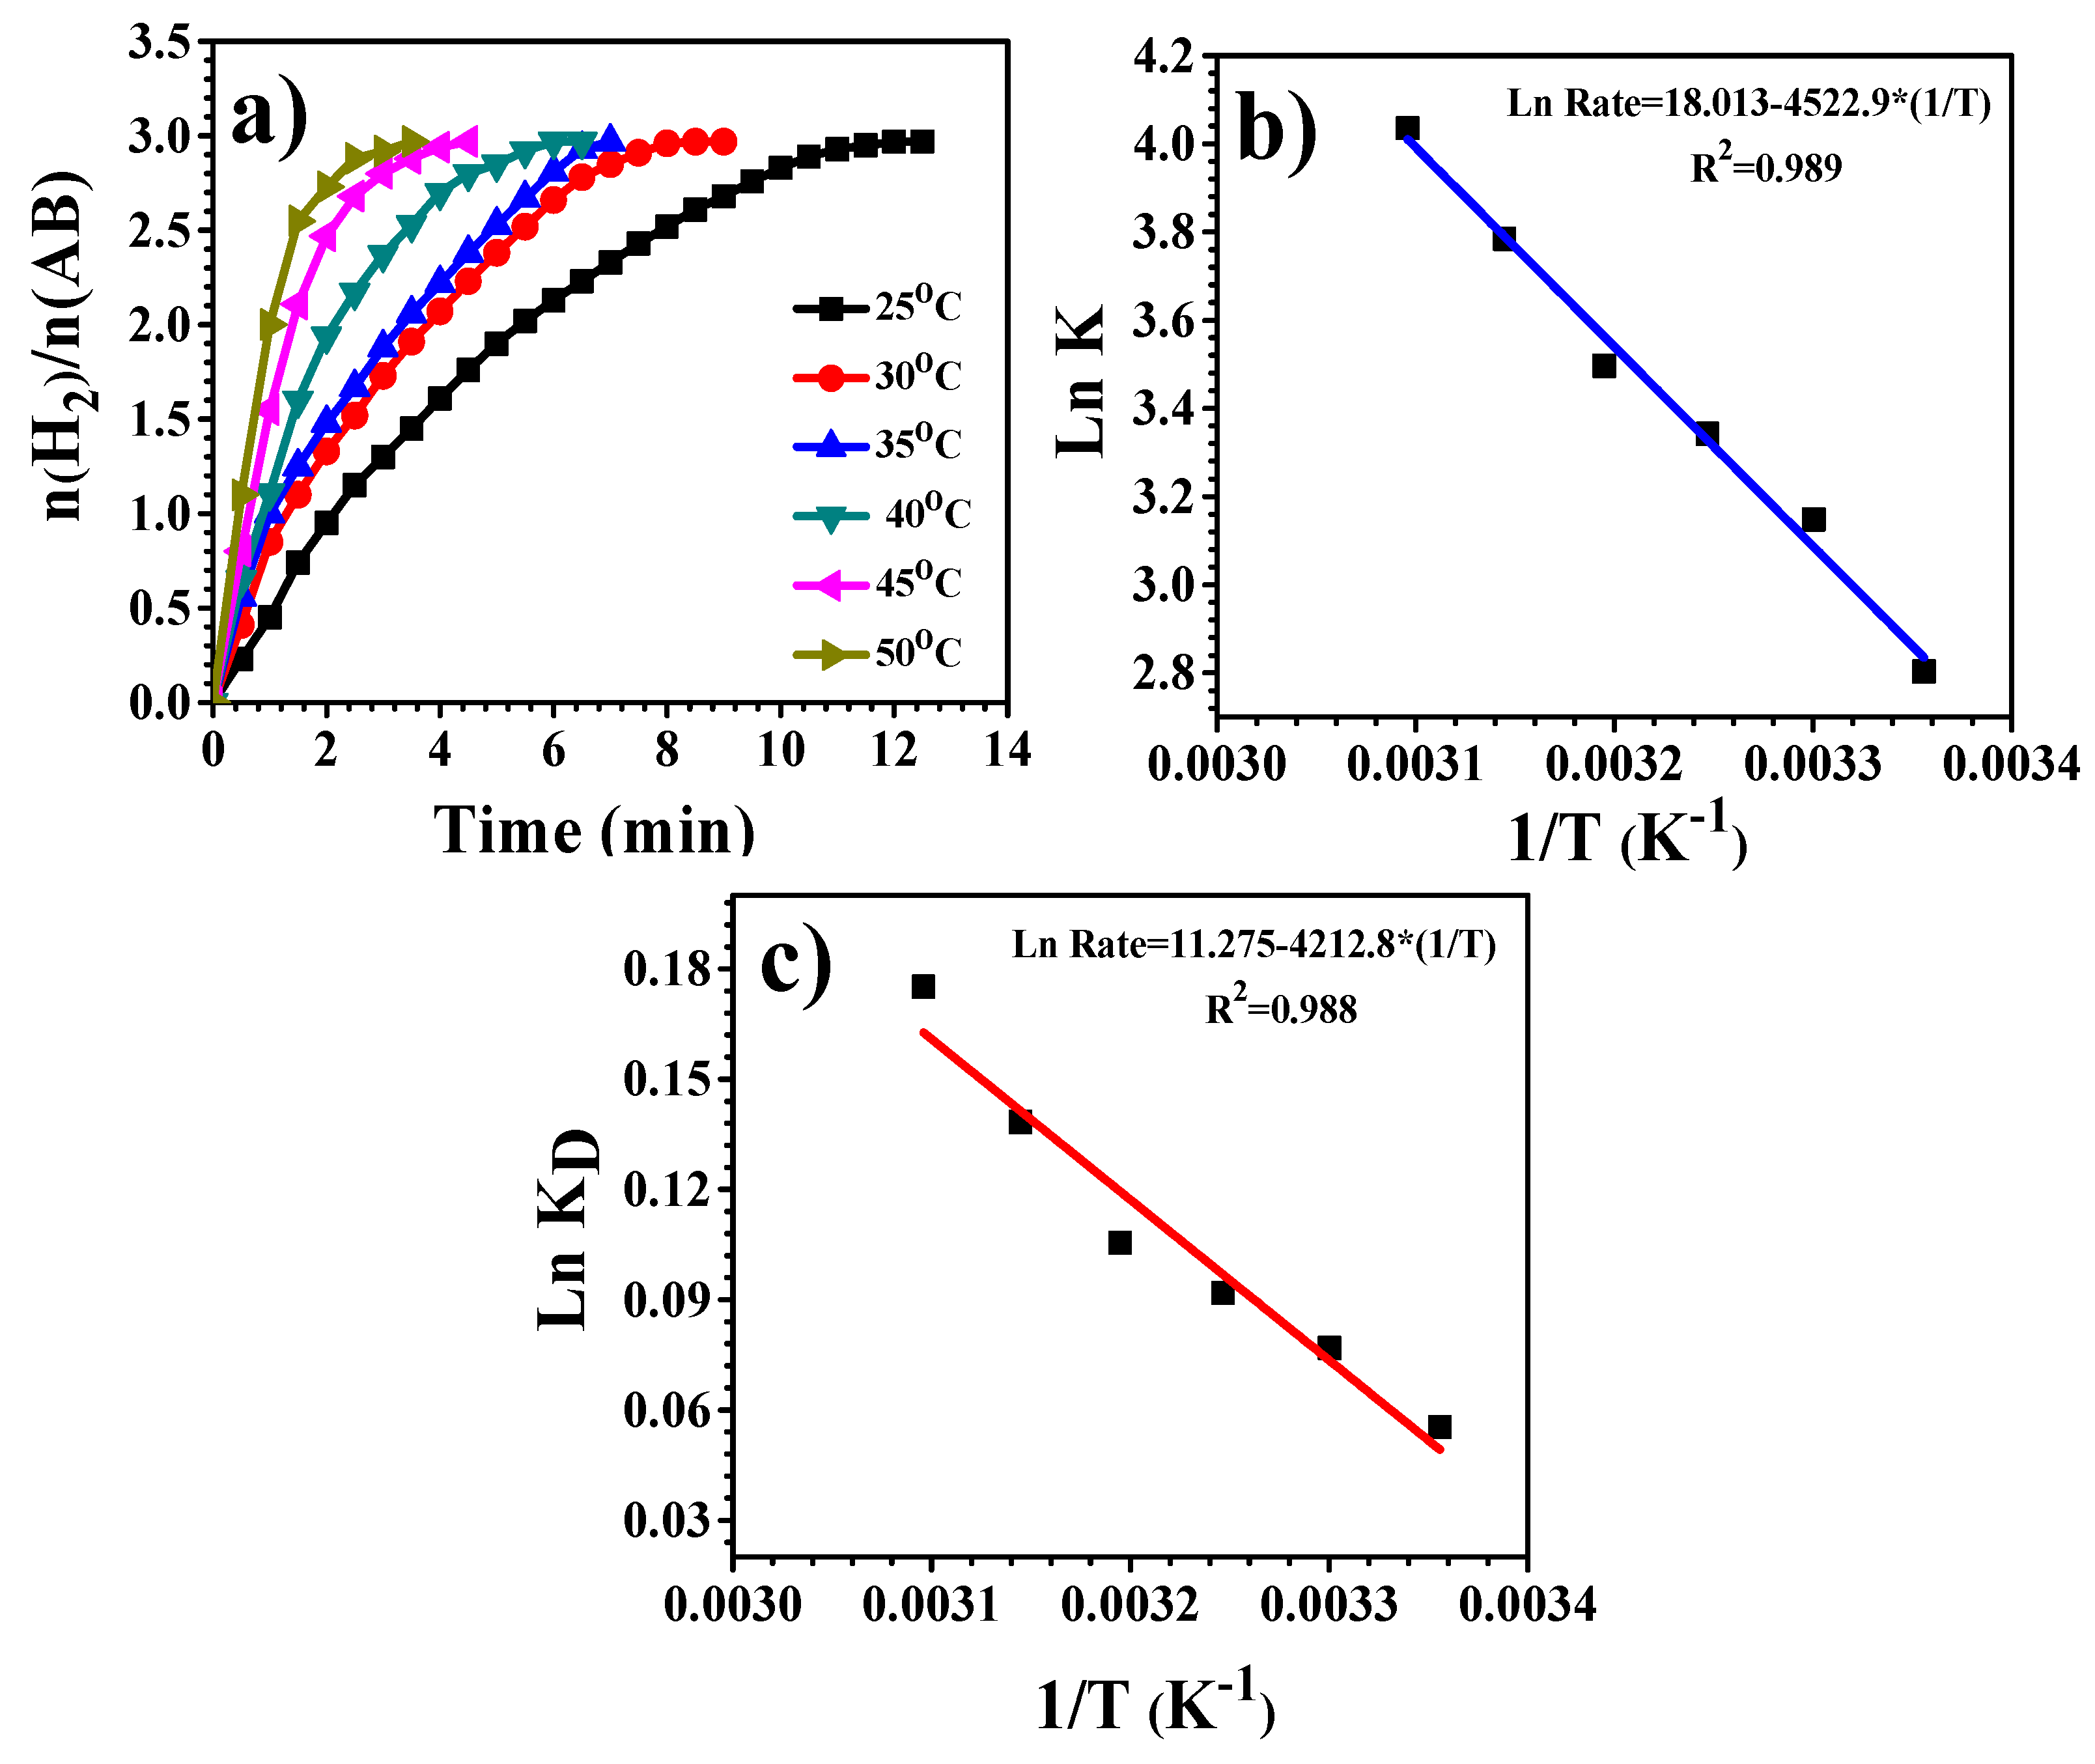
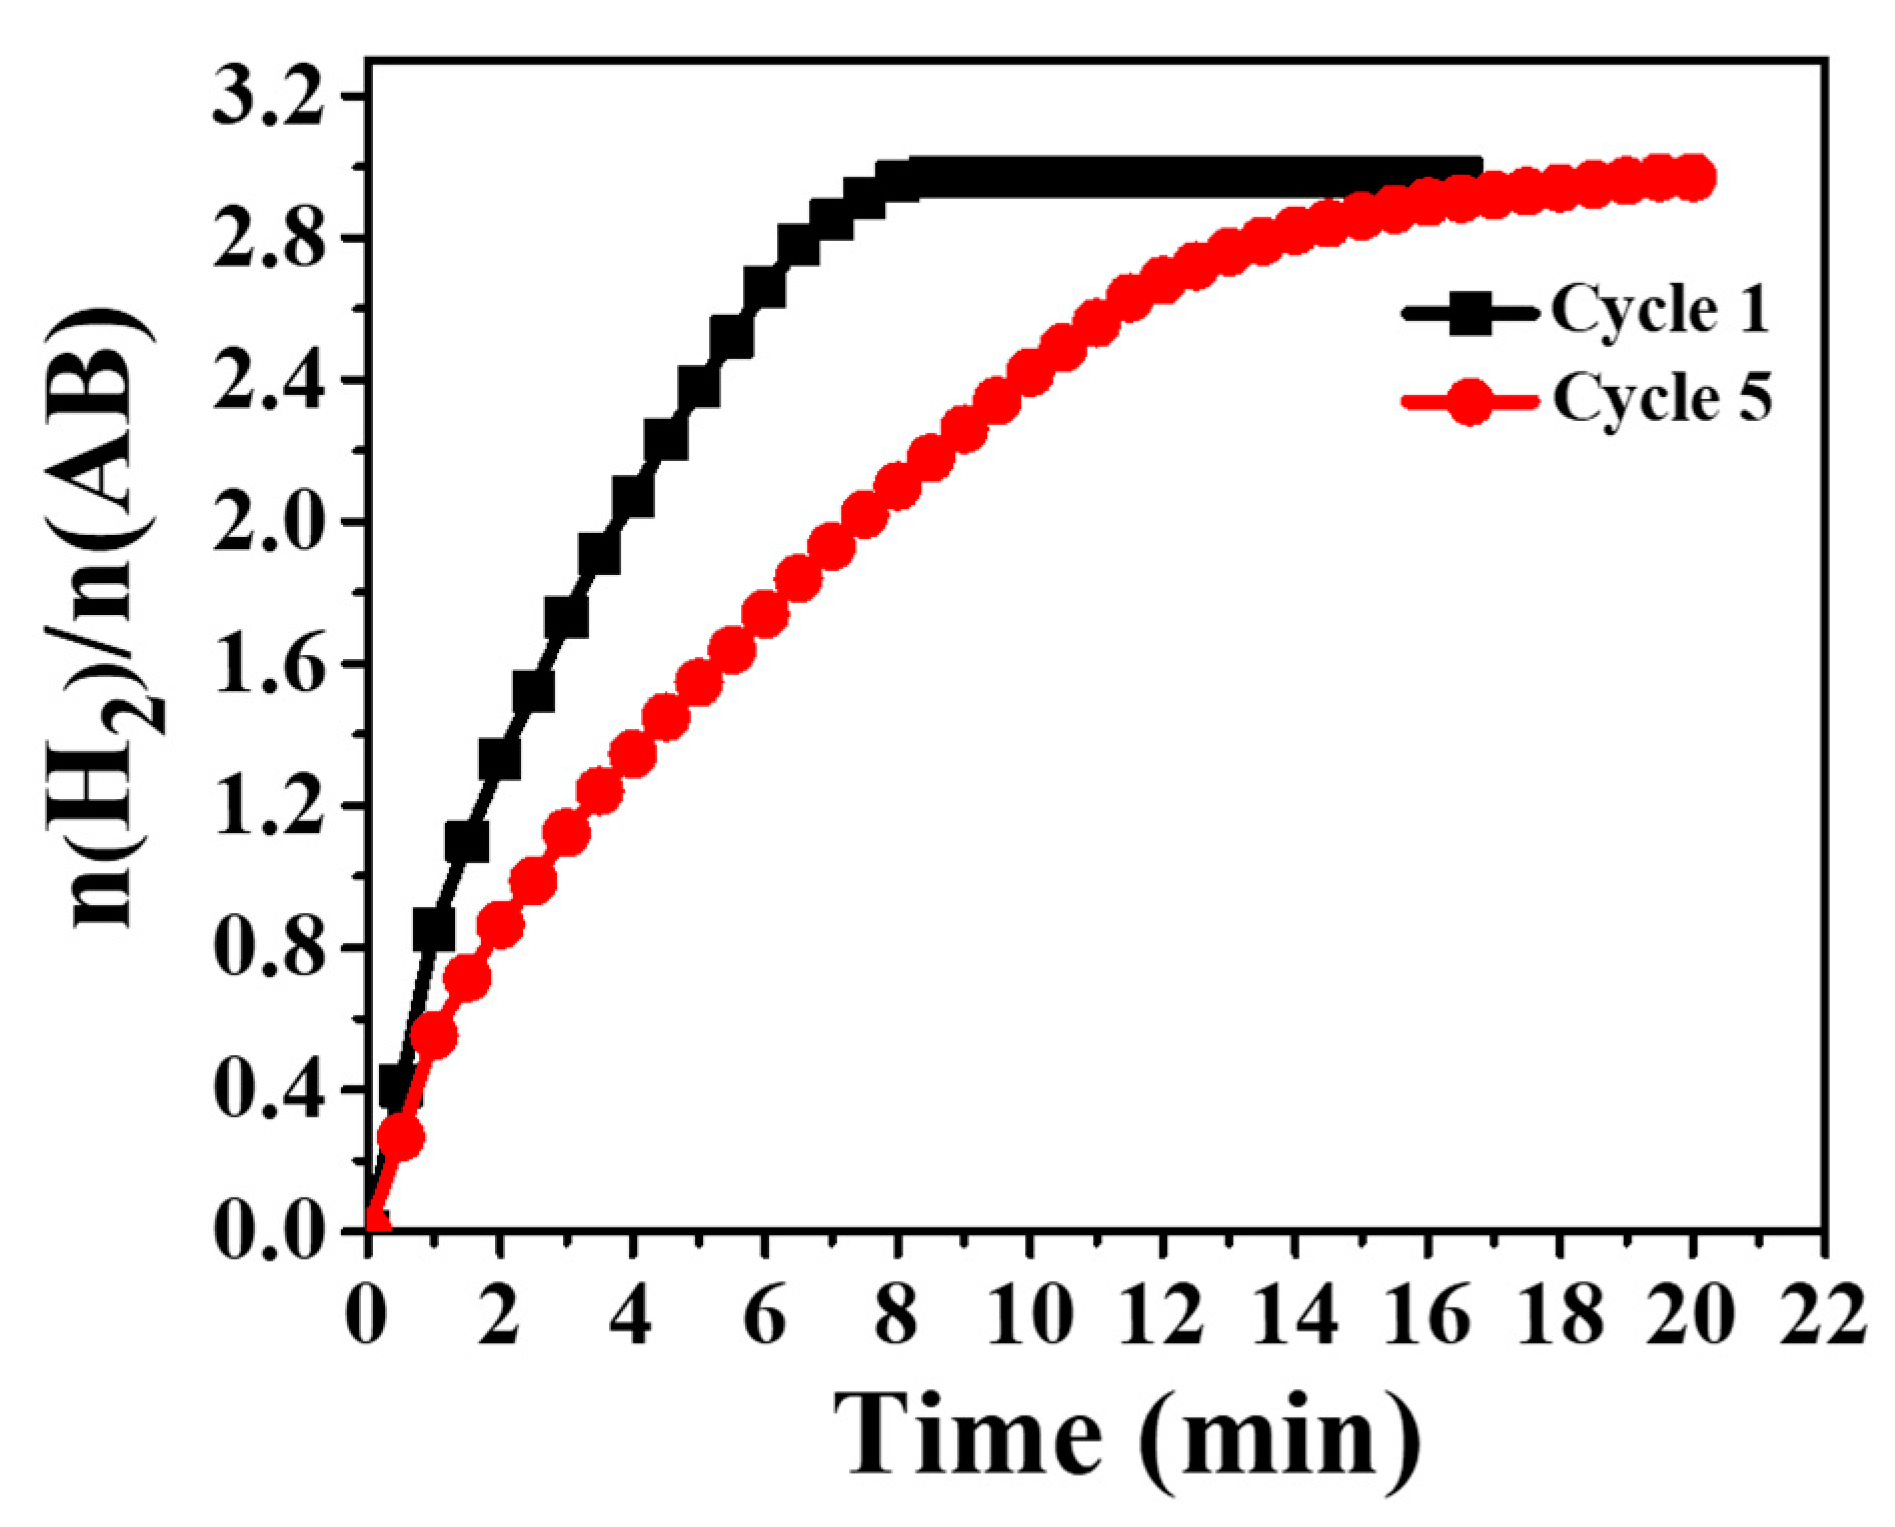
3.4. Hydrogen Release from Ammonia Borane Complex
4. Conclusions
Author Contributions
Acknowledgments
Conflicts of Interest
References
- Demirci, U.B.; Miele, P. Sodium borohydride versus ammonia borane, in hydrogen storage and direct fuel cell applications. Energy Environ. Sci. 2009, 2, 627–637. [Google Scholar] [CrossRef]
- Barakat, N.A.; El-Newehy, M.H.; Yasin, A.S.; Ghouri, Z.K.; Al-Deyab, S.S. Ni&Mn nanoparticles-decorated carbon nanofibers as effective electrocatalyst for urea oxidation. Appl. Catal. A Gen. 2016, 510, 180–188. [Google Scholar]
- Barakat, N.A.; Motlak, M.; Elzatahry, A.A.; Khalil, K.A.; Abdelghani, E.A. Ni x Co 1−X alloy nanoparticle-doped carbon nanofibers as effective non-precious catalyst for ethanol oxidation. Int. J. Hydrogen Energy 2019, 39, 305–316. [Google Scholar] [CrossRef]
- Patel, N.; Miotello, A. Progress in Co–B related catalyst for hydrogen production by hydrolysis of boron-hydrides: A review and the perspectives to substitute noble metals. Int. J. Hydrogen Energy 2015, 40, 1429–1464. [Google Scholar] [CrossRef]
- Yang, X.; Cheng, F.; Liang, J.; Tao, Z.; Chen, J. PtxNi 1−X nanoparticles as catalysts for hydrogen generation from hydrolysis of ammonia borane. Int. J. Hydrogen Energy 2009, 34, 8785–8791. [Google Scholar] [CrossRef]
- Yao, C.; Zhuang, L.; Cao, Y.; Ai, X.; Yang, H. Hydrogen release from hydrolysis of borazane on Pt-and Ni-based alloy catalysts. Int. J. Hydrogen Energy 2008, 33, 2462–2467. [Google Scholar] [CrossRef]
- Yousef, A.; Brooks, R.M.; El-Halwany, M.; Obaid, M.; El-Newehy, M.H.; Al-Deyab, S.S.; Barakat, N.A. A novel and chemical stable Co–B nanoflakes-like structure supported over titanium dioxide nanofibers used as catalyst for hydrogen generation from ammonia borane complex. Int. J. Hydrogen Energy 2016, 41, 285–293. [Google Scholar] [CrossRef]
- Li, J.; Zhu, Q.L.; Xu, Q. Non-noble bimetallic CuCo nanoparticles encapsulated in the pores of metal–organic frameworks: Synergetic catalysis in the hydrolysis of ammonia borane for hydrogen generation. Catal. Sci. Technol. 2015, 5, 525–530. [Google Scholar] [CrossRef]
- Metin, Ö.; Özkar, S. Water soluble nickel(0) and cobalt(0) nanoclusters stabilized by poly(4-styrenesulfonic acid-co-maleic acid): Highly active, durable and cost effective catalysts in hydrogen generation from the hydrolysis of ammonia borane. Int. J. Hydrogen Energy 2011, 36, 1424–1432. [Google Scholar] [CrossRef]
- Wang, H.; Zhou, L.; Han, M.; Tao, Z.; Cheng, F.; Chen, J. CuCo nanoparticles supported on hierarchically porous carbon as catalysts for hydrolysis of ammonia borane. J. Alloys Compd. 2015, 651, 382–388. [Google Scholar] [CrossRef]
- Xu, Q.; Chandra, M. Catalytic activities of non-noble metals for hydrogen generation from aqueous ammonia–borane at room temperature. J. Power Sources 2006, 163, 364–370. [Google Scholar] [CrossRef]
- Yan, J.-M.; Zhang, X.-B.; Han, S.; Shioyama, H.; Xu, Q. Magnetically recyclable Fe–Ni alloy catalyzed dehydrogenation of ammonia borane in aqueous solution under ambient atmosphere. J. Power Sources 2009, 194, 478–481. [Google Scholar] [CrossRef]
- Yan, J.M.; Zhang, X.-B.; Shioyama, H.; Xu, Q. Room temperature hydrolytic dehydrogenation of ammonia borane catalyzed by Co nanoparticles. J. Power Sources 2010, 195, 1091–1094. [Google Scholar] [CrossRef]
- Yousef, A.; Barakat, N.A.; El-Newehy, M.H.; Ahmed, M.; Kim, H.Y. Catalytic hydrolysis of ammonia borane for hydrogen generation using Cu (0) nanoparticles supported on TiO2 nanofibers. Colloids Surf. A Physicochem. Eng. Asp. 2015, 470, 194–201. [Google Scholar] [CrossRef]
- Yousef, A.; Barakat, N.A.; Kim, H.Y. Electrospun Cu-doped titania nanofibers for photocatalytic hydrolysis of ammonia borane. Appl. Catal. A Gen. 2013, 467, 98–106. [Google Scholar] [CrossRef]
- Lai, Q.; Aguey-Zinsou, K.-F.; Demirci, U.B. Nanosizing ammonia borane with nickel–An all-solid and all-in-one approach for H 2 generation by hydrolysis. Int. J. Hydrogen Energy 2018, 43, 14498–14506. [Google Scholar] [CrossRef]
- Metin, O.; Mazumder, V.; Ozkar, S.; Sun, S. Monodisperse nickel nanoparticles and their catalysis in hydrolytic dehydrogenation of ammonia borane. J. Am. Chem. Soc. 2010, 132, 1468–1469. [Google Scholar] [CrossRef]
- Nirmala, R.; Kim, H.Y.; Yi, C.; Barakat, N.A.; Navamathavan, R.; El-Newehy, M. Electrospun nickel doped titanium dioxide nanofibers as an effective photocatalyst for the hydrolytic dehydrogenation of ammonia borane. Int. J. Hydrogen Energy 2012, 37, 10036–10045. [Google Scholar] [CrossRef]
- Umegaki, T.; Yan, J.M.; Zhang, X.-B.; Shioyama, H.; Kuriyama, N.; Xu, Q. Preparation and catalysis of poly (N-vinyl-2-pyrrolidone)(PVP) stabilized nickel catalyst for hydrolytic dehydrogenation of ammonia borane. Int. J. Hydrogen Energy 2009, 34, 3816–3822. [Google Scholar] [CrossRef]
- Yousef, A.; Barakat, N.A.; El-Newehy, M.; Kim, H.Y. Chemically stable electrospun NiCu nanorods@ carbon nanofibers for highly efficient dehydrogenation of ammonia borane. Int. J. Hydrogen Energy 2012, 37, 17715–17723. [Google Scholar] [CrossRef]
- Zahmakıran, M.; Ayvalı, T.; Akbayrak, S.; Çalışkan, S.; Çelik, D.; Özkar, S. Zeolite framework stabilized nickel (0) nanoparticles: Active and long-lived catalyst for hydrogen generation from the hydrolysis of ammonia-borane and sodium borohydride. Catal. Today 2011, 170, 76–84. [Google Scholar] [CrossRef]
- Du, X.; Yang, C.; Zeng, X.; Wu, T.; Zhou, Y.; Cai, P.; Cheng, G.; Luo, W. Amorphous NiP supported on rGO for superior hydrogen generation from hydrolysis of ammonia borane. Int. J. Hydrogen Energy 2017, 42, 14181–14187. [Google Scholar] [CrossRef]
- Lu, Z.H.; Li, J.; Feng, G.; Yao, Q.; Zhang, F.; Zhou, R.; Tao, D.; Chen, X.; Yu, Z. Synergistic catalysis of MCM-41 immobilized Cu–Ni nanoparticles in hydrolytic dehydrogeneration of ammonia borane. Int. J. Hydrogen Energy 2014, 39, 13389–13395. [Google Scholar] [CrossRef]
- Roy, B.; Manna, J.; Sharma, P. Effect of Ni-alloys on thermal decomposition of ammonia borane. J. Alloys Compd. 2015, 645, 234–238. [Google Scholar] [CrossRef]
- Wu, Y.; Wu, X.; Liu, Q.; Huang, C.; Qiu, X. Magnetically recyclable Ni@ h-BN composites for efficient hydrolysis of ammonia borane. Int. J. Hydrogen Energy 2017, 42, 16003–16011. [Google Scholar] [CrossRef]
- Jiang, H.L.; Umegaki, T.; Akita, T.; Zhang, X.B.; Haruta, M.; Xu, Q. Bimetallic Au–Ni nanoparticles embedded in SiO2 nanospheres: Synergetic catalysis in hydrolytic dehydrogenation of ammonia borane. Chem. A Eur. J. 2010, 16, 3132–3137. [Google Scholar] [CrossRef]
- Lai, S.W.; Lin, H.-L.; Lin, Y.P.; Yu, T.L. Hydrolysis of ammonia–borane catalyzed by an iron–nickel alloy on an SBA-15 support. Int. J. Hydrogen Energy 2013, 38, 4636–4647. [Google Scholar] [CrossRef]
- Li, P.Z.; Aranishi, K.; Xu, Q. ZIF-8 immobilized nickel nanoparticles: Highly effective catalysts for hydrogen generation from hydrolysis of ammonia borane. Chem. Commun. 2012, 48, 3173–3175. [Google Scholar] [CrossRef]
- Li, P.Z.; Aijaz, A.; Xu, Q. Highly Dispersed Surfactant-Free Nickel Nanoparticles and Their Remarkable Catalytic Activity in the Hydrolysis of Ammonia Borane for Hydrogen Generation. Angew. Chem. Int. Ed. 2012, 51, 6753–6756. [Google Scholar] [CrossRef]
- Metin, Ö.; Özkar, S.; Sun, S. Monodisperse nickel nanoparticles supported on SiO2 as an effective catalyst for the hydrolysis of ammonia-borane. Nano Res. 2010, 3, 676–684. [Google Scholar] [CrossRef]
- Ozay, O.; Inger, E.; Aktas, N.; Sahiner, N. Hydrogen production from ammonia borane via hydrogel template synthesized Cu, Ni, Co composites. Int. J. Hydrogen Energy 2011, 36, 8209–8216. [Google Scholar] [CrossRef]
- Umegaki, T.; Yan, J.M.; Zhang, X.B.; Shioyama, H.; Kuriyama, N.; Xu, Q. Hollow Ni–SiO2 nanosphere-catalyzed hydrolytic dehydrogenation of ammonia borane for chemical hydrogen storage. J. Power Sources 2009, 191, 209–216. [Google Scholar] [CrossRef]
- Zhou, L.; Zhang, T.; Tao, Z.; Chen, J. Ni nanoparticles supported on carbon as efficient catalysts for the hydrolysis of ammonia borane. Nano Res. 2014, 7, 774–781. [Google Scholar] [CrossRef]
- Cao, N.; Luo, W.; Cheng, G. One-step synthesis of graphene supported Ru nanoparticles as efficient catalysts for hydrolytic dehydrogenation of ammonia borane. Int. J. Hydrogen Energy 2013, 38, 11964–11972. [Google Scholar] [CrossRef]
- Cao, N.; Su, J.; Luo, W.; Cheng, G. Hydrolytic dehydrogenation of ammonia borane and methylamine borane catalyzed by graphene supported Ru@ Ni core–shell nanoparticles. Int. J. Hydrogen Energy 2014, 39, 426–435. [Google Scholar] [CrossRef]
- Yang, L.; Luo, W.; Cheng, G. Graphene-supported Ag-based core–shell nanoparticles for hydrogen generation in hydrolysis of ammonia borane and methylamine borane. ACS Appl. Mater. Interfaces 2013, 5, 8231–8240. [Google Scholar] [CrossRef]
- Zhang, J.; Chen, C.; Yan, W.; Duan, F.; Zhang, B.; Gao, Z.; Qin, Y. Ni nanoparticles supported on CNTs with excellent activity produced by atomic layer deposition for hydrogen generation from the hydrolysis of ammonia borane. Catal. Sci. Technol. 2016, 6, 2112–2119. [Google Scholar] [CrossRef]
- Huang, C.; Chen, C.; Ye, X.; Ye, W.; Hu, J.; Xu, C.; Qiu, X. Stable colloidal boron nitride nanosheet dispersion and its potential application in catalysis. J. Mater. Chem. A 2013, 1, 12192–12197. [Google Scholar] [CrossRef]
- Yang, K.; Yao, Q.; Huang, W.; Chen, X.; Lu, Z.H. Enhanced catalytic activity of NiM (M= Cr, Mo, W) nanoparticles for hydrogen evolution from ammonia borane and hydrazine borane. Int. J. Hydrogen Energy 2017, 42, 6840–6850. [Google Scholar] [CrossRef]
- Li, H.; Li, H.; Wang, M. Glucose hydrogenation over promoted Co–B amorphous alloy catalysts. Appl. Catal. A Gen. 2001, 207, 129–137. [Google Scholar] [CrossRef]
- Patel, N.; Fernandes, R.; Miotello, A. Promoting effect of transition metal-doped Co–B alloy catalysts for hydrogen production by hydrolysis of alkaline NaBH4 solution. J. Catal. 2010, 271, 315–324. [Google Scholar] [CrossRef]
- Chen, L.F.; Chen, Y.W. Effect of additive (W, Mo, and Ru) on Ni−B Amorphous alloy catalyst in hydrogenation of p-chloronitrobenzene. Ind. Eng. Chem. Res. 2006, 45, 8866–8873. [Google Scholar] [CrossRef]
- Barakat, N.A. Catalytic and photo hydrolysis of ammonia borane complex using Pd-doped Co nanofibers. Appl. Catal. A Gen. 2013, 451, 21–27. [Google Scholar] [CrossRef]
- Mohamed, I.M.; Motlak, M.; Fouad, H.; Barakat, N.A. Cobalt/Chromium Nanoparticles-Incorporated Carbon Nanofibers as Effective Nonprecious Catalyst for Methanol Electrooxidation in Alkaline Medium. Nano 2016, 11, 1650049. [Google Scholar] [CrossRef]
- Yousef, A.; Brooks, R.M.; El-Newehy, M.H.; Al-Deyab, S.S.; Kim, H.Y. Electrospun Co-TiC nanoparticles embedded on carbon nanofibers: Active and chemically stable counter electrode for methanol fuel cells and dye-sensitized solar cells. Int. J. Hydrogen Energy 2017, 42, 10407–10415. [Google Scholar] [CrossRef]
- Yousef, A.; Akhtar, M.S.; Barakat, N.A.M.; Motlak, M.; Yang, O.B.; Kim, H.Y. Effective NiCu NPs-doped carbon nanofibers as counter electrodes for dye-sensitized solar cells. Electrochim. Acta 2013, 102, 142–148. [Google Scholar] [CrossRef]
- Guanglin, N.; Yiwang, B.; Detian, W.; Xiaogen, L. Effect of Atomization Gases on the Elastic Modulus of Thermal-sprayed NiCr Coatings. Rare Met. Mater. Eng. 2018, 47, 1025–1030. [Google Scholar] [CrossRef]
- Yousef, A.; Brooks, R.M.; Abdelkareem, M.A.; Khamaj, J.A.; El-Halwany, M.; Barakat, N.A.; L-Newehy, M.H.E.; Kim, H.Y. Electrospun NiCu Nanoalloy Decorated on Carbon Nanofibers as Chemical Stable Electrocatalyst for Methanol Oxidation. ECS Electrochem. Lett. 2015, 4, 51–55. [Google Scholar] [CrossRef]
- Yousef, A.; Brooks, R.M.; El-Halwany, M.M.; Abutaleb, A.; El-Newehy, M.H.; Al-Deyab, S.S.; Kim, H.Y. Electrospun CoCr7C3-supported C nanofibers: Effective, durable, and chemically stable catalyst for H2 gas generation from ammonia borane. Mol. Catal. 2017, 434, 32–38. [Google Scholar] [CrossRef]
- Feng, W.; Yang, L.; Cao, N.; Du, C.; Dai, H.; Luo, W.; Cheng, G. In situ facile synthesis of bimetallic CoNi catalyst supported on graphene for hydrolytic dehydrogenation of amine borane. Int. J. Hydrogen Energy 2014, 39, 3371–3380. [Google Scholar] [CrossRef]
- Wang, C.; Sun, D.; Yu, X.; Zhang, X.; Lu, Z.; Wang, X.; Zhao, J.; Li, L.; Yang, X. Cu/Ni nanoparticles supported on TiO2 (B) nanotubes as hydrogen generation photocatalysts via hydrolysis of ammonia borane. Inorg. Chem. Front. 2018, 5, 2038–2044. [Google Scholar] [CrossRef]
- Yang, X.; Li, L.; Sang, W.; Zhao, J.; Wang, X.; Yu, C.; Zhang, X.; Tang, C. Boron nitride supported Ni nanoparticles as catalysts for hydrogen generation from hydrolysis of ammonia boran. J. Alloys Compd. 2017, 693, 642–649. [Google Scholar] [CrossRef]
- Gao, D.; Zhang, Y.; Zhou, L.; Yang, K. CuNi NPs supported on MIL-101 as highly active catalysts for the hydrolysis of ammonia borane. Appl. Surf. Sci. 2018, 427, 114–122. [Google Scholar] [CrossRef]


| Catalyst | Ea (KJ/mol) | TOF (molH2. Molmetal−1. min−1) | References |
|---|---|---|---|
| Ni NPs | 41.5 | 8.8 | [17] |
| Ni/ZIF-8 | 41.5- | 14.2 | [28] |
| Fe–Ni alloy | 41.5- | 10.7 | [12] |
| CoNi/graphene | 13.49 | 16.4 | [50] |
| Cu0.64Ni0.36/TiO2 nanotubes | 36.14 | 15.9 | [51] |
| Ni/BN | 61.1 | 1.03 | [52] |
| NiP/rGO | 34.7 | 13.3 | [22] |
| CuNi–MIL–101 | 32.2 | 20.9 (Cu) | [53] |
| Cu0.2Ni0.8/MCM41 | 38 | 10.7 | [23] |
| CuNi@carbon | 28.9 | 0.2 | [20] |
| Cr2Ni3@carbon | 37.6 | 5.78 | This study |
© 2019 by the authors. Licensee MDPI, Basel, Switzerland. This article is an open access article distributed under the terms and conditions of the Creative Commons Attribution (CC BY) license (http://creativecommons.org/licenses/by/4.0/).
Share and Cite
M. Brooks, R.; Maafa, I.M.; M. Al-Enizi, A.; M. El-Halwany, M.; Ubaidullah, M.; Yousef, A. Electrospun Bimetallic NiCr Nanoparticles@Carbon Nanofibers as an Efficient Catalyst for Hydrogen Generation from Ammonia Borane. Nanomaterials 2019, 9, 1082. https://doi.org/10.3390/nano9081082
M. Brooks R, Maafa IM, M. Al-Enizi A, M. El-Halwany M, Ubaidullah M, Yousef A. Electrospun Bimetallic NiCr Nanoparticles@Carbon Nanofibers as an Efficient Catalyst for Hydrogen Generation from Ammonia Borane. Nanomaterials. 2019; 9(8):1082. https://doi.org/10.3390/nano9081082
Chicago/Turabian StyleM. Brooks, Robert, Ibrahim M. Maafa, Abdullah M. Al-Enizi, M. M. El-Halwany, Mohd Ubaidullah, and Ayman Yousef. 2019. "Electrospun Bimetallic NiCr Nanoparticles@Carbon Nanofibers as an Efficient Catalyst for Hydrogen Generation from Ammonia Borane" Nanomaterials 9, no. 8: 1082. https://doi.org/10.3390/nano9081082
APA StyleM. Brooks, R., Maafa, I. M., M. Al-Enizi, A., M. El-Halwany, M., Ubaidullah, M., & Yousef, A. (2019). Electrospun Bimetallic NiCr Nanoparticles@Carbon Nanofibers as an Efficient Catalyst for Hydrogen Generation from Ammonia Borane. Nanomaterials, 9(8), 1082. https://doi.org/10.3390/nano9081082