High-Temperature Core Flood Investigation of Nanocellulose as a Green Additive for Enhanced Oil Recovery

 ,
,  , , , and
Abstract
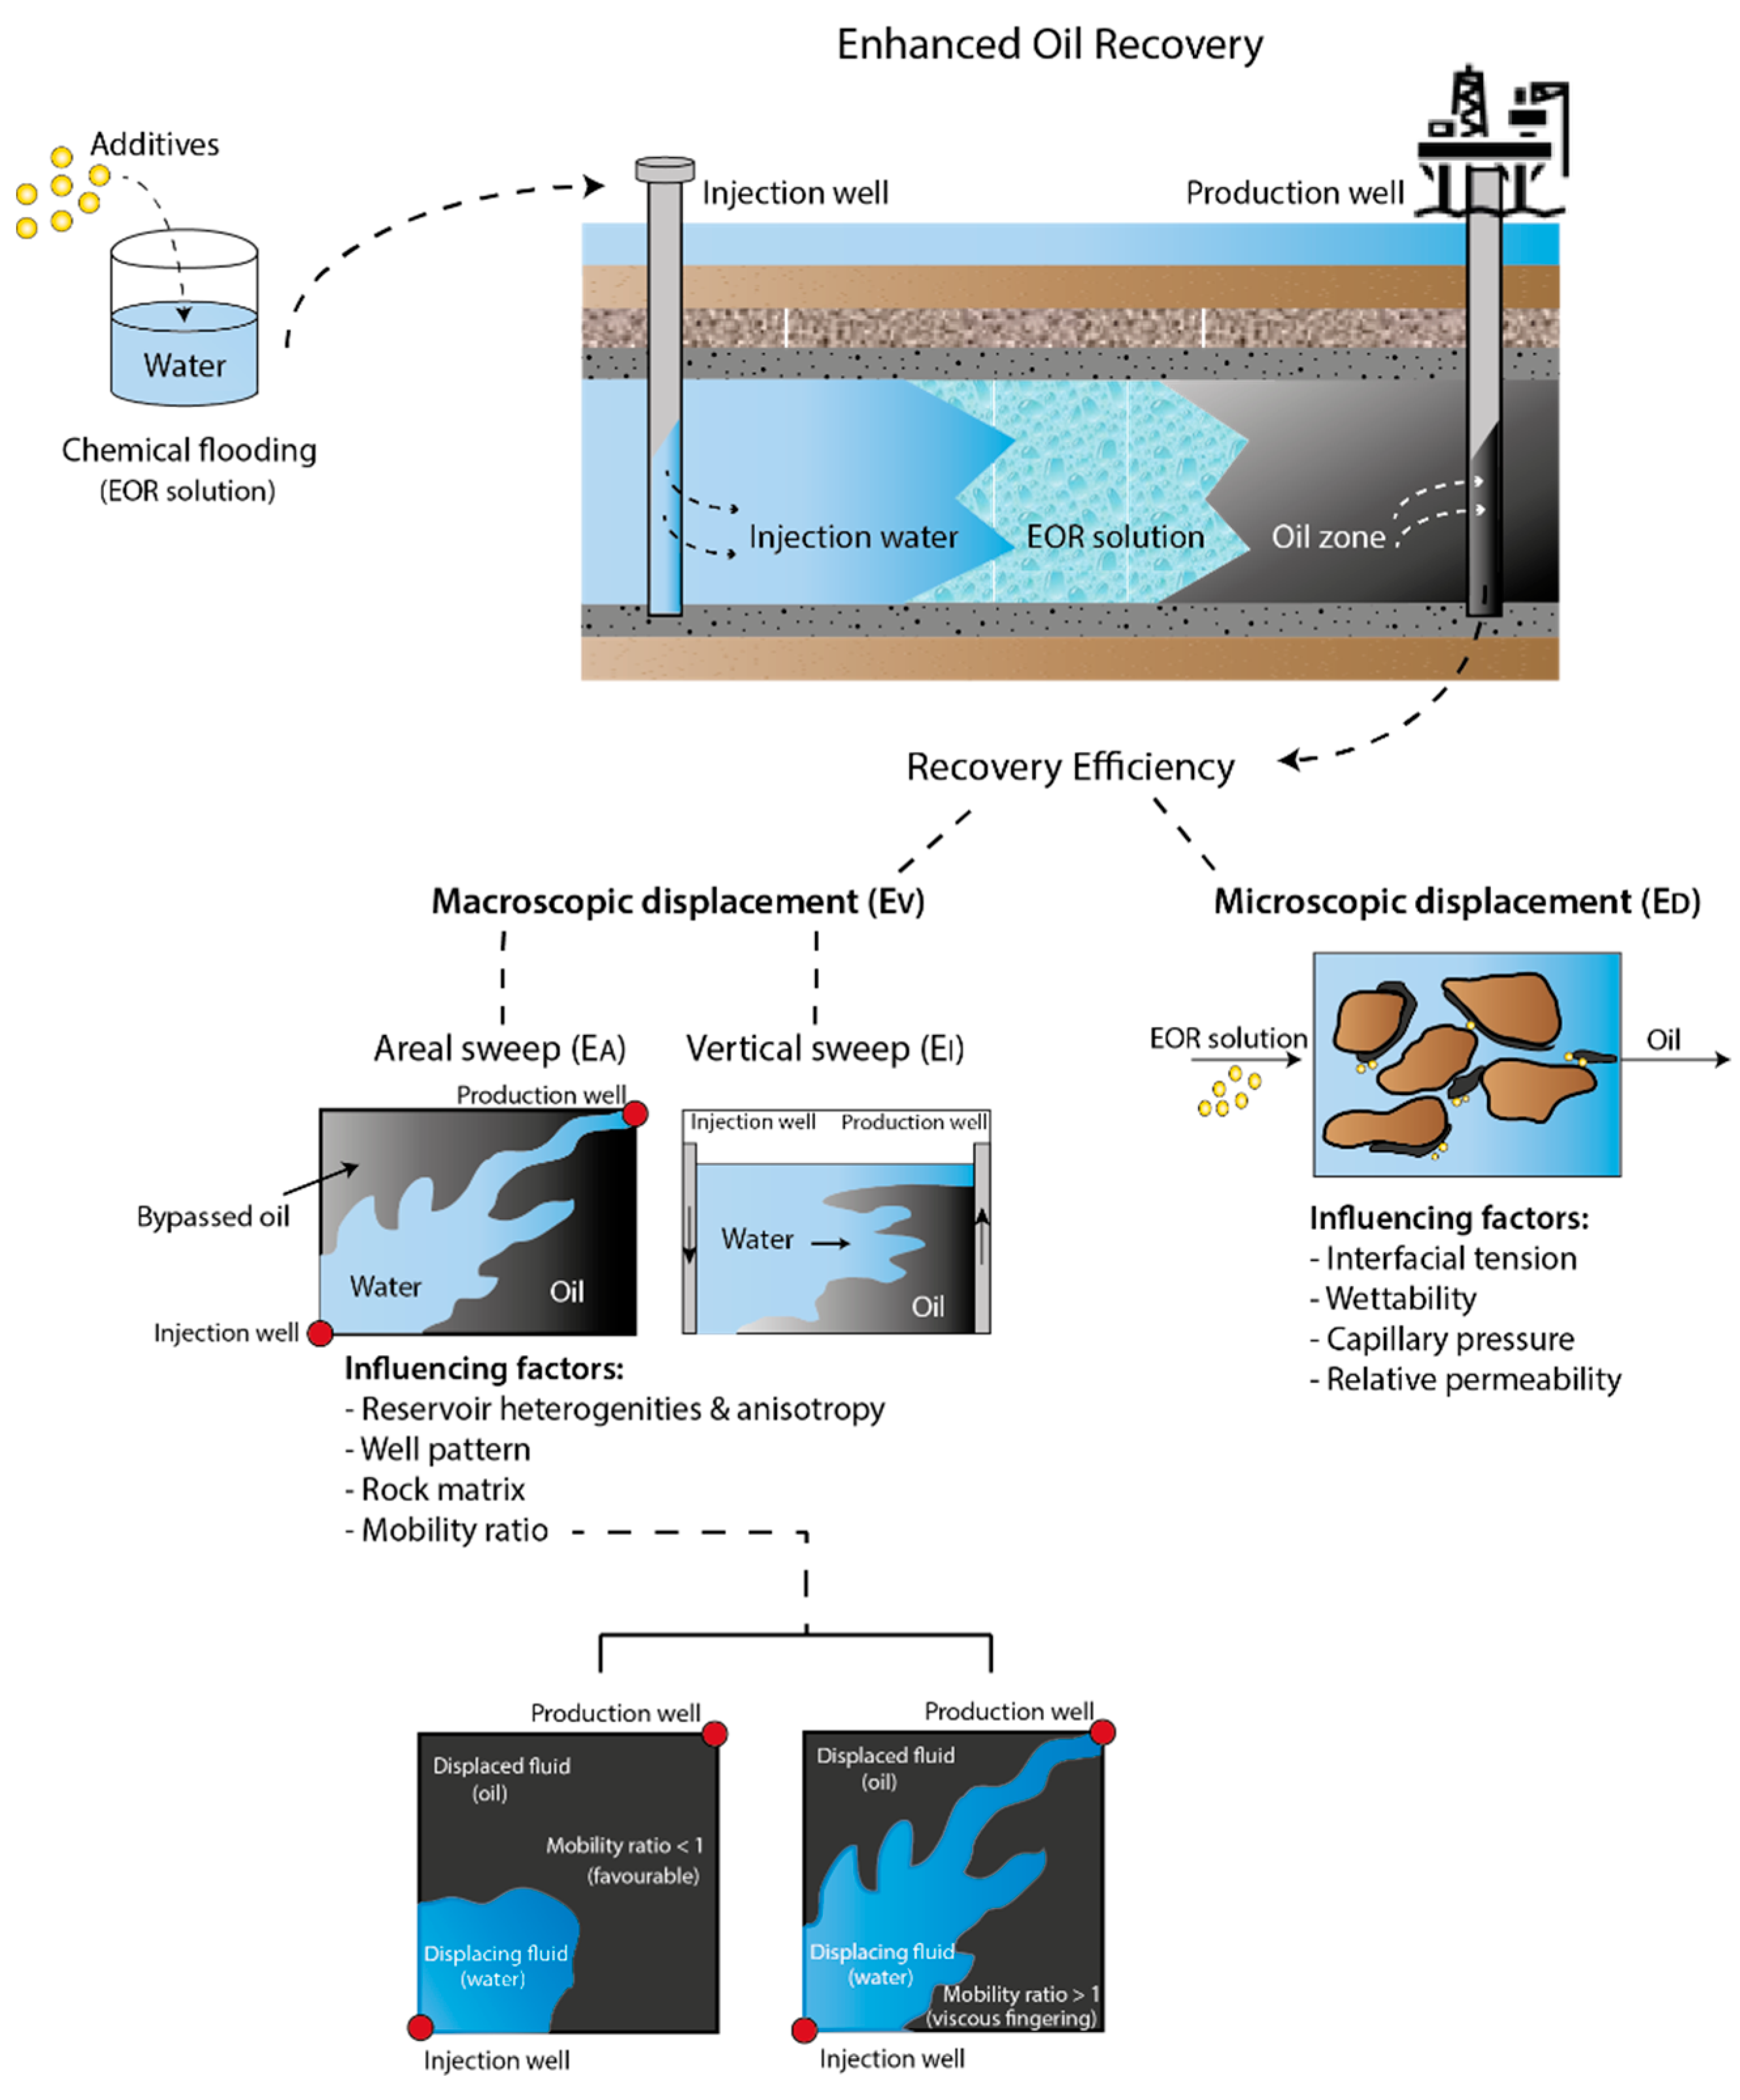
:1. Introduction
2. Materials
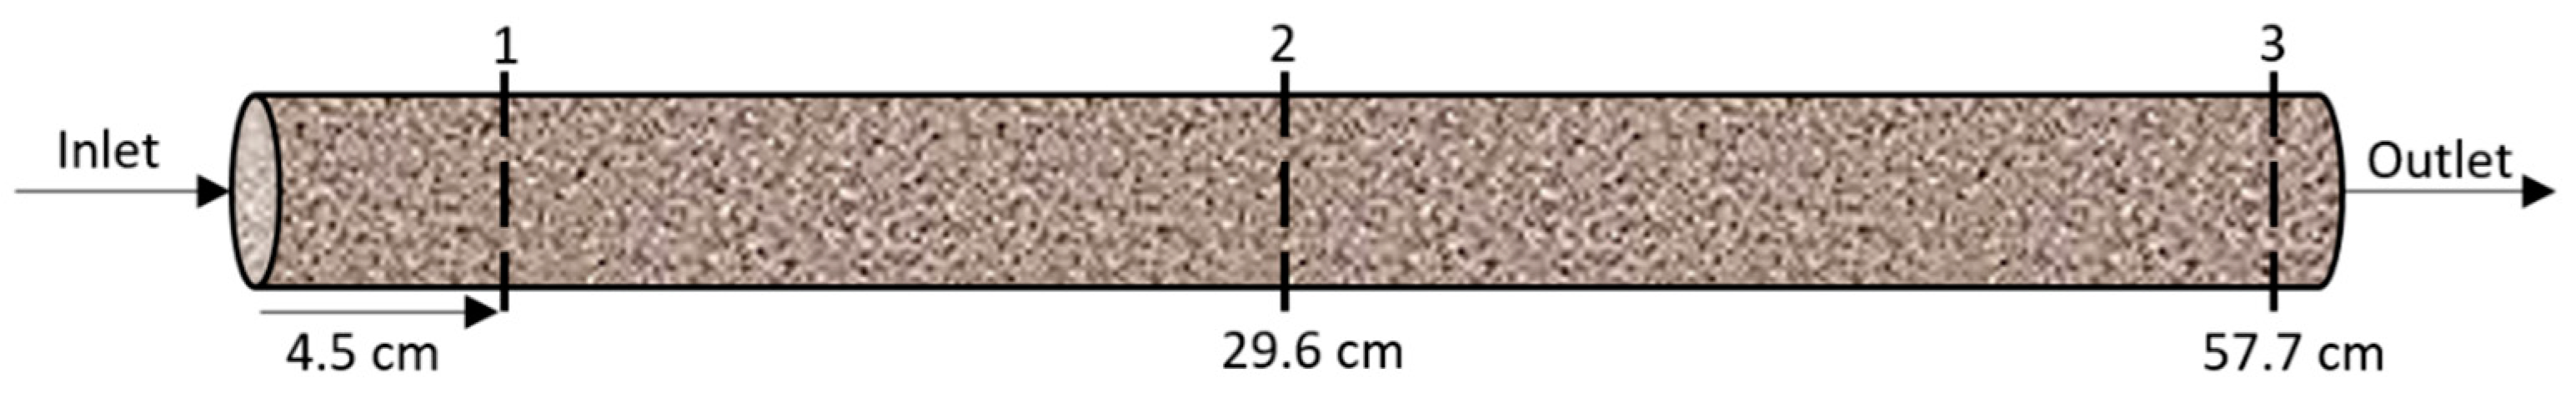
2.1. Porous Media
2.2. Brine
2.3. Oil
2.4. Cellulose Nanocrystals
3. Experimental Methods
3.1. Characterization of Cellulose Nanocrystals (CNC)
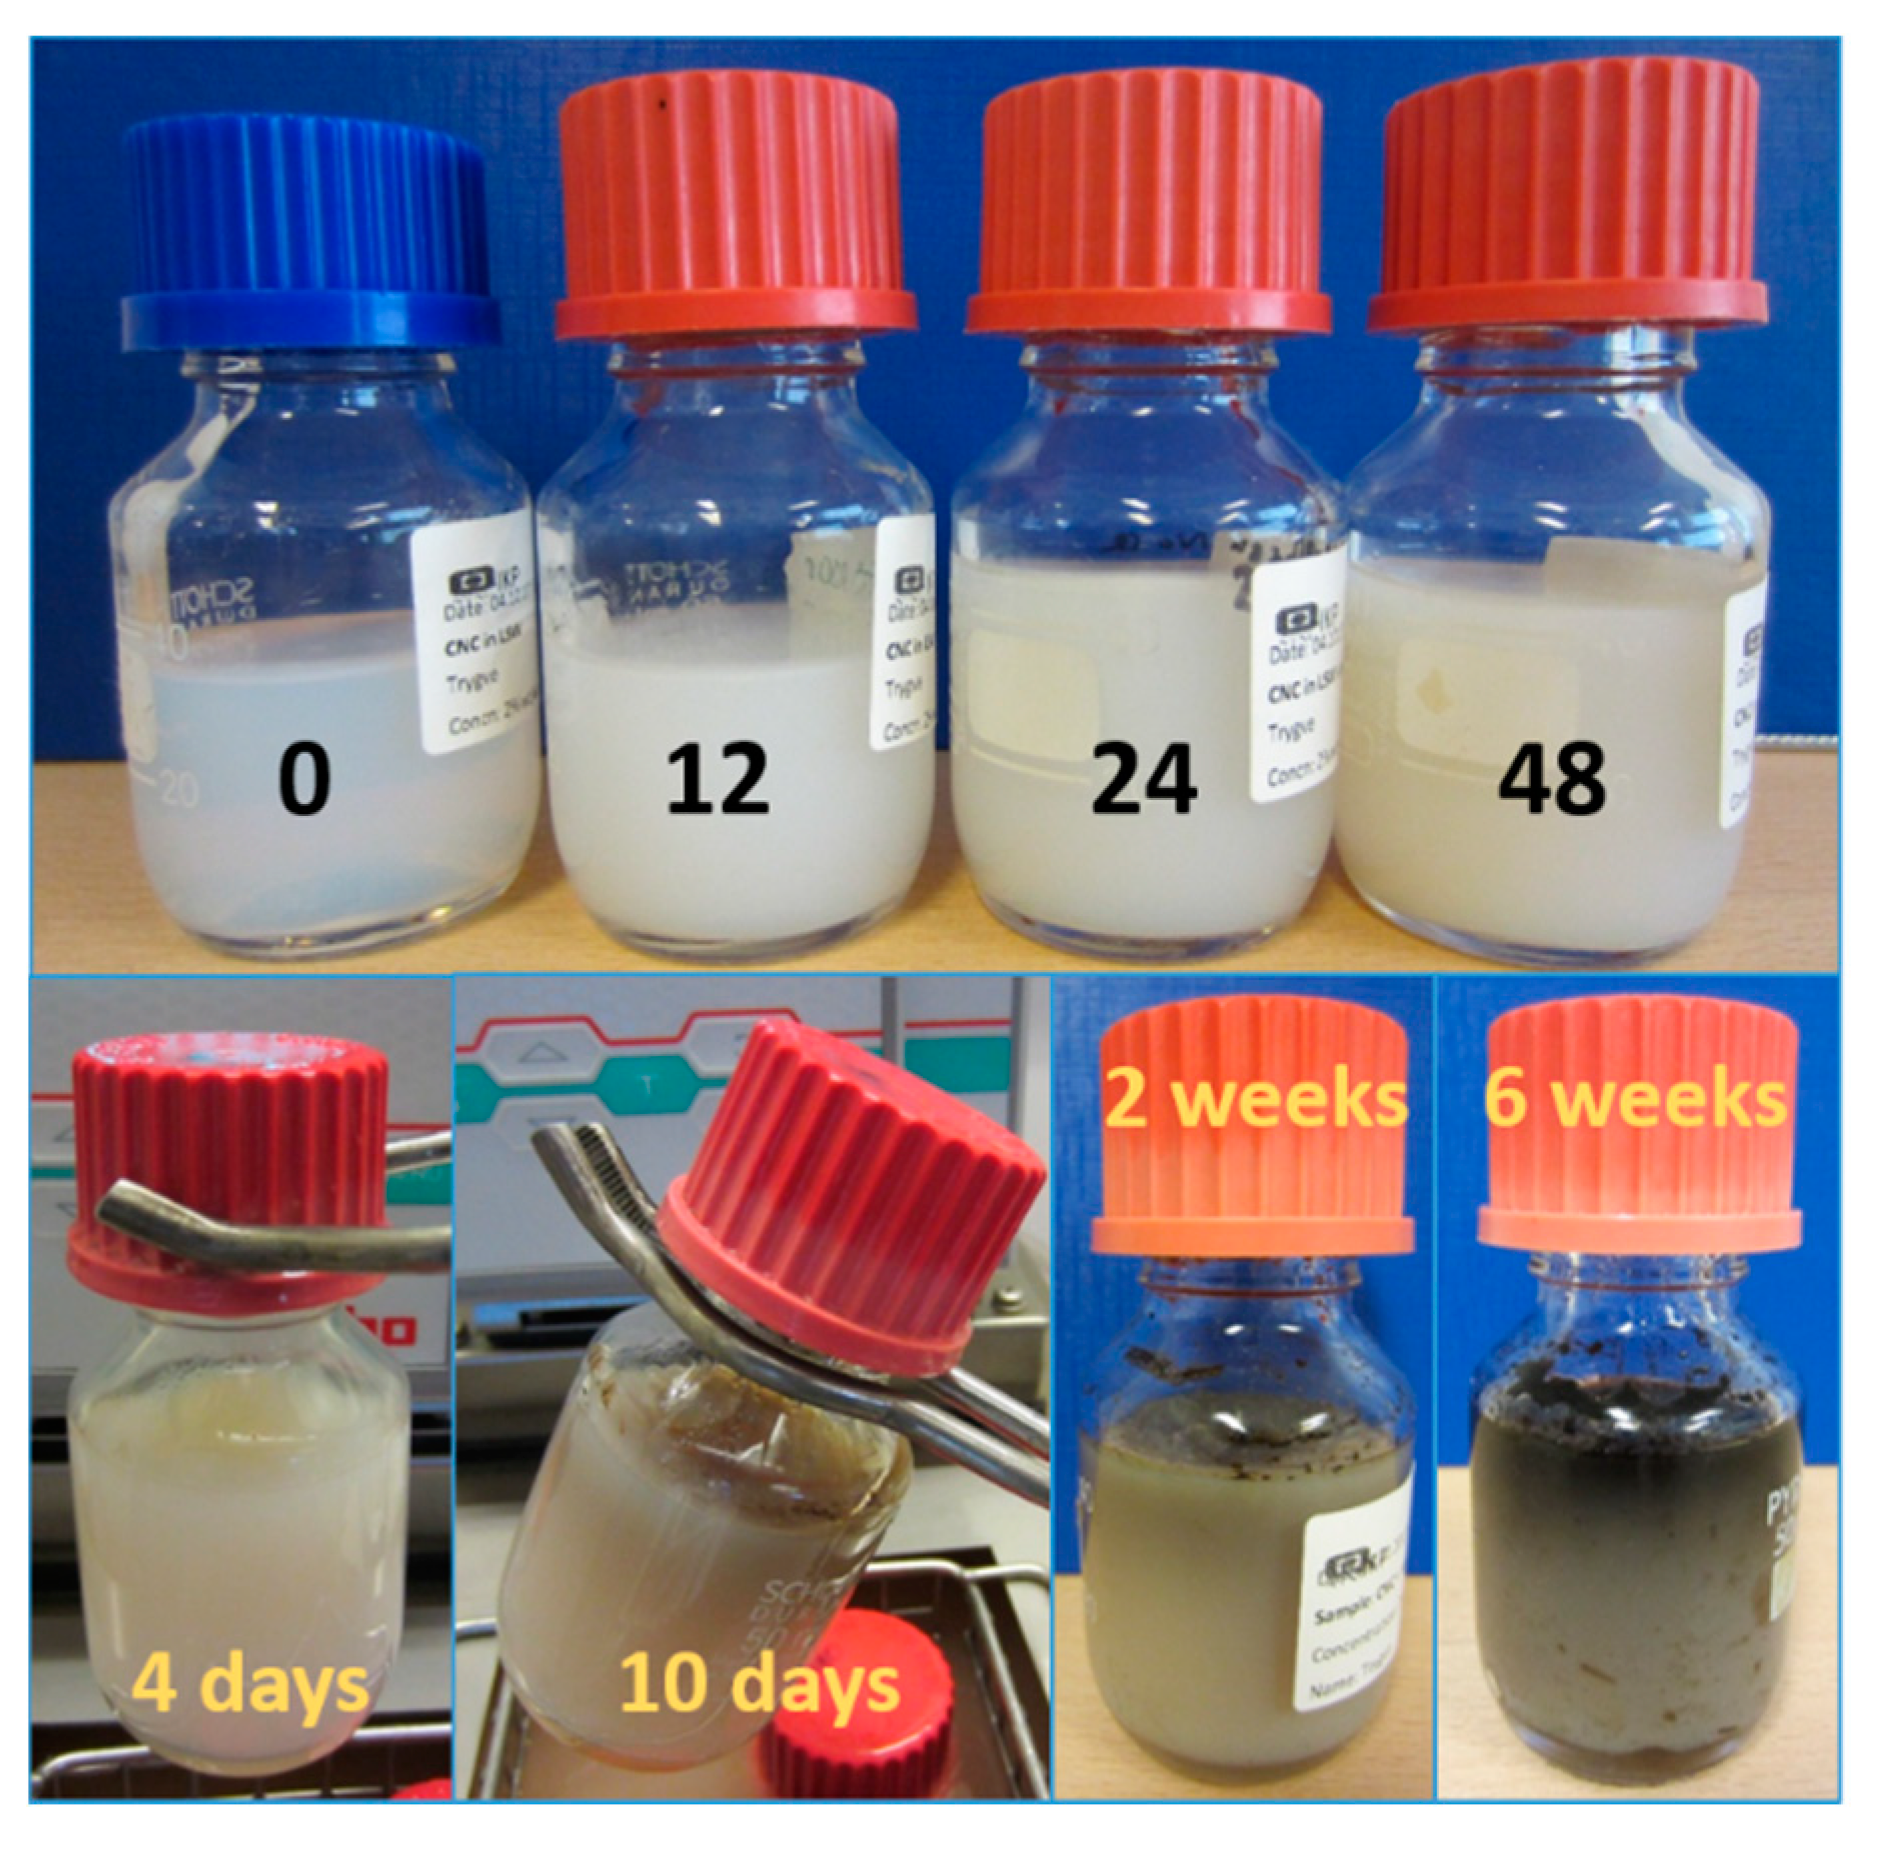
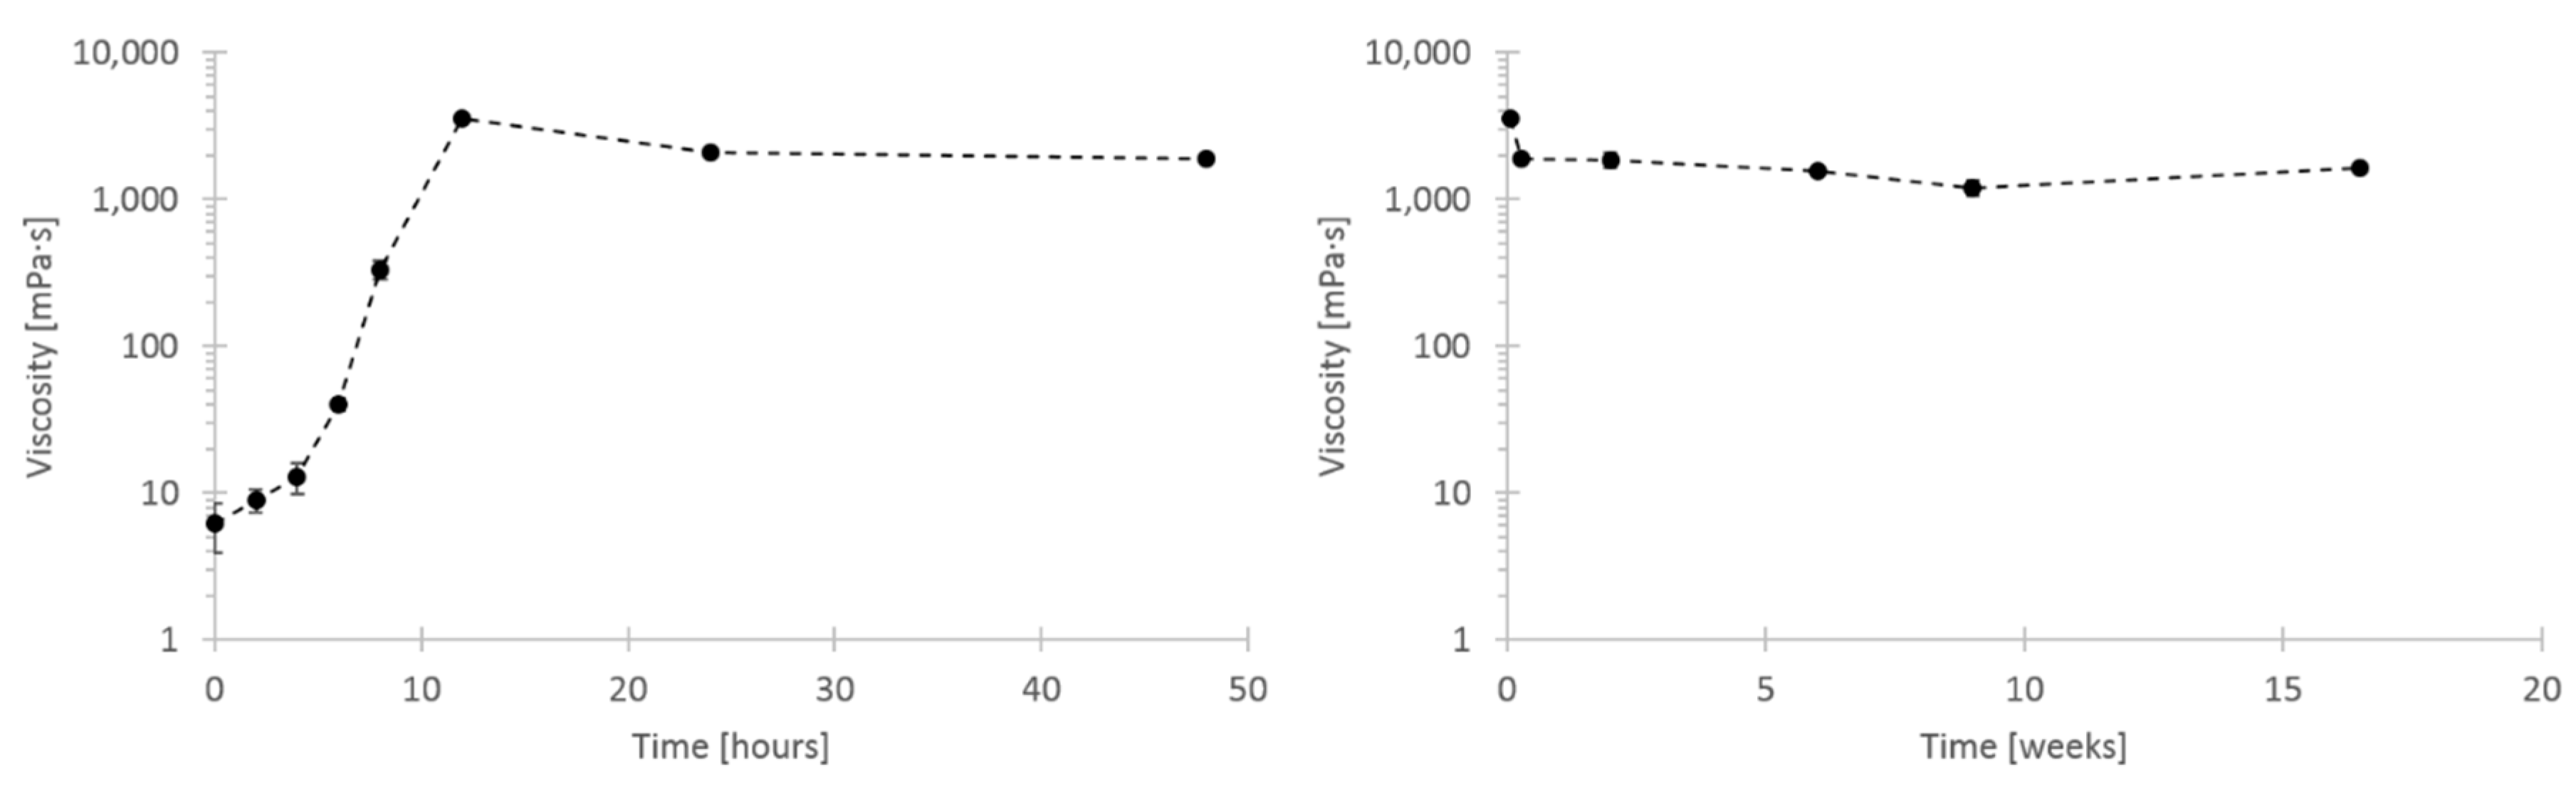
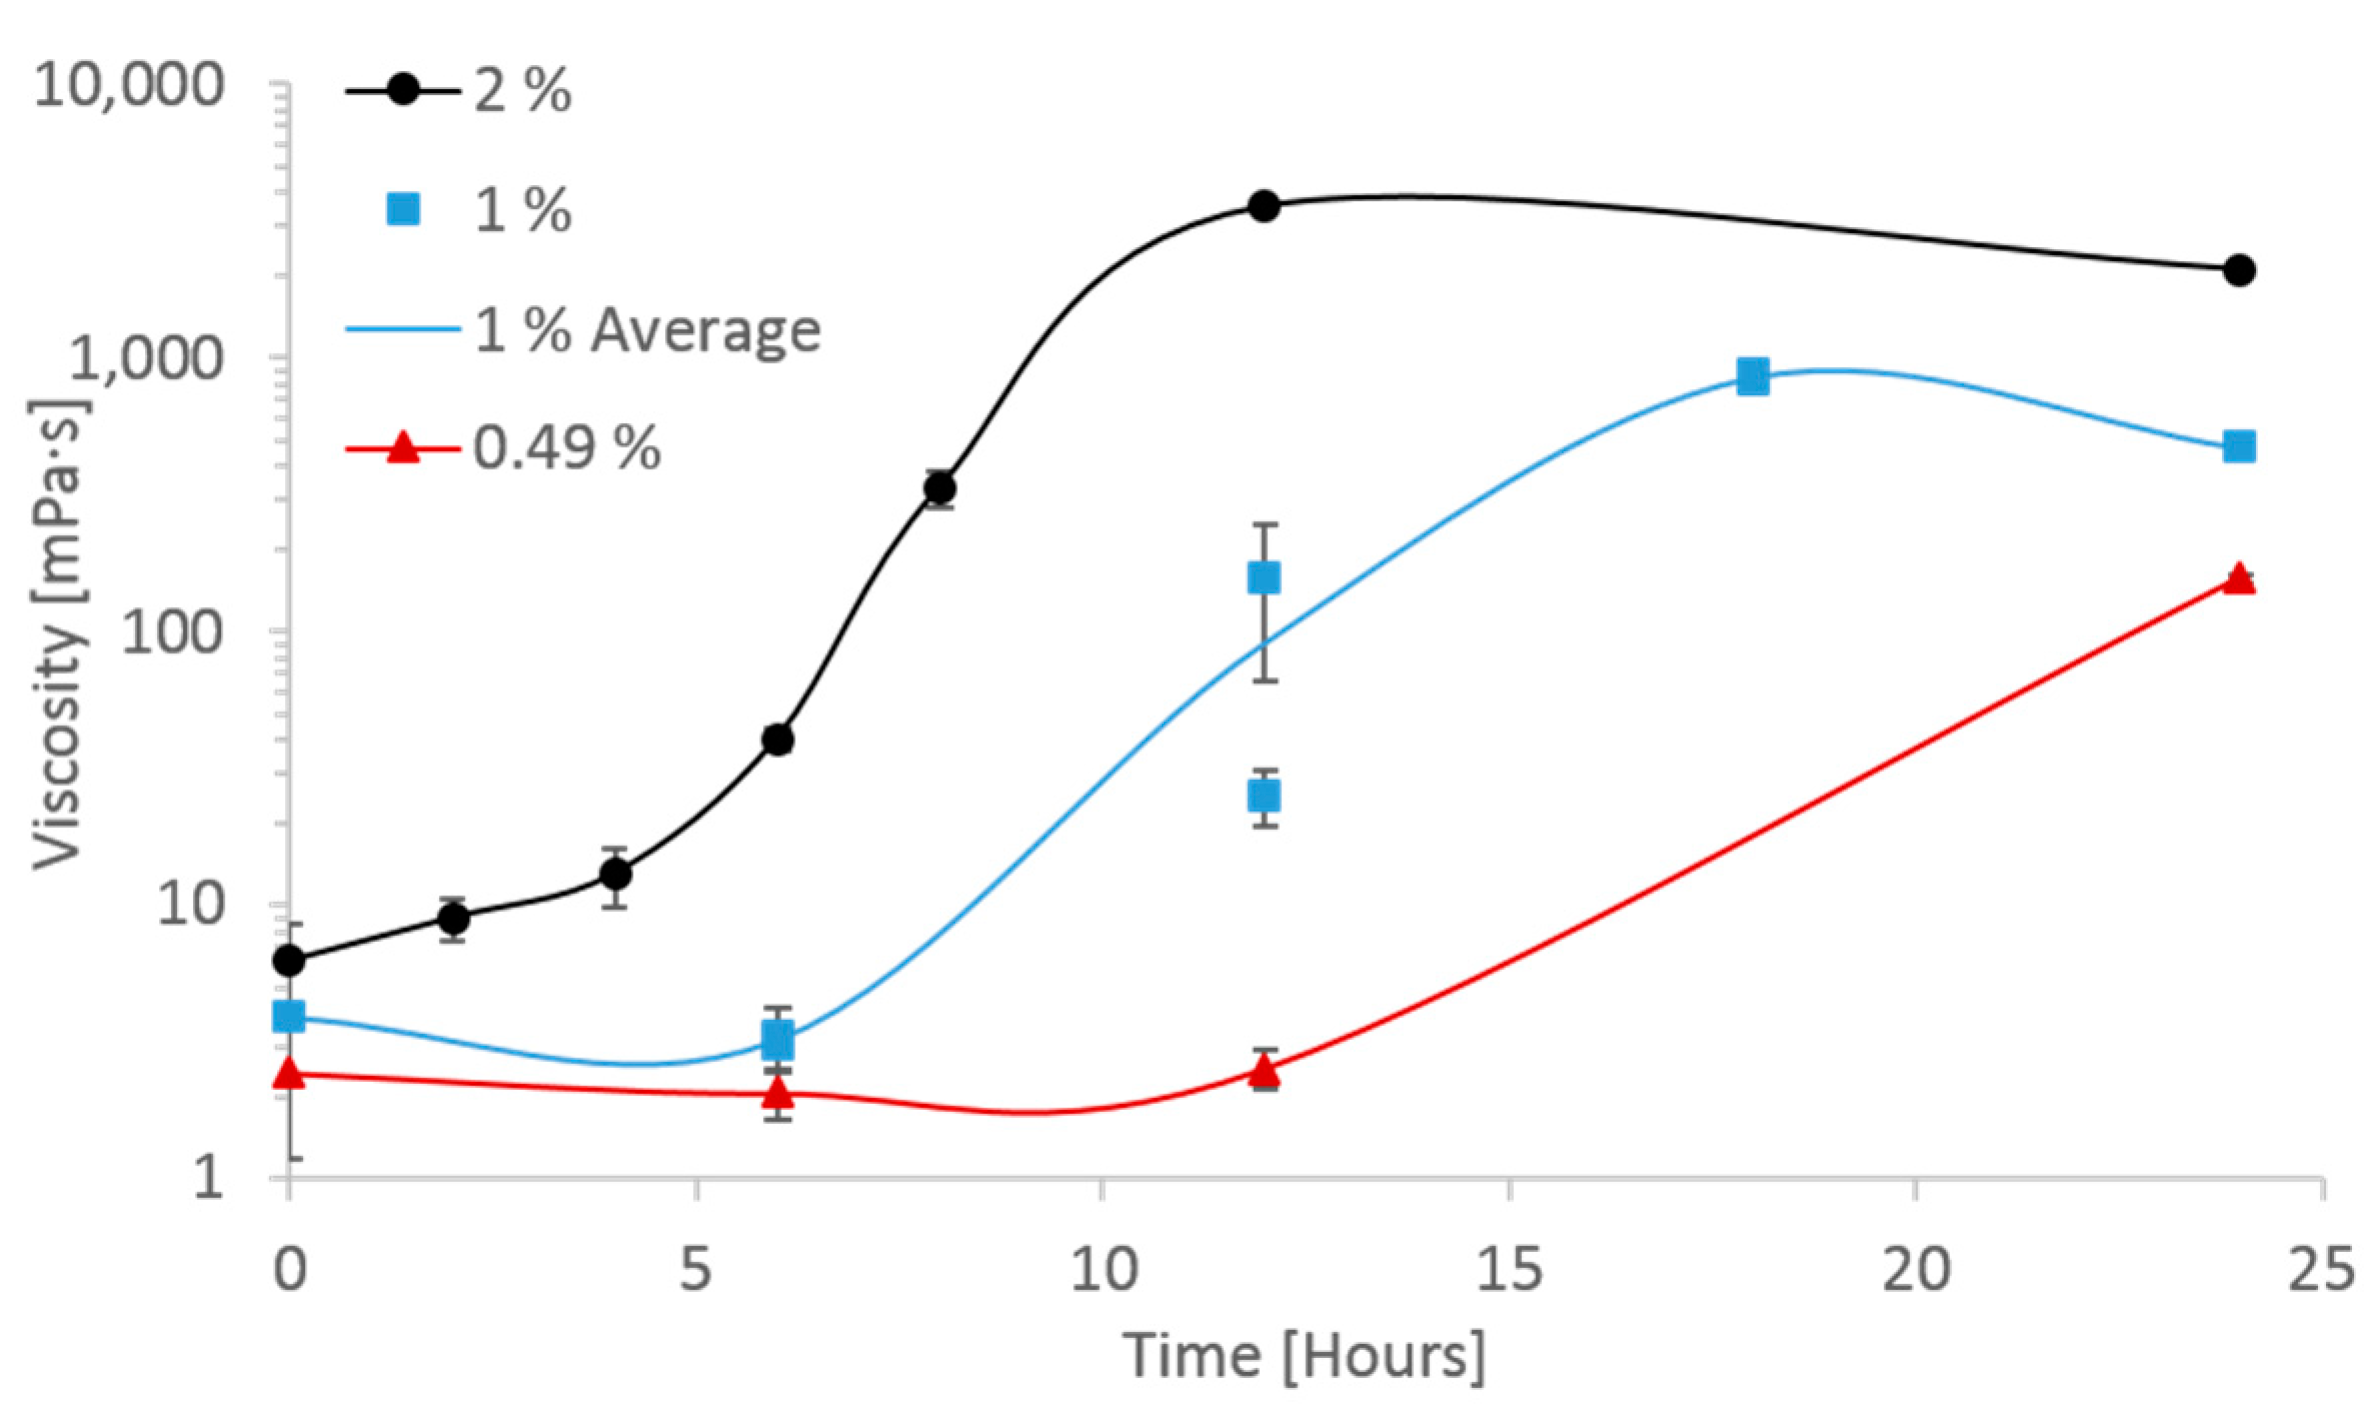
3.1.1. High-Temperature Aging of CNC
3.1.2. Rheology Measurements and Shear Rate
3.1.3. Atomic Force Microscope (AFM) Pictures
3.1.4. Interfacial Tension
3.2. Core Plug Setup and Cleaning
3.3. Establish Initial Saturation
3.4. Core Flood Experiment
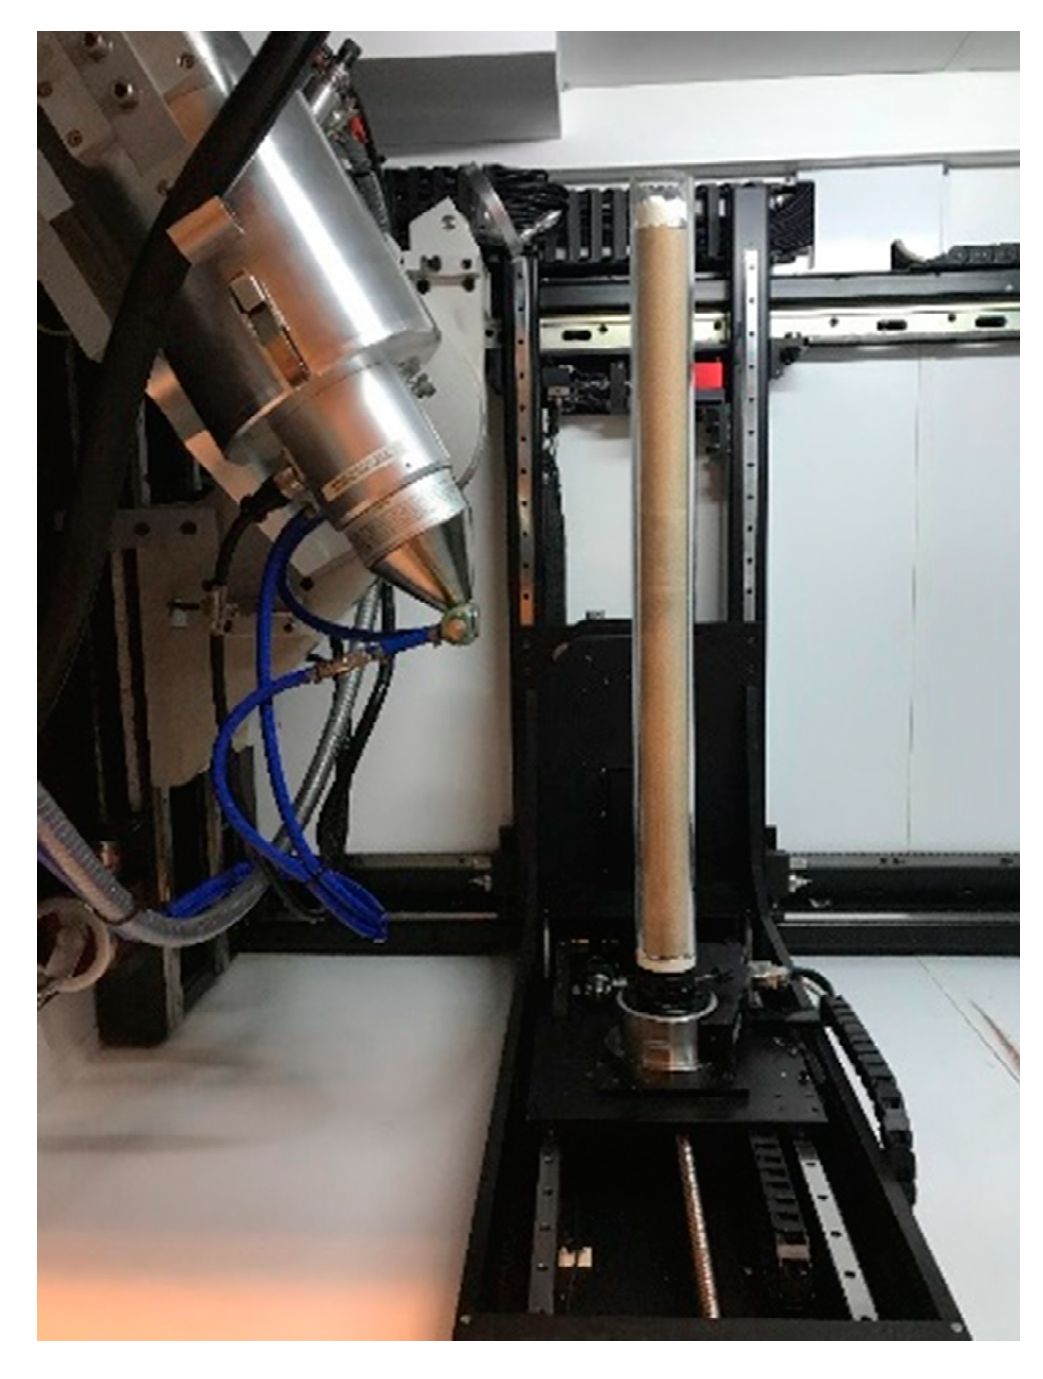
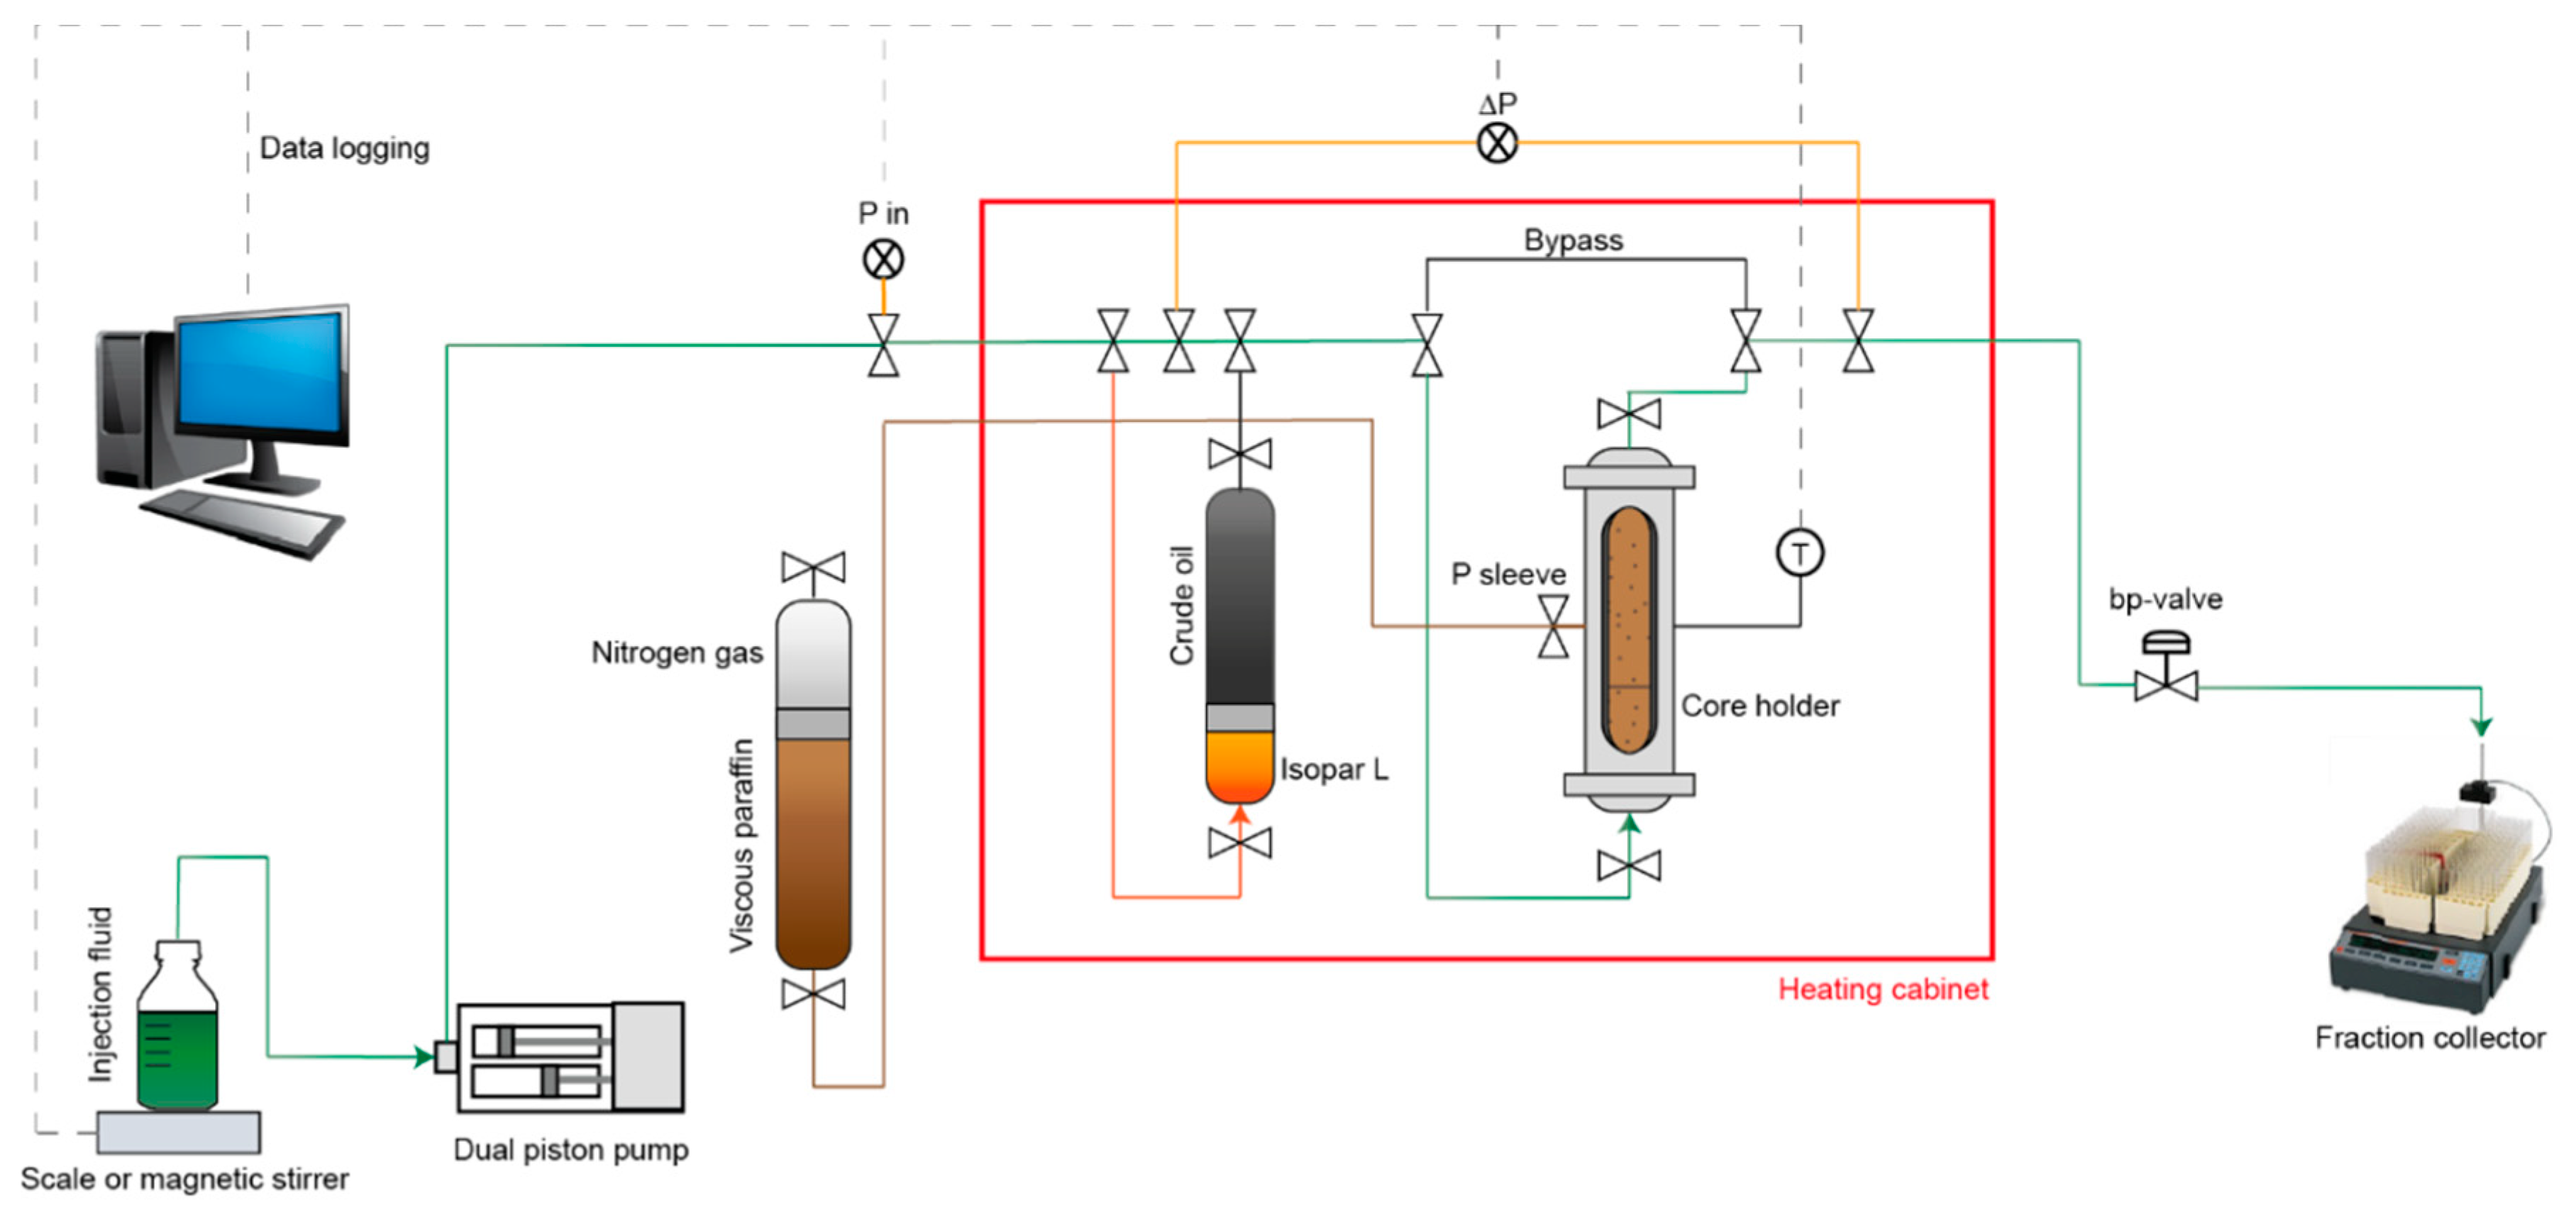
3.4.1. Experimental Setup
3.4.2. Injection Scheme
3.5. Permeability
3.6. Effluent Characterization
3.6.1. Oil Production
3.6.2. Particle Size
3.7. Characterization of the Core after Core Flood
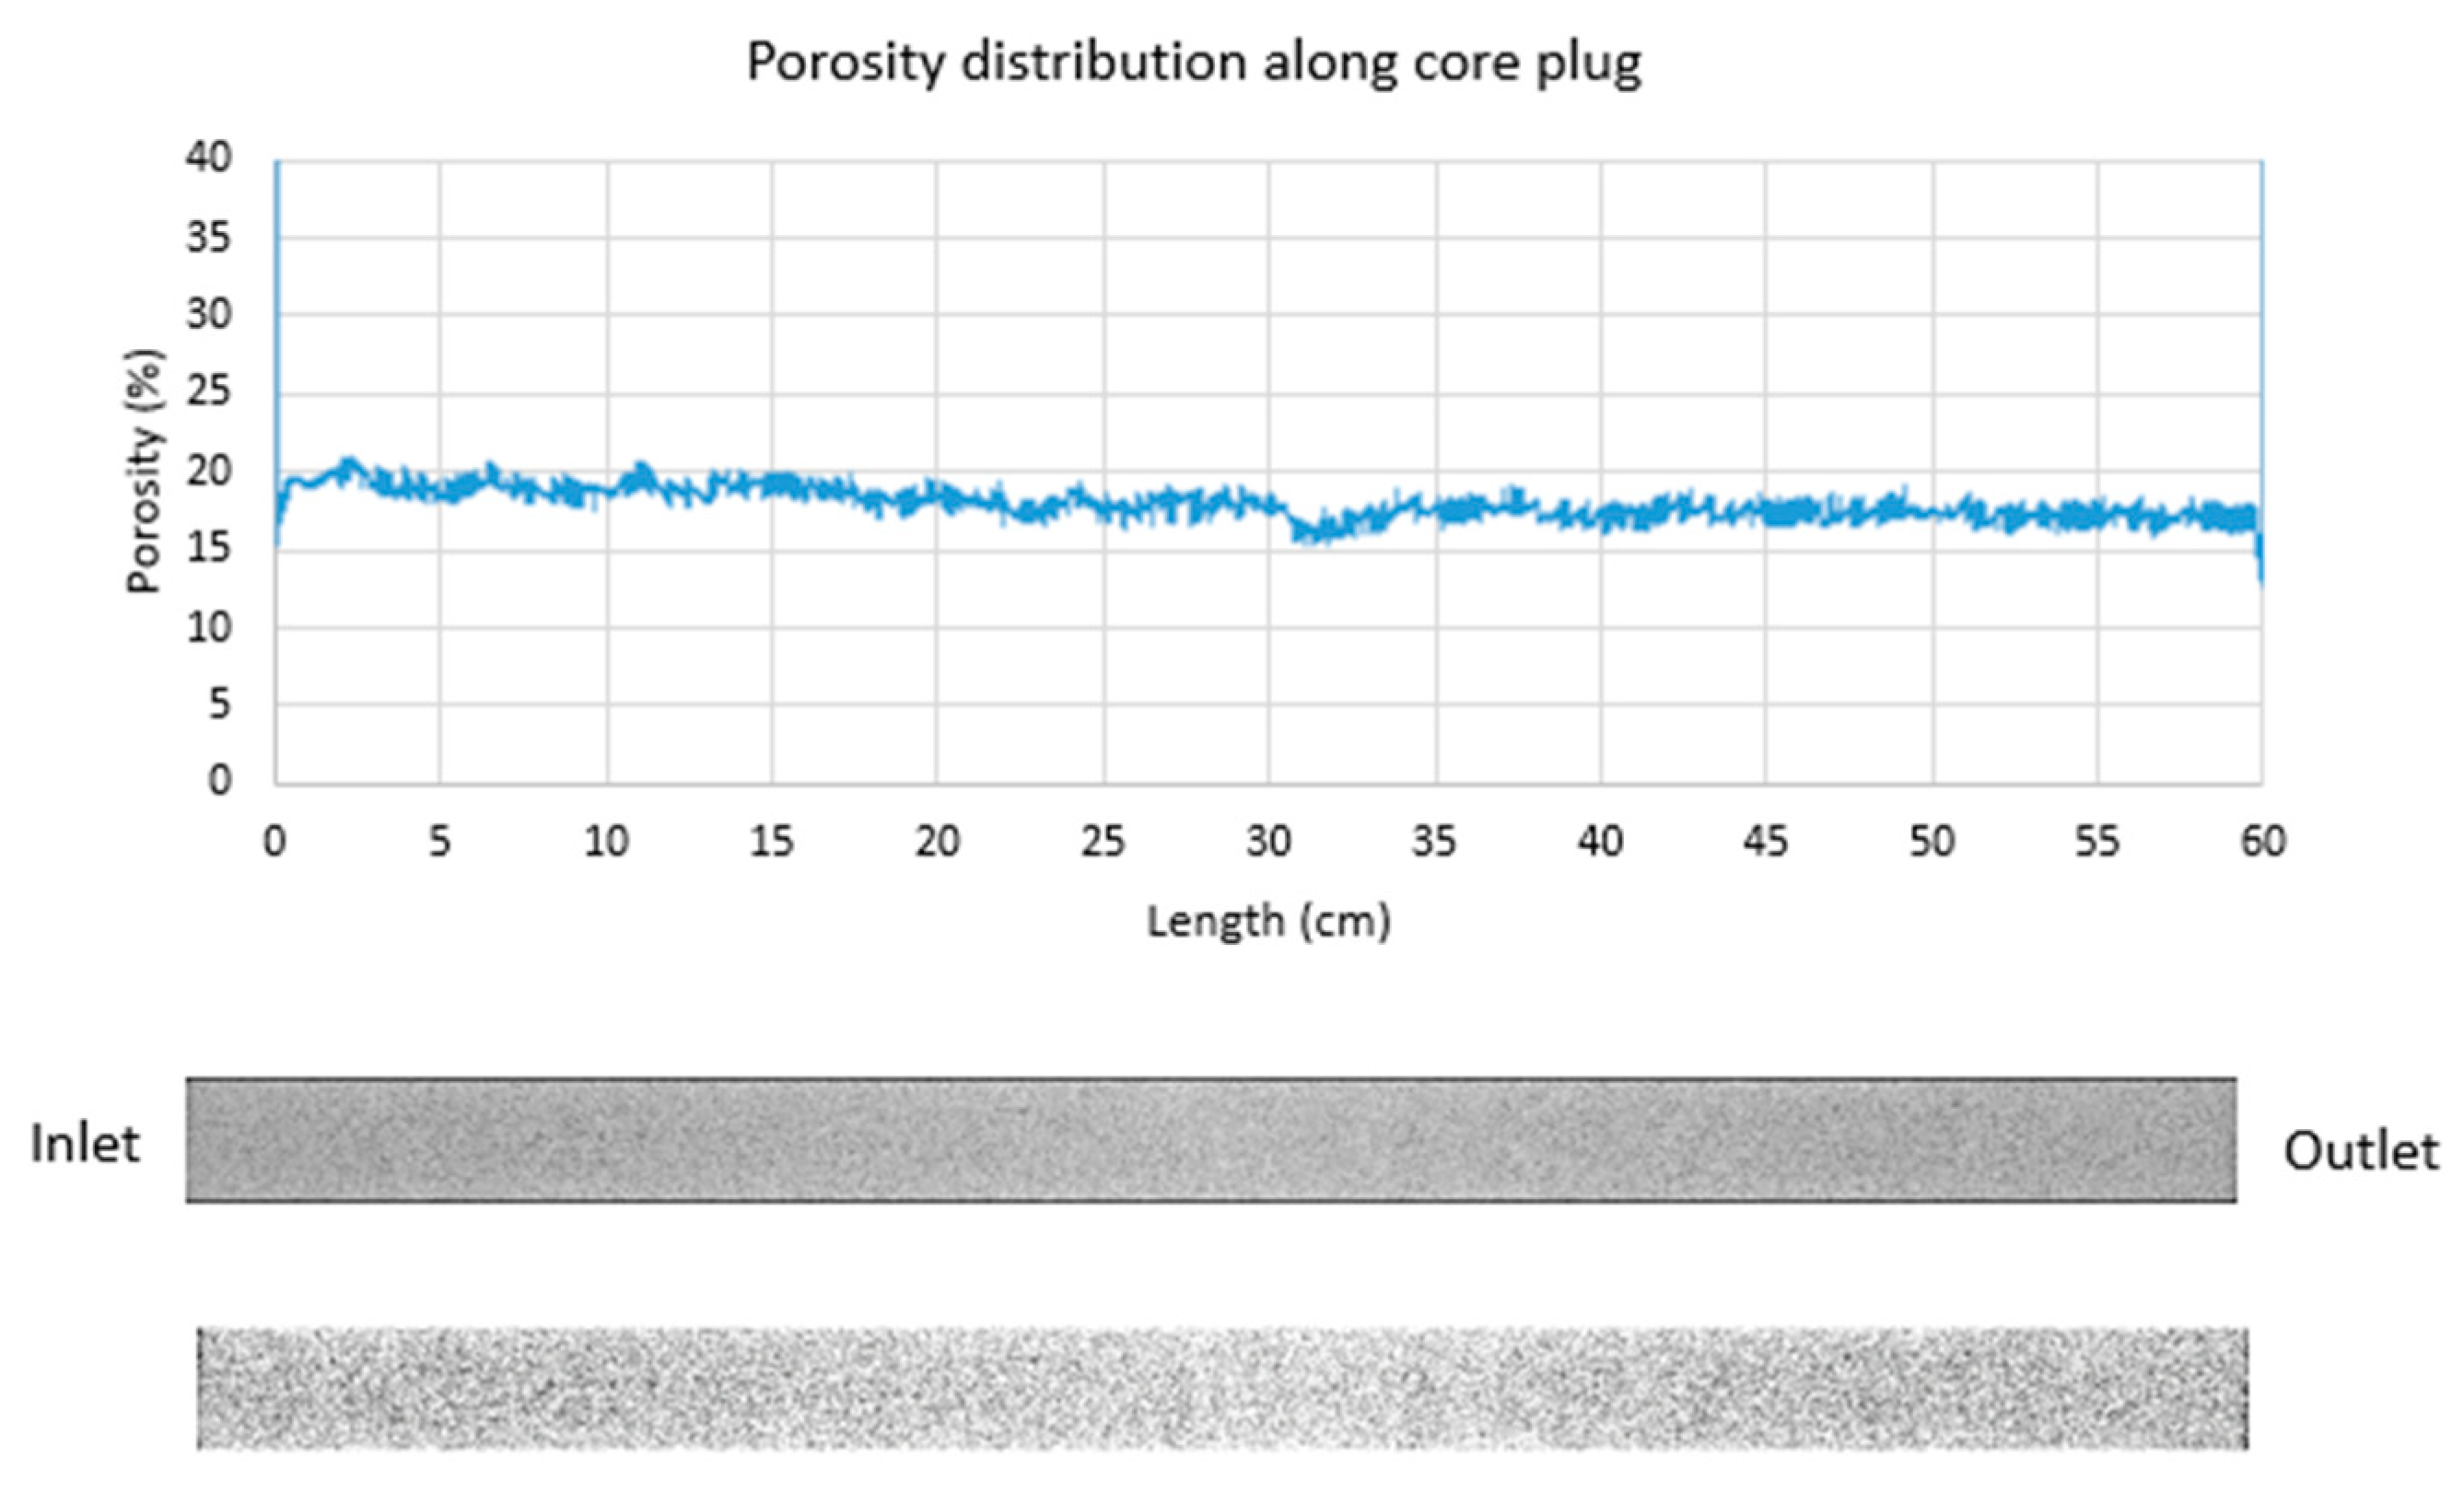
3.7.1. Micro Computed Tomography (Micro-CT) Scan
3.7.2. Scanning Electron Microscopy (SEM) Imaging
4. Results and Discussion
4.1. Characterization of CNC
4.1.1. High-Temperature Aging of CNC
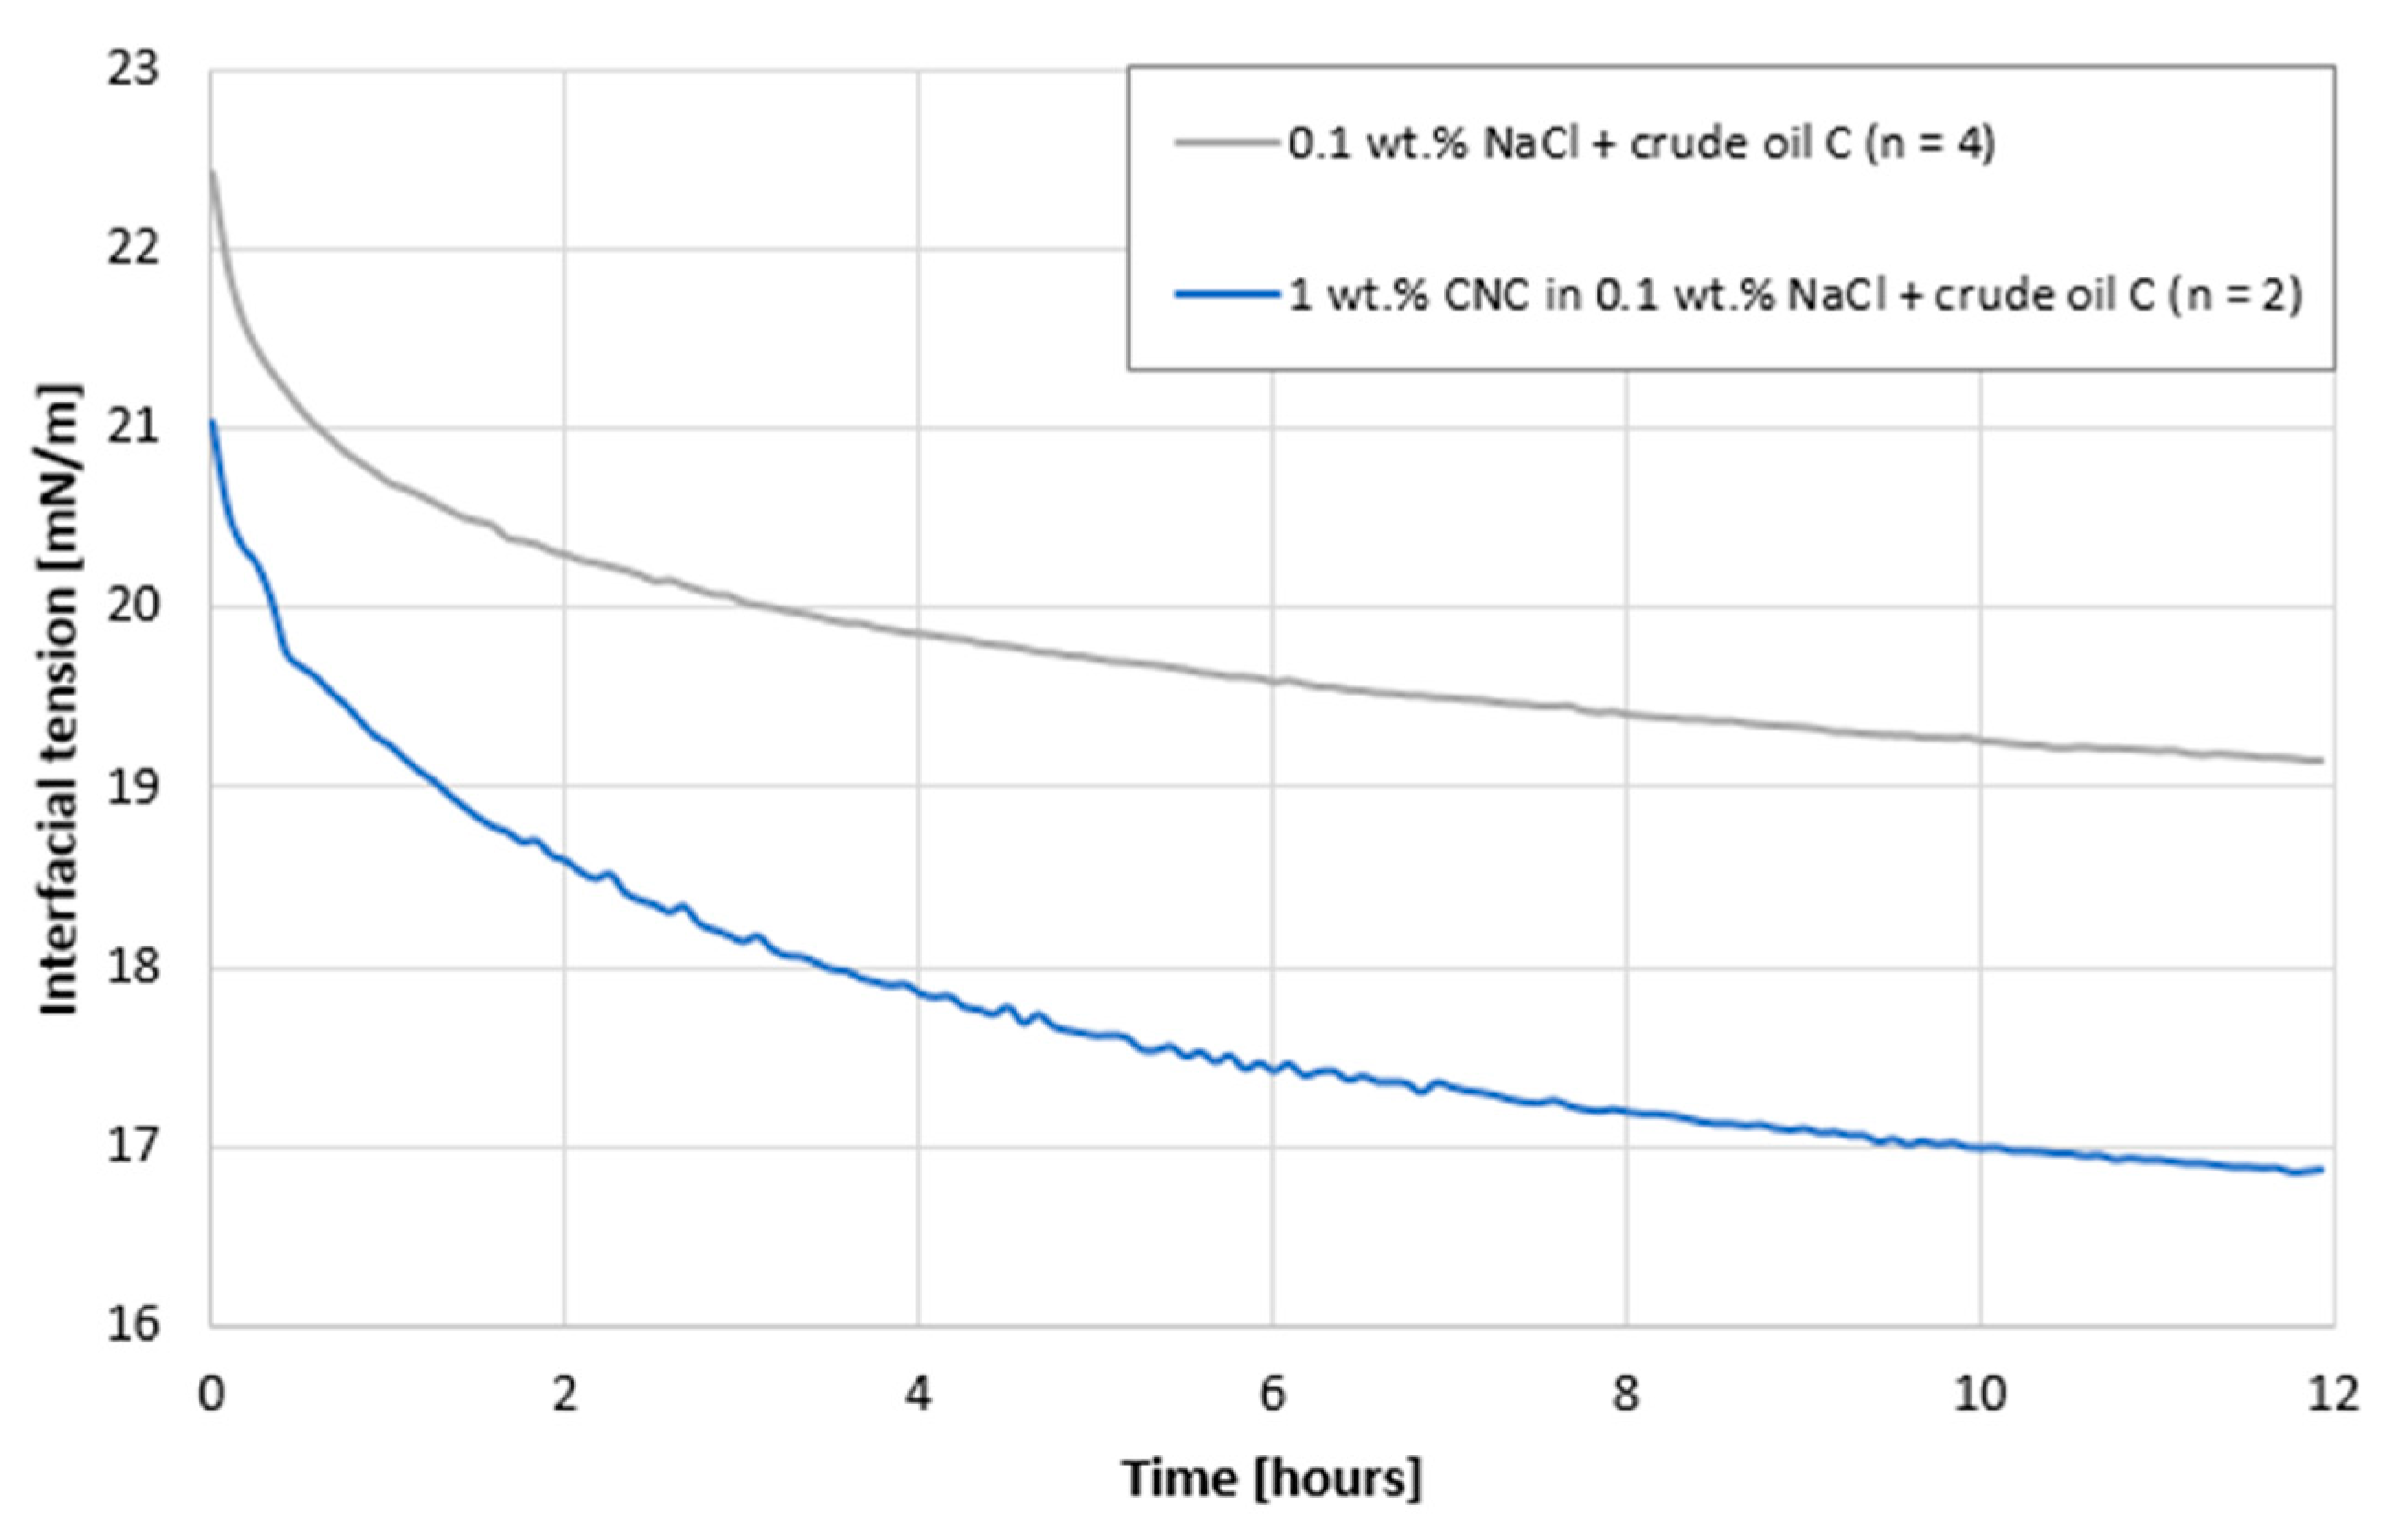
4.1.2. Interfacial Tension
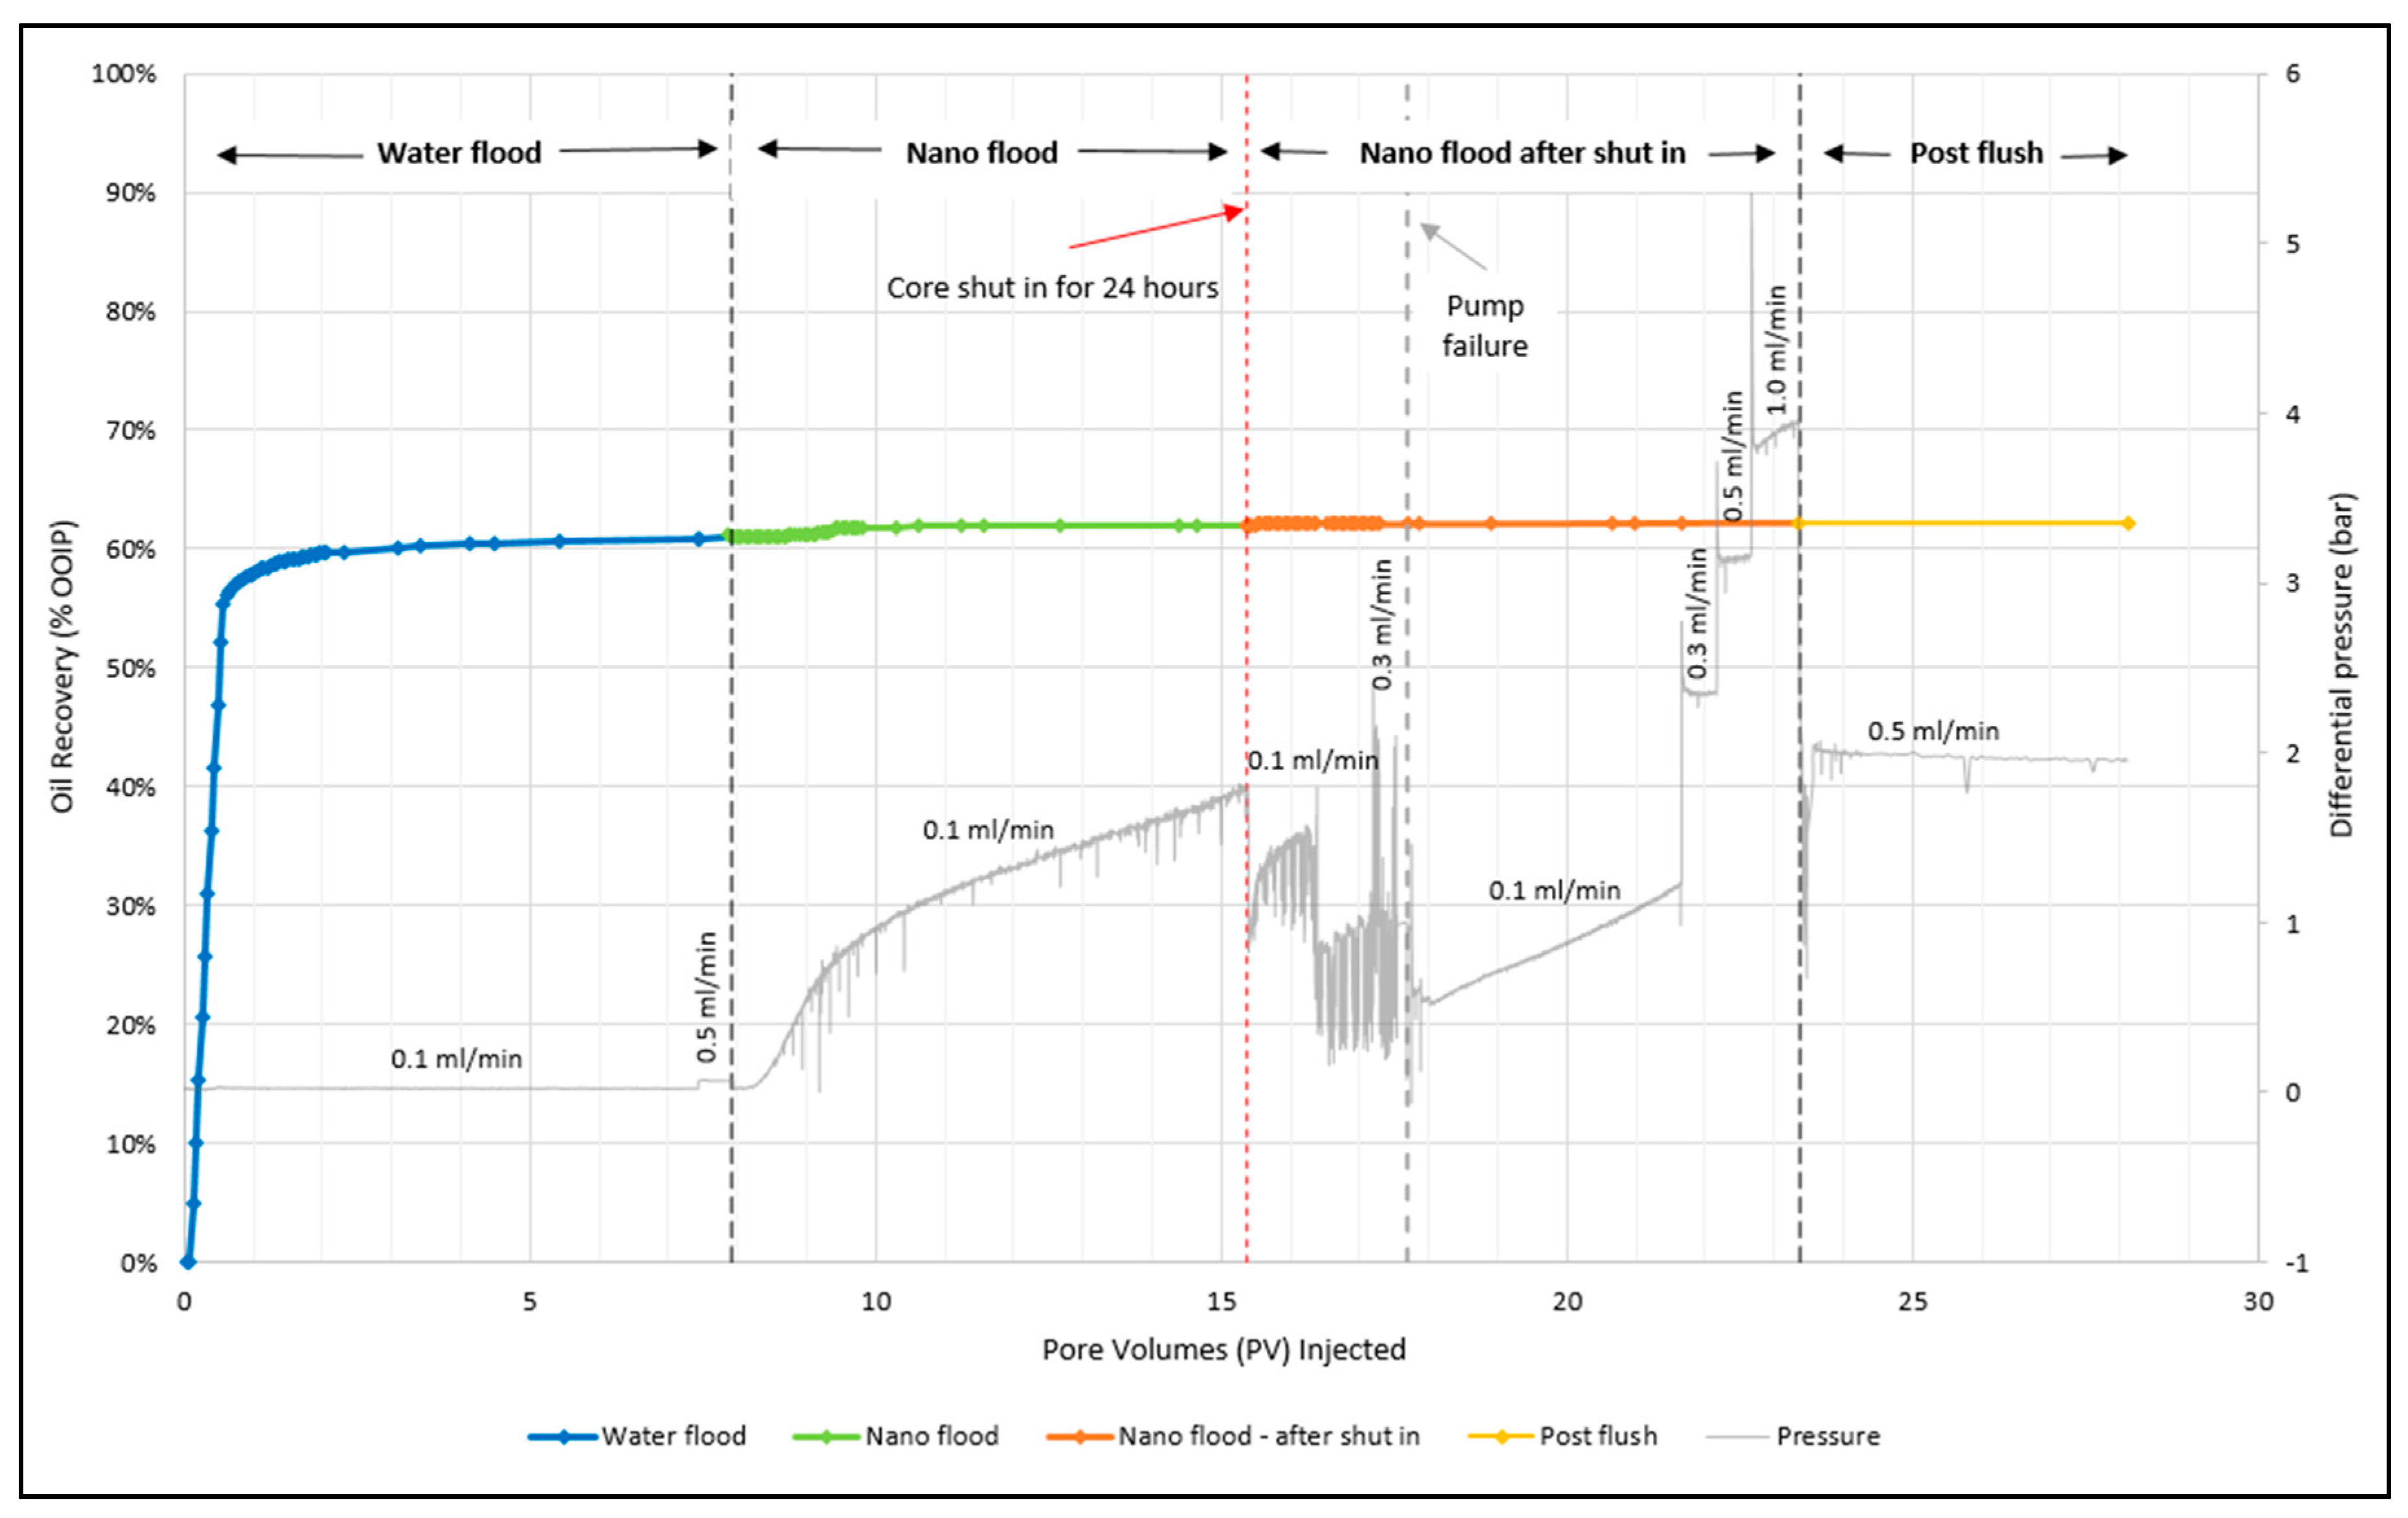
4.2. Oil-Recovery Experiment
4.3. Permeability
4.4. Characterization of the Core after the Core Flood
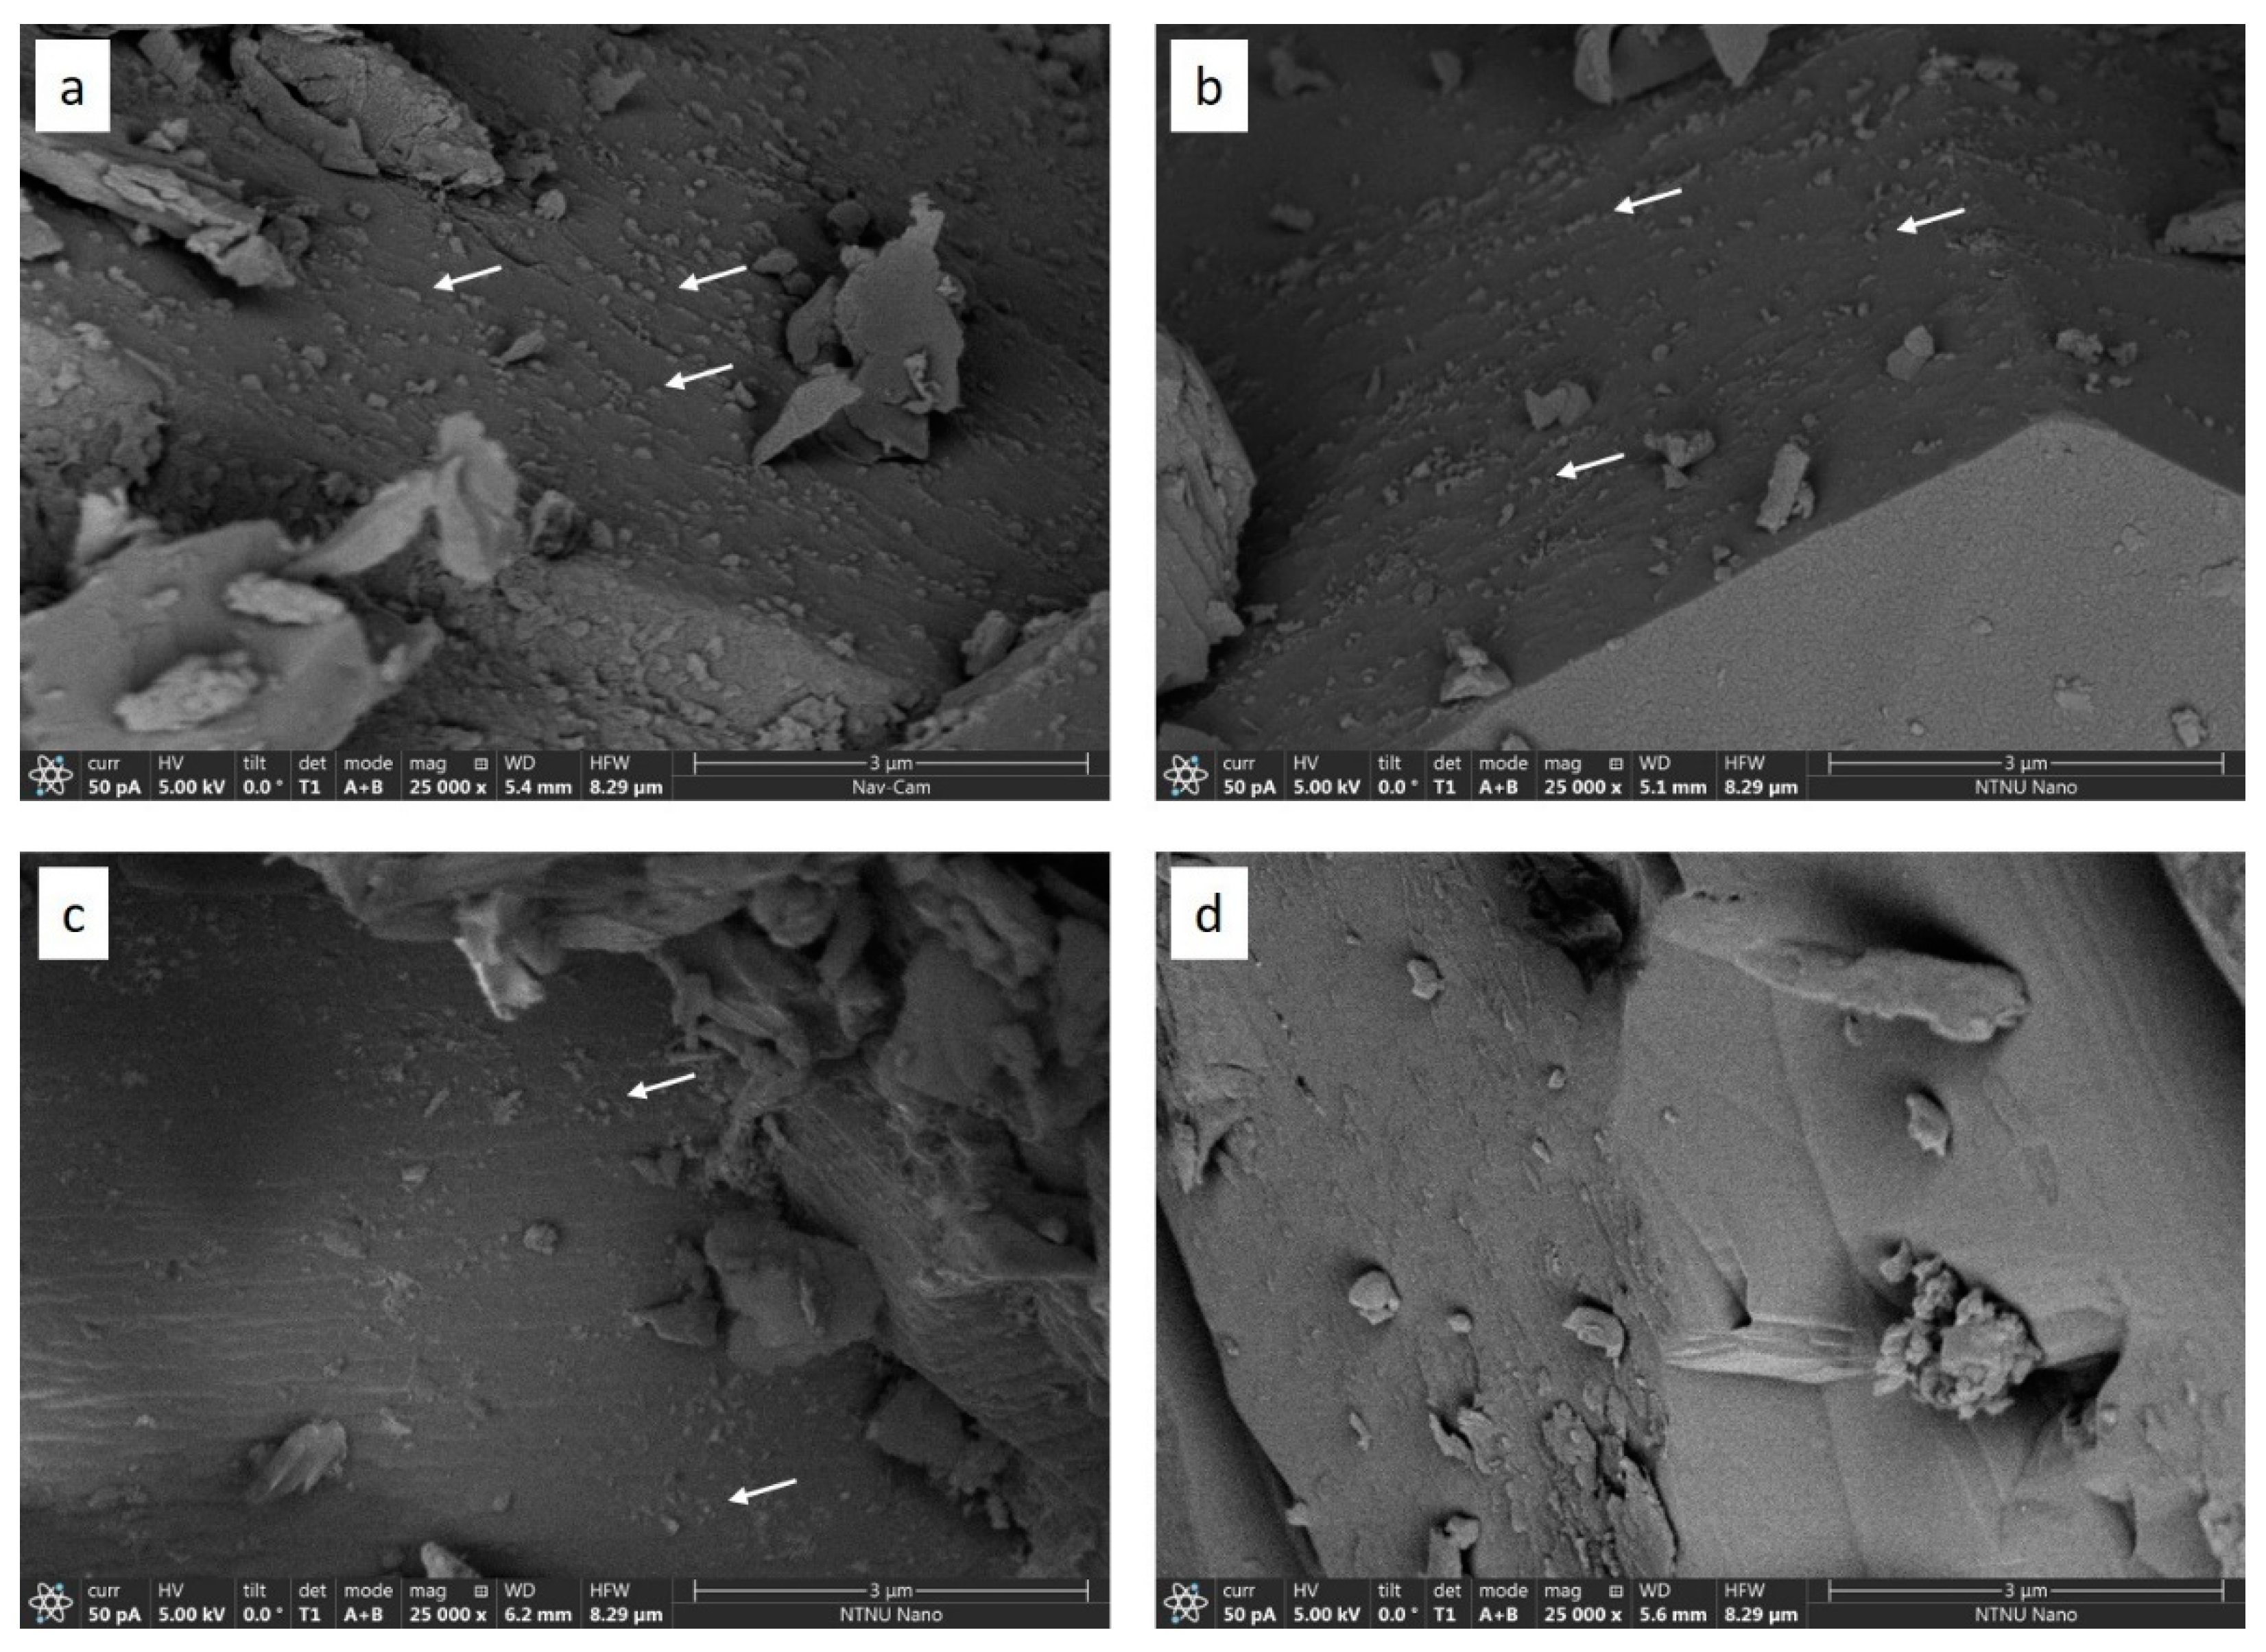
SEM Imaging
4.5. Effluent Characterization
4.5.1. Particle Size
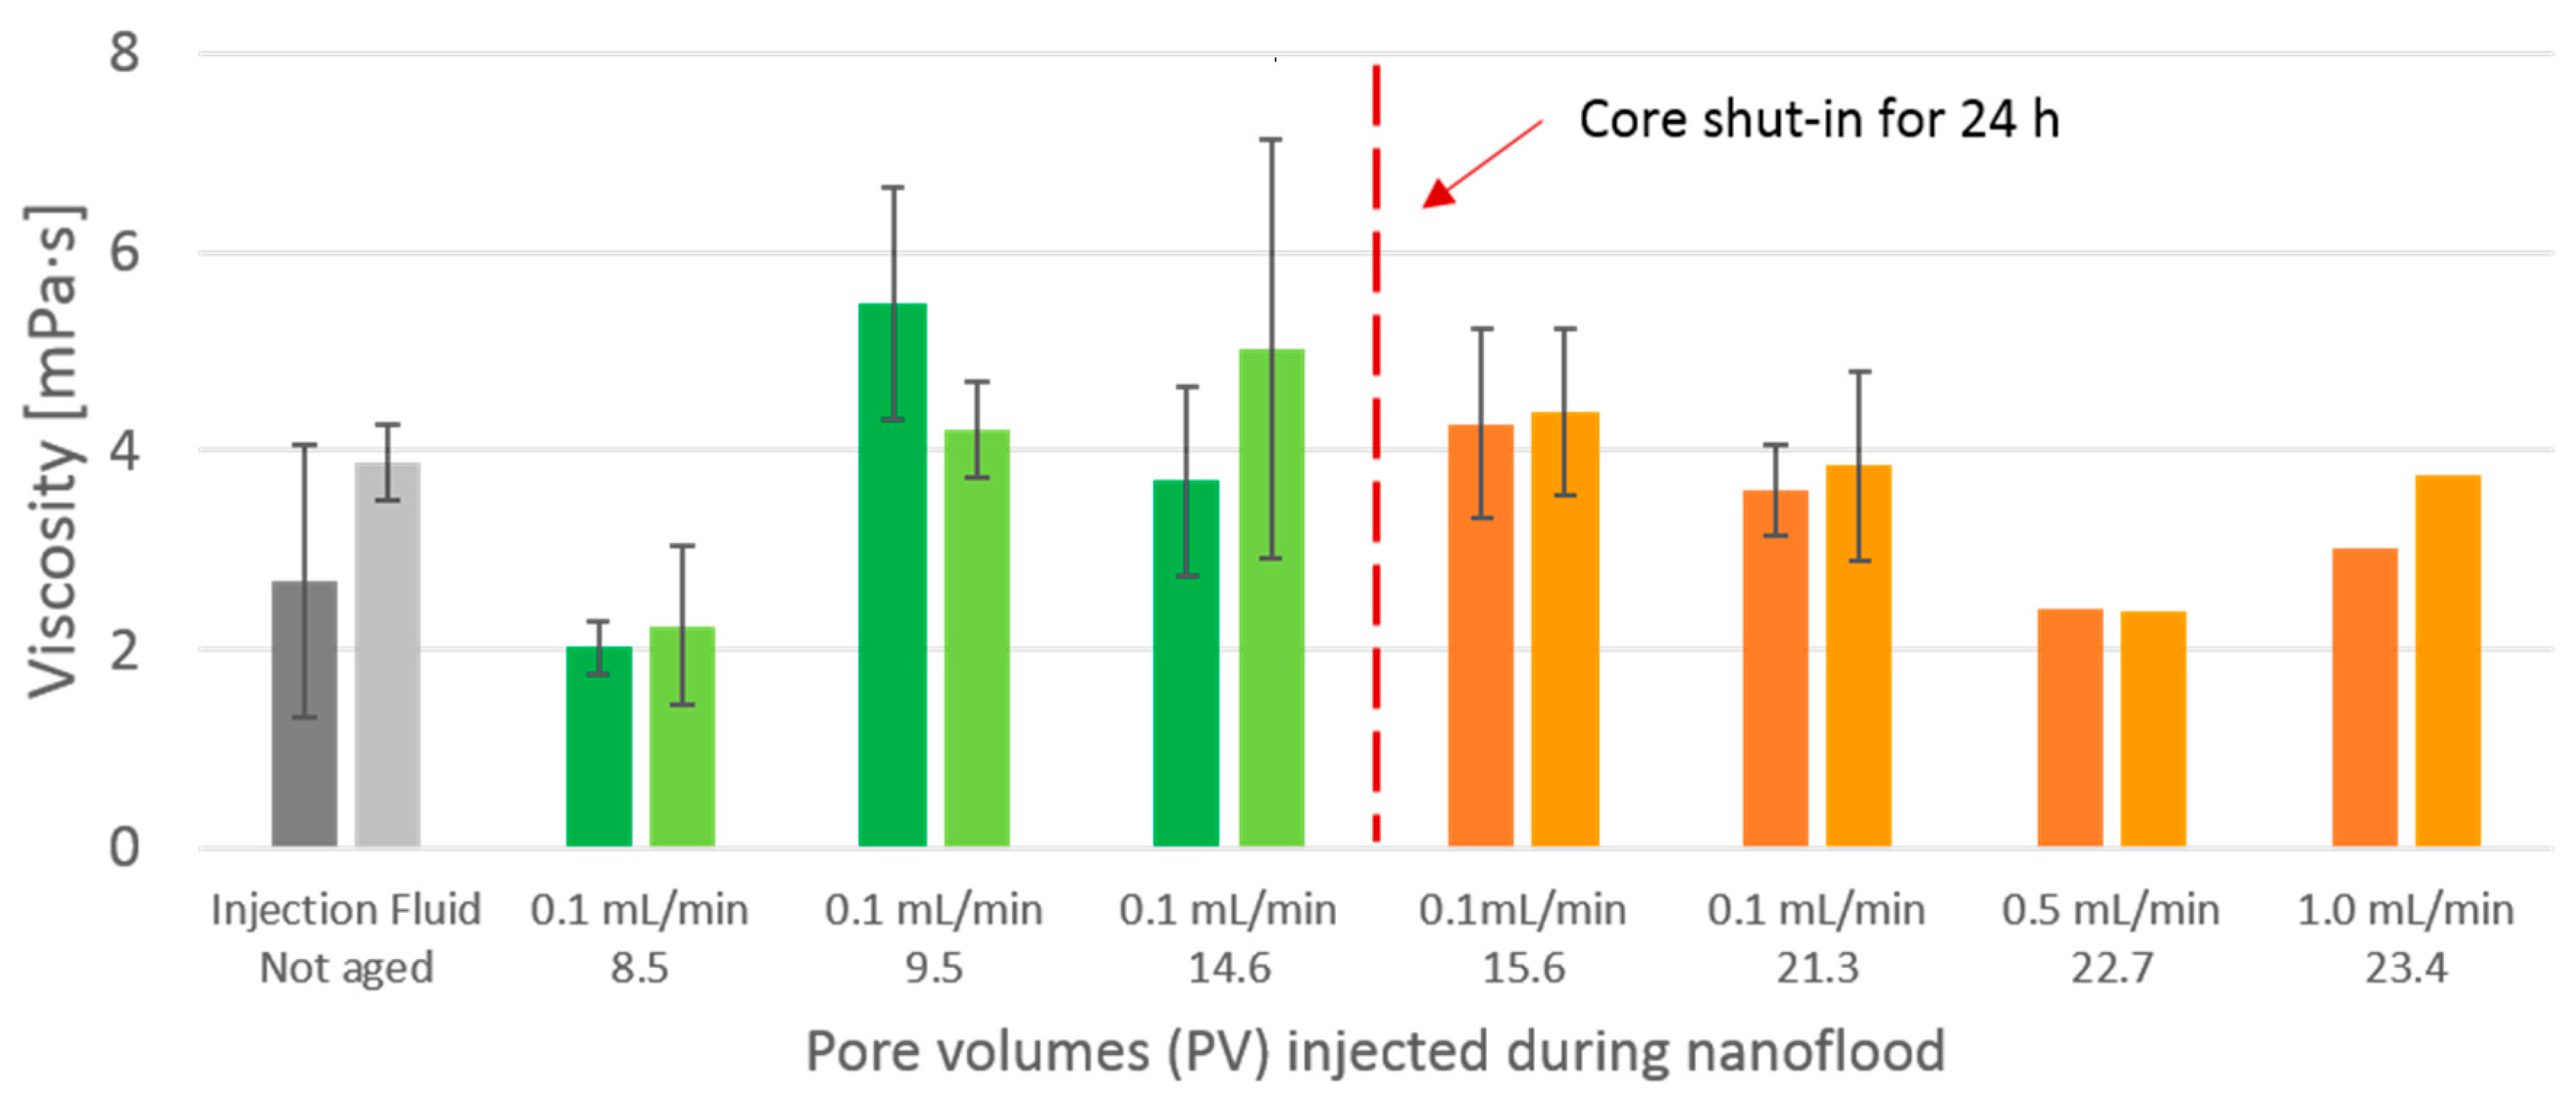
4.5.2. Rheology Measurements
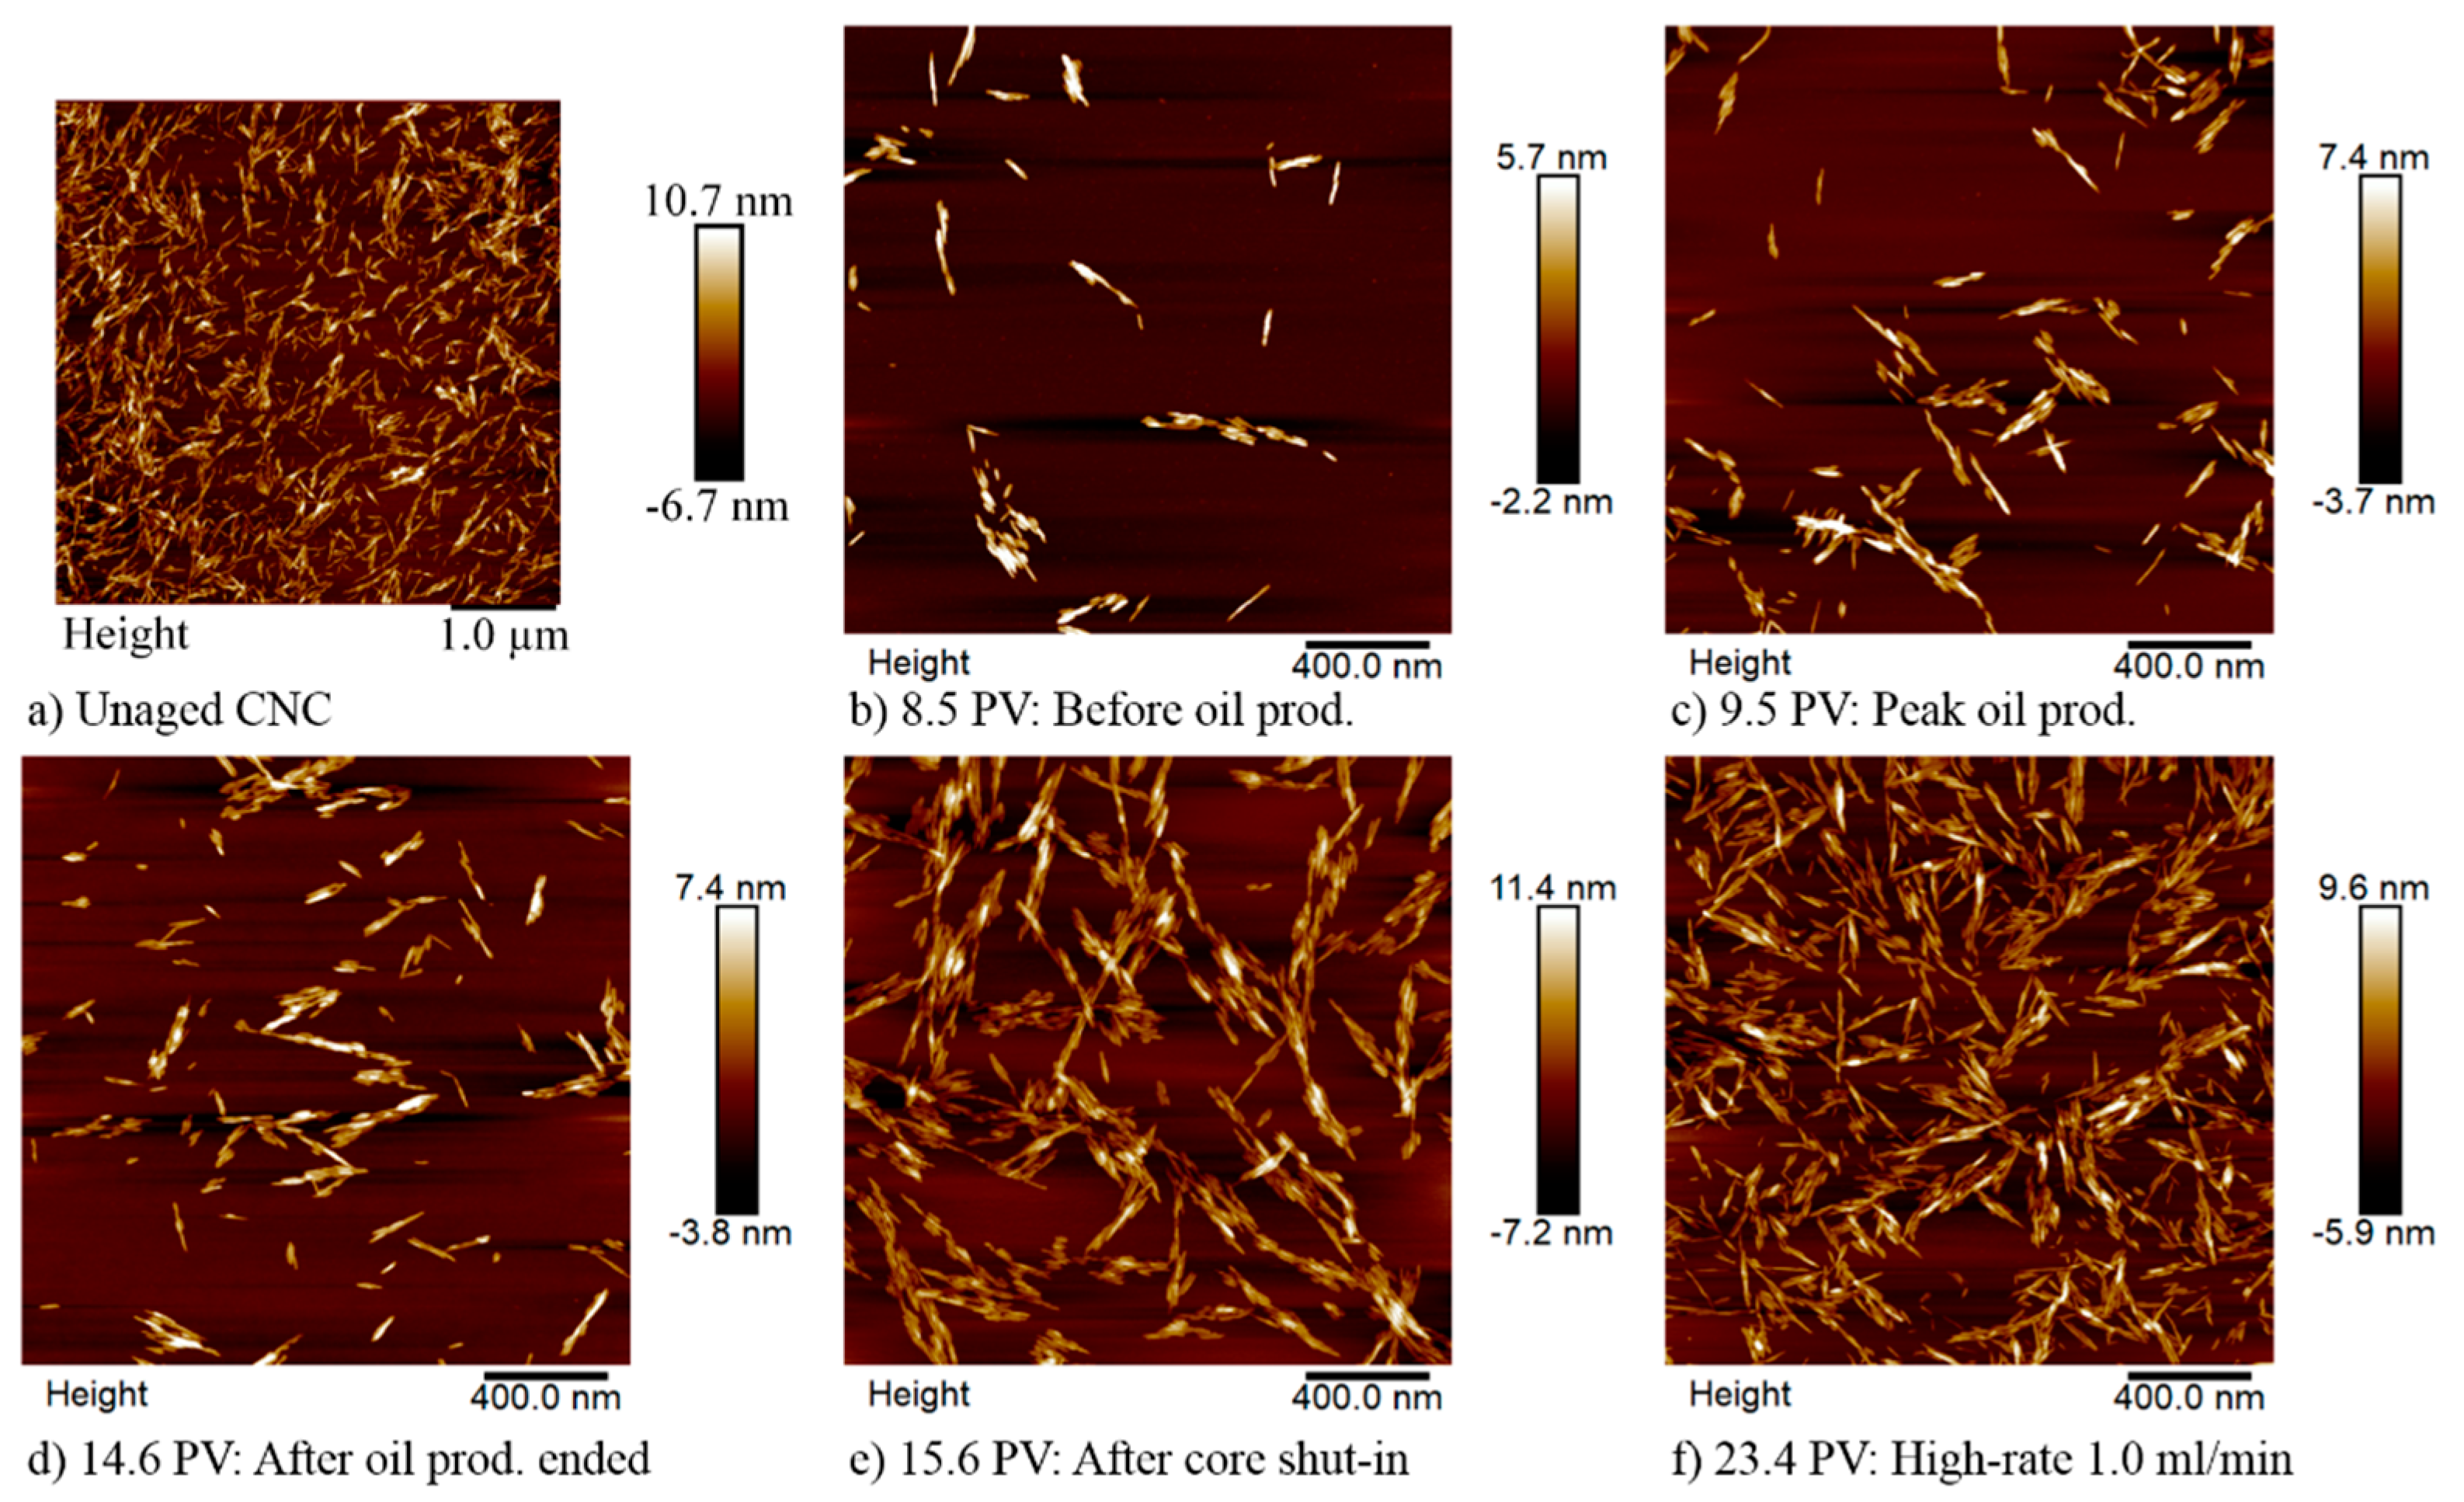
4.5.3. Atomic Force Microscopy (AFM)
5. Conclusions
Author Contributions
Funding
Acknowledgments
Conflicts of Interest
Appendix A

Appendix B
Results of Interfacial Tension Measurements
Appendix C

Results of Micro-CT Scan
Appendix D

Results of AFM Images
References
- Resource Report 2017: Even More to Gain; Norwegian Petroleum Directorate, 2017; Available online: www.npd.no (accessed on 14 July 2017).
- Sun, X.; Zhang, Y.; Chen, G.; Gai, Z. Application of Nanoparticles in Enhanced Oil Recovery: A Critical Review of Recent Progress. Energies 2017, 10, 345. [Google Scholar] [CrossRef]
- Lake, L.W. Enhanced Oil Recovery; Prentice-Hall, Inc.: Upper Saddle River, NJ, USA, 1989. [Google Scholar]
- Alvarado, V.; Manrique, E. Chapter 2 – Enhanced Oil Recovery Concepts. In Enhanced Oil Recovery: Field Planning and Development Strategies; Gulf Professional Publishing: Boston, MA, USA, 2010; pp. 7–16. [Google Scholar]
- Sheng, J. Modern chemical enhanced oil recovery: theory and practice; Gulf Professional Publishing: Boston, MA, USA, 2010. [Google Scholar]
- Kamal, M.S.; Sultan, A.S.; Al–Mubaiyedh, U.A.; Hussein, I.A. Review on Polymer Flooding: Rheology, Adsorption, Stability, and Field Applications of Various Polymer Systems. Polym. Rev. 2015, 55, 491–530. [Google Scholar] [CrossRef]
- Terry, R.E. Enhanced oil recovery. In Encyclopedia of Physical Science and Technology; Academic Press: Tarzana, CA, USA, 2001; Volume 18, pp. 503–518. [Google Scholar]
- Nenningsland, A.L.; Simon, S.; Sjöblom, J. Surface properties of basic components extracted from petroleum crude oil. Energy Fuels 2010, 24, 6501–6505. [Google Scholar] [CrossRef]
- Lyons, W.C.; Plisga, G.J. Standard Handbook of Petroleum and Natural Gas Engineering, 3rd ed.; Gulf Professional Publishing: Waltham, MA, USA, 2011. [Google Scholar]
- Shiran, B.S.; Skauge, A. Wettability and Oil Recovery by Polymer and Polymer Particles. In Proceedings of the SPE Asia Pacific Enhanced Oil Recovery Conference, Kuala Lumpur, Malaysia, 11 August 2015; p. 12. [Google Scholar]
- Chang, H.L. Polymer Flooding Technology Yesterday, Today, and Tomorrow. J. Petroleum Technol. 1978, 30, 1113–1128. [Google Scholar] [CrossRef]
- Raney, K.H.; Ayirala, S.; Chin, R.W.; Verbeek, P. Surface and Subsurface Requirements for Successful Implementation of Offshore Chemical Enhanced Oil Recovery. SPE Prod. Operat. 2012, 27, 294–305. [Google Scholar] [CrossRef]
- Jain, T.; Sharma, A. New Frontiers In EOR Methodologies By Application Of Enzymes. In Proceedings of the SPE EOR Conference at Oil and Gas West Asia, Muscat, Oman, 16–18 April 2012. [Google Scholar]
- Mukherjee, S.; Garrido, G.I.; Prasad, D.; Behr, A.; Reimann, S.; Ernst, B. Injectivity, Propagation and Retention of Biopolymer Schizophyllan in Porous Media. In Proceedings of the SPE EOR Conference at Oil and Gas West Asia, Muscat, Oman, 26–28 March 2018. [Google Scholar]
- Loukopoulos-Kousis, V.; Chrysikopoulos, C.V. Use of GreenZyme® for remediation of porous media polluted with jet fuel JP–5. Environ. Technol. 2018, 1–10. [Google Scholar] [CrossRef]
- Wei, B.; Li, Q.; Jin, F.; Li, H.; Wang, C. The Potential of a Novel Nanofluid in Enhancing Oil Recovery. Energy Fuels 2016, 30, 2882–2891. [Google Scholar] [CrossRef]
- Molnes, S.N.; Mamonov, A.; Paso, K.G.; Strand, S.; Syverud, K. Investigation of a new application for cellulose nanocrystals: a study of the enhanced oil recovery potential by use of a green additive. Cellulose 2018, 25, 2289–2301. [Google Scholar] [CrossRef]
- Molnes, S.N.; Paso, K.G.; Strand, S.; Syverud, K.J.C. The effects of pH, time and temperature on the stability and viscosity of cellulose nanocrystal (CNC) dispersions: implications for use in enhanced oil recovery. Cellulose 2017, 24, 4479–4491. [Google Scholar] [CrossRef]
- Molnes, S.N.; Torrijos, I.P.; Strand, S.; Paso, K.G.; Syverud, K. Sandstone injectivity and salt stability of cellulose nanocrystals (CNC) dispersions—Premises for use of CNC in enhanced oil recovery. Ind. Crops Prod. 2016, 93, 152–160. [Google Scholar] [CrossRef]
- Aadland, R.; Dziuba, C.; Heggset, E.; Syverud, K.; Torsæter, O.; Holt, T.; Gates, I.; Bryant, S.J.N. Identification of Nanocellulose Retention Characteristics in Porous Media. Nanomaterials 2018, 8, 547. [Google Scholar] [CrossRef]
- Sveistrup, M.; van Mastrigt, F.; Norrman, J.; Picchioni, F.; Paso, K. Viability of Biopolymers for Enhanced Oil Recovery. Journal of Dispersion Science and Technology 2015, 1160–1169. [Google Scholar] [CrossRef]
- Jakobsen, T.D.; Simon, S.C.; Heggset, E.B.; Syverud, K.; Paso, K.G. Interactions between Surfactants and Cellulose Nanofibrils for Enhanced Oil Recovery. Ind. Eng. Chem. Res. 2018. [Google Scholar] [CrossRef]
- Dufresne, A. Nanocellulose: From Nature to High Performance Tailored Materials; Walter de Gruyter: Berlin, Germany, 2012. [Google Scholar]
- Klemm, D.; Heublein, B.; Fink, H.P.; Bohn, A. Cellulose: Fascinating biopolymer and sustainable raw material. Angew. Chem. Int. Ed. 2005, 44, 3358–3393. [Google Scholar] [CrossRef] [PubMed]
- Turbak, A.F.; Snyder, F.W.; Sandberg, K.R. Microfibrillated cellulose, a new cellulose product: Properties, uses and commercial potential. J. Appl. Polym. Sci. 1983, 37, 815–827. [Google Scholar]
- Herrick, F.W.; Casebier, R.L.; Hamilton, J.K.; Sandberg, K.R. Microfibrillated cellulose: morphology and accessibility. J. Appl. Polym. Sci. Appl. Polym.Symp. 1983, 37, 797–813. [Google Scholar]
- Rånby, B.G. Aqueous Colloidal Solutions of Cellulose Micelles. Acta Chem. Scand. 1949, 649–650. [Google Scholar]
- Rånby, B.G.; Ribi, E. Über den Feinbau der Zellulose. Experientia 1950, 6, 12–14. [Google Scholar] [CrossRef]
- Klemm, D.; Kramer, F.; Moritz, S.; Lindström, T.; Ankerfors, M.; Gray, D.; Dorris, A. Nanocelluloses: A New Family of Nature–Based Materials. Angew. Chem. Int. Ed. 2011, 50, 5438–5466. [Google Scholar] [CrossRef]
- Heggset, E.B.; Chinga–Carrasco, G.; Syverud, K. Temperature stability of nanocellulose dispersions. Carbohydr. Polym. 2017, 157, 114–121. [Google Scholar] [CrossRef]
- Dong, X.M.; Revol, J.-F.; Gray, D.G. Effect of microcrystallite preparation conditions on the formation of colloid crystals of cellulose. Cellulose 1998, 5, 19–32. [Google Scholar] [CrossRef]
- Lahiji, R.R.; Xu, X.; Reifenberger, R.; Raman, A.; Rudie, A.; Moon, R.J. Atomic Force Microscopy Characterization of Cellulose Nanocrystals. Langmuir 2010, 26, 4480–4488. [Google Scholar] [CrossRef]
- Abidin, A.; Puspasari, T.; Nugroho, W.J.P.C. Polymers for enhanced oil recovery technology. Proc. Chem. 2012, 4, 11–16. [Google Scholar] [CrossRef]
- Seright, R. Potential for polymer flooding reservoirs with viscous oils. Soc. Petroleum Eng. 2010, 13, 730–740. [Google Scholar]


| Fluid | Density (g/cm3) | Viscosity (cP) | ||||
|---|---|---|---|---|---|---|
| 20 °C | 60 °C | 120 °C | 20 °C | 60 °C | 120 °C | |
| Isopar L | 0.76 | 0.73 | — | 1.33 | 0.72 | — |
| 20/80% isopar L/HVP oil | 0.87 | — | — | 121.50 | — | — |
| Crude oil | 0.91 | 0.89 | 0.85 | 55.90 | 12.19 | 3.32 |
| 0.1 wt. % NaCl | 1.00 | 0.98 | 0.94 | 0.91 | 0.47 | 0.23 |
| 1 wt. % CNC in 0.1 wt. % NaCl | 1.00 | — | — | 1.40 | 1.09 | — |
| Stage | Fluid | Temp. Core | Flow Rate | PV Injected | OOIP | Swi |
|---|---|---|---|---|---|---|
| (°C) | (mL/min) | (mL) | (%) | |||
| 1 | Isopar L | 21 | 1.3 | 3.2 | 91.0 | 36 |
| 2 | 20/80% isopar L/HVP oil | 21 | 2.1 | 7.0 | 110.4 | 22 |
| 3 | 20/80% isopar L/HVP oil | 21 | 8.5 | 17.1 | 120.5 | 15 |
| 4 | Crude oil | 60 | 2.0 | 5.0 | 120.5 | 15 |
| Stage | Rate | PV Injected | Total RF | RF for Each Stage | Total Sor |
|---|---|---|---|---|---|
| (mL/min) | (%) | (%) | |||
| Water flood (low rate) | 0.1 | 7.4 | 60.80 | 60.80 | 0.33 |
| Water flood (high rate) | 0.5 | 0.5 | 61.00 | 0.21 | 0.33 |
| Nano flood (low rate) | 0.1 | 7.5 | 61.93 | 0.92 | 0.32 |
| Nano flood (low rate, after shut-in) | 0.1 | 2.0 | 62.07 | 0.14 | 0.32 |
| Nano flood (high rate, pump fail) | 0.3 | 0.4 | 62.07 | 0.00 | 0.32 |
| Nano flood (low rate, after pump fail) | 0.1 | 4.0 | 62.16 | 0.09 | 0.32 |
| Nano flood (high rate 1) | 0.3 | 0.5 | 62.19 | 0.02 | 0.32 |
| Nano flood (high rate 2) | 0.5 | 0.5 | 62.16 | 0.00 | 0.32 |
| Nano flood (high rate 3) | 1.0 | 0.7 | 62.19 | 0.00 | 0.32 |
| Post flush | 0.5 | 4.8 | 62.19 | 0.00 | 0.32 |
| Flow Rate (mL/min) | Shear Rate (s−1) | Unaged CNC | Aged CNC | Effluent | ||
|---|---|---|---|---|---|---|
| 0 h | 18 h | 24 h | Lowest visc. | Highest visc. | ||
| 0.1 1 | 3.1 | 0.04 | 6.24 | 5.07 | 0.02 | 0.04 |
| 32 | 0.03 | 0.96 | 0.98 | 0.03 | 0.06 | |
| Flow Rate | Shear Rate in Core |
|---|---|
| (mL/min) | (s−1) |
| 0.1 | 3.2 |
| 0.3 | 9.7 |
| 0.5 | 16.1 |
| 1.0 | 32.2 |
© 2019 by the authors. Licensee MDPI, Basel, Switzerland. This article is an open access article distributed under the terms and conditions of the Creative Commons Attribution (CC BY) license (http://creativecommons.org/licenses/by/4.0/).
Share and Cite
Aadland, R.C.; Jakobsen, T.D.; Heggset, E.B.; Long-Sanouiller, H.; Simon, S.; Paso, K.G.; Syverud, K.; Torsæter, O. High-Temperature Core Flood Investigation of Nanocellulose as a Green Additive for Enhanced Oil Recovery. Nanomaterials 2019, 9, 665. https://doi.org/10.3390/nano9050665
Aadland RC, Jakobsen TD, Heggset EB, Long-Sanouiller H, Simon S, Paso KG, Syverud K, Torsæter O. High-Temperature Core Flood Investigation of Nanocellulose as a Green Additive for Enhanced Oil Recovery. Nanomaterials. 2019; 9(5):665. https://doi.org/10.3390/nano9050665
Chicago/Turabian StyleAadland, Reidun C., Trygve D. Jakobsen, Ellinor B. Heggset, Haili Long-Sanouiller, Sébastien Simon, Kristofer G. Paso, Kristin Syverud, and Ole Torsæter. 2019. "High-Temperature Core Flood Investigation of Nanocellulose as a Green Additive for Enhanced Oil Recovery" Nanomaterials 9, no. 5: 665. https://doi.org/10.3390/nano9050665
APA StyleAadland, R. C., Jakobsen, T. D., Heggset, E. B., Long-Sanouiller, H., Simon, S., Paso, K. G., Syverud, K., & Torsæter, O. (2019). High-Temperature Core Flood Investigation of Nanocellulose as a Green Additive for Enhanced Oil Recovery. Nanomaterials, 9(5), 665. https://doi.org/10.3390/nano9050665