Effective La-Na Co-Doped TiO2 Nano-Particles for Dye Adsorption: Synthesis, Characterization and Study on Adsorption Kinetics


Abstract
:1. Introduction
2. Experimental Section
2.1. Synthesis Method
2.2. Characterization
2.3. Adsorption Studies
3. Results and Discussion
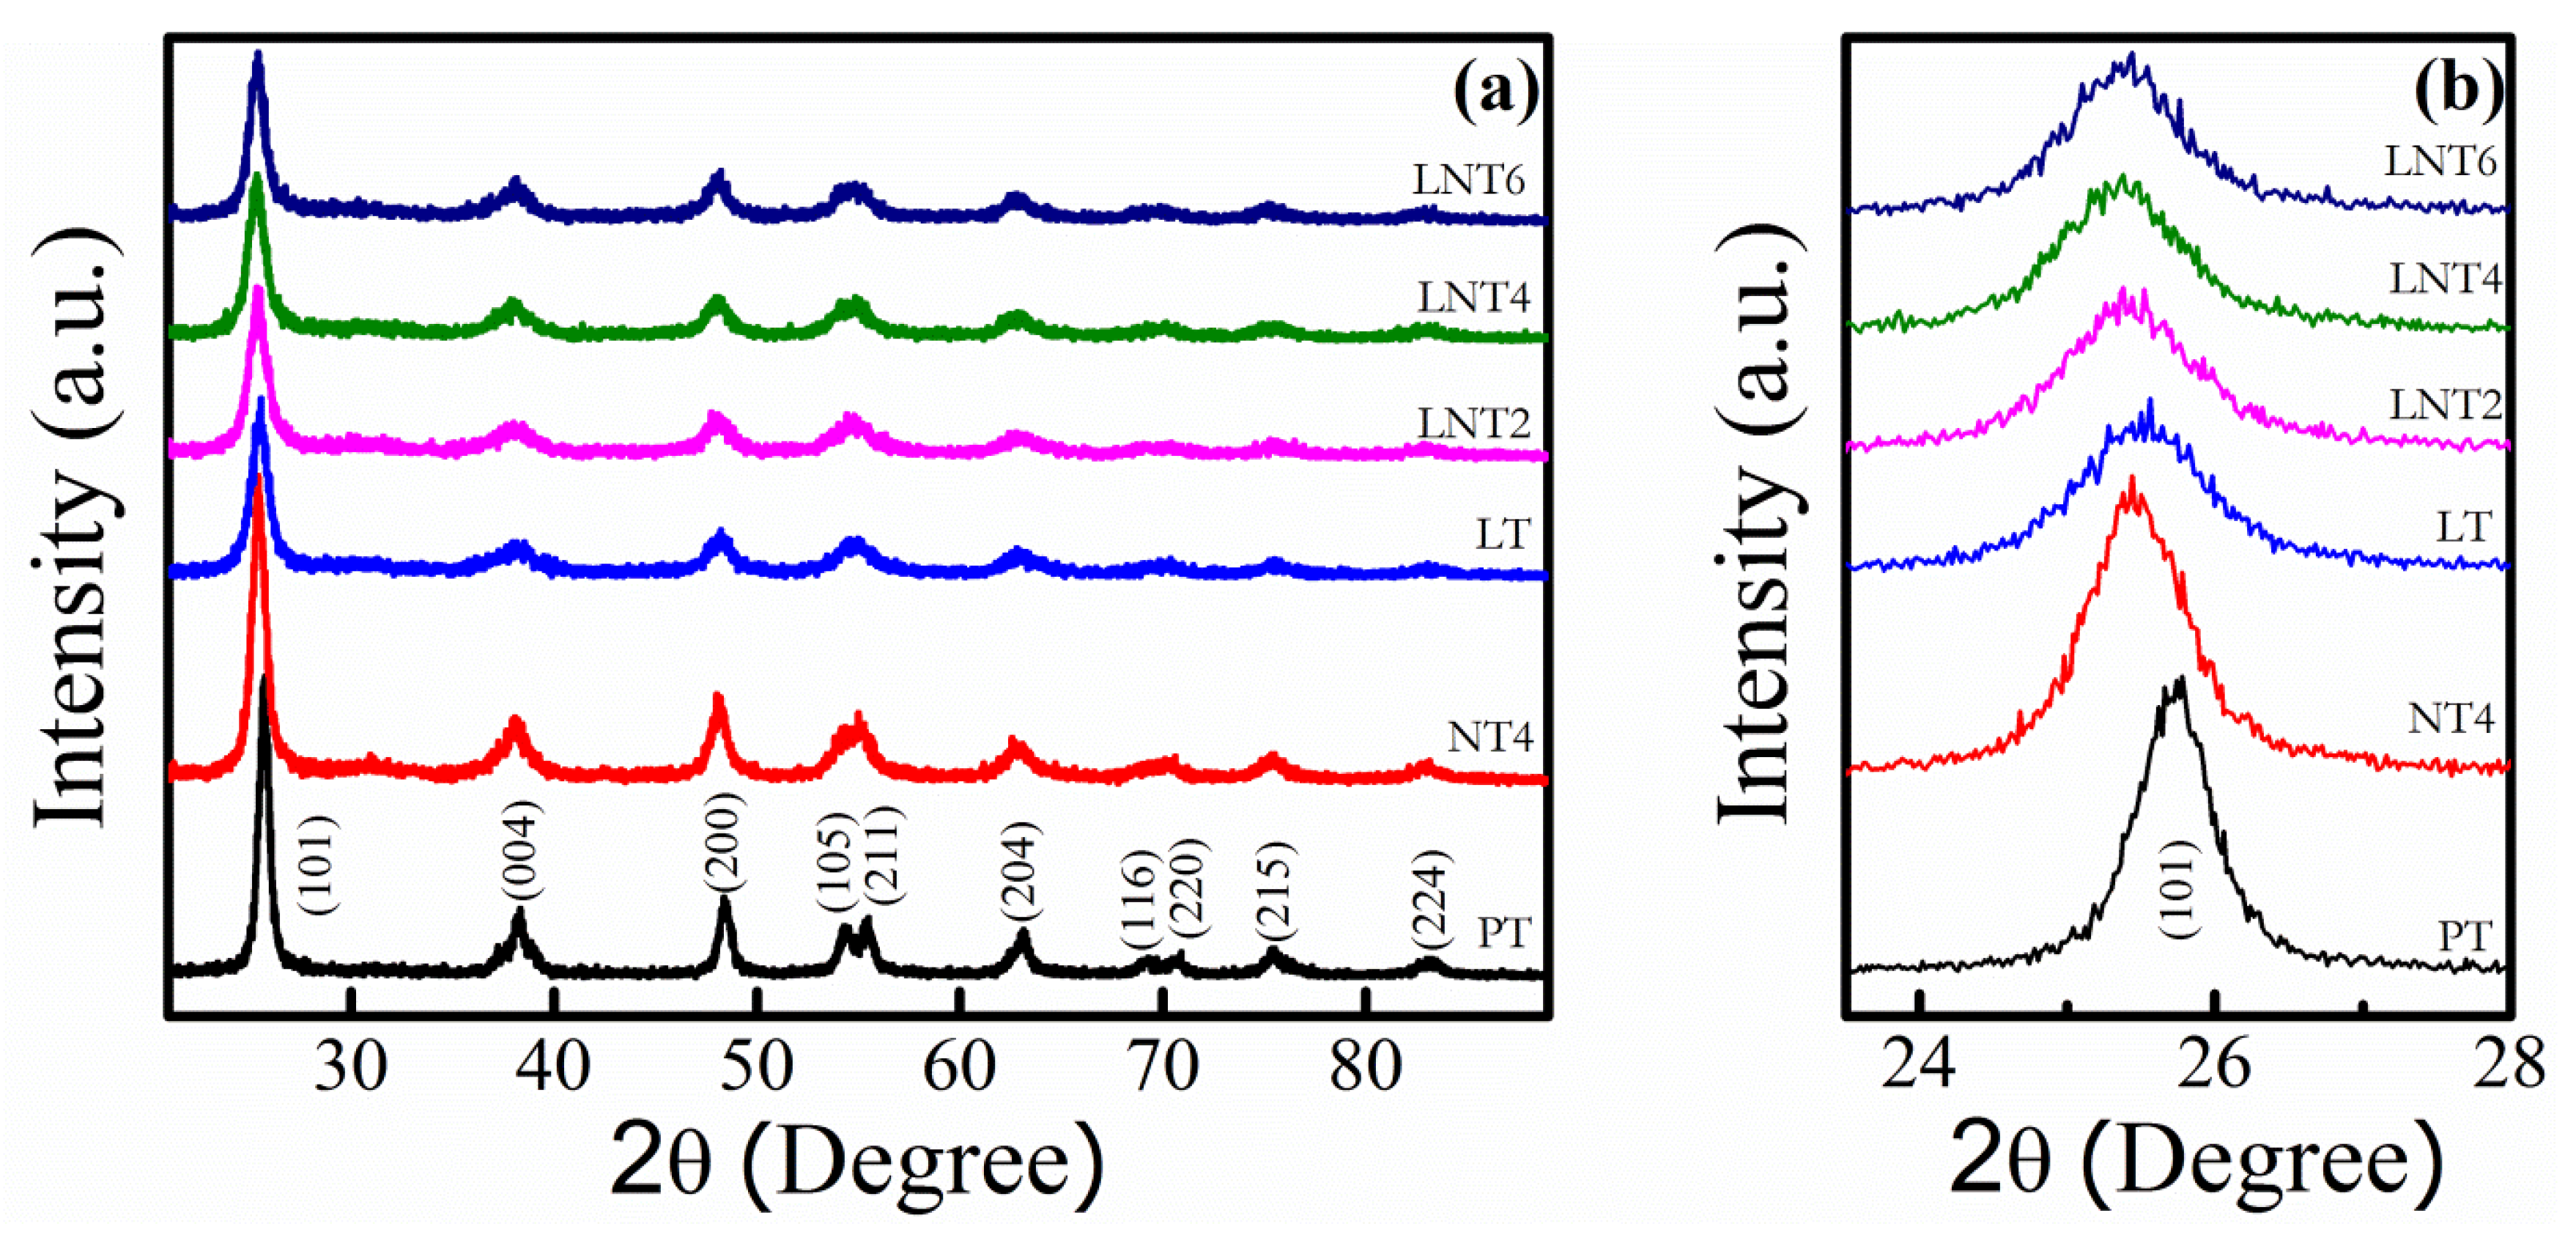
3.1. XRD Analysis
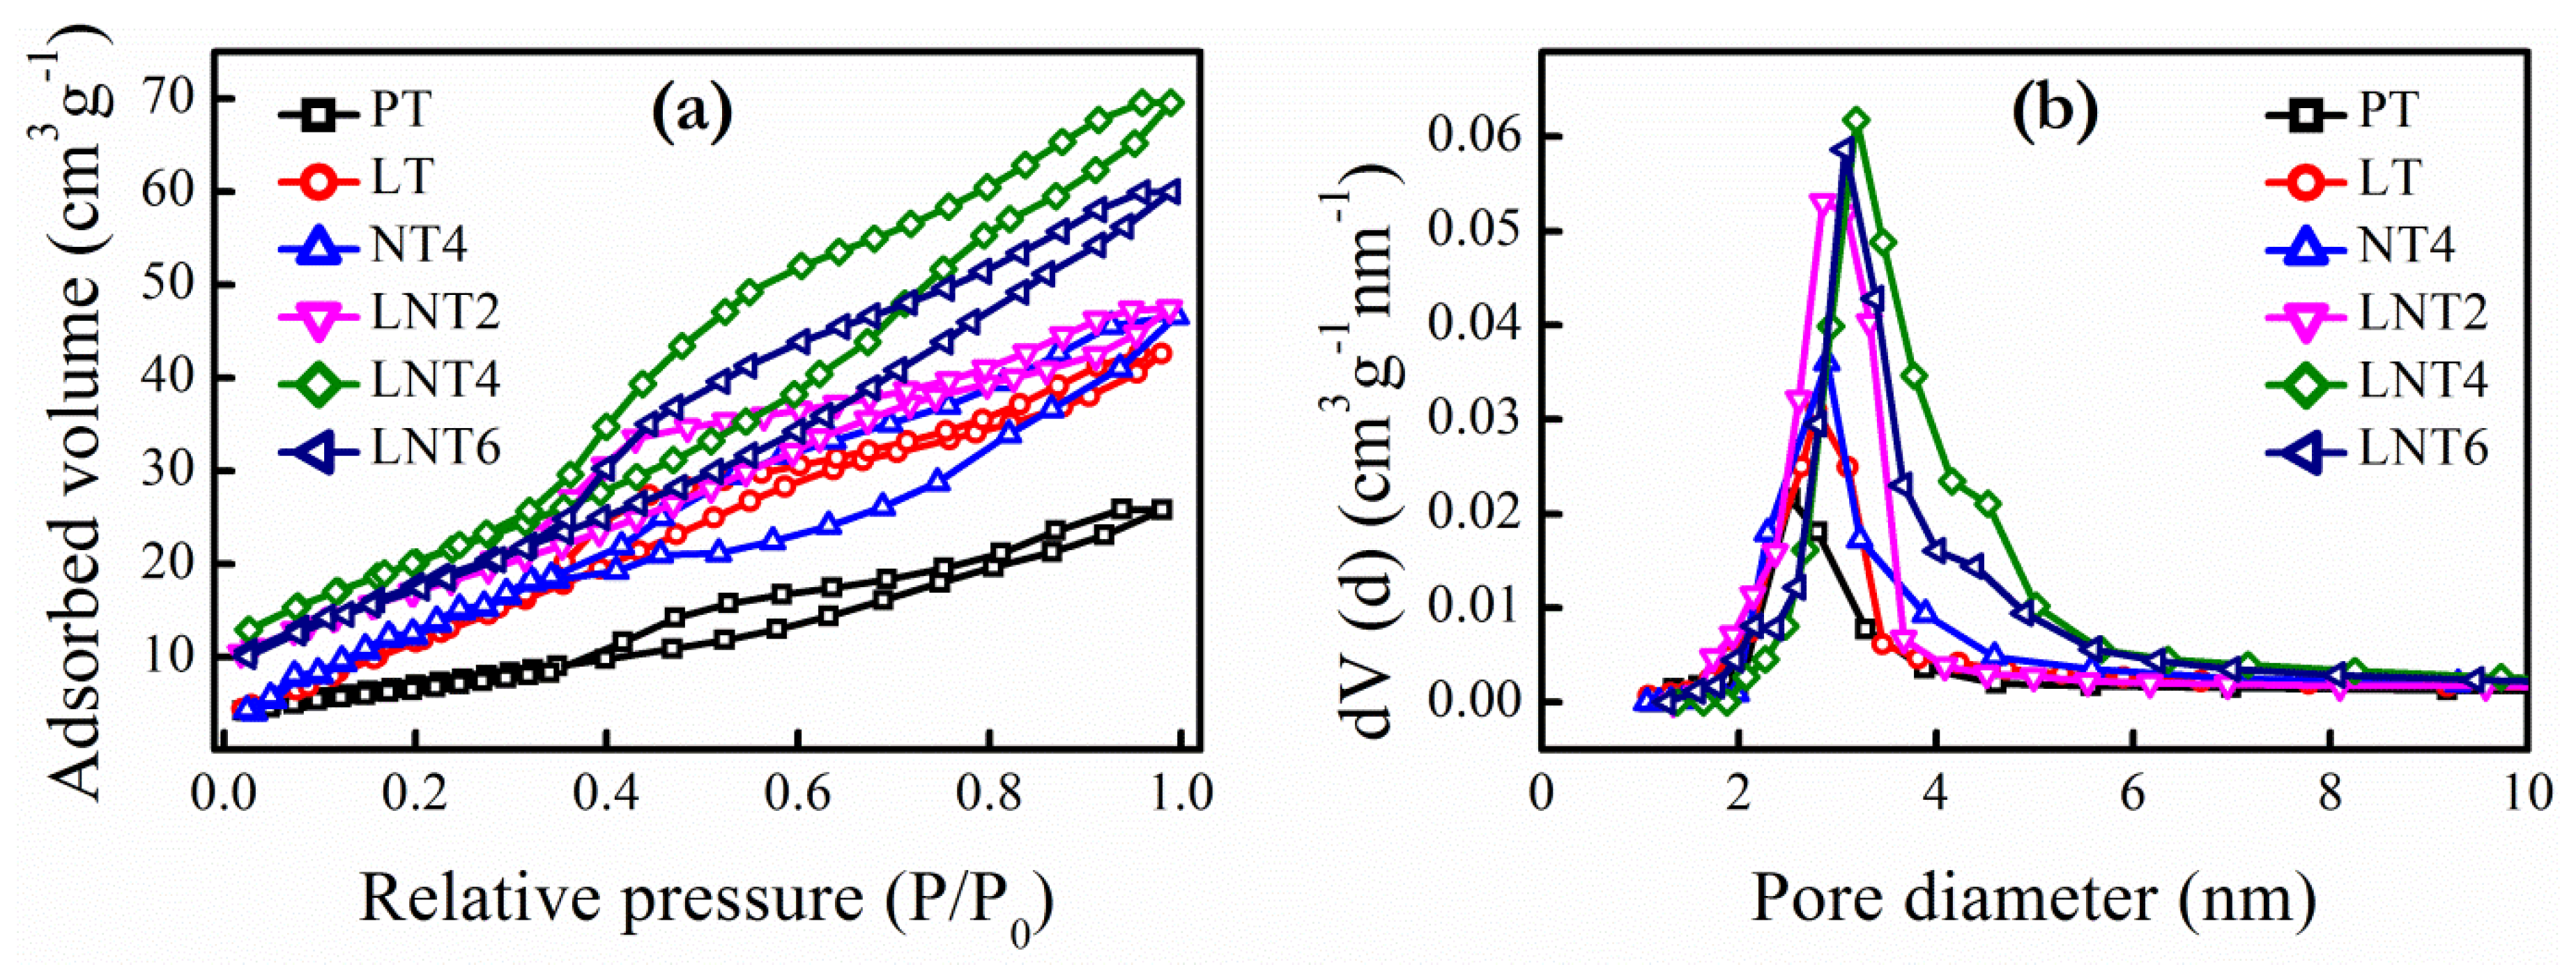
3.2. BET Surface Areas and Pore Size
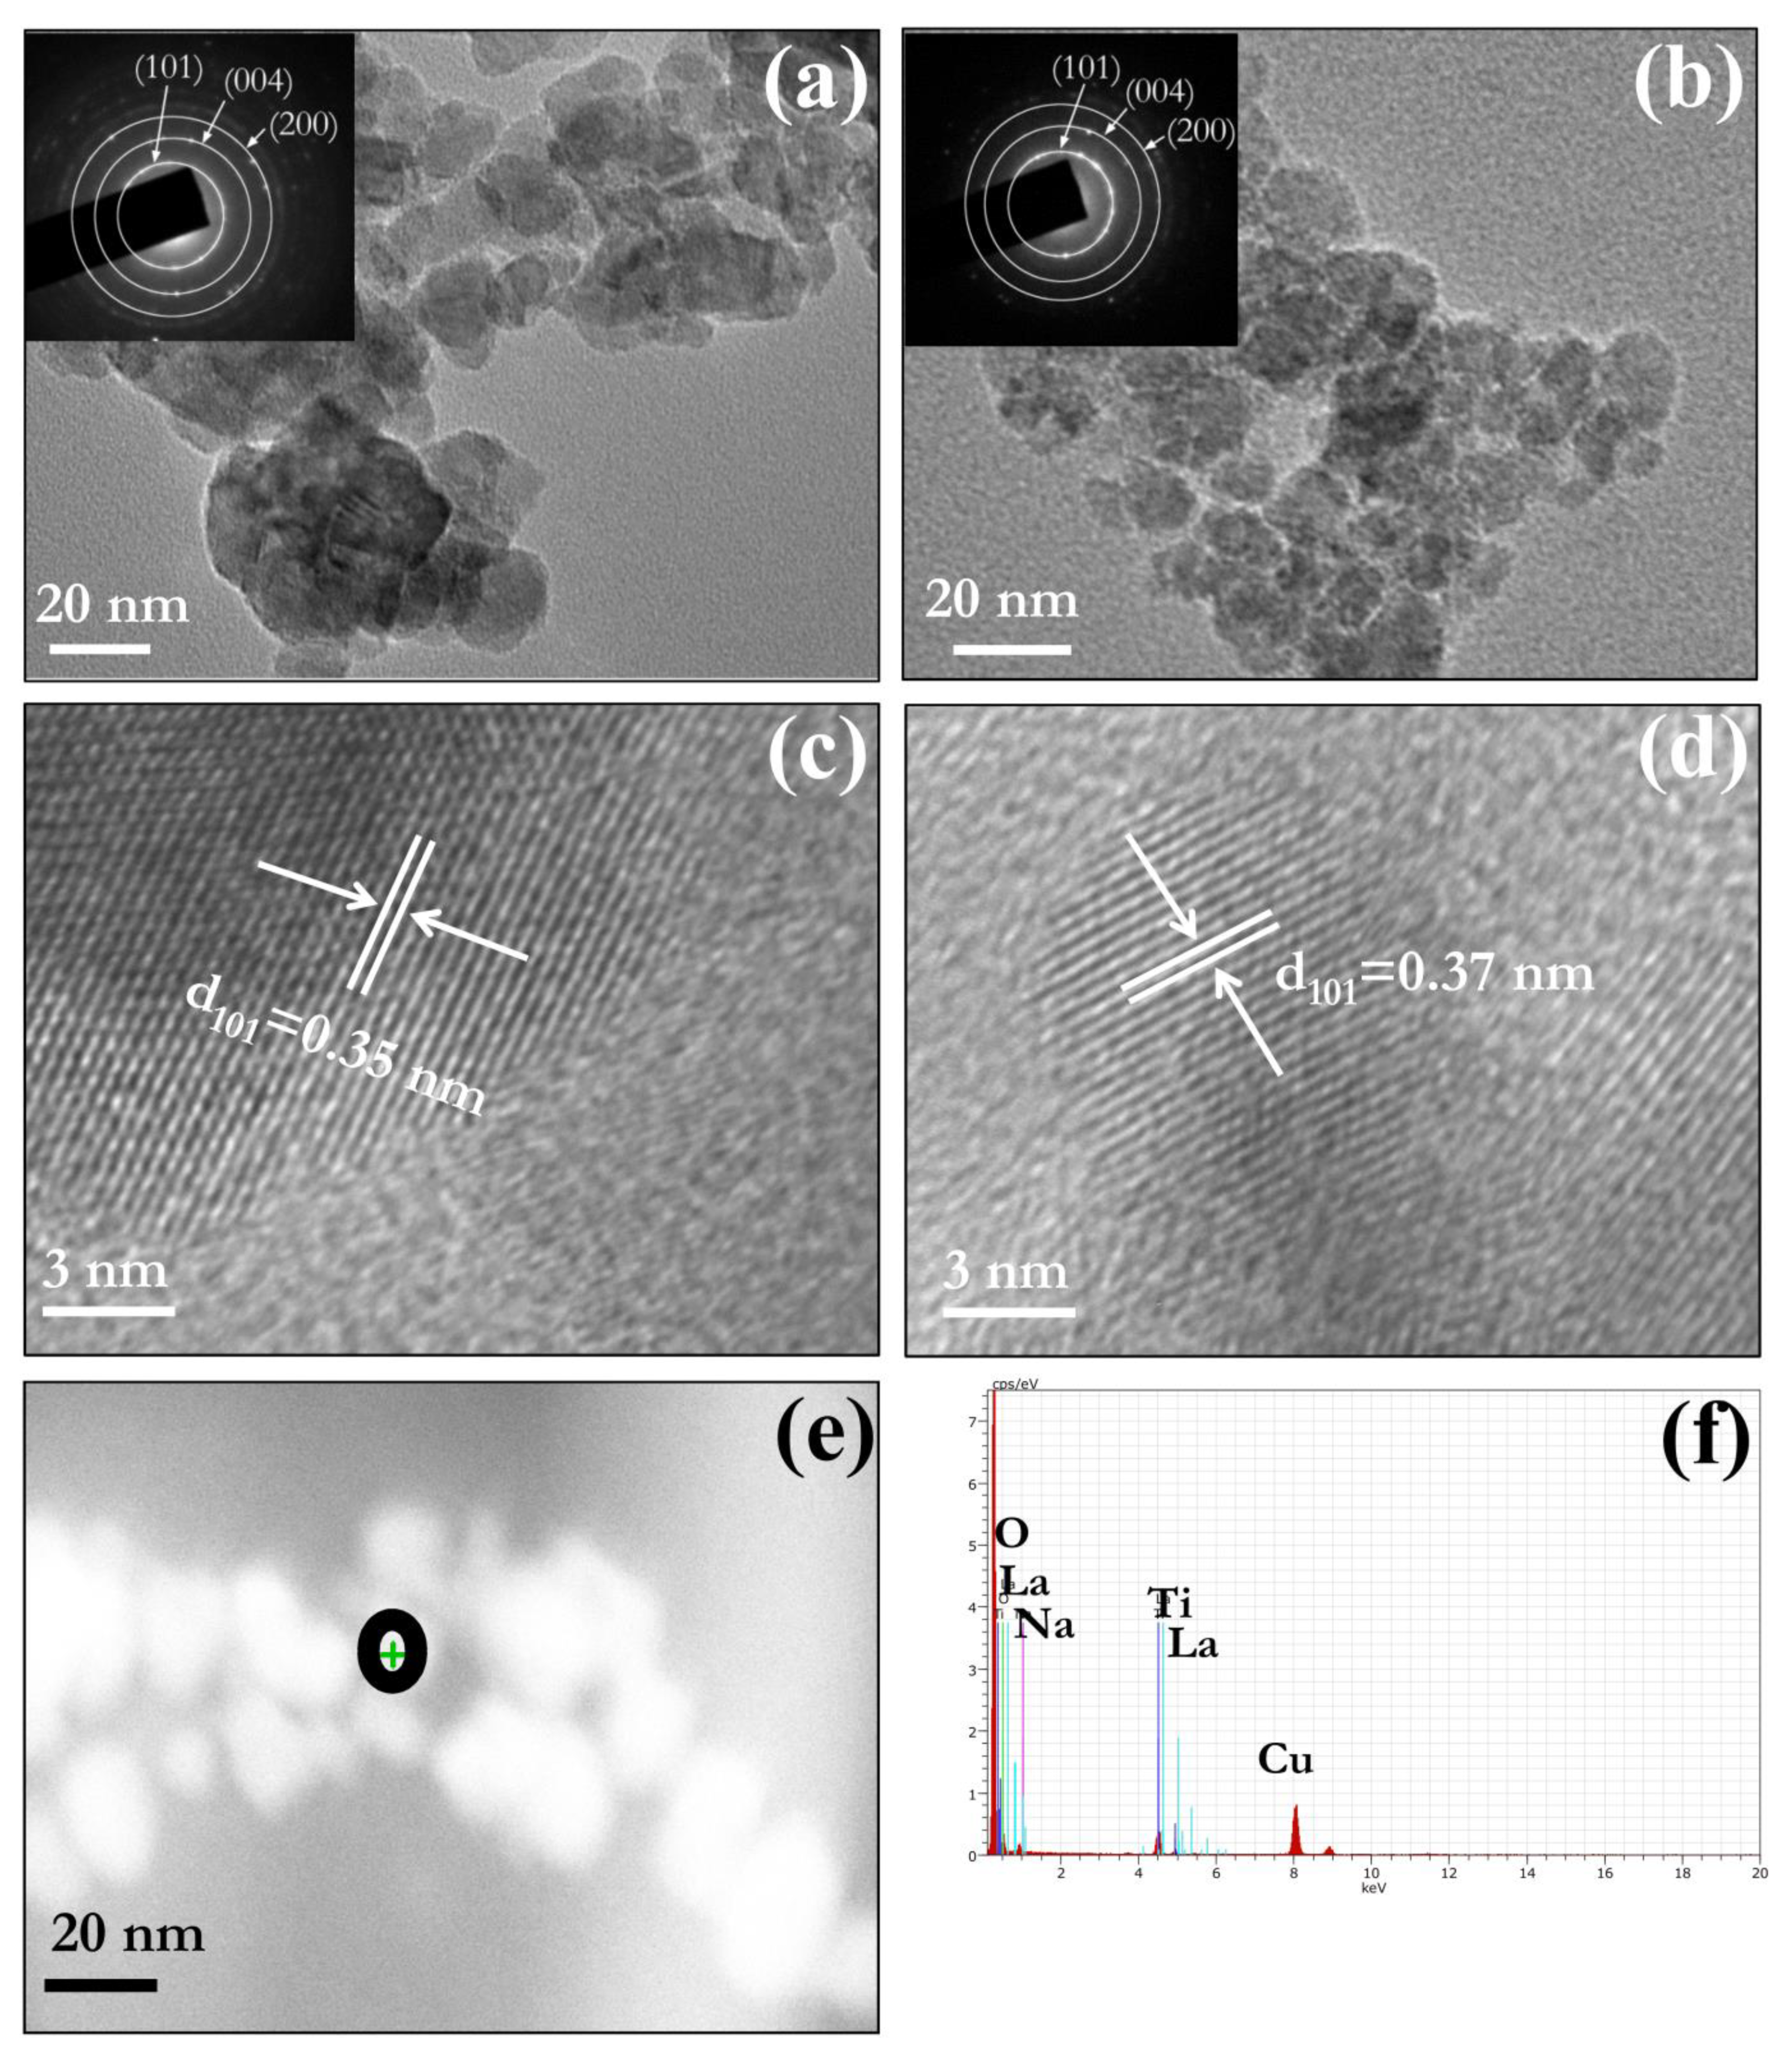
3.3. Morphology
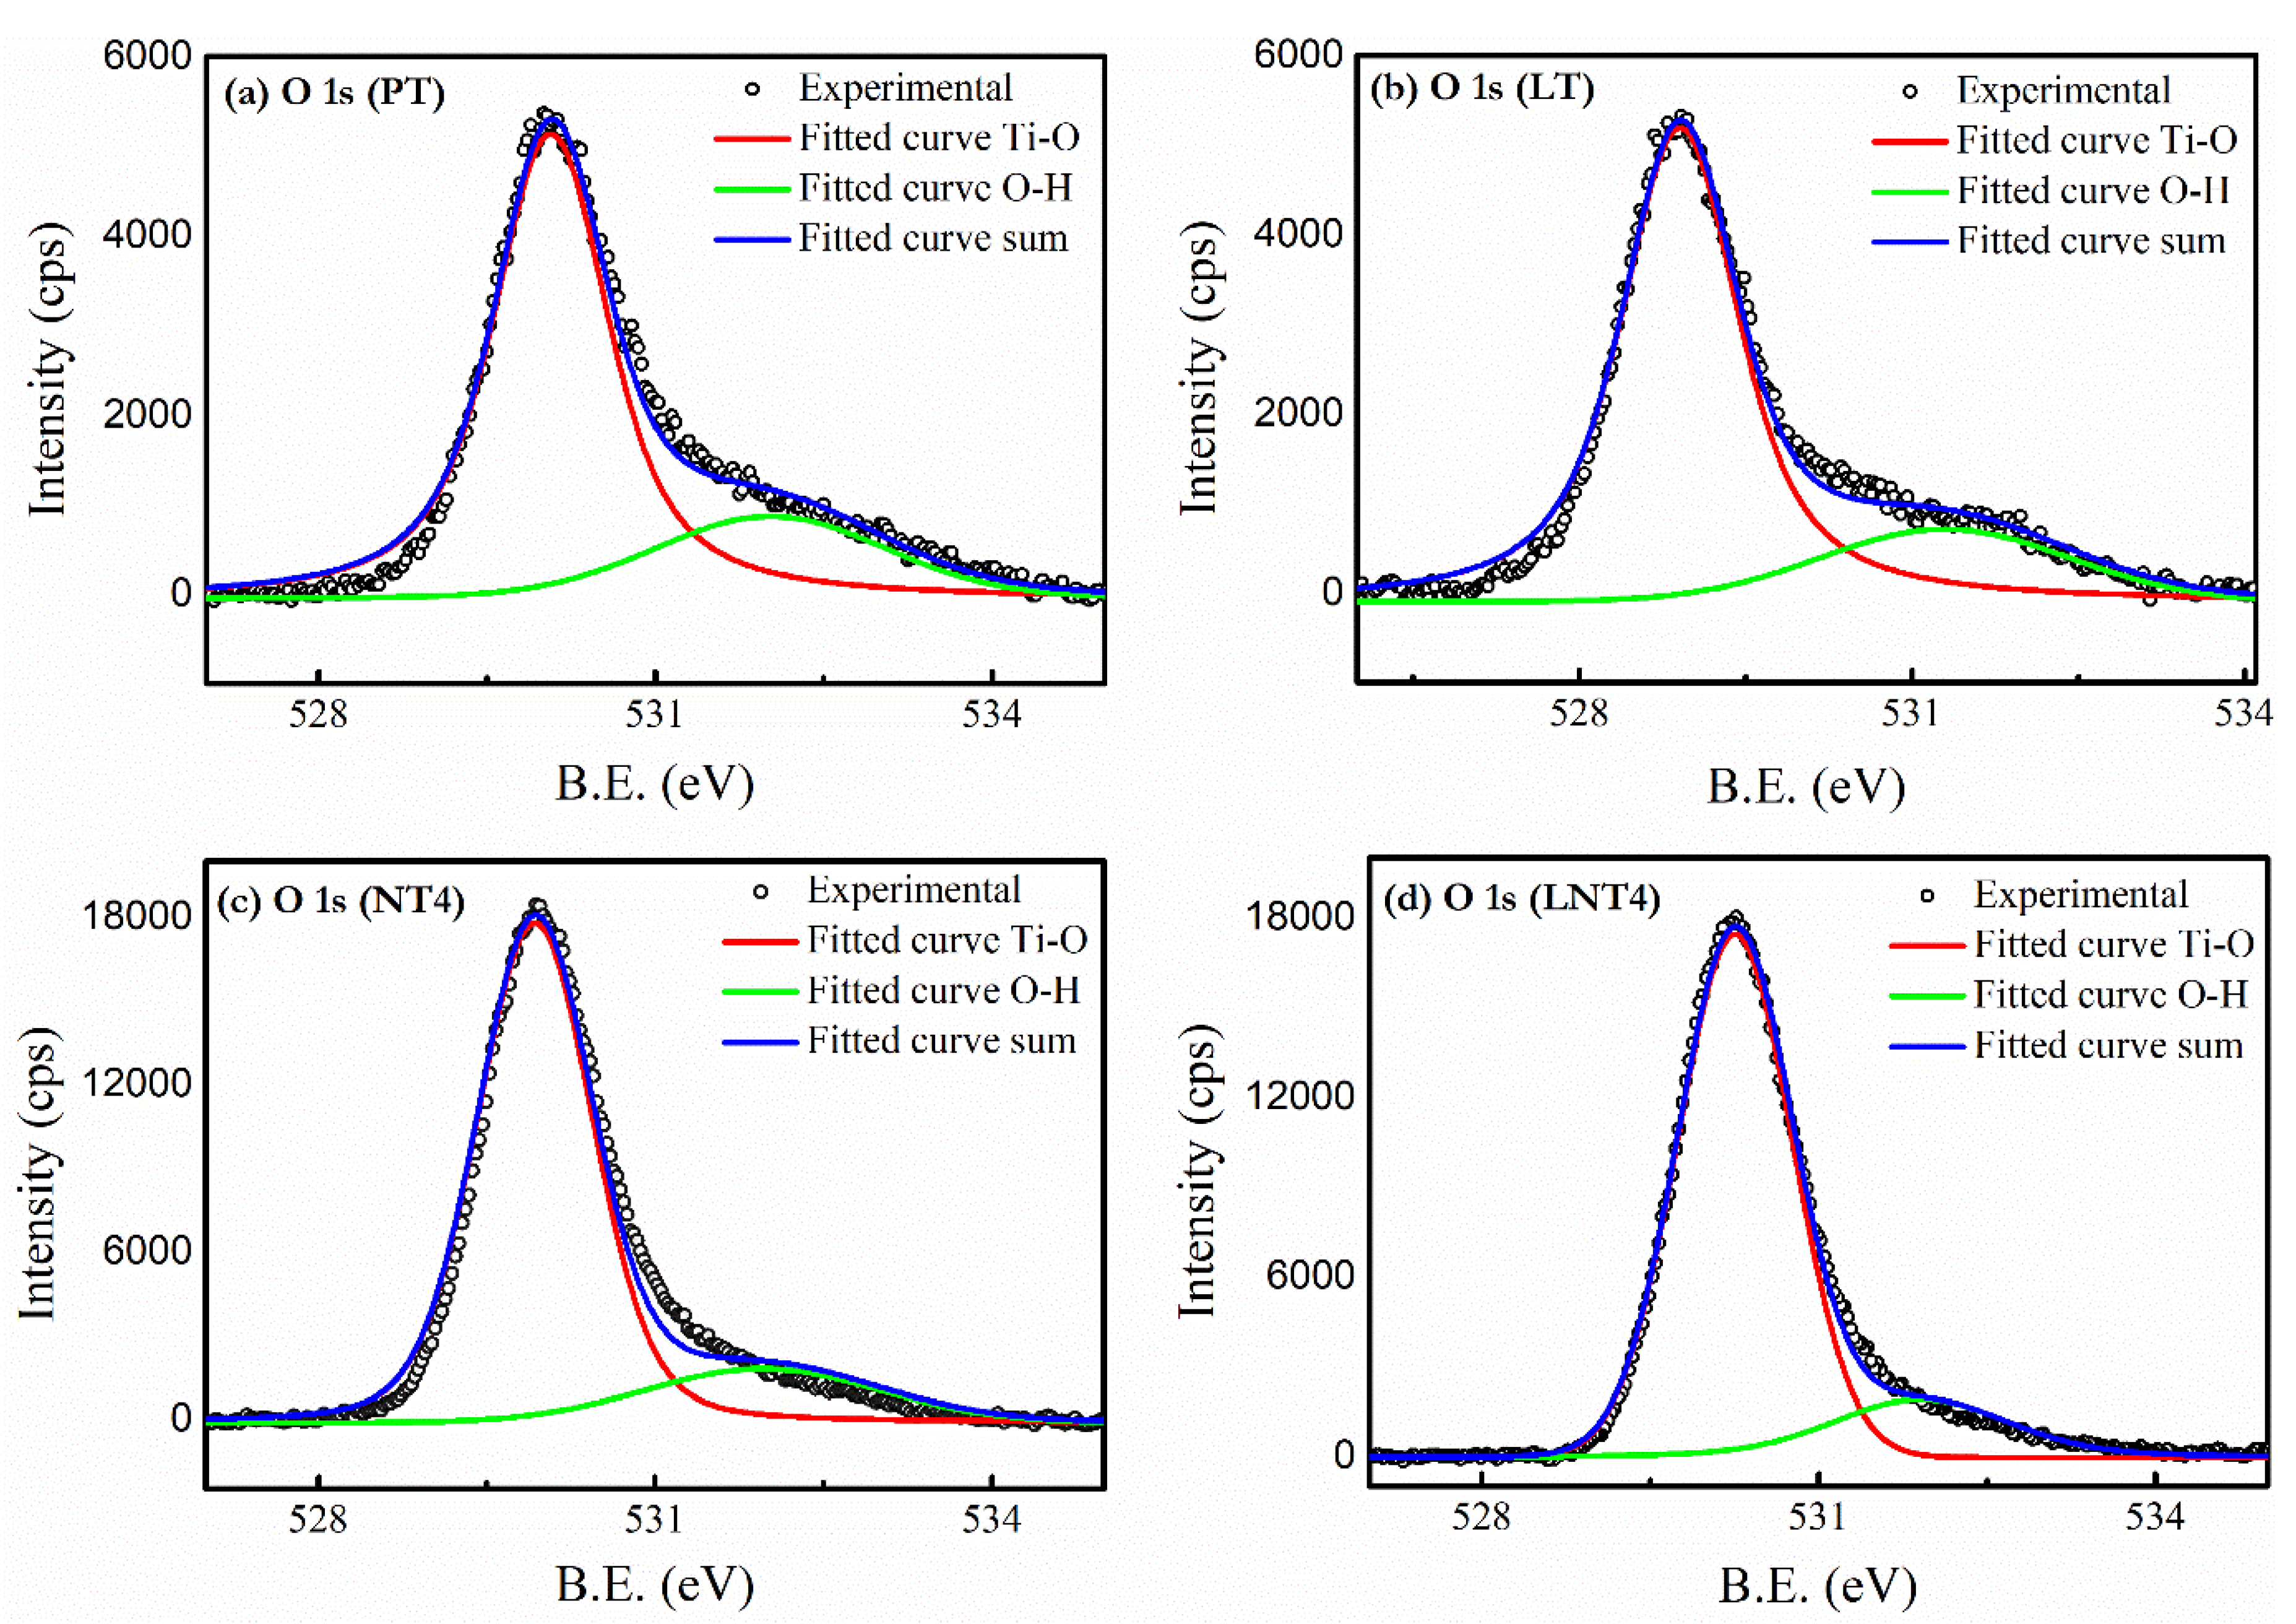
3.4. XPS Analysis
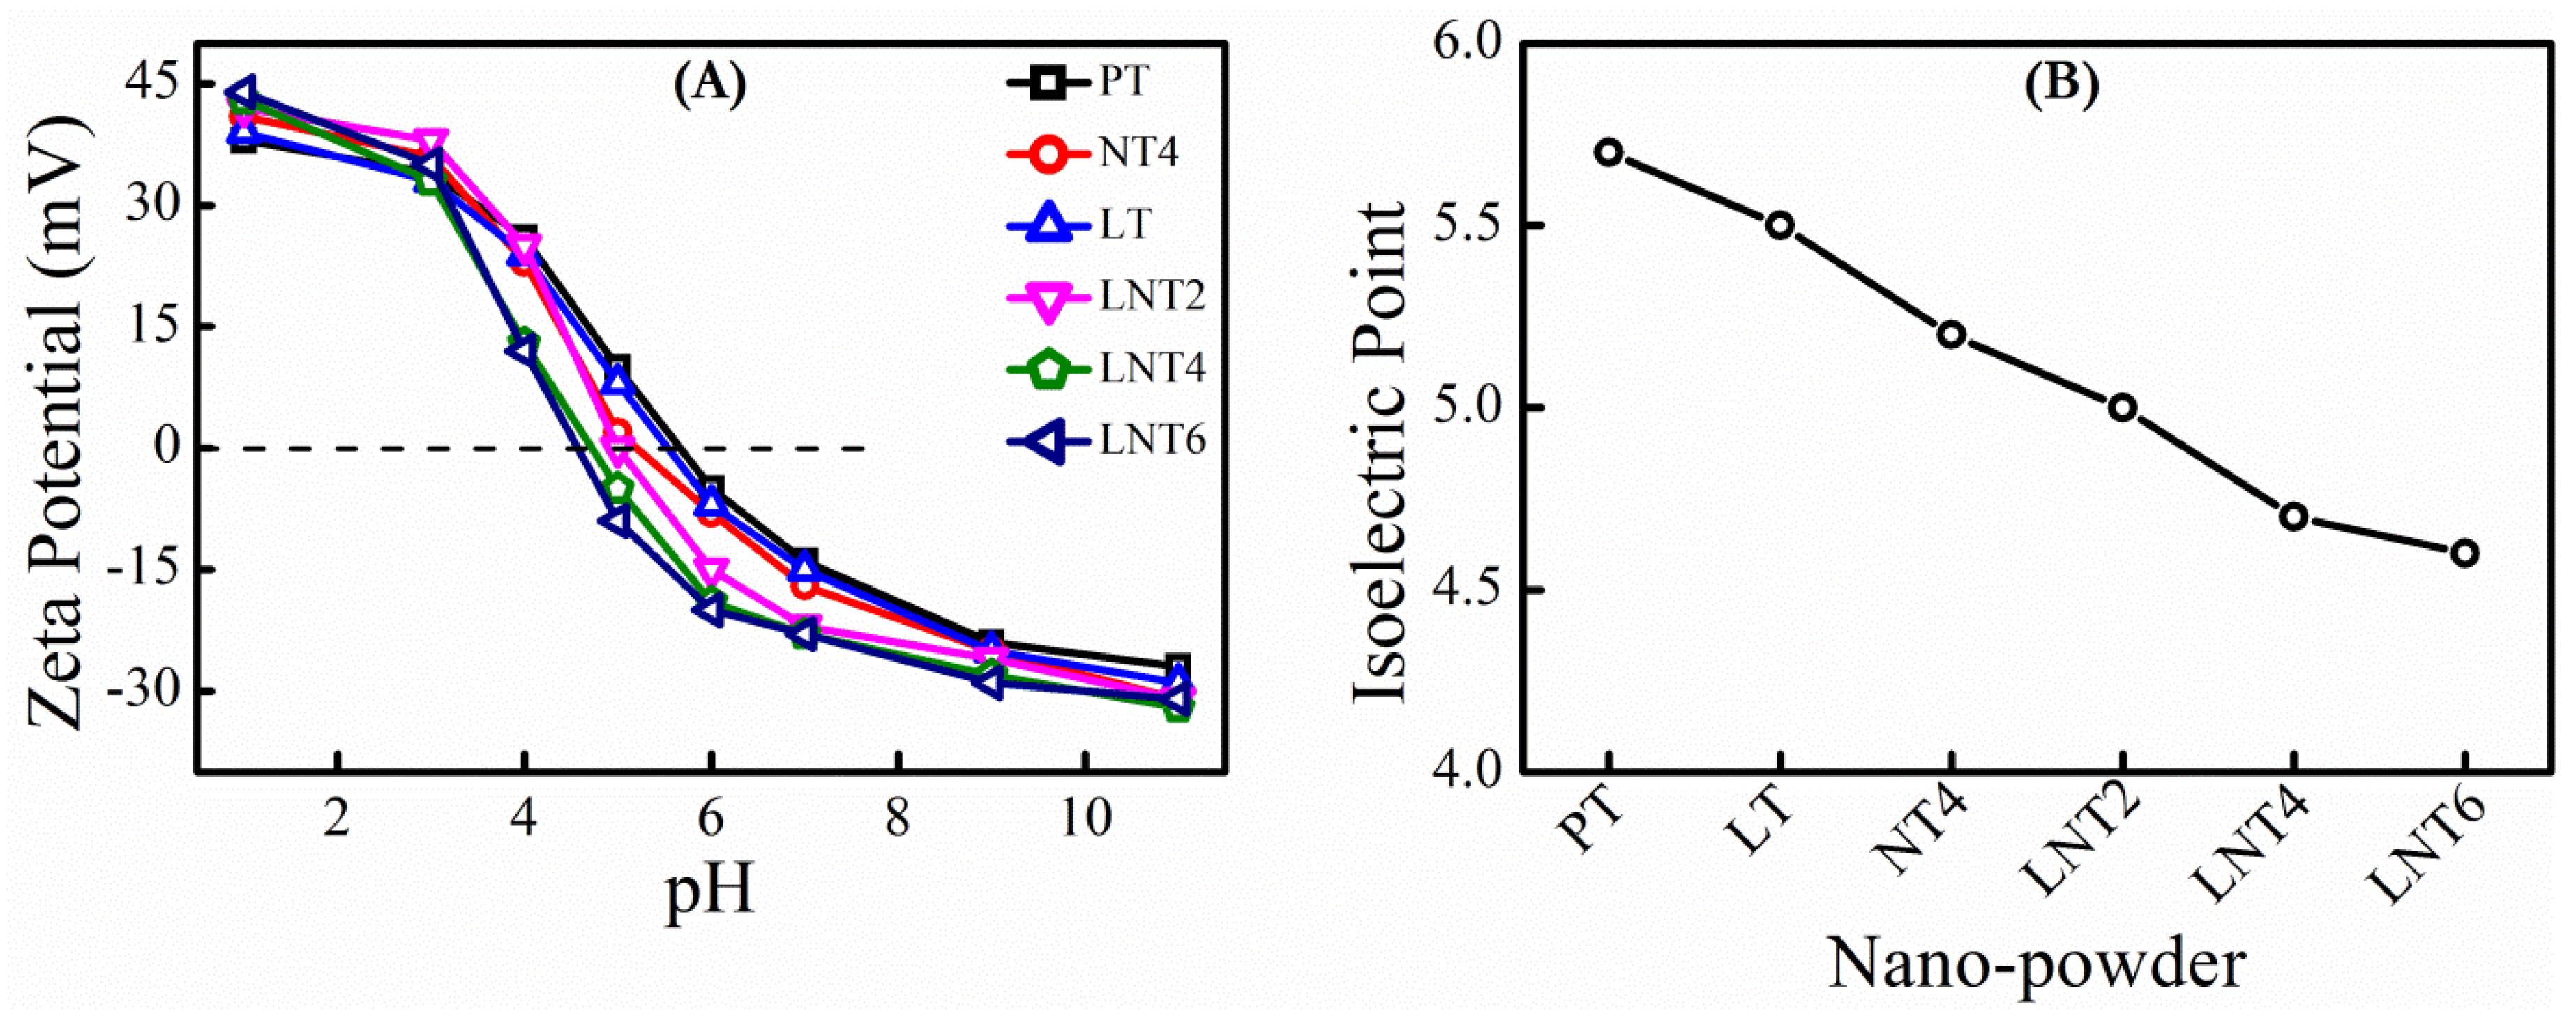
3.5. Zeta Potential Study and Isoelectric Point
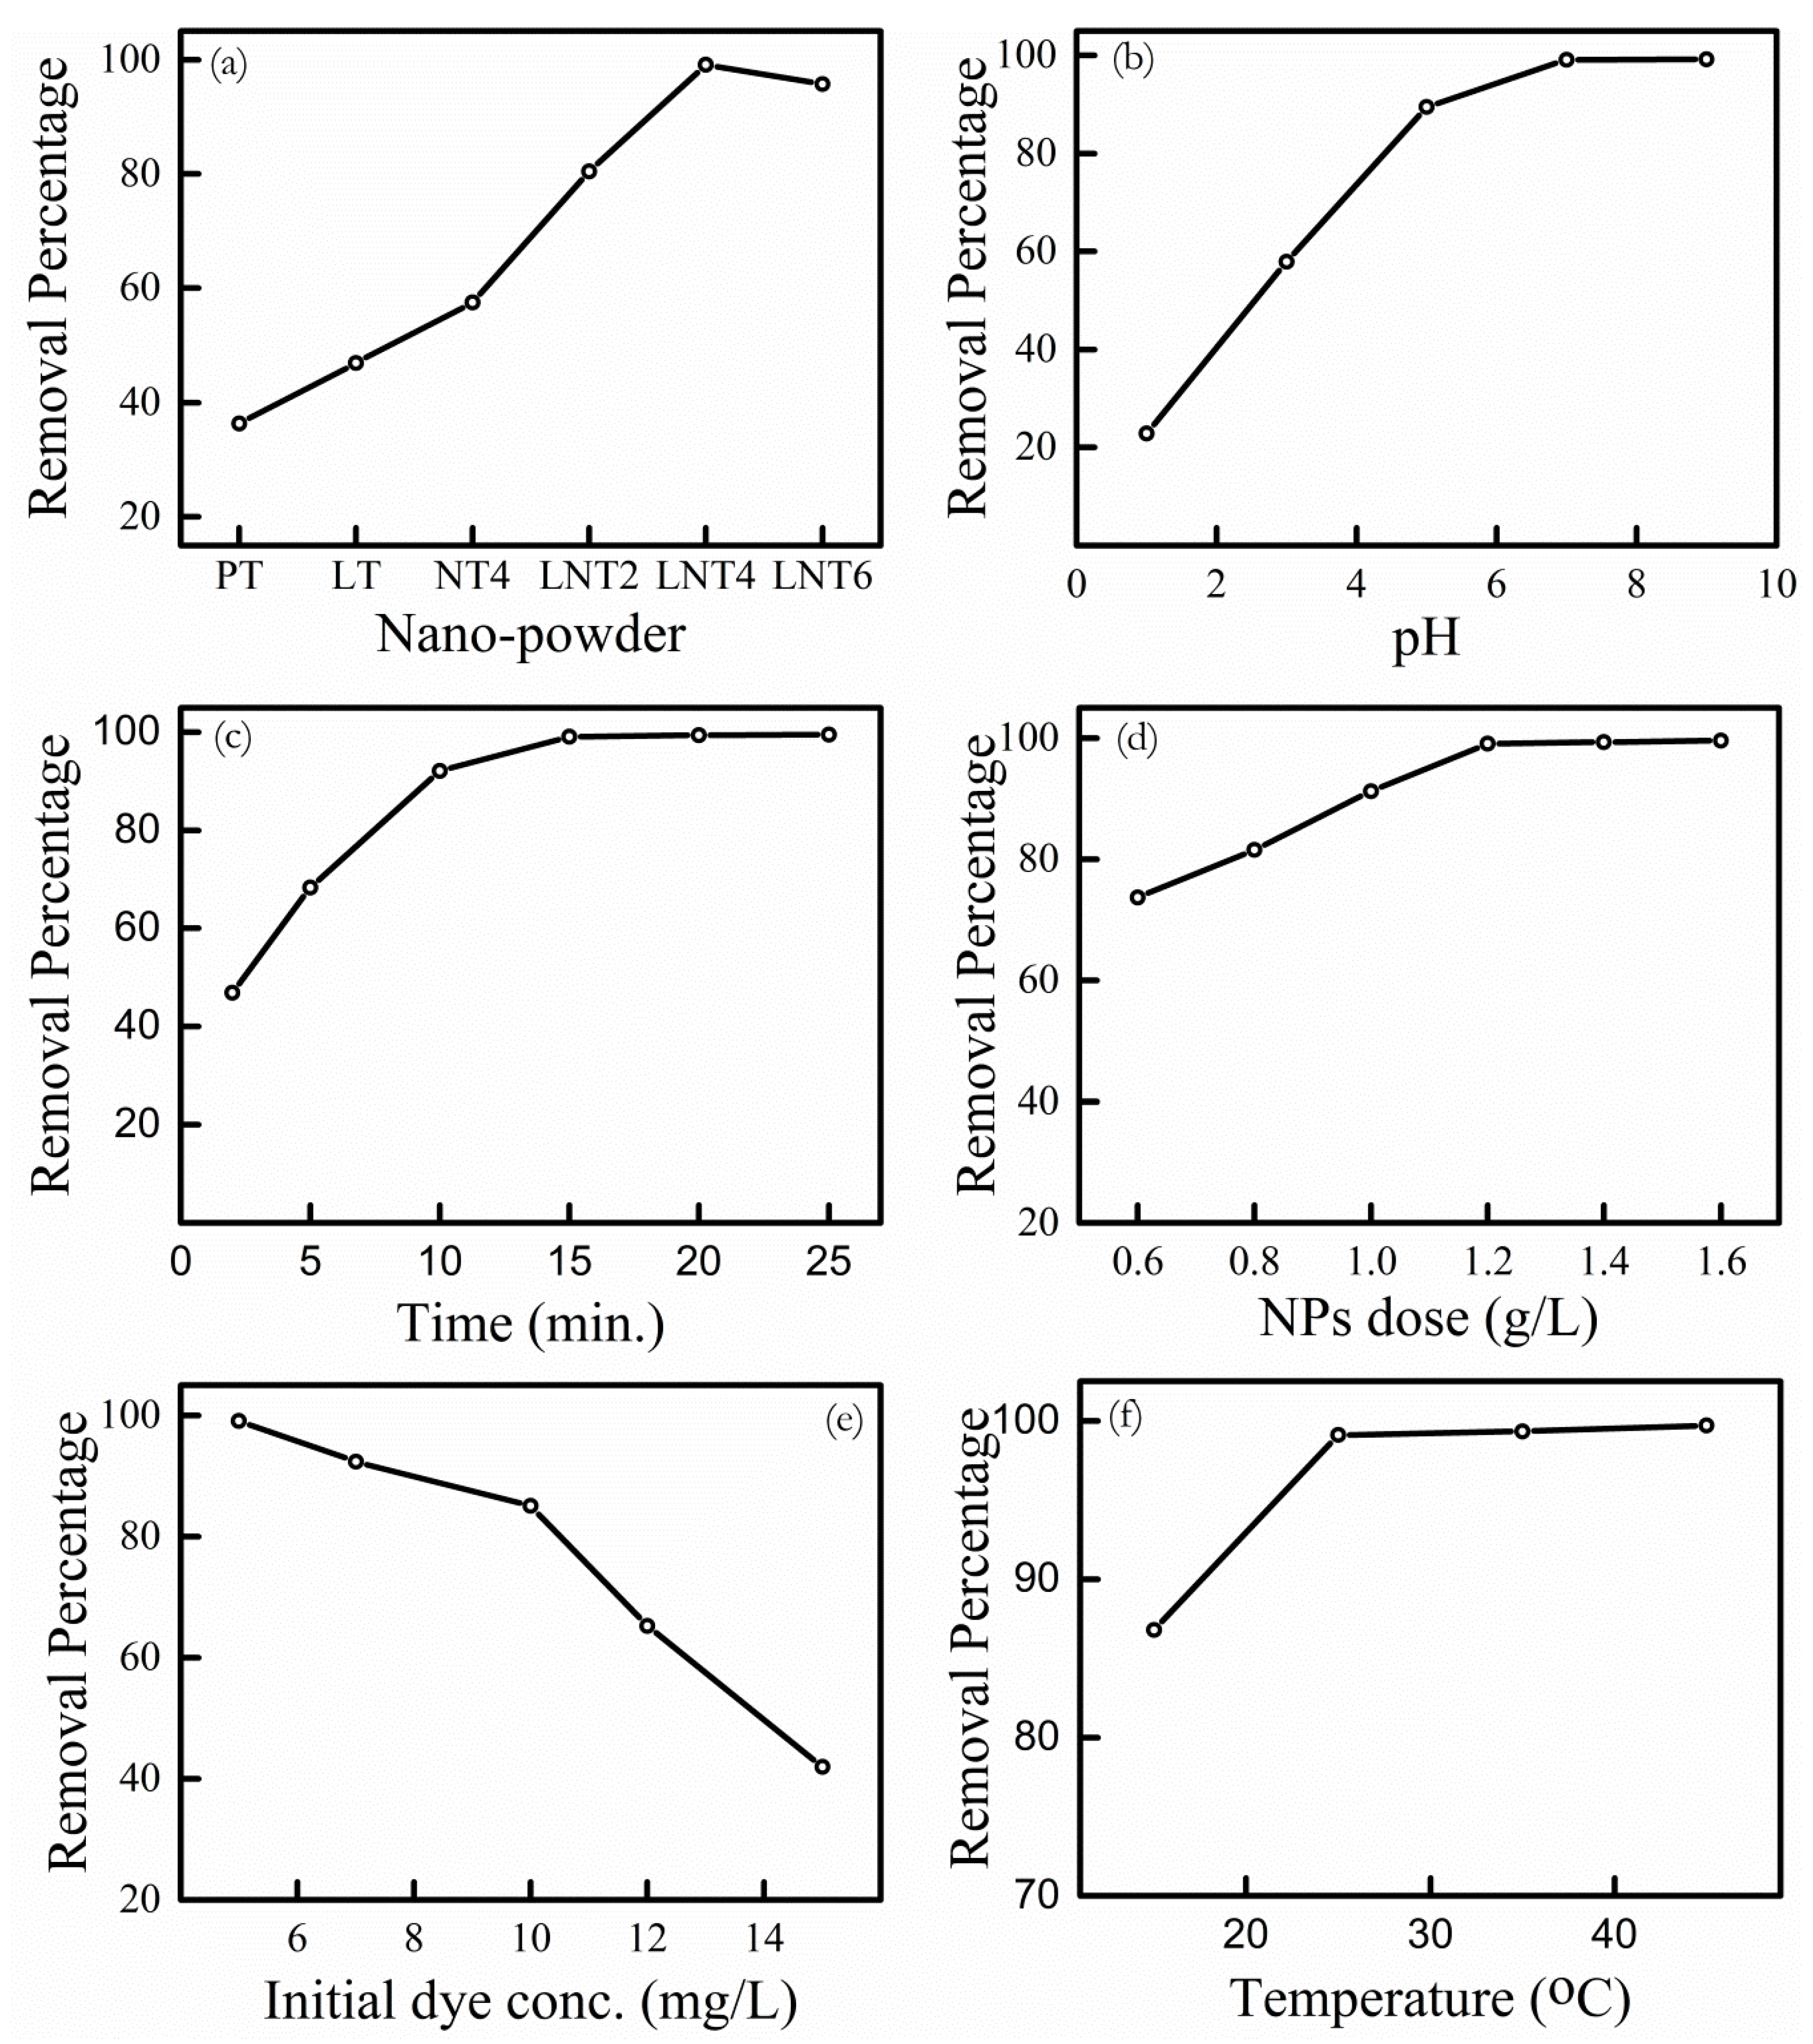
3.6. Adsorption Studies
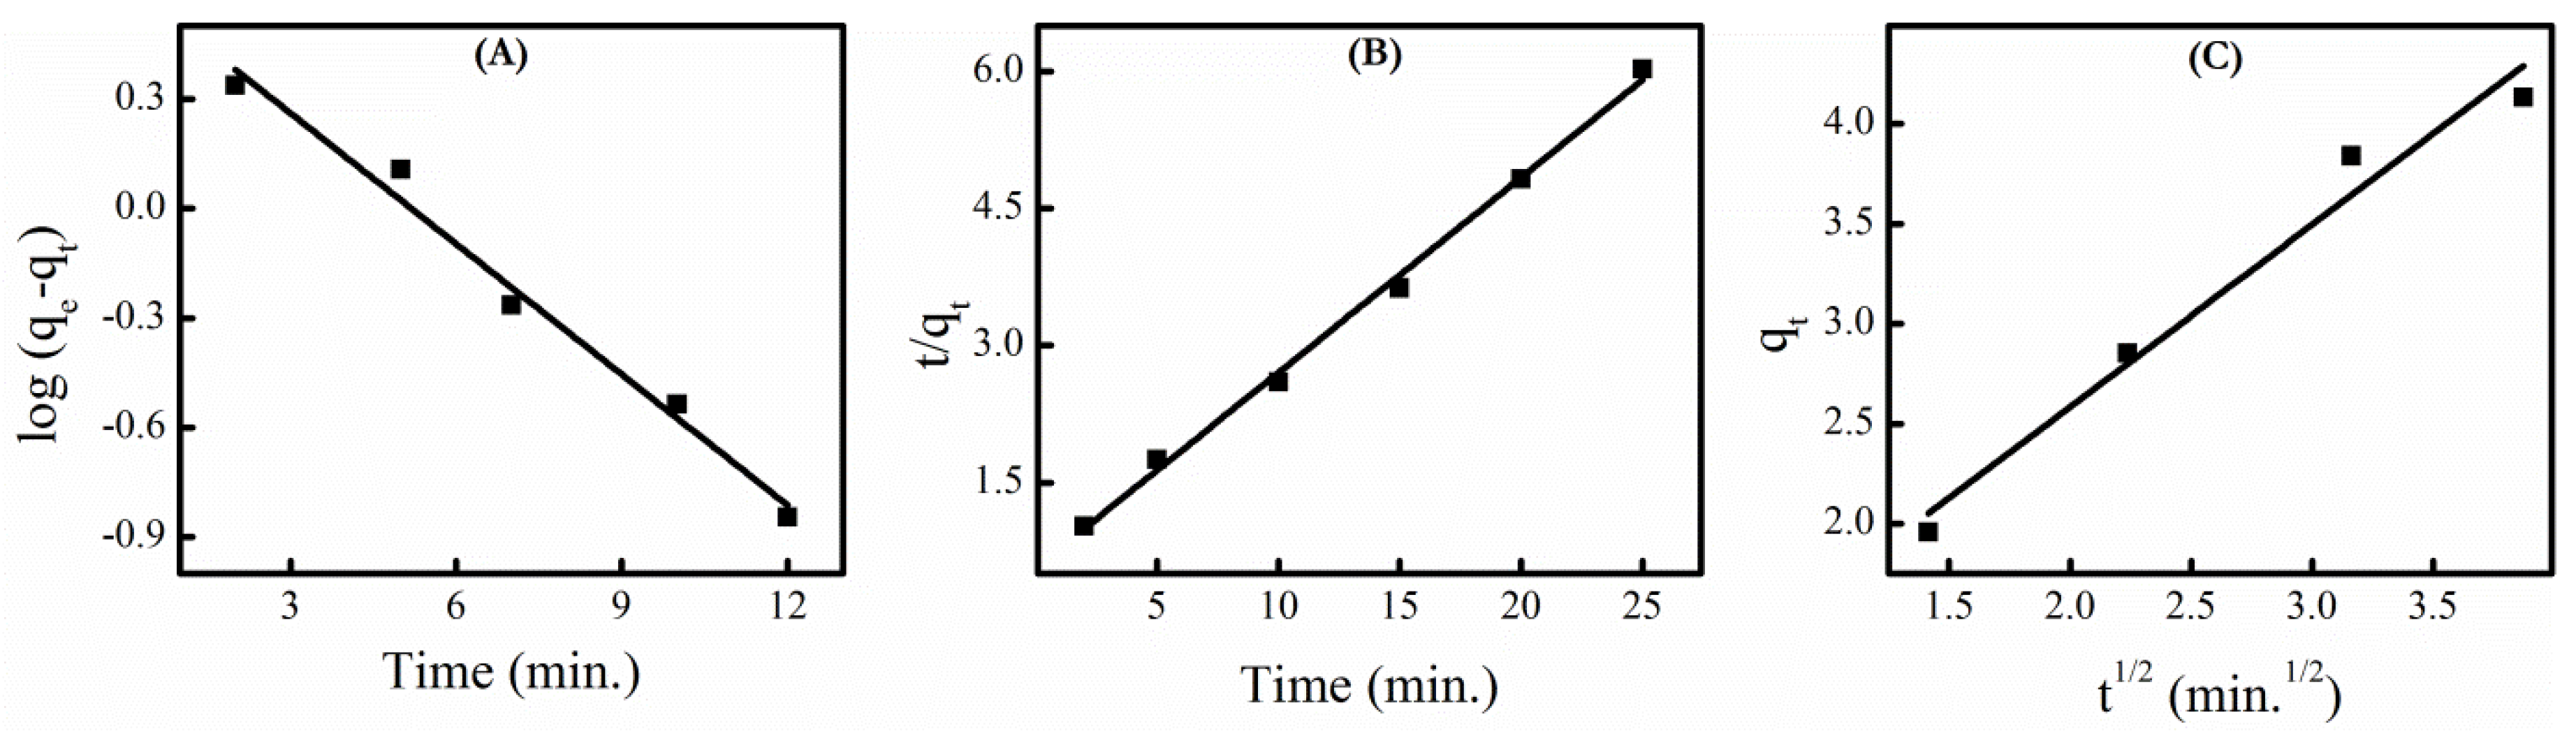
3.7. Adsorption Kinetics
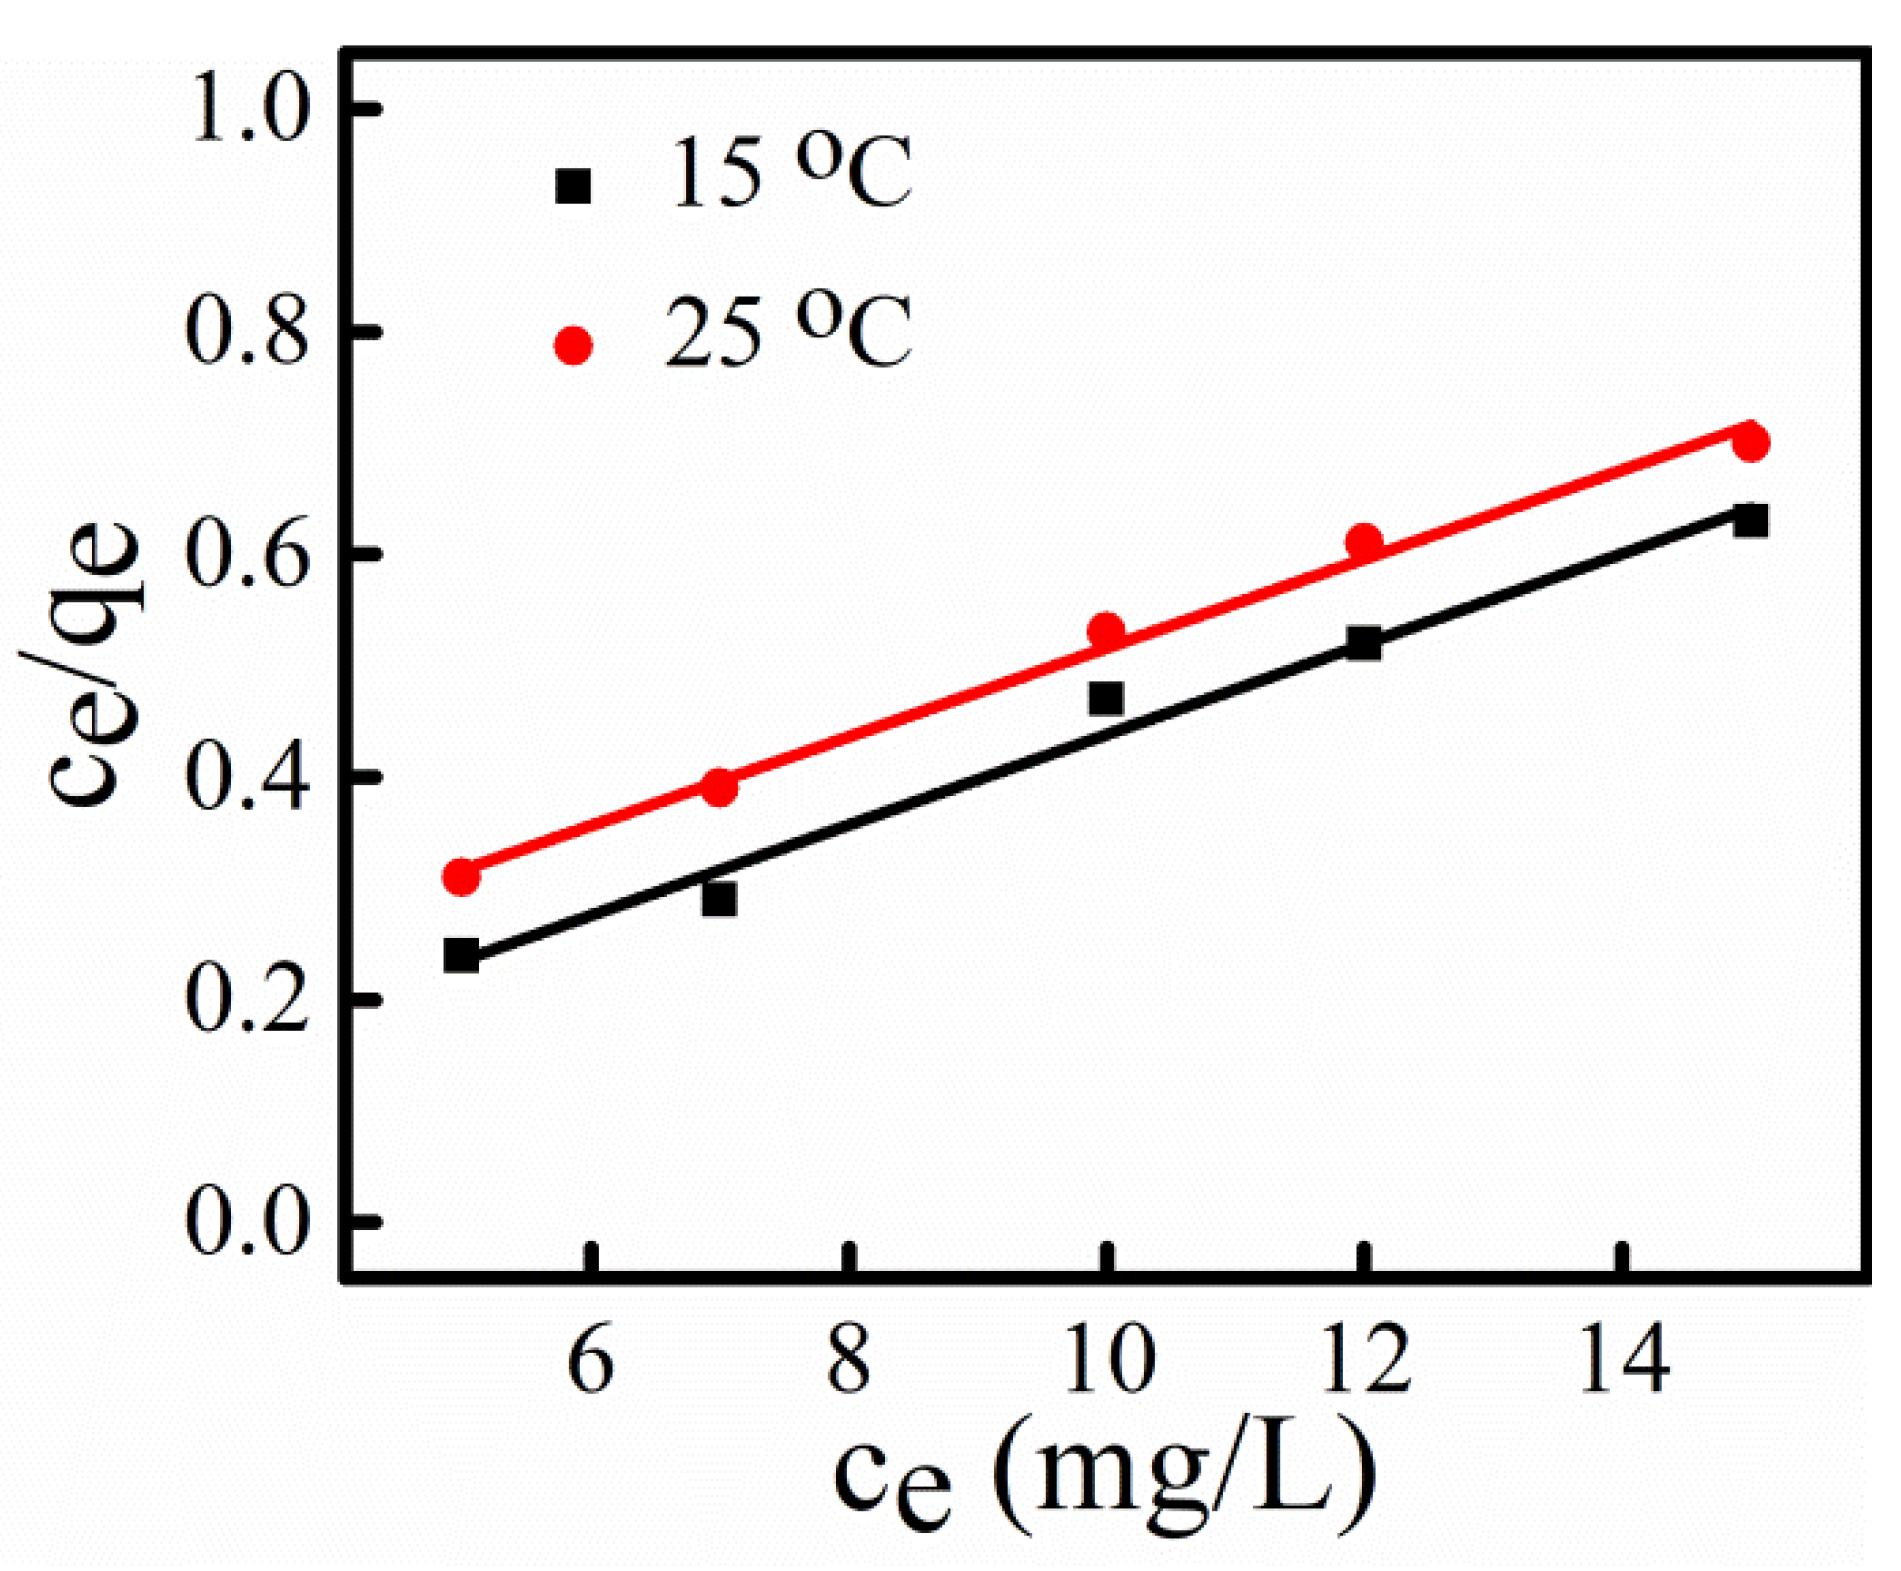
3.8. Adsorption Isotherm
4. Conclusions
Supplementary Materials
Author Contributions
Funding
Acknowledgments
Conflicts of Interest
References
- Robinson, T.; McMullan, G.; Marchant, R.; Nigam, P. Remediation of dyes in textile effluent: A critical review on current treatment technologies with a proposed alternative. Bioresour. Technol. 2001, 77, 247–255. [Google Scholar] [CrossRef]
- Vachon, S.; Klassen, R.D. Green project partnership in the supply chain: The case of the package printing industry. J. Clean. Prod. 2006, 14, 661–671. [Google Scholar] [CrossRef]
- Tünay, O.; Kabdasli, I.; Orhon, D.; Ates, E. Characterization and pollution profile of leather tanning industry in Turkey. Water Sci. Technol. 1995, 32, 1–9. [Google Scholar] [CrossRef]
- Kolpin, D.W.; Furlong, E.T.; Meyer, M.T.; Thurman, E.M.; Zaugg, S.D.; Barber, L.B.; Buxton, H.T. Pharmaceuticals, hormones, and other organic wastewater contaminants in U.S. streams, 1999–2000: A national reconnaissance. Environ. Sci. Technol. 2002, 36, 1202–1211. [Google Scholar] [CrossRef] [PubMed]
- Zhang, Q.; Chuang, K.T. Adsorption of organic pollutants from effluents of a Kraft pulp mill on activated carbon and polymer resin. Adv. Environ. Res. 2001, 5, 251–258. [Google Scholar] [CrossRef]
- Yagub, M.T.; Sen, T.K.; Afroze, S.; Ang, H.M. Dye and its removal from aqueous solution by adsorption: A review. Adv. Colloid Interface Sci. 2014, 209, 172–184. [Google Scholar] [CrossRef] [PubMed]
- Hildenbrand, S.; Schmahl, F.W.; Wodarz, R.; Kimmel, R.; Dartsch, P.C. Azo dyes and carcinogenic aromatic amines in cell cultures. Int. Arch. Occup. Environ. Health 1999, 72, M052–M056. [Google Scholar] [CrossRef]
- Gupta, V.K.; Nayak, A.; Bhushan, B.; Agarwal, S. A critical analysis on the efficiency of activated carbons from low-cost precursors for heavy metals remediation. Crit. Rev. Environ. Sci. Technol. 2015, 45, 613–668. [Google Scholar] [CrossRef]
- Ramakrishna, K.; Viraraghavan, T. Dye removal using low cost adsorbents. Water Sci. Technol. 1997, 36, 189–196. [Google Scholar] [CrossRef]
- Doǧan, M.; Alkan, M.; Türkyilmaz, A.; Özdemir, Y. Kinetics and mechanism of removal of methylene blue by adsorption onto perlite. J. Hazard. Mater. 2004, 109, 141–148. [Google Scholar] [CrossRef]
- Gupta, V.K.; Kumar, R.; Nayak, A.; Saleh, T.A.; Barakat, M.A. Adsorptive removal of dyes from aqueous solution onto carbon nanotubes: A review. Adv. Colloid Interface Sci. 2013, 193–194, 24–34. [Google Scholar] [CrossRef] [PubMed]
- Sadri Moghaddam, S.; Alavi Moghaddam, M.R.; Arami, M. Coagulation/flocculation process for dye removal using sludge from water treatment plant: Optimization through response surface methodology. J. Hazard. Mater. 2010, 175, 651–657. [Google Scholar] [CrossRef] [PubMed]
- Verma, A.K.; Dash, R.R.; Bhunia, P. A review on chemical coagulation/flocculation technologies for removal of colour from textile wastewaters. J. Environ. Manag. 2012, 93, 154–168. [Google Scholar] [CrossRef] [PubMed]
- Van Der Bruggen, B.; Lejon, L.; Vandecasteele, C. Reuse, treatment, and discharge of the concentrate of pressure-driven membrane processes. Environ. Sci. Technol. 2003, 37, 3733–3738. [Google Scholar] [CrossRef]
- Stoquart, C.; Servais, P.; Bérubé, P.R.; Barbeau, B. Hybrid Membrane Processes using activated carbon treatment for drinking water: A review. J. Memb. Sci. 2012, 411–412, 1–12. [Google Scholar] [CrossRef]
- Gupta, V.K.; Nayak, A. Cadmium removal and recovery from aqueous solutions by novel adsorbents prepared from orange peel and Fe2O3nanoparticles. Chem. Eng. J. 2012, 180, 81–90. [Google Scholar] [CrossRef]
- Nayak, A.; Bhushan, B.; Gupta, V.; Sharma, P. Chemically activated carbon from lignocellulosic wastes for heavy metal wastewater remediation: Effect of activation conditions. J. Colloid Interface Sci. 2017, 493, 228–240. [Google Scholar] [CrossRef] [PubMed]
- Gupta, V.K.; Ali, I.; Saleh, T.A.; Nayak, A.; Agarwal, S. Chemical treatment technologies for waste-water recycling—An overview. RSC Adv. 2012, 2, 6380–6388. [Google Scholar] [CrossRef]
- Mahmoodi, N.M.; Hayati, B.; Arami, M.; Bahrami, H. Preparation, characterization and dye adsorption properties of biocompatible composite (alginate/titania nanoparticle). Desalination 2011, 275, 93–101. [Google Scholar] [CrossRef]
- Abou-Gamra, Z.M.; Ahmed, M.A. TiO2 Nanoparticles for Removal of Malachite Green Dye from Waste Water. Adv. Chem. Eng. Sci. 2015, 5, 373–388. [Google Scholar] [CrossRef]
- Zeng, S.; Duan, S.; Tang, R.; Li, L.; Liu, C.; Sun, D. Magnetically separable Ni0.6Fe2.4O4 nanoparticles as an effective adsorbent for dye removal: Synthesis and study on the kinetic and thermodynamic behaviors for dye adsorption. Chem. Eng. J. 2014, 258, 218–228. [Google Scholar] [CrossRef]
- Iram, M.; Guo, C.; Guan, Y.; Ishfaq, A.; Liu, H. Adsorption and magnetic removal of neutral red dye from aqueous solution using Fe3O4 hollow nanospheres. J. Hazard. Mater. 2010, 181, 1039–1050. [Google Scholar] [CrossRef] [PubMed]
- Saha, B.; Das, S.; Saikia, J.; Das, G. Preferential and enhanced adsorption of different dyes on iron oxide nanoparticles: A comparative study. J. Phys. Chem. C 2011, 115, 8024–8033. [Google Scholar] [CrossRef]
- Narayanasamy, L.; Murugesan, T. Degradation of Alizarin Yellow R using UV/H2O2 Advanced Oxidation Process. Environ. Sci. Technol. 2014, 33, 482–489. [Google Scholar] [CrossRef]
- Asfaram, A.; Ghaedi, M.; Hajati, S.; Goudarzi, A. Ternary dye adsorption onto MnO2 nanoparticle-loaded activated carbon: Derivative spectrophotometry and modeling. RSC Adv. 2015, 5, 72300–72320. [Google Scholar] [CrossRef]
- Xie, H.; Li, N.; Liu, B.; Yang, J.; Zhao, X. Role of sodium ion on TiO2 photocatalyst: Influencing crystallographic properties or serving as the recombination center of charge carriers? J. Phys. Chem. C 2016, 120, 10390–10399. [Google Scholar] [CrossRef]
- Bessekhouad, Y.; Robert, D.; Weber, J.V.; Chaoui, N. Effect of alkaline-doped TiO2 on photocatalytic efficiency. J. Photochem. Photobiol. A Chem. 2004, 167, 49–57. [Google Scholar] [CrossRef]
- Yang, G.; Yan, Z.; Xiao, T.; Yang, B. Low-temperature synthesis of alkalis doped TiO2 photocatalysts and their photocatalytic performance for degradation of methyl orange. J. Alloys Compd. 2013, 580, 15–22. [Google Scholar] [CrossRef]
- Panagiotopoulou, P.; Kondarides, D.I. Effects of alkali promotion of TiO2 on the chemisorptive properties and water-gas shift activity of supported noble metal catalysts. J. Catal. 2009, 267, 57–66. [Google Scholar] [CrossRef]
- Chen, L.C.; Huang, C.M.; Tsai, F.R. Characterization and photocatalytic activity of K+-doped TiO2 photocatalysts. J. Mol. Catal. A Chem. 2007, 265, 133–140. [Google Scholar] [CrossRef]
- López, T.; Hernandez-Ventura, J.; Gómez, R.; Tzompantzi, F.; Sánchez, E.; Bokhimi, X.; García, A. Photodecomposition of 2,4-dinitroaniline on Li/TiO2 and Rb/TiO2 nanocrystallite sol-gel derived catalysts. J. Mol. Catal. A Chem. 2001, 167, 101–107. [Google Scholar] [CrossRef]
- Liqiang, J.; Xiaojun, S.; Baifu, X.; Baiqi, W.; Weimin, C. The preparation and characterization of La doped TiO2 nanoparticles and their photocatalytic activity. J. Solid State Chem. 2004, 177, 3375–3382. [Google Scholar] [CrossRef]
- Dai, K.; Peng, T.; Chen, H.; Liu, J.; Zan, L. Photocatalytic Degradation of Commercial Phoxim over La-Doped TiO2 Nanoparticles in Aqueous Suspension. Environ. Sci. Technol. 2009, 43, 1540–1545. [Google Scholar] [CrossRef] [PubMed]
- Uzunova-Bujnova, M.; Todorovska, R.; Dimitrov, D.; Todorovsky, D. Lanthanide-doped titanium dioxide layers as photocatalysts. Appl. Surf. Sci. 2008, 254, 7296–7302. [Google Scholar] [CrossRef]
- Xu, A.-W.; Gao, Y.; Liu, H.-Q. The Preparation, Characterization, and their Photocatalytic Activities of Rare-Earth-Doped TiO2 Nanoparticles. J. Catal. 2002, 207, 151–157. [Google Scholar] [CrossRef]
- Garnweitner, G.; Niederberger, M. Nonaqueous and surfactant-free synthesis routes to metal oxide nanoparticles. J. Am. Ceram. Soc. 2006, 89, 1801–1808. [Google Scholar] [CrossRef]
- Niederberger, M.; Garnweitner, G.; Ba, J.; Polleux, J.; Pinna, N. Nonaqueous synthesis, assembly and formation mechanisms of metal oxide nanocrystals. Int. J. Nanotechnol. 2007, 4, 263–281. [Google Scholar] [CrossRef]
- Singh, I.; Kumar, R.; Birajdar, B.I. Zirconium doped TiO2 nano-powder via halide free non-aqueous solvent controlled sol-gel route. J. Environ. Chem. Eng. 2017, 5, 2955–2963. [Google Scholar] [CrossRef]
- Liu, J.W.; Han, R.; Wang, H.T.; Zhao, Y.; Lu, W.J.; Wu, H.Y.; Yu, T.F.; Zhang, Y.X. Degradation of PCP-Na with La-B co-doped TiO2 series synthesized by the sol-gel hydrothermal method under visible and solar light irradiation. J. Mol. Catal. A Chem. 2011, 344, 145–152. [Google Scholar] [CrossRef]
- Yu, J.C.; Lin, J.; Kwok, R.W.M. Ti1−xZrxO2 Solid Solutions for the Photocatalytic Degradation of Acetone in Air. J. Phys. Chem. B 1998, 102, 5094–5098. [Google Scholar] [CrossRef]
- Pan, X.; Yang, M.-Q.; Fu, X.; Zhang, N.; Xu, Y.-J. Defective TiO2 with oxygen vacancies: Synthesis, properties and photocatalytic applications. Nanoscale 2013, 5, 3601. [Google Scholar] [CrossRef] [PubMed]
- Deshpande, S.; Patil, S.; Kuchibhatla, S.V.; Seal, S. Size dependency variation in lattice parameter and valency states in nanocrystalline cerium oxide. Appl. Phys. Lett. 2005, 87, 1–3. [Google Scholar] [CrossRef]
- Kleitz, F.; Bérubé, F.; Guillet-Nicolas, R.; Yang, C.M.; Thommes, M. Probing adsorption, pore condensation, and hysteresis behavior of pure fluids in three-dimensional cubic mesoporous KIT-6 silica. J. Phys. Chem. C 2010, 114, 9344–9355. [Google Scholar] [CrossRef]
- Kleitz, F.; Liu, D.; Anilkumar, G.M.; Park, I.-S.; Solovyov, L.A.; Shmakov, A.N.; Ryoo, R. Large Cage Face-Centered-Cubic Fm3m Mesoporous Silica: Synthesis and Structure. J. Phys. Chem. B 2003, 107, 14296–14300. [Google Scholar] [CrossRef]
- Singh, I.; Birajdar, B. Synthesis, characterization and photocatalytic activity of mesoporous Na-doped TiO2 nano-powder prepared via a solvent-controlled non-aqueous sol-gel route. RSC Adv. 2017, 7, 54053–54062. [Google Scholar] [CrossRef]
- Simmons, G.W.; Beard, B.C. Characterization of Acid-Base Properties of the Hydrated Oxides on Iron and Titanium Metal Surfaces. J. Phys. Chem. 1987, 91, 1143–1148. [Google Scholar] [CrossRef]
- Jing, L.; Xin, B.; Yuan, F.; Xue, L.; Wang, B.; Fu, H. Effects of surface oxygen vacancies on photophysical and photochemical processes of Zn-doped TiO2 nanoparticles and their relationships. J. Phys. Chem. B 2006, 110, 17860–17865. [Google Scholar] [CrossRef]
- Wang, J.; Yu, Y.; Li, S.; Guo, L.; Wang, E.; Cao, Y. Doping behavior of Zr4+ ions in Zr4+-doped TiO2 nanoparticles. J. Phys. Chem. C 2013, 117, 27120–27126. [Google Scholar] [CrossRef]
- Yu, Y.-G.; Chen, G.; Hao, L.-X.; Zhou, Y.-S.; Pei, J.; Sun, J.-X.; Han, Z.-H. Doping La into the depletion layer of the Cd0.6Zn0.4S photocatalyst for efficient H2 evolution. Chem. Commun. 2013, 49, 10142–10144. [Google Scholar] [CrossRef]
- Sunding, M.F.; Hadidi, K.; Diplas, S.; Løvvik, O.M.; Norby, T.E.; Gunnæs, A.E. XPS characterisation of in situ treated lanthanum oxide and hydroxide using tailored charge referencing and peak fitting procedures. J. Electron Spectrosc. Relat. Phenom. 2011, 184, 399–409. [Google Scholar] [CrossRef]
- Guo, Z.; Zhou, J.; An, L.; Jiang, J.; Zhu, G.; Deng, C. A new-type of semiconductor Na0.9Mg0.45Ti3.55O8: preparation, characterization and photocatalysis. J. Mater. Chem. A Mater. Energy Sustain. 2014, 2, 20358–20366. [Google Scholar] [CrossRef]
- Suttiponparnit, K.; Jiang, J.; Sahu, M.; Suvachittanont, S. Role of Surface Area, Primary Particle Size, and Crystal Phase on Titanium Dioxide Nanoparticle Dispersion Properties | Nanoscale Research Letters | Full Text. Nanoscale Res. Lett. 2011, 6, 1–8. [Google Scholar]
- Yu, J.C.; Lin, J.; Kwok, R.W.M. Enhanced photocatalytic activity of Ti1−xVxO2 solid solution on the degradation of acetone. J. Photochem. Photobiol. A Chem. 1997, 111, 199–203. [Google Scholar] [CrossRef]
- Malik, P.K. Use of activated carbons prepared from sawdust and rice-husk for adsoprtion of acid dyes: A case study of acid yellow 36. Dye. Pigment. 2003, 56, 239–249. [Google Scholar] [CrossRef]
- Garg, V.K.; Gupta, R.; Kumar, R.; Gupta, R.K. Adsorption of chromium from aqueous solution on treated sawdust. Bioresour. Technol. 2004, 89, 121–124. [Google Scholar] [CrossRef]
- Moussavi, G.; Mahmoudi, M. Removal of azo and anthraquinone reactive dyes from industrial wastewaters using MgO nanoparticles. J. Hazard. Mater. 2009, 168, 806–812. [Google Scholar] [CrossRef] [PubMed]
- Dogan, M.; Alkan, M.; Onganer, Y. Adsorption of Methylene Blue from Aqueous Solution onto Perlite. Water Air Soil Pollut. 2000, 120, 229–248. [Google Scholar] [CrossRef]
- Homaeigohar, S.; Zillohu, A.U.; Abdelaziz, R.; Hedayati, M.K.; Elbahri, M. A novel nanohybrid nanofibrous adsorbent for water purification from dye pollutants. Materials 2016, 9, 848. [Google Scholar] [CrossRef]
- Asfour, H.M.; Fadali, O.A.; Nassar, M.M.; El-Geundi, M.S. Equilibrium studies on adsorption of basic dyes on hardwood. J. Chem. Technol. Biotechnol. 1985, 35A, 21–27. [Google Scholar] [CrossRef]
- Bahgat, M.; Farghali, A.A.; El Rouby, W.; Khedr, M.; Mohassab-Ahmed, M.Y. Adsorption of methyl green dye onto multi-walled carbon nanotubes decorated with Ni nanoferrite. Appl. Nanosci. 2013, 3, 251–261. [Google Scholar] [CrossRef]
- Bagbi, Y.; Sarswat, A.; Mohan, D.; Pandey, A.; Solanki, P.R. Lead and Chromium Adsorption from Water using L-Cysteine Functionalized Magnetite (Fe3O4) Nanoparticles. Sci. Rep. 2017, 1–15. [Google Scholar] [CrossRef]


| NPs Labelling | Nominal Dopant Conc. (at. %) | Dopant Conc. (at. %) | 2θ (Degree) A(101) | Crystallite Size (nm) | ||
|---|---|---|---|---|---|---|
| Na | La | Na | La | |||
| PT | 0 | 0 | 0 | 0 | 25.722 | 14.0 |
| LT | 0 | 1 | 0 | 0.90 | 25.512 | 8.0 |
| NT4 | 4 | 0 | 3.89 | 0 | 25.466 | 10.0 |
| LNT2 | 2 | 1 | 1.82 | 0.81 | 25.425 | 7.5 |
| LNT4 | 4 | 1 | 3.75 | 0.76 | 25.359 | 7.0 |
| LNT6 | 6 | 1 | 5.67 | 0.74 | 25.380 | 9.0 |
| NPs | pHIEP | BET Surface Area (m2 g−1) | Pore Volume (cm3 g−1) | Pore Diameter (nm) |
|---|---|---|---|---|
| PT | 5.7 | 45.712 | 0.039 | 2.32 |
| LT | 5.5 | 54.342 | 0.052 | 2.59 |
| NT4 | 5.2 | 49.629 | 0.066 | 2.70 |
| LNT2 | 5.0 | 63.418 | 0.080 | 2.85 |
| LNT4 | 4.7 | 74.996 | 0.119 | 3.19 |
| LNT6 | 4.6 | 67.971 | 0.104 | 3.08 |
| Sample | Peak Position | ||||||||
|---|---|---|---|---|---|---|---|---|---|
| Ti-O Peak | O-H Peak | Ti 2p3/2 Peak | Ti 2p1/2 Peak | La 3d5/2 | La 3d3/2 | Na 1s Peak | |||
| Peak 1 | Peak 2 | Peak 1 | Peak 2 | ||||||
| PT | 530.07 | 532.03 | 458.71 | 464.41 | - | - | - | - | - |
| LT | 529.93 | 531.96 | 458.46 | 464.16 | 834.99 | 839.18 | 851.51 | 856.04 | - |
| NT4 | 528.91 | 531.29 | 458.19 | 464.06 | - | - | - | - | 1071.34 |
| LNT4 | 529.90 | 531.91 | 457.75 | 463.38 | 834.83 | 839.03 | 851.38 | 855.89 | 1071.23 |
| 1st Order Kinetics | 2nd Order Kinetics | Intra-Particle Diffusion | |||
|---|---|---|---|---|---|
| k1 | R2 | k2 | R2 | ki | R2 |
| 0.253 | 0.9796 | 0.081 | 0.9959 | 0.762 | 0.9616 |
| Langmuir Isotherm Constant | 15 °C | 25 °C |
|---|---|---|
| qmax | 24.62 | 25.04 |
| b | 1.35 | 0.33 |
| R2 | 0.97 | 0.99 |
© 2019 by the authors. Licensee MDPI, Basel, Switzerland. This article is an open access article distributed under the terms and conditions of the Creative Commons Attribution (CC BY) license (http://creativecommons.org/licenses/by/4.0/).
Share and Cite
Singh, I.; Birajdar, B. Effective La-Na Co-Doped TiO2 Nano-Particles for Dye Adsorption: Synthesis, Characterization and Study on Adsorption Kinetics. Nanomaterials 2019, 9, 400. https://doi.org/10.3390/nano9030400
Singh I, Birajdar B. Effective La-Na Co-Doped TiO2 Nano-Particles for Dye Adsorption: Synthesis, Characterization and Study on Adsorption Kinetics. Nanomaterials. 2019; 9(3):400. https://doi.org/10.3390/nano9030400
Chicago/Turabian StyleSingh, Inderjeet, and Balaji Birajdar. 2019. "Effective La-Na Co-Doped TiO2 Nano-Particles for Dye Adsorption: Synthesis, Characterization and Study on Adsorption Kinetics" Nanomaterials 9, no. 3: 400. https://doi.org/10.3390/nano9030400
APA StyleSingh, I., & Birajdar, B. (2019). Effective La-Na Co-Doped TiO2 Nano-Particles for Dye Adsorption: Synthesis, Characterization and Study on Adsorption Kinetics. Nanomaterials, 9(3), 400. https://doi.org/10.3390/nano9030400