A Facile Method for Batch Preparation of Electrochemically Reduced Graphene Oxide


Abstract
1. Introduction
2. Experimental Method
2.1. Graphene Oxide (GO)Preparation
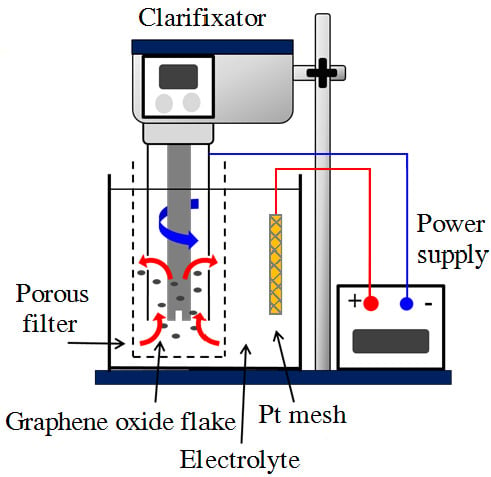
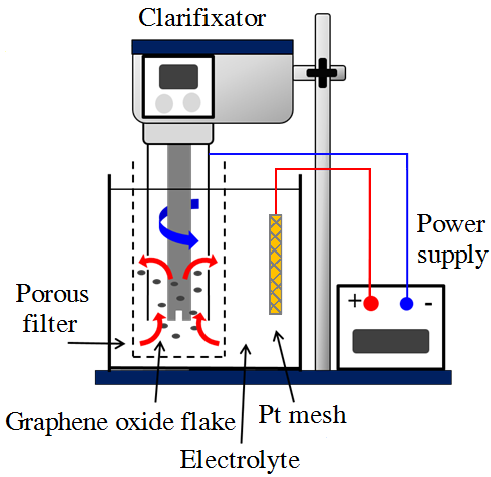
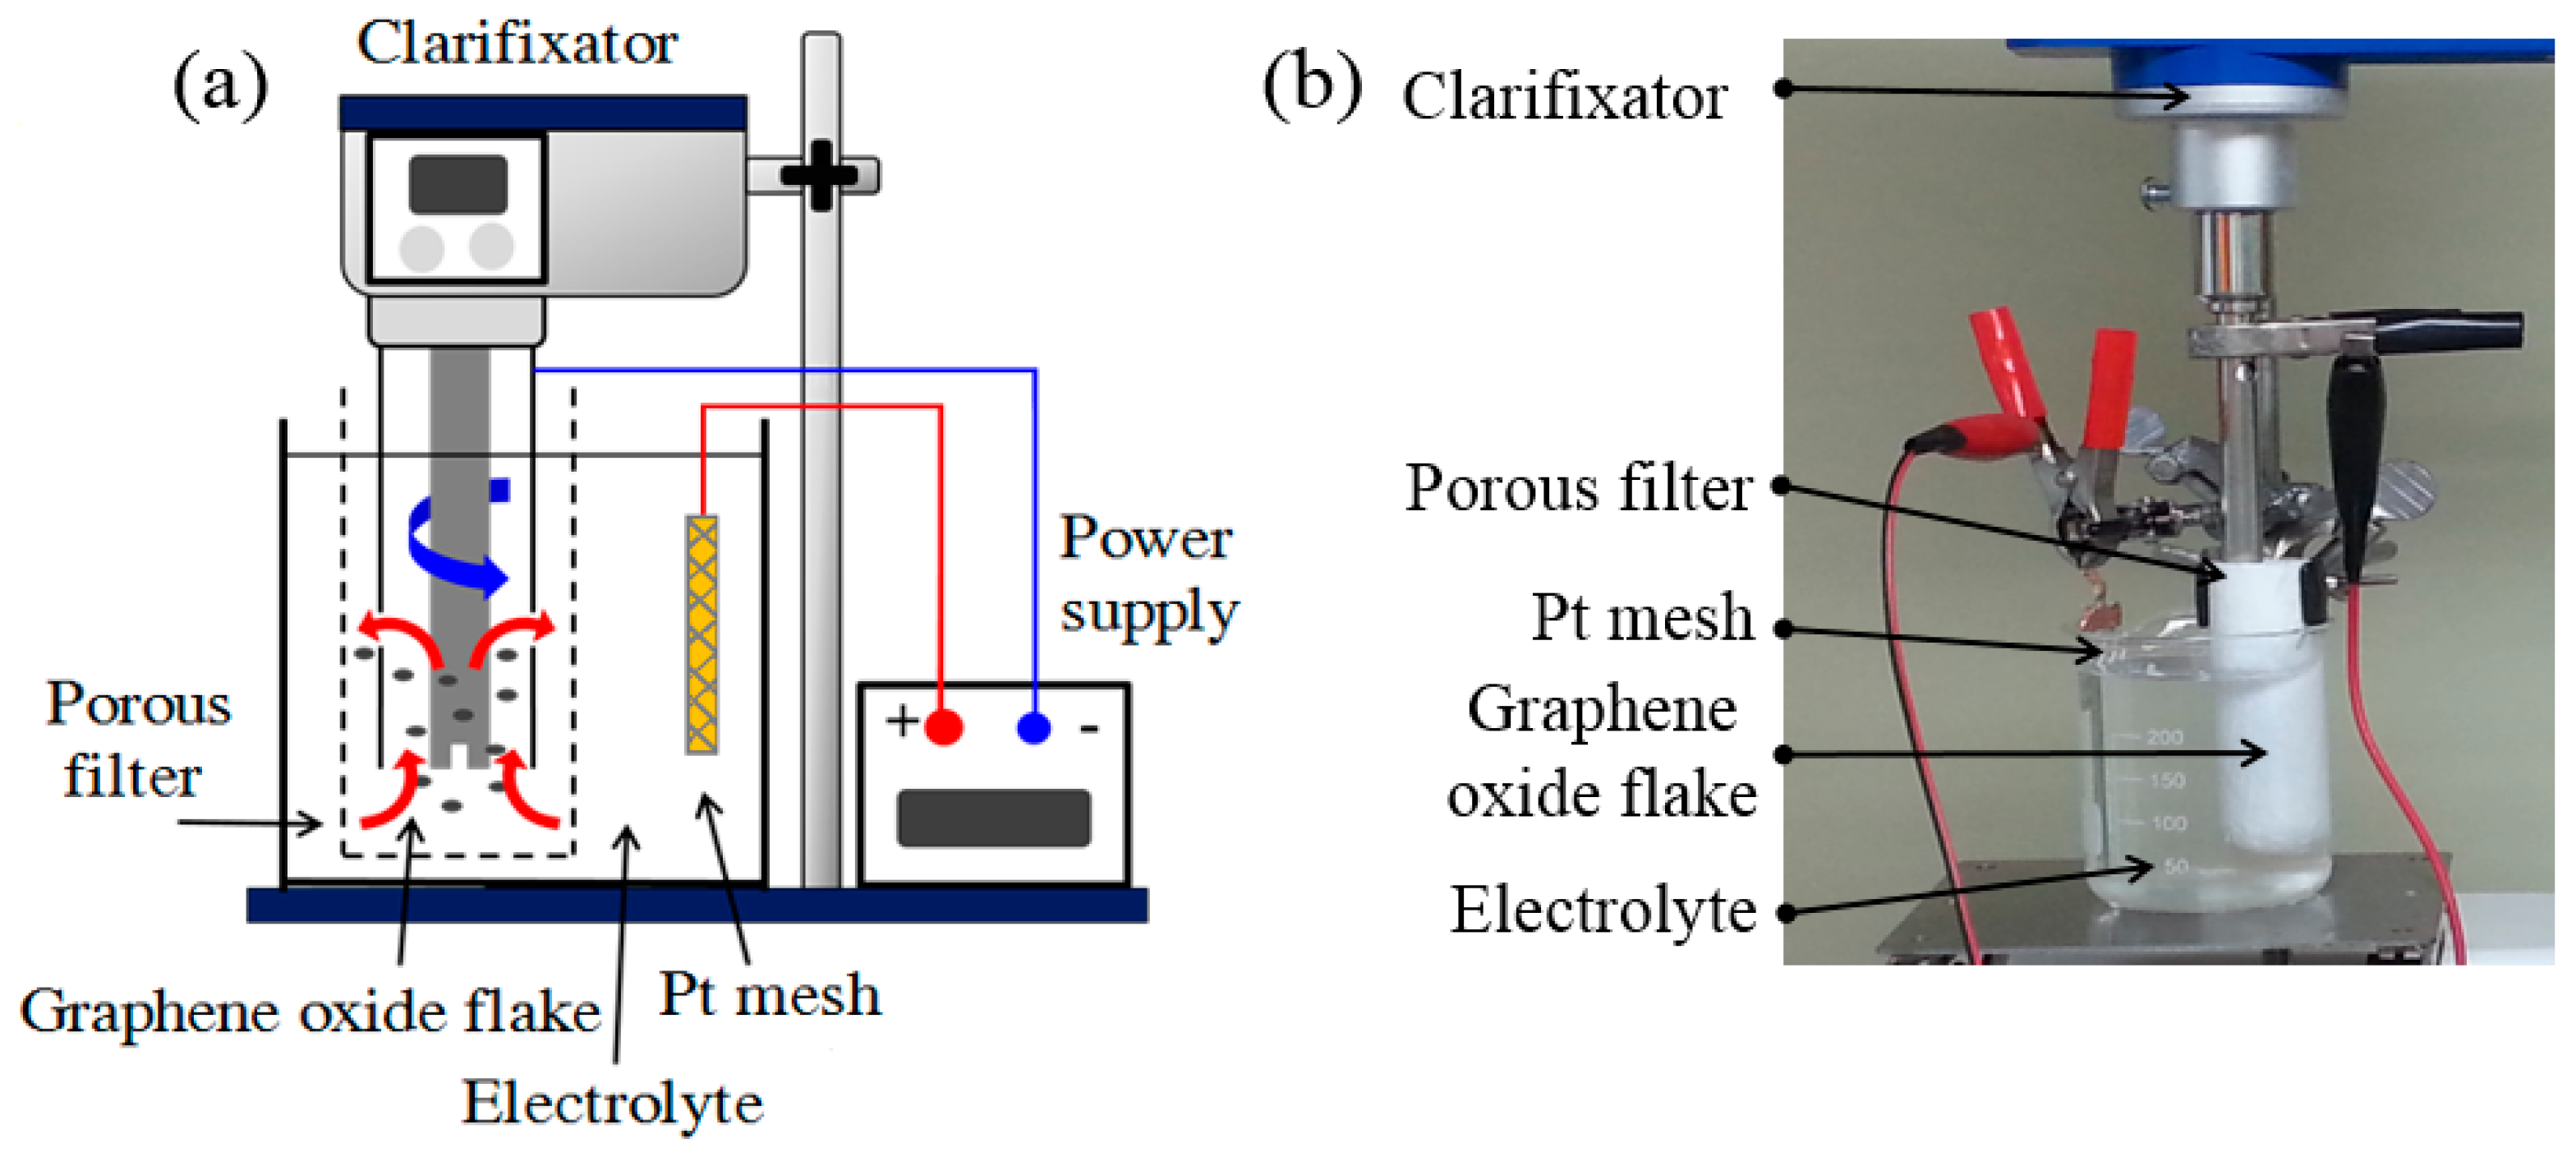
2.2. Electrochemically Reduced GO
2.3. Measurement and Characterization
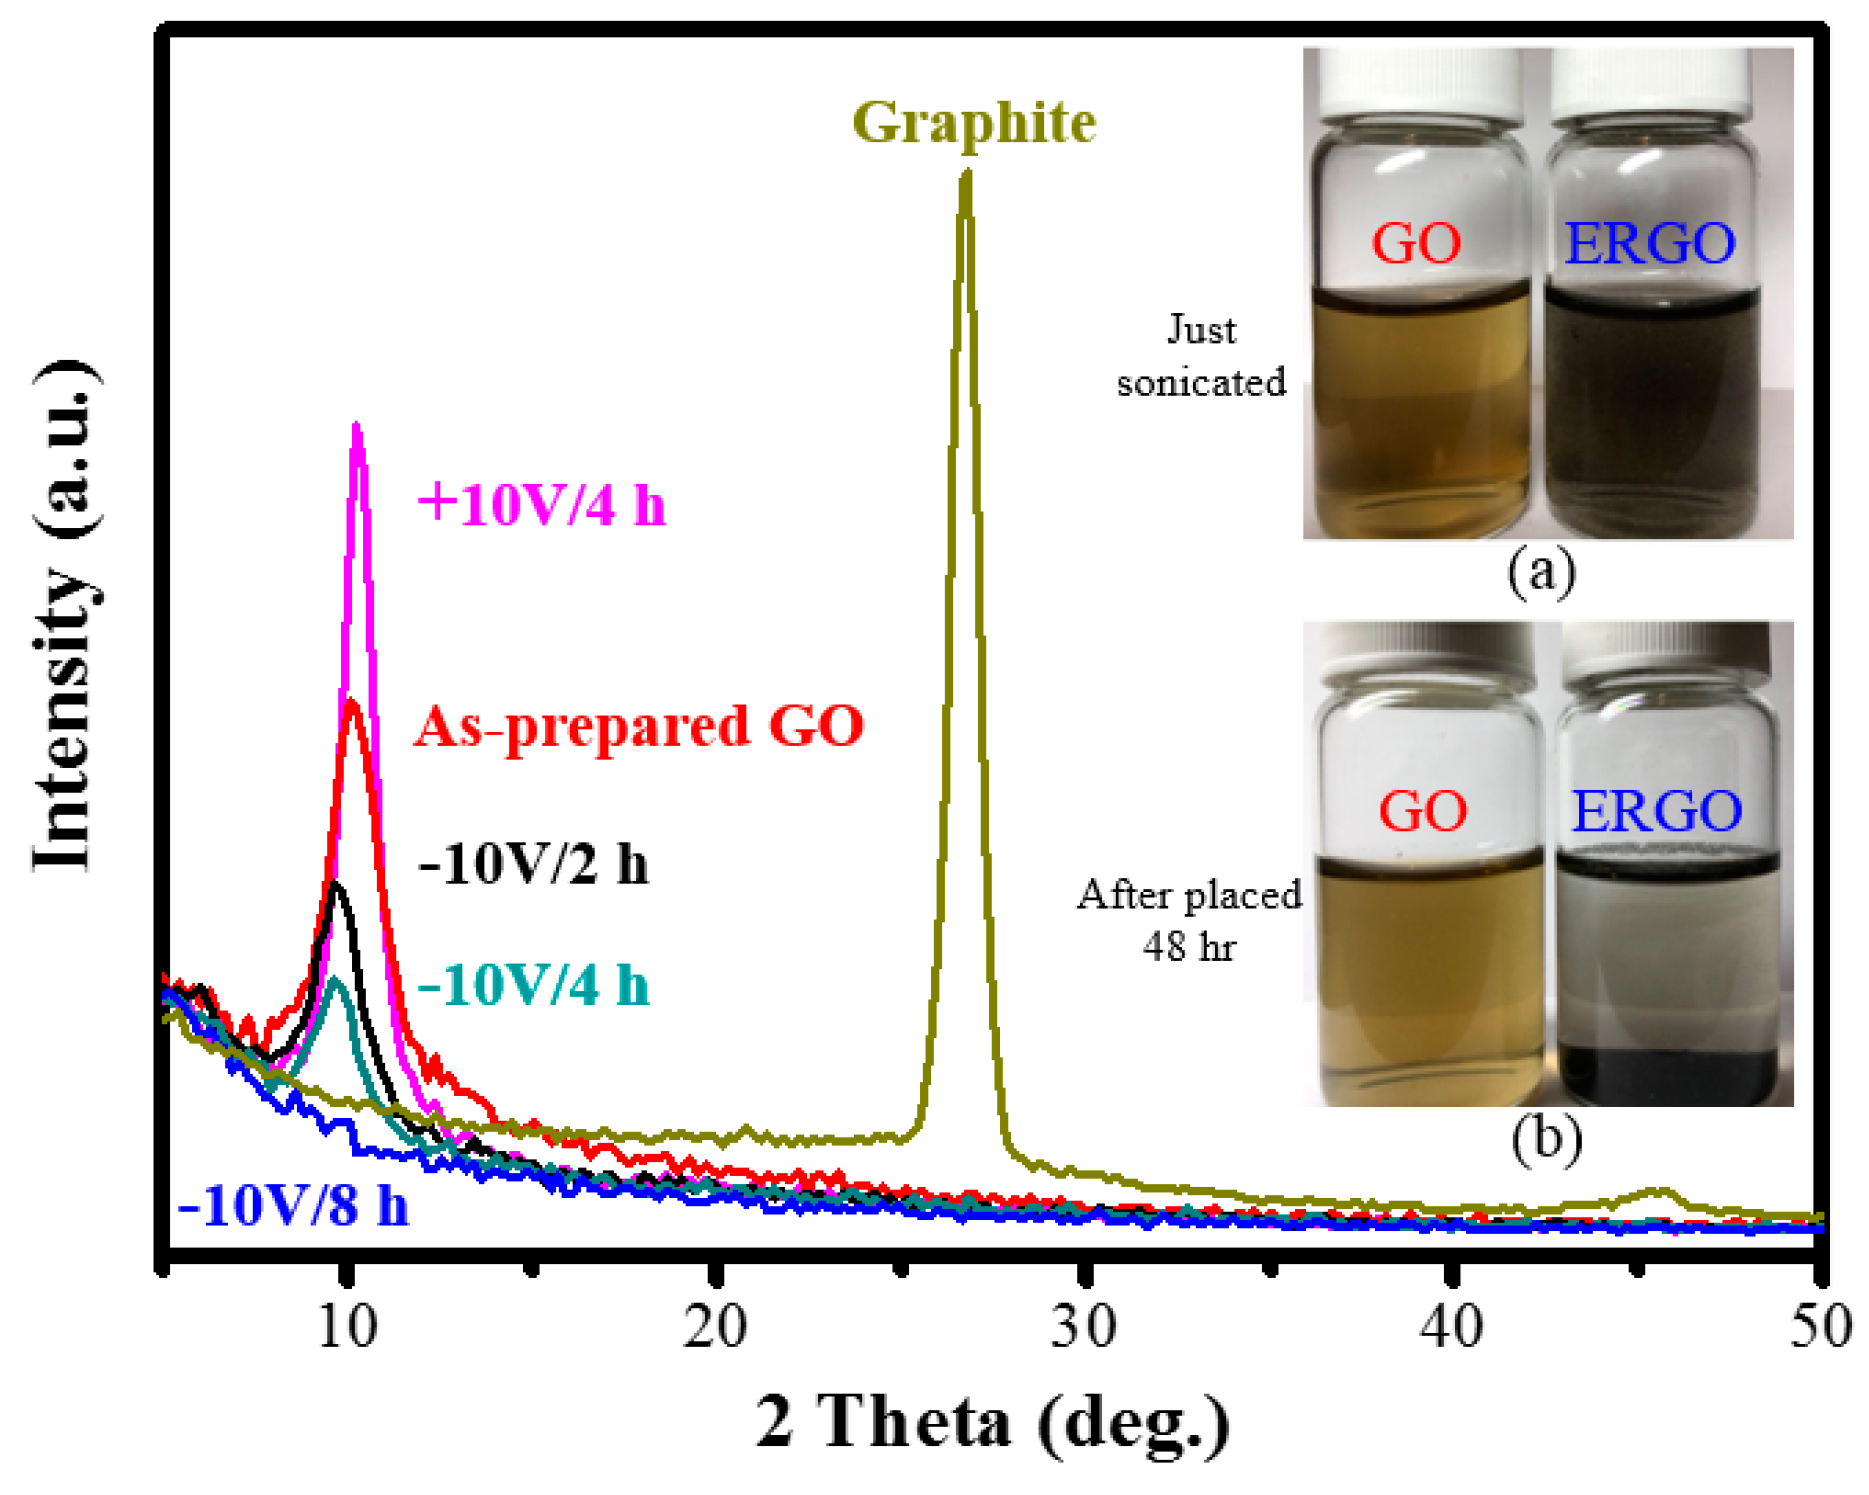
3. Results and Discussion
4. Conclusions
Author Contributions
Acknowledgments
Conflicts of Interest
References
- Novoselov, K.S.; Geim, A.K.; Morozov, S.V.; Jiang, D.; Zhang, Y.; Dubonos, S.V.; Grigorieva, I.V.; Firsov, A.A. Electric field effect in atomically thin carbon films. Science 2004, 306, 666–669. [Google Scholar] [CrossRef] [PubMed]
- Novoselov, K.S.; Jiang, Z.; Zhang, Y.; Morozov, S.V.; Stormer, H.L.; Zeitler, U.; Maan, J.C.; Boebinger, G.S.; Kim, P.; Geim, A.K. Room-temperature quantum hall effect in graphene. Science 2007, 15, 1379. [Google Scholar] [CrossRef] [PubMed]
- Novoselov, K.S.; Geim, A.K.; Morozov, S.V.; Jiang, D.; Katsnelson, M.I.; Grigorieva, I.V.; Dubonos, S.V.; Firsov, A.A. Two dimensional gas of massless dirac fermions in graphene. Nature 2005, 438, 197–200. [Google Scholar] [CrossRef] [PubMed]
- Bolotin, K.I.; Sikes, K.J.; Jiang, Z.; Klima, M.; Fudenberg, G.; Hone, J.; Kim, P.; Stormer, H.L. Ultrahigh electron mobility in suspended graphene. Solid State Commun. 2008, 146, 351–355. [Google Scholar] [CrossRef]
- Robinson, J.T.; Perkins, F.K.; Snow, E.S.; Wei, Z.; Sheehan, P.E. Reduced graphene oxide molecular sensors. Nano Lett. 2008, 8, 3137–3140. [Google Scholar] [CrossRef] [PubMed]
- Eda, G.; Fanchini, G.; Chhowalla, M. Large-area ultrathin films of reduced graphene oxide as a transparent and flexible electronic material. Nat. Nanotechnol. 2008, 3, 270–274. [Google Scholar] [CrossRef] [PubMed]
- Mattevi, C.; Eda, G.; Agnoli, S.; Miller, S.; Mkhoyan, K.A.; Celik, O.; Mastrogiovanni, D.; Granozzi, G.; Garfunkel, E.; Chhowalla, M. Evolution of electrical, chemical, and structural properties of transparent and conducting chemically derived graphene thin films. Adv. Funct. Mater. 2009, 19, 2577–2583. [Google Scholar] [CrossRef]
- Eda, G.; Chhowalla, M. Chemically derived graphene oxide: Towards large-area thin-film electronics and optoelectronics. Adv. Mater. 2010, 22, 2392–2415. [Google Scholar] [CrossRef] [PubMed]
- Wang, X.; Zhi, L.J.; Mullen, K. Transparent, conductive graphene electrodes for dye-sensitized solar cells. Nano Lett. 2008, 8, 323–327. [Google Scholar] [CrossRef] [PubMed]
- Wu, Z.S.; Winter, A.; Chen, L.; Sun, Y.; Turchanin, A.; Feng, X.; Mullen, K. Three-dimensional nitrogen and boron co-doped graphene for high-performance all-solid-state supercapacitors. Adv. Mater. 2012, 24, 5130–5135. [Google Scholar] [CrossRef] [PubMed]
- Xiao, L.; Wu, D.; Han, S.; Huang, Y.; Li, S.; He, M.; Zhang, F.; Feng, X. Self-assembled Fe2O3/graphene aerogel with high lithium storage performance. ACS Appl. Mater. Interfaces 2013, 5, 3764–3769. [Google Scholar] [CrossRef] [PubMed]
- Chang, H.H.; Chang, C.K.; Tsai, Y.C.; Liao, C.S. Electrochemically synthesized graphene/polypyrrole composites and their use in supercapacitor. Carbon 2012, 50, 2331–2336. [Google Scholar] [CrossRef]
- Schniepp, H.C.; Li, J.L.; Mcallister, M.J.; Sai, H.; Alonso, M.H.; Adamson, D.H.; Prud’homme, R.K.; Car, R.; Saville, D.A.; Aksay, I.A. Functionalized single graphene sheets derived from splitting graphite oxide. J. Phys. Chem. B 2006, 110, 8535–8539. [Google Scholar] [CrossRef] [PubMed]
- Su, C.; Xu, Y.; Zhang, W.; Zhao, J.; Liu, A.; Tang, X.; Tsai, C.; Huang, Y.; Li, L. Highly efficient restoration of graphitic structure in graphene oxide using alcohol vapors. ACS Nano 2010, 4, 5285–5292. [Google Scholar] [CrossRef] [PubMed]
- Gonzalez, Z.; Botas, C.; Alvarez, P.; Roldan, S.; Blanco, C.; Santamaria, R.; Granda, M.; Menendez, R. Thermally reduced graphite oxide as positive electrode in vanadium redox flow batteries. Carbon 2012, 50, 828–834. [Google Scholar] [CrossRef]
- Kuila, T.; Mishra, A.K.; Khanra, P.; Kim, N.H.; Lee, J.H. Recent advances in the efficient reduction of graphene oxide and its application as energy storage electrode materials. Nanoscale 2013, 5, 52–71. [Google Scholar] [CrossRef] [PubMed]
- Park, J.; Lee, W.H.; Huh, S.; Sim, S.H.; Kim, S.B.; Cho, K.; Hong, B.H.; Kim, K.S. Work-function engineering of graphene electrodes by self-assembled monolayers for high-performance organic field-effect transistors. J. Phys. Chem. Lett. 2011, 2, 841–845. [Google Scholar] [CrossRef] [PubMed]
- Zhu, X.; Zhu, Y.; Murali, S.; Stoller, M.D.; Ruoff, R.S. Nanostructured reduced graphene oxide/Fe2O3 composite as a high-performance anode material for lithium ion batteries. ACS Nano 2011, 5, 3333–3338. [Google Scholar] [CrossRef] [PubMed]
- Li, J.; Lu, C.H.; Yao, Q.H.; Zhang, X.L.; Liu, J.J.; Yang, H.H.; Chen, G.N. A graphene oxide platform for energy transfer-based detection of protease activity. Biosens. Bioelectron. 2011, 26, 3894–3899. [Google Scholar] [CrossRef] [PubMed]
- Park, S.; An, J.; Potts, J.R.; Velamakanni, A.; Murali, S.; Ruoff, R.S. Hydrazine-reduction of graphite- and graphene oxide. Carbon 2011, 4, 3019–3023. [Google Scholar] [CrossRef]
- Shin, H.J.; Kim, K.K.; Benayad, A.; Yoon, S.M.; Park, H.K.; Jung, I.S.; Jin, M.H.; Jeong, H.K.; Kim, J.M.; Choi, J.Y.; et al. Efficient reduction of graphite oxide by sodium borohydride and its effect on electrical conductance. Adv. Funct. Mater. 2009, 19, 1987–1992. [Google Scholar] [CrossRef]
- Park, O.-K.; Hahm, M.G.; Lee, S.; Joh, H.-I.; Na, S.-I.; Vajtai, R.; Lee, J.H.; Ku, B.-C.; Ajayan, P.M. In situsynthesis of thermochemically reduced graphene oxide conducting nanocomposites. Nano Lett. 2012, 12, 1789–1793. [Google Scholar] [CrossRef] [PubMed]
- Xiao, N.; Dong, X.; Song, L.; Liu, D.; Tay, Y.Y.; Wu, S.; Li, L.J.; Zhao, Y.; Yu, T.; Zhang, H.; et al. Enhanced thermopower of graphene films with oxygen plasma treatment. ACS Nano 2011, 5, 2749–2755. [Google Scholar] [CrossRef] [PubMed]
- Yang, C.R.; Tseng, S.F.; Chen, Y.T. Laser-induced reduction of graphene oxide powders by high pulsed ultraviolet laser irradiations. Appl. Surf. Sci. 2018, 444, 578–583. [Google Scholar] [CrossRef]
- Voiry, D.; Yang, J.; Kupferberg, J.; Fullon, R.; Lee, C.; Jeong, H.Y.; Shin, H.S.; Chhowalla, M. High-quality graphene via microwave reduction of solution-exfoliated graphene oxide. Nanomaterials 2016, 353, 1413–1415. [Google Scholar] [CrossRef] [PubMed]
- Williams, G.; Seger, B.; Kamat, P.V. TiO2-graphene nanocomposites. uv-assisted photocatalytic reduction of graphene oxide. ACS Nano 2008, 2, 1487–1491. [Google Scholar] [CrossRef] [PubMed]
- Fan, Z.; Wang, K.; Wei, T.; Yan, J.; Song, L.; Shao, B. An environmentally friendly and efficient route for the reduction of graphene oxide by aluminum powder. Cabon 2010, 48, 1670–1690. [Google Scholar] [CrossRef]
- Zhang, J.; Yang, H.; Shen, G.; Cheng, P.; Zhang, J.; Guo, S. Reduction of graphen oxide via L-asorbic acid. Chem. Commun. 2010, 46, 1112–1114. [Google Scholar] [CrossRef] [PubMed]
- Zhang, Z.; Chen, H.; Xing, C.; Guo, M.; Xu, F.; Wang, X.; Gruber, H.J.; Zhang, B.; Tang, J. Sodium Citrate: A universal reducing agent for reduction/ decoration of graphene oxide with Au Nanoparticles. Nano Res. 2011, 4, 599–611. [Google Scholar] [CrossRef]
- Zhou, M.; Wang, Y.; Zhai, Y.; Zhai, J.; Ren, W.; Wang, F.; Dong, S. Controlled synthesis of large-area and patterned electrochemically reduced graphene oxide films. Chem. Eur. J. 2009, 15, 6116–6120. [Google Scholar] [CrossRef] [PubMed]
- Liu, S.; Wang, J.; Zeng, J.; Ou, J.; Li, Z.; Liu, X.; Yang, S. Green electrochemical synthesis of Pt/graphene sheet nanocomposite film and its electrocatalytic property. J. Power Sources 2010, 195, 4628–4633. [Google Scholar] [CrossRef]
- Chen, L.; Tang, Y.; Wang, K.; Liu, C.; Luo, S. Direct electrodeposition of reduced graphene oxide on glassy carbon electrode and its electrochemical application. Electrochem. Commun. 2011, 13, 133–137. [Google Scholar] [CrossRef]
- Low, C.T.J.; Walsh, F.C.; Chakrabarti, M.H.; Hashim, M.A.; Hussain, M.A. Electrochemical approaches to the production of graphene flakes and their potential applications. Carbon 2013, 54, 1–21. [Google Scholar] [CrossRef]
- Zhou, M.; Zhai, Y.; Dong, S. Electrochemical sensing and biosensing platform based on chemically reduced graphene oxide. Anal. Chem. 2009, 81, 5603–5613. [Google Scholar] [CrossRef] [PubMed]
- Unnikrishnan, B.; Palanisamy, S.; Chen, S.M. A simple electrochemical approach to fabricate a glucose biosensor based on graphene-glucose oxidase biocomposite. Biosens. Bioelectron. 2013, 39, 70–75. [Google Scholar] [CrossRef] [PubMed]
- Marcano, D.C.; Kosynkin, D.V.; Berlin, J.M.; Sinitskii, A.; Sun, Z.; Slesarev, A.; Alemany, L.B.; Lu, W.; Tour, J.M. Improved synthesis of graphene oxide. ACS Nano 2010, 4, 4806–4814. [Google Scholar] [CrossRef] [PubMed]
- Guo, H.L.; Wang, X.F.; Qian, Q.Y.; Wang, F.B.; Xia, X.H. A green approach to the synthesis of graphene nanosheets. ACS Nano 2009, 3, 2653–2659. [Google Scholar] [CrossRef] [PubMed]
- Jeong, H.K.; Lee, Y.P.; Lahaye, R.J.; Park, M.H.; An, K.H.; Kim, I.J.; Yang, C.W.; Park, C.Y.; Ruoff, R.S.; Lee, Y.H. Evidence of graphitic AB stacking order of graphite oxides. J. Am. Chem. Soc. 2008, 130, 1362–1366. [Google Scholar] [CrossRef] [PubMed]
- Hontoria-Lucas, C.; Lopez-Peinado, A.J.; Lopez-Gonzalez, J.D.; Rojas-Cervantes, M.J.; Martin-Aranda, R.M. Study of oxygen-containing groups in a series of graphite oxides: Physical and chemical characterization. Carbon 1995, 33, 1585–1592. [Google Scholar] [CrossRef]
- Buchsteiner, A.; Lerf, A.; Pieper, J. Water dynamics in graphite oxide investigated with neutron scattering. J. Phys. Chem. B 2006, 110, 22328–22338. [Google Scholar] [CrossRef] [PubMed]
- Zhang, X.; Xu, Y.; Li, D.; Zhang, Y. The effect of metal ions doping on the electrochemical performance of molybdenum trioxide. Electrochim. Acta 2018, 283, 149–154. [Google Scholar] [CrossRef]
- Dong, X.; Su, C.Y.; Zhang, W.; Zhao, J.; Ling, Q.; Huang, W.; Chen, P.; Li, L.J. Ultra-large single-layer graphene obtained from solution chemical reduction and its electrical properties. Phys. Chem. Chem. Phys. 2010, 12, 2164–2169. [Google Scholar] [CrossRef] [PubMed]
- Lerf, A.; He, H.; Forster, M.; Klinowski, J. Structure of graphite oxide revisited. J. Phys. Chem. B 1998, 102, 4477–4482. [Google Scholar] [CrossRef]
- Xu, Y.; Bai, H.; Lu, G.; Li, C.; Shi, G. Flexible graphene films via the filtration of water-soluble noncovalent functionalized graphene sheets. J. Am. Chem. Soc. 2008, 130, 5856–5857. [Google Scholar] [CrossRef] [PubMed]
- Stankovich, S.; Dikin, D.A.; Piner, R.D.; Kohlhaas, K.A.; Kleinhammes, A.; Jia, Y.Y.; Wu, Y.; Nguyen, S.T.; Ruoff, R.S. Synthesis of graphene-based nanosheets via chemical reduction of exfoliated graphite oxide. Carbon 2007, 45, 1558–1565. [Google Scholar] [CrossRef]
- Wang, G.; Qian, F.; Saltikov, C.W.; Jiao, Y.; Li, Y. Microbial reduction of graphene oxide by shewanella. Nano Res. 2011, 4, 563–570. [Google Scholar] [CrossRef]
- Lei, Z.; Lu, L.; Zhao, X.S. The electrocapacitive properties of graphene oxide reduced by urea. Energy Environ. Sci. 2012, 5, 6391–6399. [Google Scholar] [CrossRef]
- Thakur, S.; Karak, N. Green reduction of graphene oxide by aqueous phytoextracts. Carbon 2012, 50, 5331–5339. [Google Scholar] [CrossRef]
- Wang, Y.; Shi, Z.; Yin, J. Facile synthesis of soluble graphene via a green reduction of graphene oxide in tea solution and its biocomposites. ACS Appl. Mater. Interfaces 2011, 3, 1127–1133. [Google Scholar] [CrossRef] [PubMed]
- Liu, L.; Shen, Z.; Yi, M.; Zhang, X.J.; Ma, S. A green, rapid and size-controlled production of high-quality graphene sheets by hydrodynamic forces. RSC Adv. 2014, 4, 36464–36470. [Google Scholar] [CrossRef]
- Wang, G.X.; Yang, J.; Park, J.; Gou, X.L.; Wang, B.; Liu, H.; Yao, J. Facile synthesis and characterization of graphene nanosheets. J. Phys. Chem. C 2008, 112, 8192–8195. [Google Scholar] [CrossRef]
- Zhu, C.; Guo, S.; Fang, Y.; Dong, S. Reducing sugar: New functional molecules for the green synthesis of graphene nanosheets. ACS Nano 2010, 4, 2429–2437. [Google Scholar] [CrossRef] [PubMed]
- Wang, G.; Yang, Z.; Li, X.; Li, C. Synthesis of poly(aniline-co-oanisidine)-intercalated graphite oxide composite by delamination/reassembling method. Carbon 2005, 43, 2564–2570. [Google Scholar] [CrossRef]
- Guo, X.; Xiao, H.S.; Wang, F.; Zhang, Y.H. Micro-Raman and FTIR spectroscopic observation on the phase transitions of MnSO4 droplets and ionic interactions between Mn2+ and SO42−. J. Phys. Chem. A 2010, 114, 6480–6486. [Google Scholar] [CrossRef] [PubMed]
- Krauss, B.; Lohmann, T.; Chae, D.H.; Haluska, M.; Klitzing, K.; Smet, J.H. Laser-induced disassembly of a graphene single crystal into a nanocrystalline network. Phys. Rev. B 2009, 79, 165428–165429. [Google Scholar] [CrossRef]
- Gao, W. Graphene Oxide; Springer: Basel, Switzerland, 2015. [Google Scholar]
- Liu, K.; Chen, L.; Chen, Y.; Wu, J.; Zhang, W.; Chen, F.; Fu, Q. Preparation of polyester/reduced graphene oxide composites via in situ melt polycondensation and simultaneous thermo-reduction of graphene oxide. J. Mater. Chem. 2011, 21, 8612–8617. [Google Scholar] [CrossRef]
- Li, X.; Zhang, G.; Bai, X.; Sun, X.; Wang, X.; Wang, E.; Dai, H. Highly conducting graphene sheets and Langmuir–Blodgett films. Nat. Nanotechnol. 2008, 3, 538–542. [Google Scholar] [CrossRef] [PubMed]


| Samples | C% | O% | C/O Ratio |
|---|---|---|---|
| ERGO +10 V/4 h | 62.2 | 37.8 | 1.64 |
| As-prepared GO | 66.9 | 33.1 | 2.02 |
| ERGO −10 V/8 h | 71.9 | 28.1 | 2.56 |
| Measured Items | GO Sample | ERGO Sample (−10 V/8 h) |
|---|---|---|
| XRD 2θ peak (deg.) | 10.2 | NA |
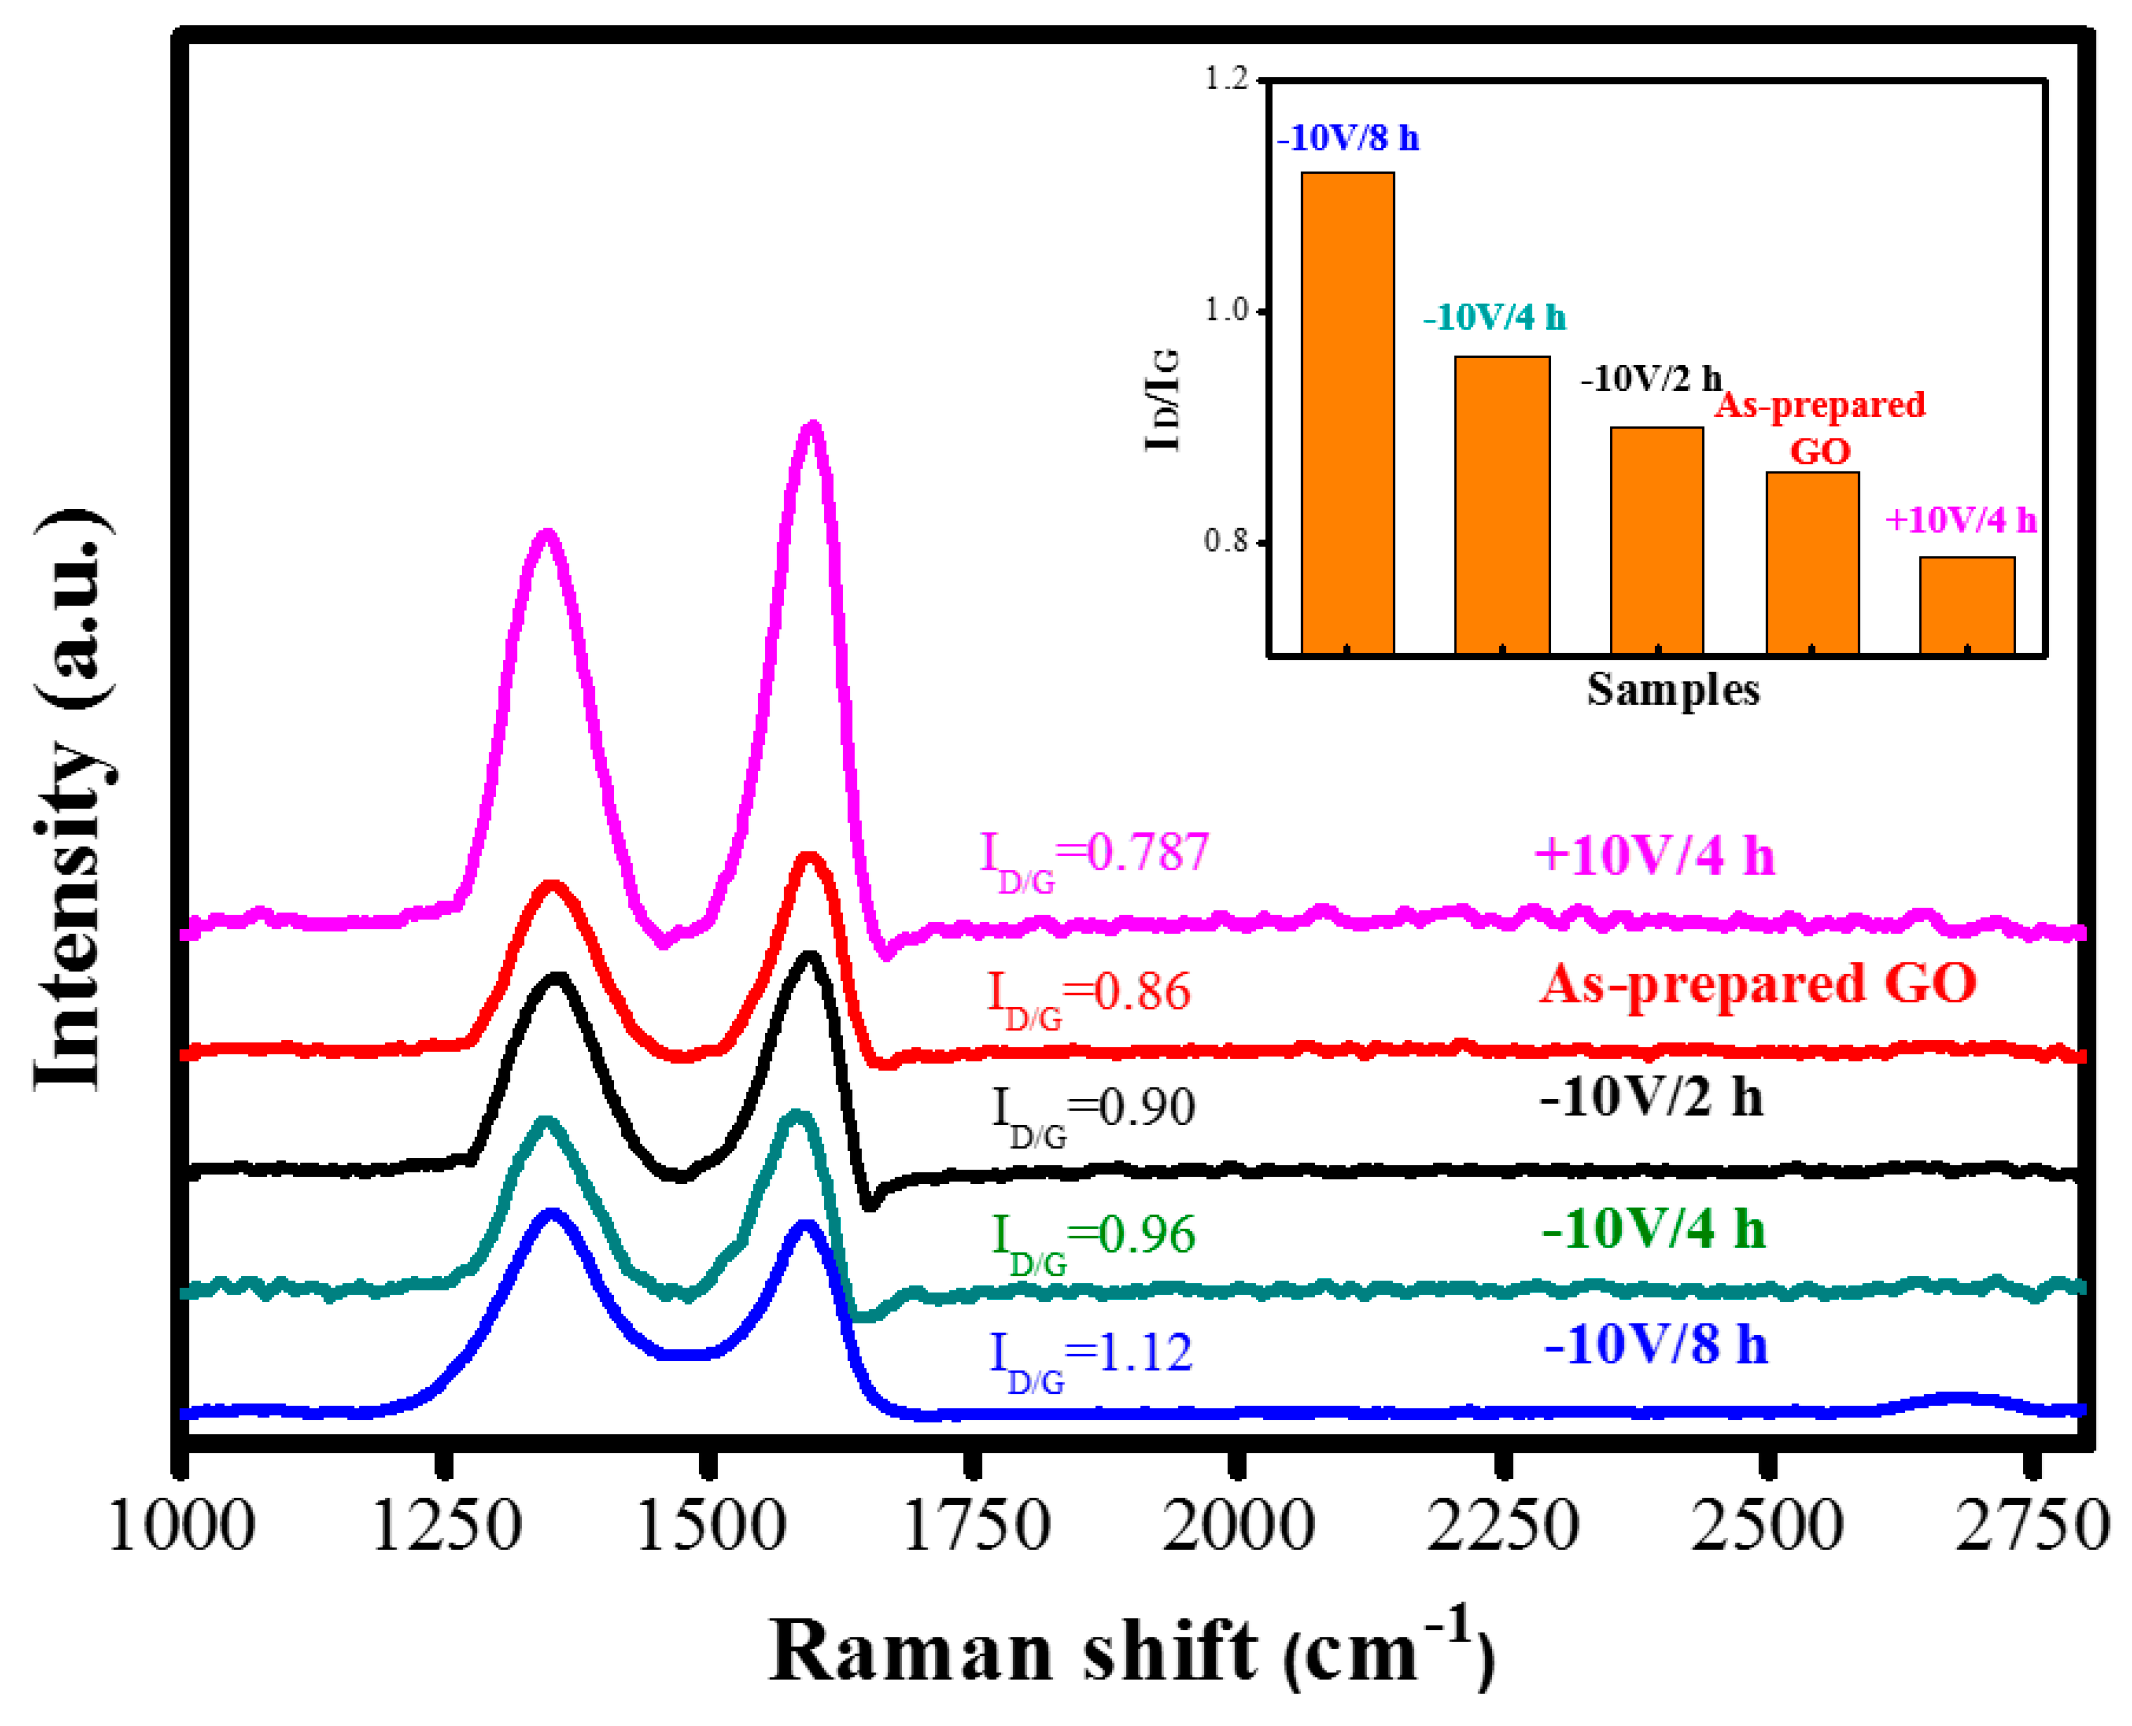
| Raman ID/IG | 0.86 | 1.12 |
| UV-Vis absorbed wavelength (nm) | 228 | 263 |
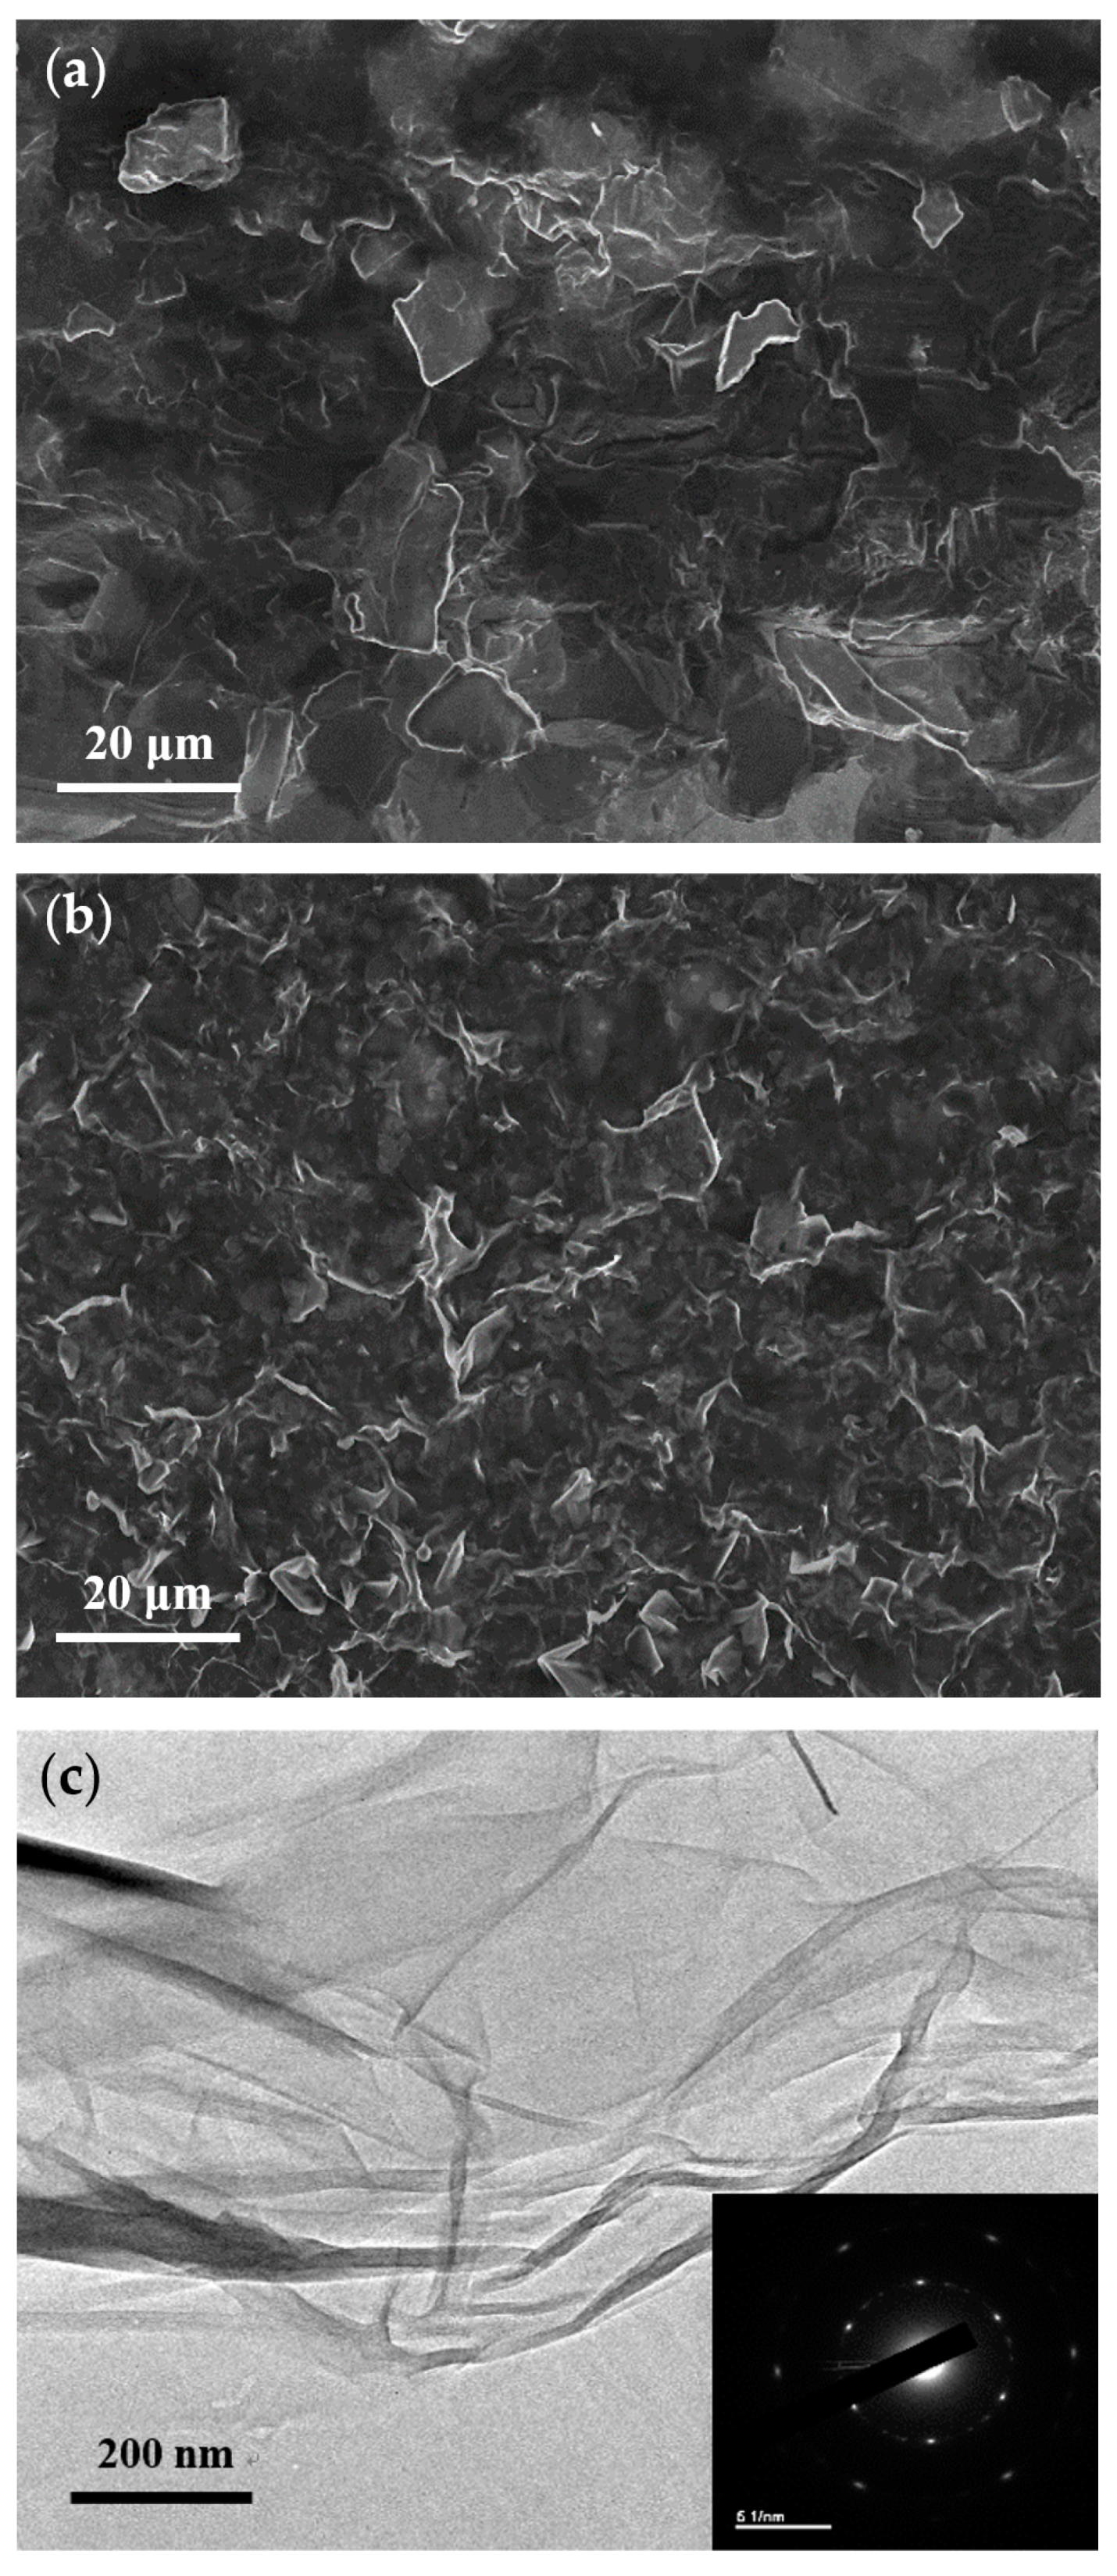
| Ave. lateral dimension of flake (μm) | 8 | 2 |
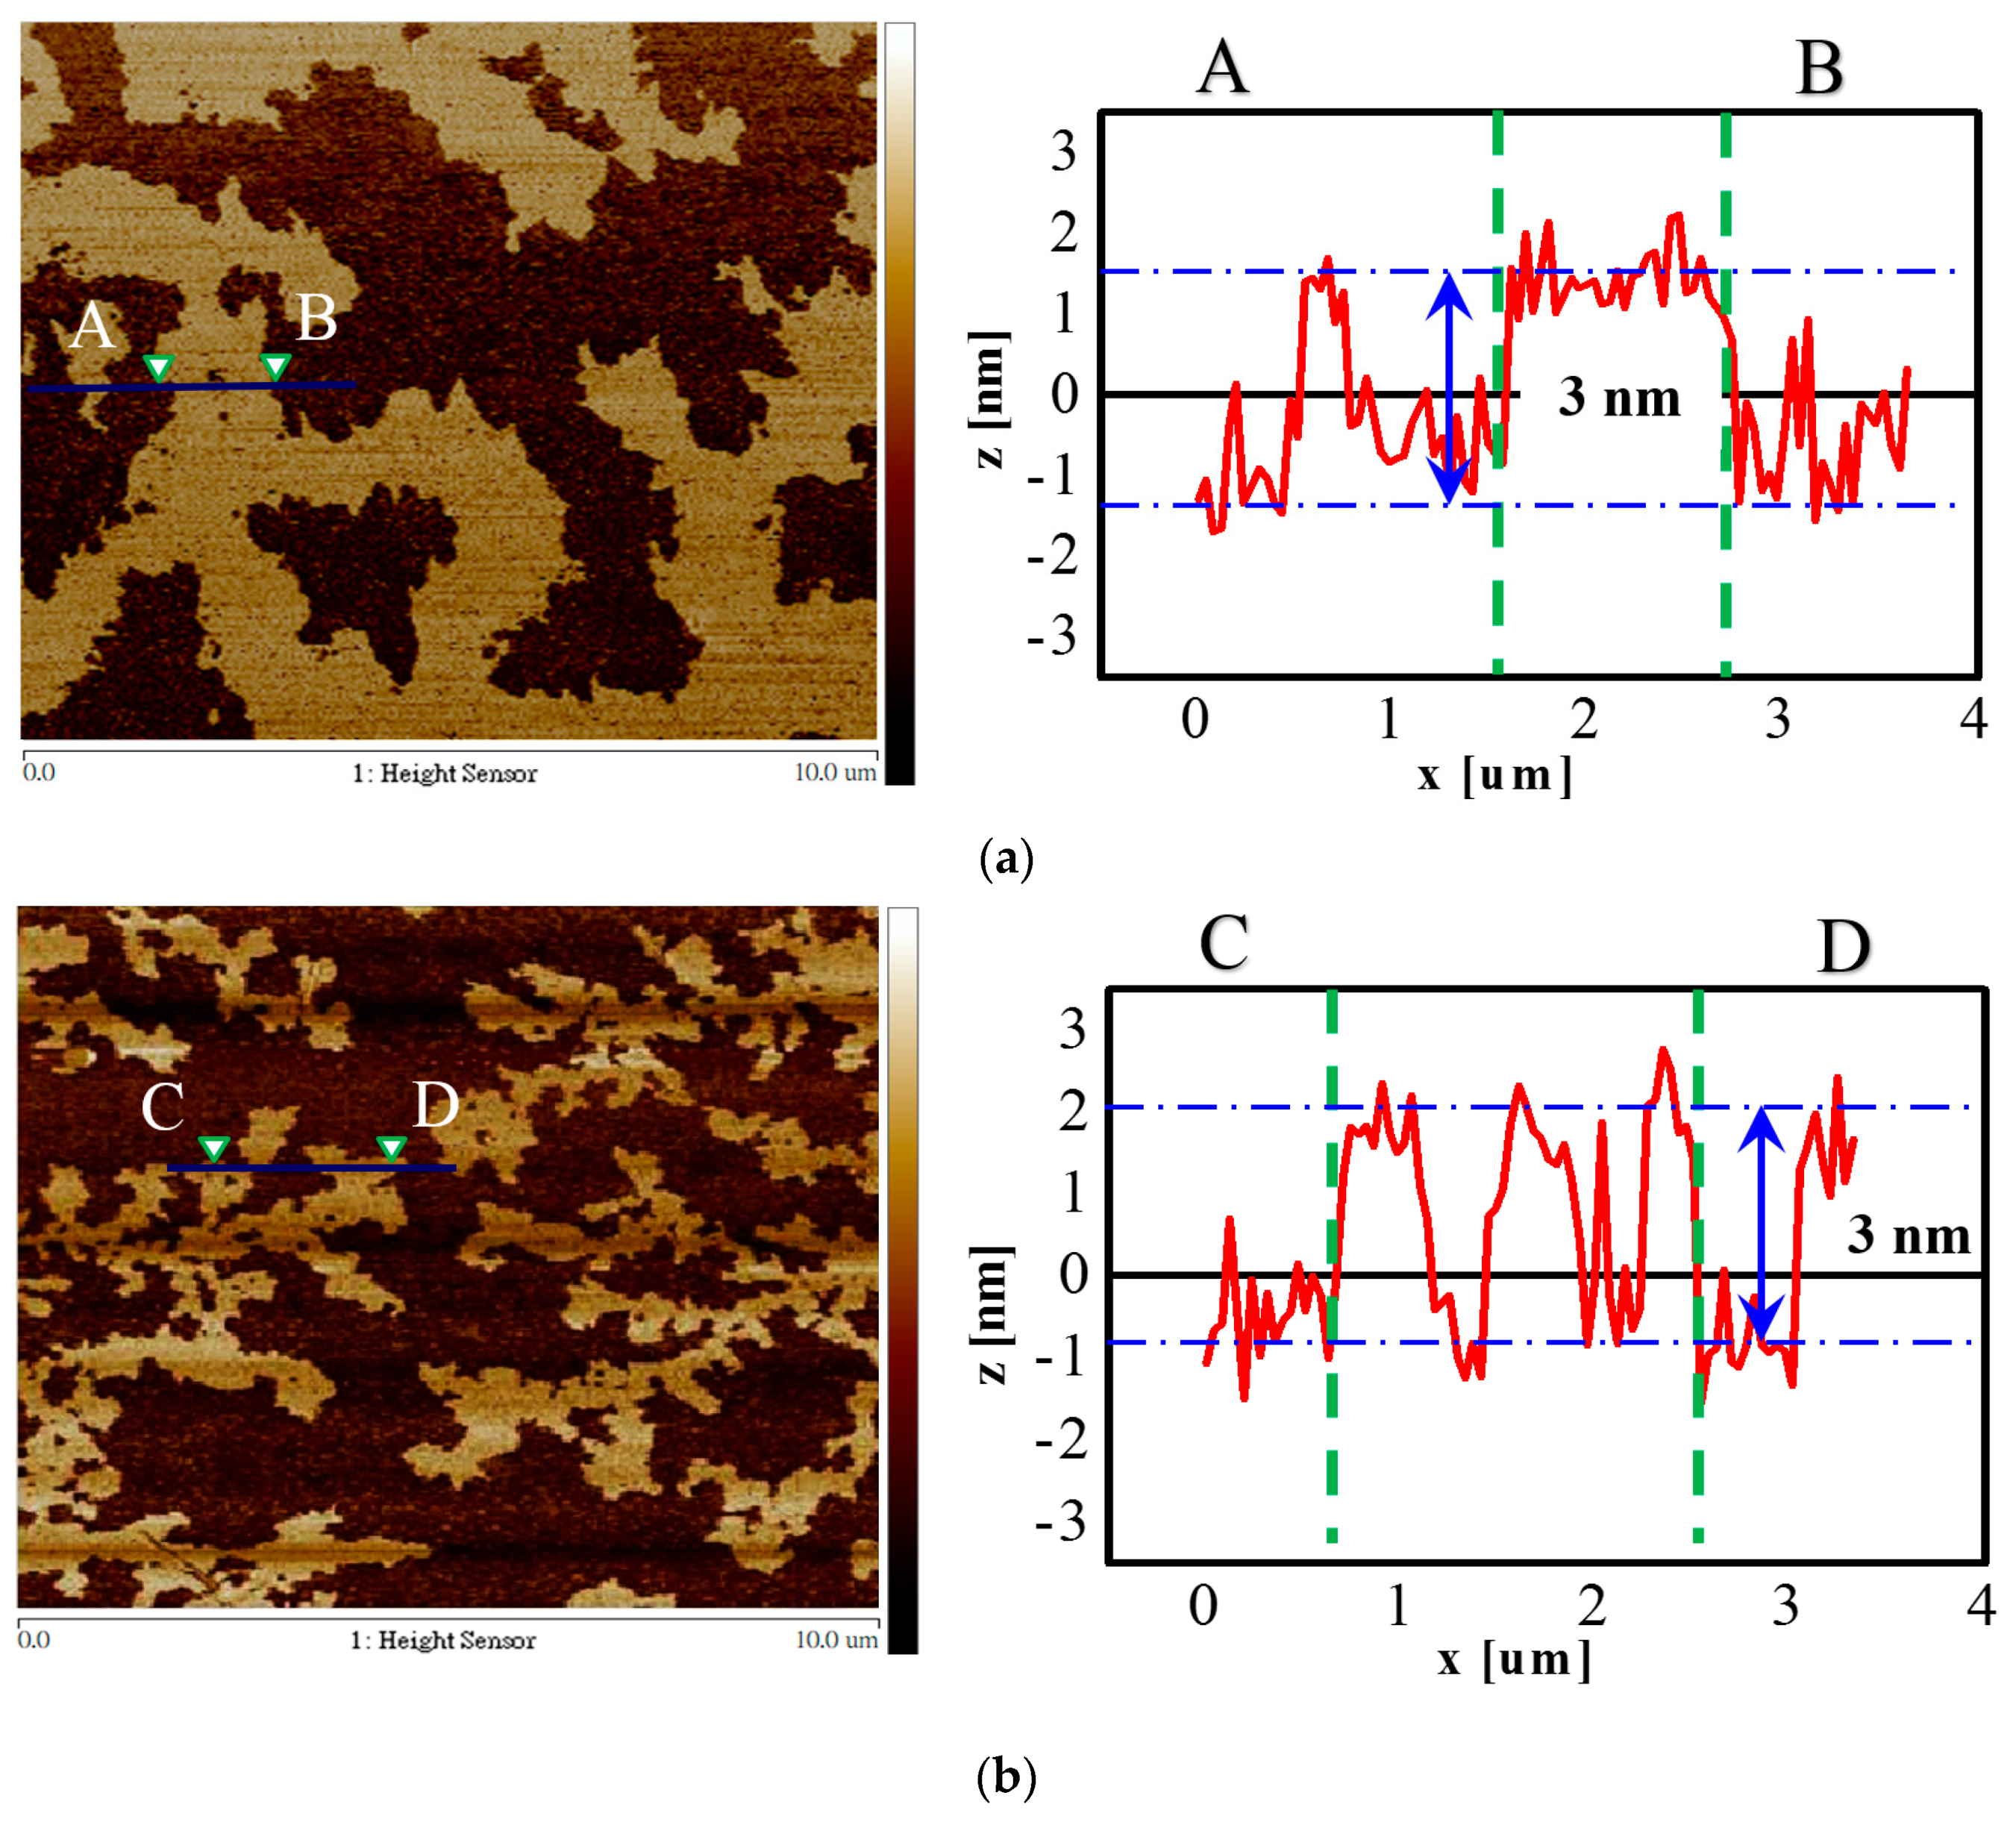
| Ave. thickness of flake (nm) | 3 | 3 |
| XPS C/O (%) | 2.02 | 2.56 |
| TGA loss (wt%) | 60 | 25 |
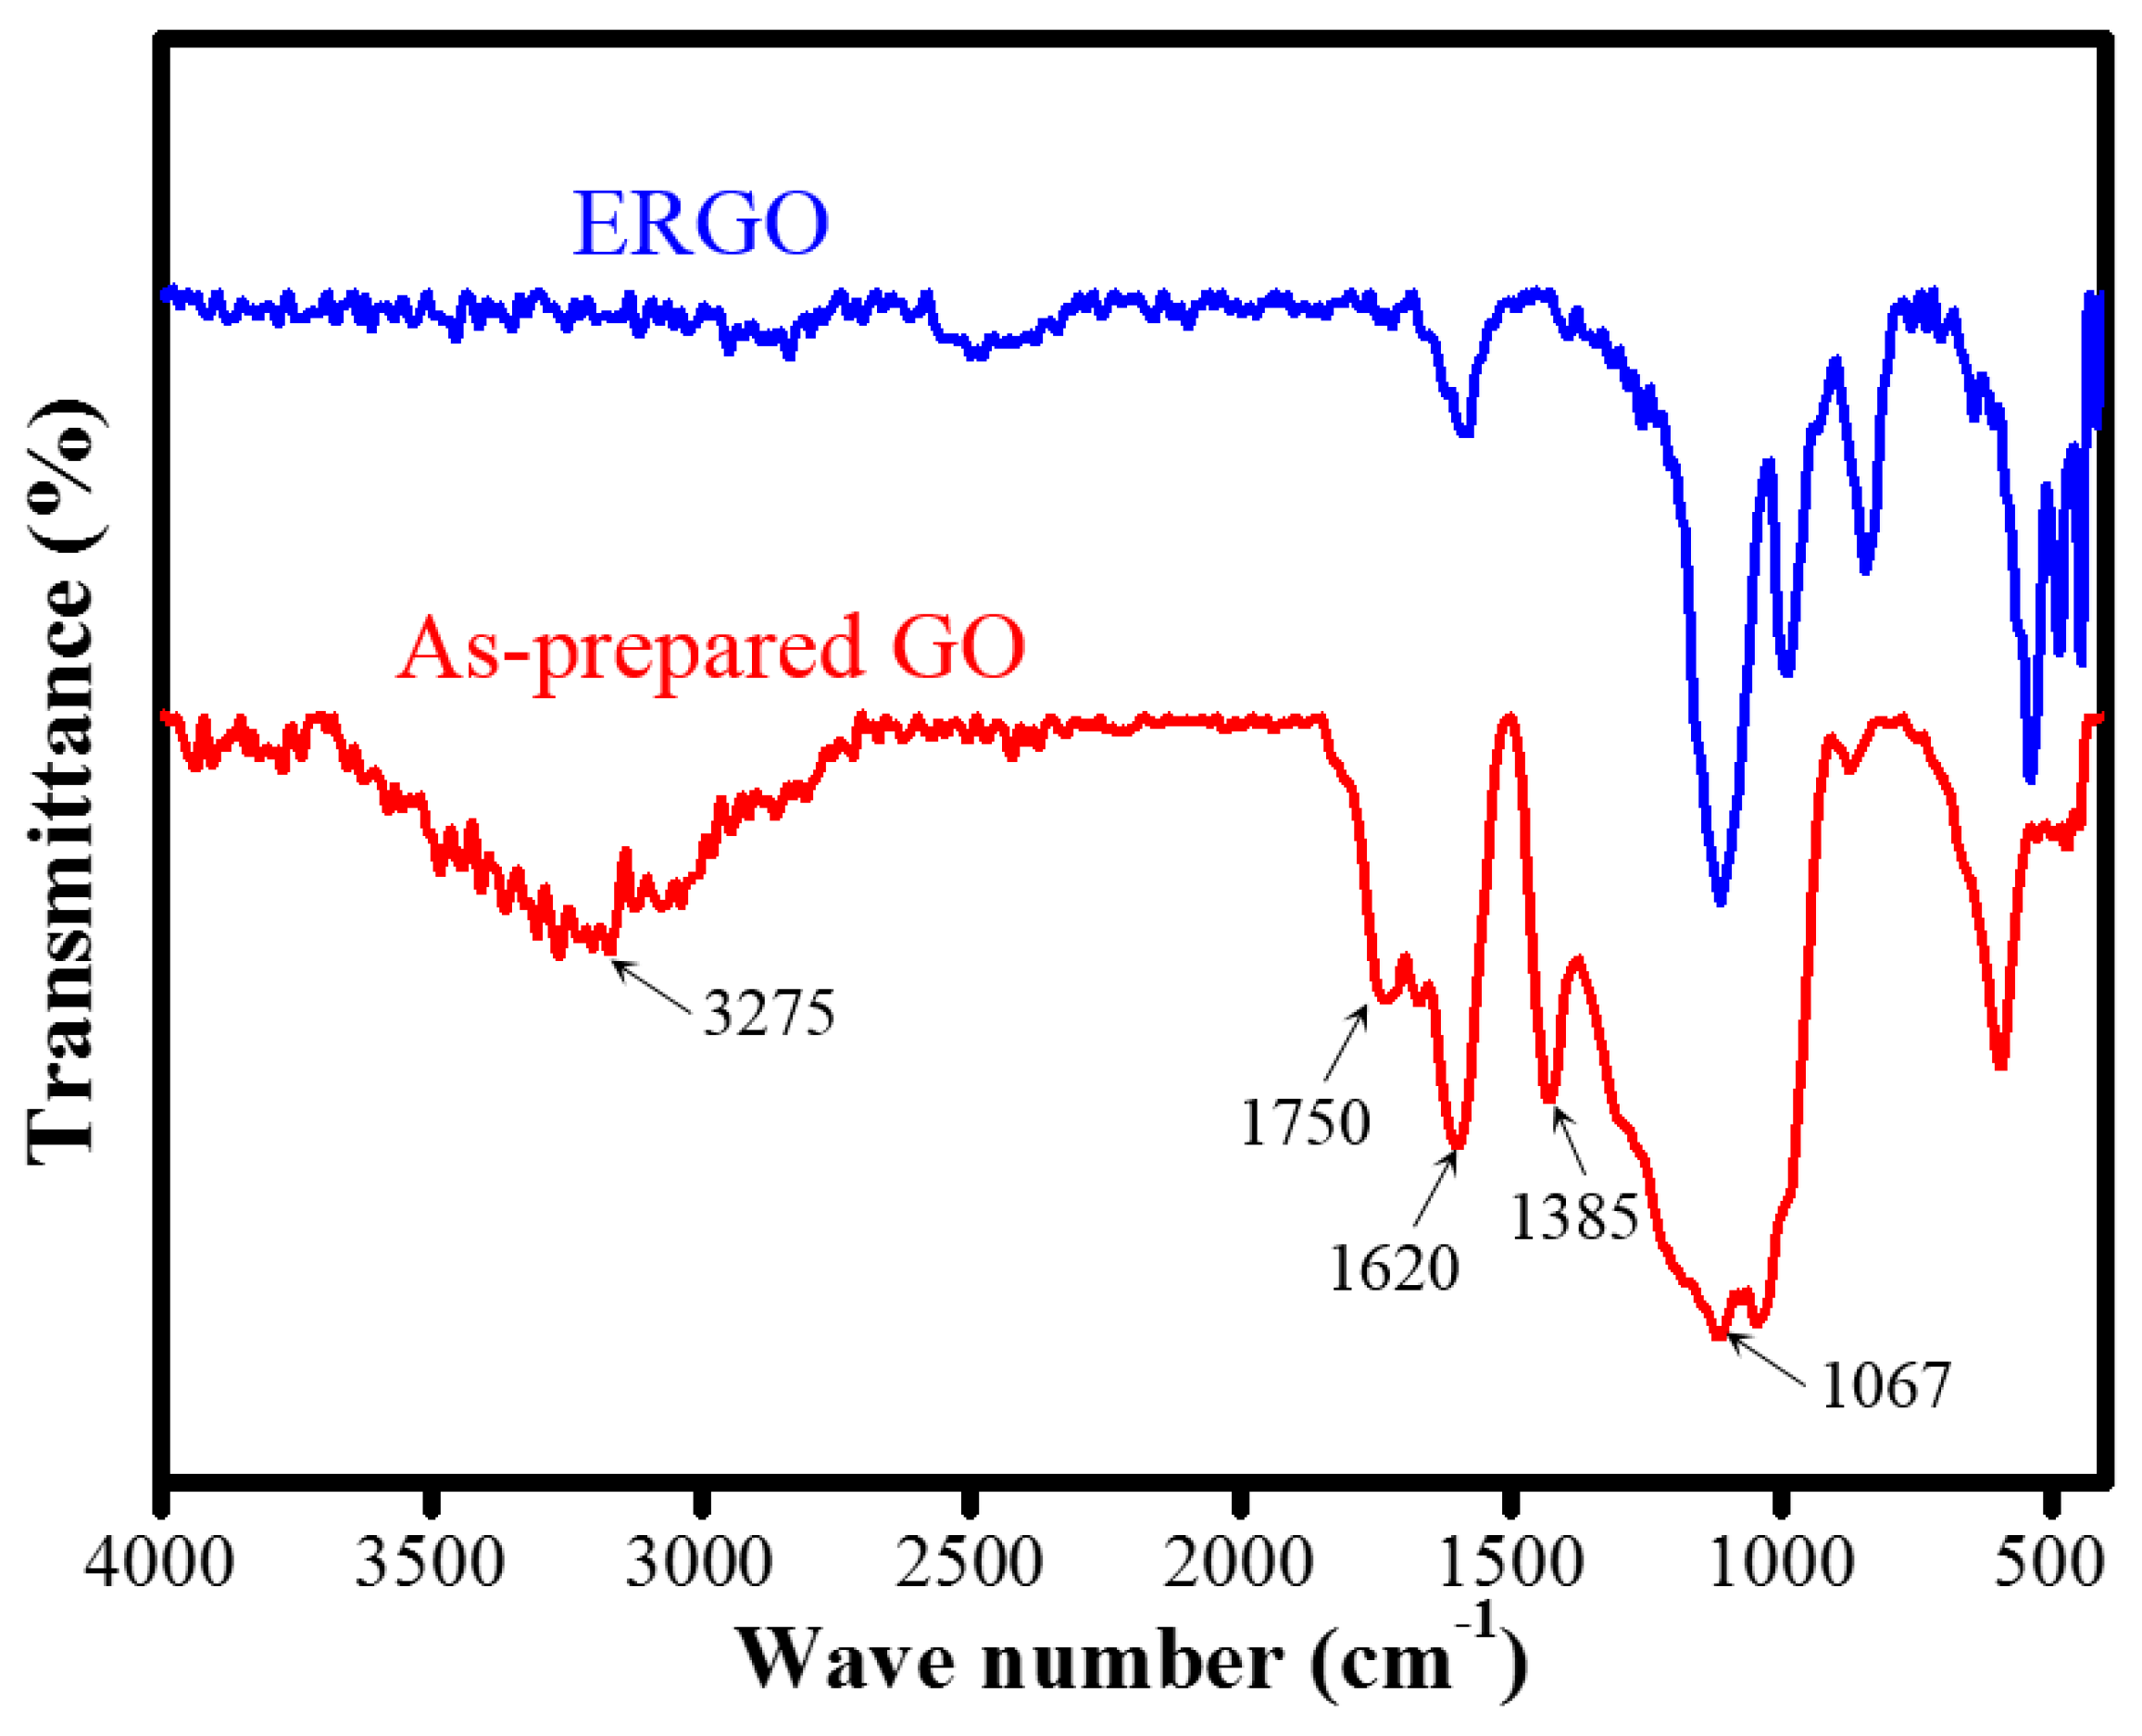
| FTIR functional group | OH/C=O/C=C | Less |
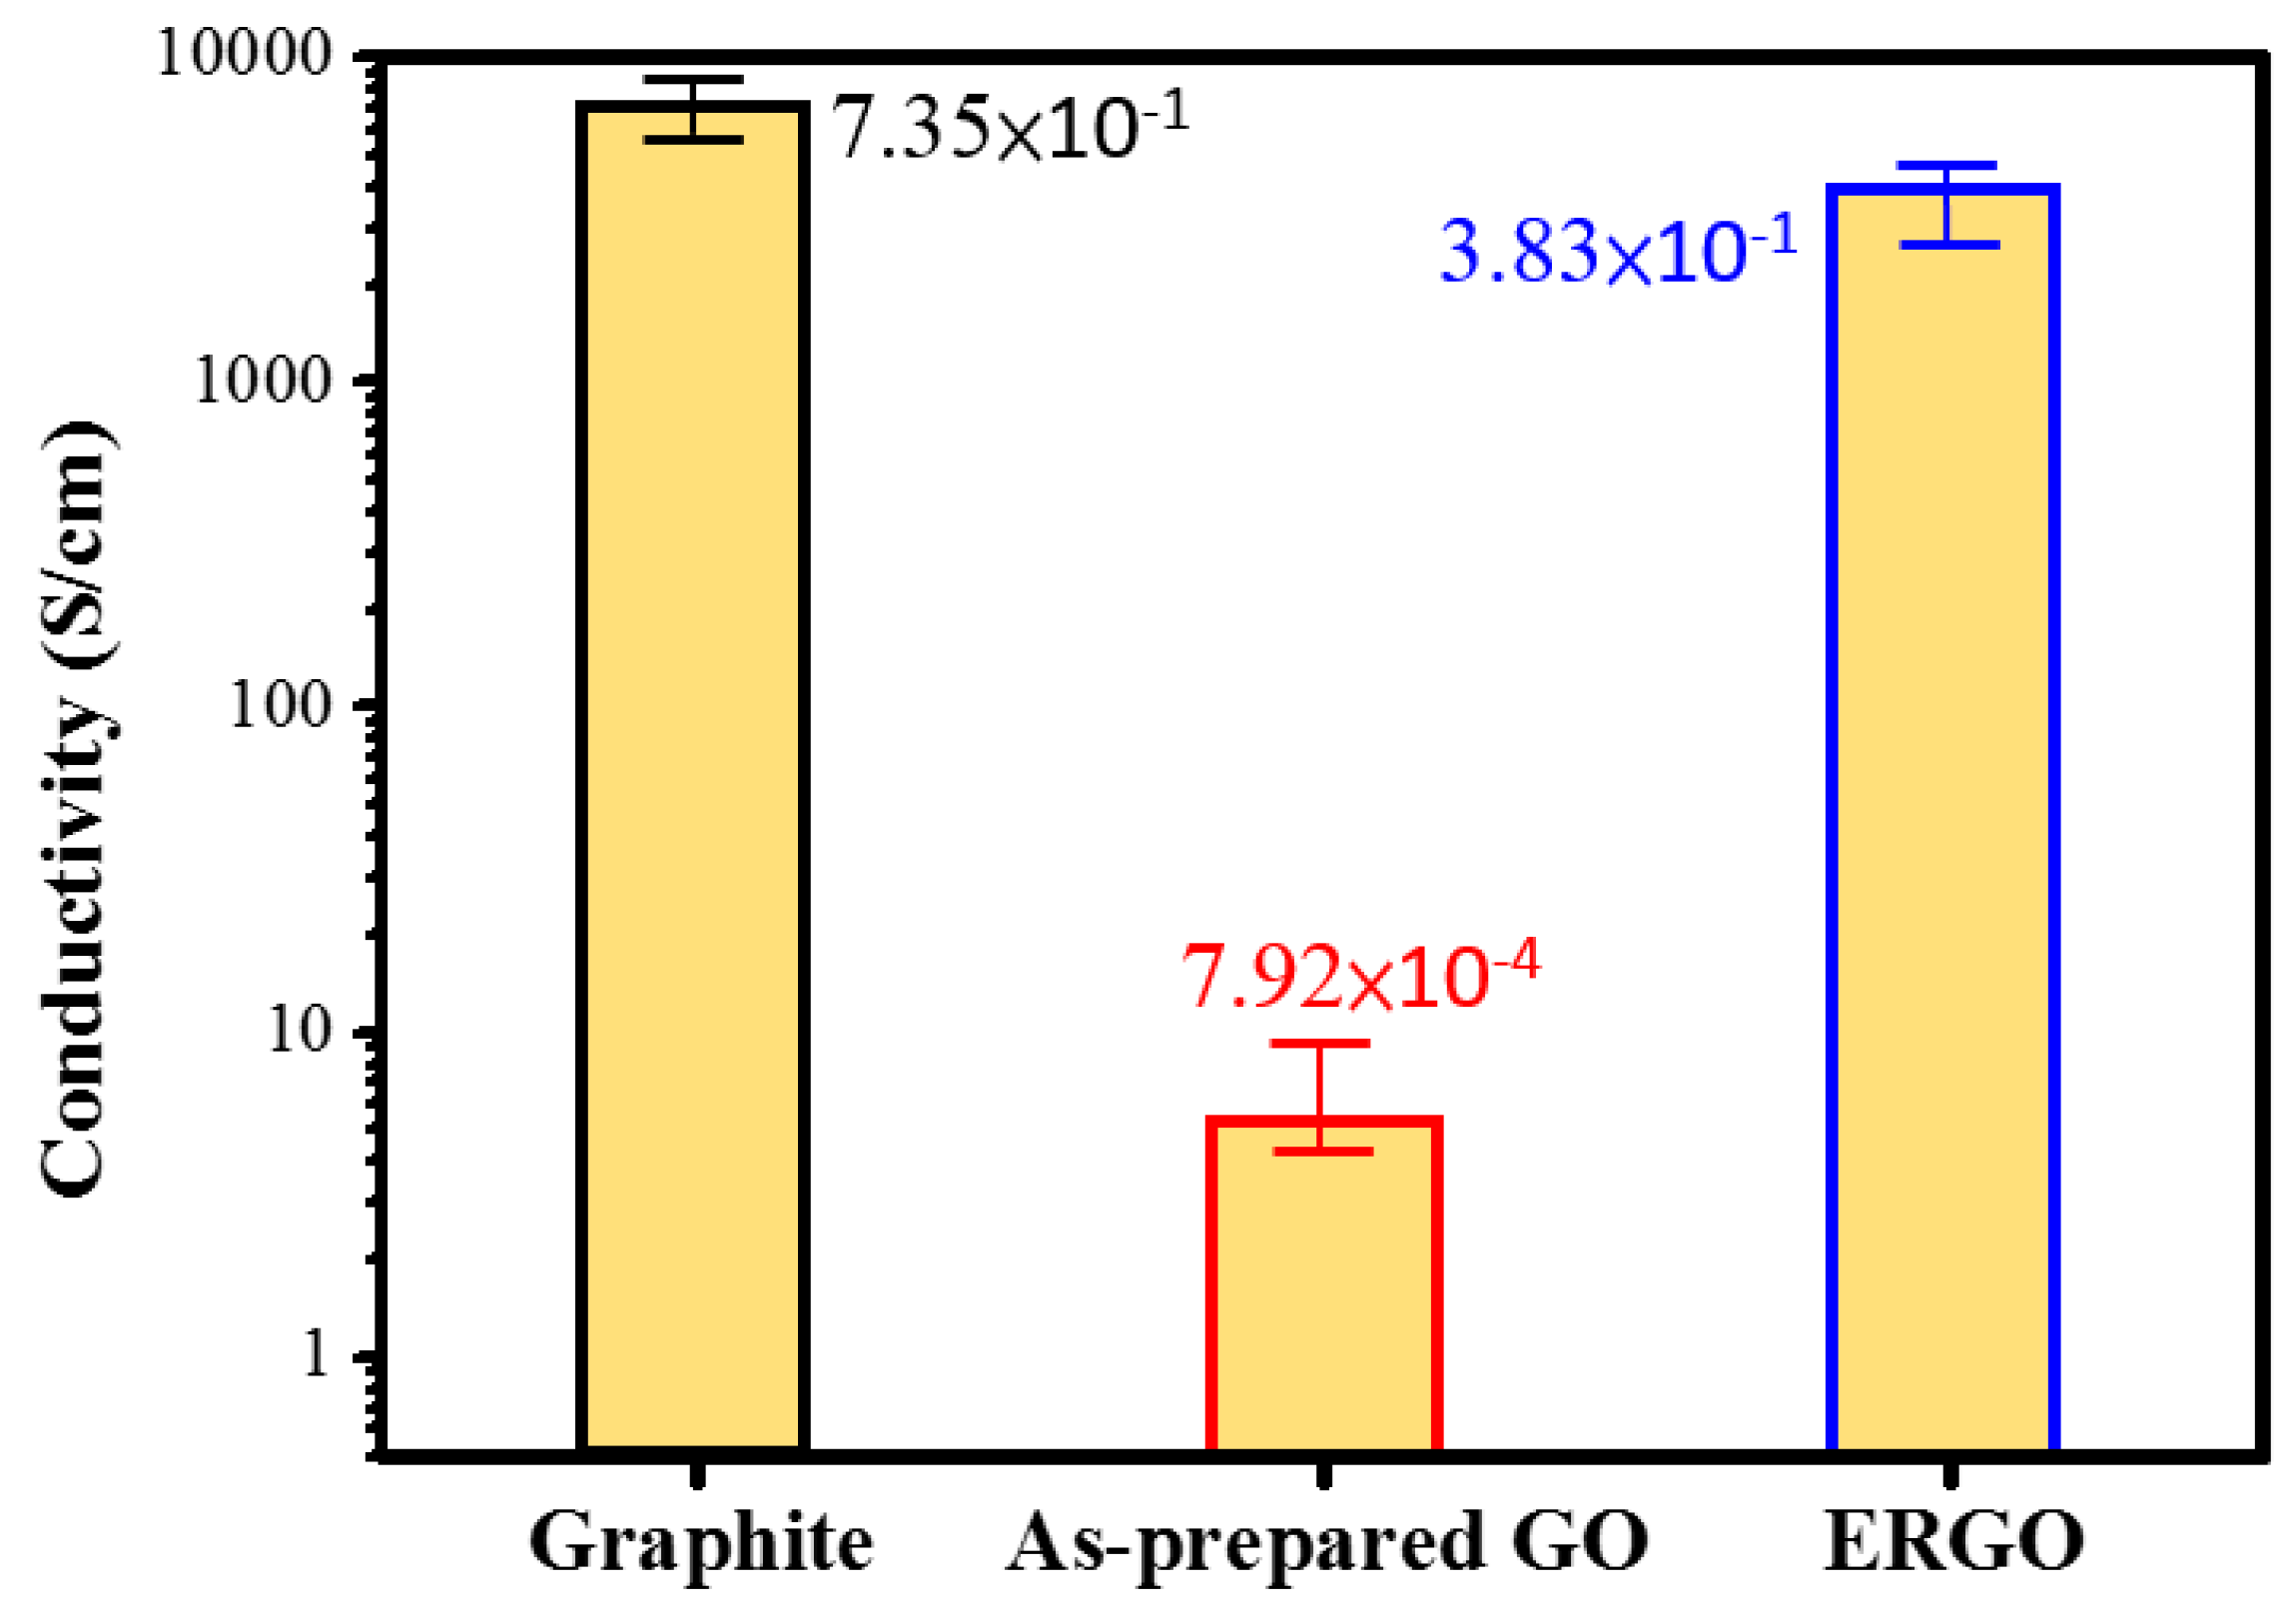
| Electrical conductivity (S·cm−1) | 7.92 × 10⁻⁴ | 3.83 × 10⁻¹ |
© 2019 by the authors. Licensee MDPI, Basel, Switzerland. This article is an open access article distributed under the terms and conditions of the Creative Commons Attribution (CC BY) license (http://creativecommons.org/licenses/by/4.0/).
Share and Cite
Hung, Y.-F.; Cheng, C.; Huang, C.-K.; Yang, C.-R. A Facile Method for Batch Preparation of Electrochemically Reduced Graphene Oxide. Nanomaterials 2019, 9, 376. https://doi.org/10.3390/nano9030376
Hung Y-F, Cheng C, Huang C-K, Yang C-R. A Facile Method for Batch Preparation of Electrochemically Reduced Graphene Oxide. Nanomaterials. 2019; 9(3):376. https://doi.org/10.3390/nano9030376
Chicago/Turabian StyleHung, Yi-Fang, Chia Cheng, Chun-Kai Huang, and Chii-Rong Yang. 2019. "A Facile Method for Batch Preparation of Electrochemically Reduced Graphene Oxide" Nanomaterials 9, no. 3: 376. https://doi.org/10.3390/nano9030376
APA StyleHung, Y.-F., Cheng, C., Huang, C.-K., & Yang, C.-R. (2019). A Facile Method for Batch Preparation of Electrochemically Reduced Graphene Oxide. Nanomaterials, 9(3), 376. https://doi.org/10.3390/nano9030376