Bilayer MoSe2/HfS2 Nanocomposite as a Potential Visible-Light-Driven Z-Scheme Photocatalyst
Abstract
1. Introduction
2. Computational Method
3. Results and Discussion
3.1. Structural Stability
3.2. Electronic Properties
3.3. Optical Properties
4. Conclusions
Author Contributions
Funding
Acknowledgments
Conflicts of Interest
References
- Miseki, Y.; Sayama, K. Photocatalytic Water Splitting for Solar Hydrogen Production Using the Carbonate Effect and the Z-Scheme Reaction. Adv. Energy Mater. 2018, 1801294. [Google Scholar] [CrossRef]
- Fujishima, A.; Honda, K. Electrochemical photolysis of water at a semiconductor electrode. Nature 1972, 238, 37–38. [Google Scholar] [CrossRef] [PubMed]
- Eshete, Y.A.; Ling, N.; Kim, S.; Kim, D.; Hwang, G.; Cho, S.; Yang, H. Vertical Heterophase for Electrical, Electrochemical, and Mechanical Manipulations of Layered MoTe2. Adv. Funct. Mater. 2019, 1904504. [Google Scholar] [CrossRef]
- Bonaccorso, F.; Colombo, L.; Yu, G.; Stoller, M.; Tozzini, V.; Ferrari, A.; Ruoff, R.; Pellegrini, V. Graphene, related two-dimensional crystals, and hybrid systems for energy conversion and storage. Science 2015, 347, 41–51. [Google Scholar] [CrossRef]
- Fan, X.; Yang, Y.; Xiao, P.; Lau, W. Site-specific catalytic activity in exfoliated MoS2 single-layer polytypes for hydrogen evolution: Basal plane and edges. J. Mater. Chem. A 2014, 2, 20545–20551. [Google Scholar] [CrossRef]
- Singh, A.; Mathew, K.; Zhuang, H.; Hennig, R. Computational screening of 2D materials for photocatalysis. J. Phys. Chem. Lett. 2015, 6, 1087–1098. [Google Scholar] [CrossRef]
- Zhu, W.; Qiu, X.; Iancu, V.; Chen, X.; Pan, H.; Wang, W.; Dimitrijevic, N.M.; Rajh, T.; Meyer, H.M.; Paranthaman, M.P.; et al. Band gap narrowing of titanium oxide semiconductors by noncompensated anion-cation codoping for enhanced visible-light photoactivity. Phys. Rev. Lett. 2009, 103, 226401. [Google Scholar] [CrossRef]
- Wang, H.L.; Zhang, L.S.; Chen, Z.G.; Hu, J.Q.; Li, S.J.; Wang, Z.H.; Liu, J.S.; Wang, X.C. Semiconductor heterojunction photocatalysts: Design, construction, and photocatalytic performances. Chem. Soc. Rev. 2014, 43, 5234–5244. [Google Scholar] [CrossRef]
- Formal, F.L.; Pendlebury, S.R.; Cornuz, M.; Tilley, S.D.; Gratzel, M.; Durrant, J.R. Back electron-hole recombination in hematite photoanodes for water splitting. J. Am. Chem. Soc. 2014, 136, 2564–2574. [Google Scholar] [CrossRef]
- Deng, D.H.; Novoselov, K.S.; Fu, Q.; Zheng, N.F.; Tian, Z.Q.; Bao, X.H. catalysis with two-dimensional materials and their heterostructures. Nat. Nanotechnol. 2016, 11, 218–230. [Google Scholar] [CrossRef]
- Zhang, X.; Meng, Z.; Rao, D.; Wang, Y.; Shi, Q.; Liu, Y.; Wu, H.; Deng, K.; Liu, H.; Lu, R. Efficient band structure tuning, charge separation, and visible-light response in ZrS2-based van der Waals heterostructures. Energ. Environ. Sci. 2016, 9, 841–849. [Google Scholar] [CrossRef]
- Zhang, C.H.; Zhao, S.L.; Jin, C.H.; Koh, A.L.; Zhou, Y.; Xu, W.G.; Li, Q.C.; Xiong, Q.H.; Peng, H.L.; Liu, Z.F. Direct growth of large-area graphene and boron nitride heterostructures by a co-segregation method. Nature Commun. 2015, 6, 6519. [Google Scholar] [CrossRef] [PubMed]
- Kang, J.; Tongay, S.; Zhou, J.; Li, J.B.; Wu, J.Q. Band offsets and heterostructures of two-dimensional semiconductors. Appl. Phys. Lett. 2013, 102, 012111. [Google Scholar] [CrossRef]
- Ling, F.; Kang, W.; Jing, H.; Zeng, W.; Chen, Y.; Liu, X.; Zhang, Y.; Qi, L.; Fang, L.; Zhou, M. Enhancing hydrogen evolution on the basal plane of transition metal dichacolgenide van der Waals heterostructures. NPJ Comput. Mater. 2019, 5, 20. [Google Scholar] [CrossRef]
- Wang, B.; Yuan, H.K.; Chang, J.L.; Chen, X.R.; Chen, H. Two dimensional InSe/C2N van der Waals heterojunction as enhanced visible-light responsible photocatalyst for water splitting. Appl. Surf. Sci. 2019, 485, 375–380. [Google Scholar] [CrossRef]
- Bard, A.J. Photoelectrochemistry and heterogeneous photo-catalysis at semiconductors. J. Photochem. 1979, 10, 59–75. [Google Scholar] [CrossRef]
- Pan, Z.M.; Zhang, G.G.; Wang, X.C. Polymeric Carbon Nitride/RGO/Fe2O3: All Solid State Z-Scheme System for Photocatalytic Overall Water Splitting. Angew. Chem. Int. Ed. 2019, 58, 7102–7106. [Google Scholar] [CrossRef]
- Fu, C.F.; Luo, Q.Q.; Liao, X.X.; Yang, J.L. Two-dimensional van der waals nanocomposites as z-scheme type photocatalysts for hydrogen production from overall water splitting. J. Mater. Chem. A 2016, 4, 18892–18898. [Google Scholar] [CrossRef]
- Maeda, K. Z-scheme water splitting using two different semiconductor photocatalysts. ACS Catal. 2013, 3, 1486–1503. [Google Scholar] [CrossRef]
- Zhou, P.; Yu, J.G.; Jaroniec, M. All-solid-state z-scheme photocatalytic systems. Adv. Mater. 2014, 26, 4920–4935. [Google Scholar] [CrossRef]
- Li, J.Q.; Yuan, H.; Zhu, Z.F. Artificial photosynthetic z-scheme photocatalyst for hydrogen evolution with high quantum efficiencys. J. Mol. Catal. A Chem. 2015, 410, 133–139. [Google Scholar] [CrossRef]
- Wang, L.; Zheng, X.S.; Chen, L.; Xiong, Y.J.; Xu, H.X. Van der waals heterostructures comprised of ultrathin polymer nanosheets for efficient z scheme overall water splitting. Angew. Chem. Int. Ed. 2018, 57, 3454–3458. [Google Scholar] [CrossRef] [PubMed]
- Guo, H.L.; Du, H.; Jiang, Y.F.; Jiang, N.; Shen, C.C.; Zhou, X.; Liu, Y.N.; Xu, A.W. Artificial photosynthetic z-scheme photocatalyst for hydrogen evolution with high quantum efficiencys. J. Phys. Chem. C 2017, 121, 107–114. [Google Scholar] [CrossRef]
- Fan, Y.C.; Yang, B.; Song, X.H.; Shao, X.F.; Zhao, M.W. Direct z–scheme photocatalytic overall water splitting on 2D CdS/InSe heterostructures. J. Phys. D Appl. Phys. 2018, 51, 395501. [Google Scholar] [CrossRef]
- Fu, C.F.; Zhang, R.Q.; Luo, Q.Q.; Li, X.X.; Yang, J.L. Construction of Direct Z-Scheme Photocatalysts for Overall Water Splitting Using Two-Dimensional van der Waals Heterojunctions of Metal Dichalcogenides. J. Comput. Chem. 2019, 40, 980–987. [Google Scholar] [CrossRef]
- Ju, L.; Dai, Y.; Wei, W.; Li, M.M.; Huang, B.B. DFT investigation on two-dimensional GeS/WS2 van der Waals heterostructure for direct Z-scheme photocatalytic overall water splitting. Appl. Surf. Sci. 2018, 434, 365–374. [Google Scholar] [CrossRef]
- Li, H.; Tu, W.; Zhou, Y.; Zou, Z. Z-scheme photocatalytic systems for promoting photocatalytic performance: Recent progress and future challenges. Adv. Sci. 2016, 31, 500389. [Google Scholar] [CrossRef]
- Di, T.M.; Zhu, B.C.; Cheng, B.; Yu, J.G.; Xu, J.S. A direct Z-scheme g-C3N4/SnS2 photocatalyst with superior visible-light CO2 reduction performance. J. Catal. 2017, 352, 532–541. [Google Scholar] [CrossRef]
- Meng, A.Y.; Zhu, B.C.; Zhong, B.; Zhang, L.Y.; Cheng, B. Direct Z-scheme TiO2/CdS hierarchical photocatalyst for enhanced photocatalytic H2-production activity. Appl. Surf. Sci. 2017, 422, 518–527. [Google Scholar] [CrossRef]
- Liu, F.L.; Shi, R.; Wang, Z.; Weng, Y.X.; Che, C.M.; Chen, Y. Direct z scheme hetero-phase junction of black/red phosphorus for photocatalytic water splitting. Angew. Chem. Int. Ed. 2019, 58, 11791–11795. [Google Scholar] [CrossRef]
- Zhang, W.J.; Hu, Y.; Yan, C.Z.; Hong, D.C.; Chen, R.P.; Xue, X.L.; Yang, S.Y.; Tian, Y.X.; Tie, Z.X.; Jin, Z. Surface plasmon resonance enhanced direct Z-scheme TiO2/ZnTe/Au nanocorncob heterojunctions for efficient photocatalytic overall water splitting. Nanoscale 2019, 11, 9053–9060. [Google Scholar] [CrossRef] [PubMed]
- Wang, Q.; Hisatomi, T.; Jia, Q.; Tokudome, H.; Zhong, M.; Wang, C.; Pan, Z.; Takata, K.; Nakabayashi, M.; Shibata, N.; et al. Scalable water splitting on particulate photocatalyst sheets with a solar-to-hydrogen energy conversion eciency exceeding 1%. Nat. Mater. 2016, 15, 611–615. [Google Scholar] [CrossRef] [PubMed]
- Novoselov, K.; Geim, A.; Morozov, S.; Jiang, D.; Zhang, Y.; Dubonos, S.; Grigorieva, I.; Firsov, A. Electric field effect in atomically thin carbon films. Science 2004, 306, 666–669. [Google Scholar] [CrossRef] [PubMed]
- Zhao, Z.W.; Sun, Y.J.; Dong, F. Graphitic carbon nitride based nanocomposites: A review. Nanoscale 2015, 7, 15–37. [Google Scholar] [CrossRef]
- Coleman, J.N.; Lotya, M.; O’Neill, A.; Bergin, S.D.; King, P.J.; Khan, U.; Young, K.; Gaucher, A.; De, S.; Smith, R.J. Two-dimensional nanosheets produced by liquid exfoliation of layered materials. Science 2011, 331, 568–571. [Google Scholar] [CrossRef]
- Singh, D.; Gupta, S.K.; Sonvane, Y.; Kumarc, A.; Ahujad, R. 2D-HfS2 as an efficient photocatalyst for water splitting. Catal. Sci. Technol. 2016, 6, 6605–6614. [Google Scholar] [CrossRef]
- Zhang, H. Ultrathin two-dimensional nanomaterials. ACS Nano 2015, 9, 9451–9469. [Google Scholar] [CrossRef]
- Novoselov, K.S.; Mishchenko, A.; Carvalho, A.; Neto, A.H.C. 2D materials and van der Waals heterostructures. Science 2016, 353, 461–473. [Google Scholar] [CrossRef]
- Zhuang, H.; Hennig, R. Theoretical perspective of photocatalytic properties of single-layer SnS2. Phys. Rev. B 2013, 88, 115314. [Google Scholar] [CrossRef]
- Zhuang, H.; Hennig, R. Single-layer group-III monochalcogenide photocatalysts for water splitting. Chem. Mater. 2013, 25, 3232–3238. [Google Scholar] [CrossRef]
- Yi, J.J.; Li, H.P.; Gong, Y.J.; She, X.J.; Song, Y.H.; Xu, Y.G.; Deng, J.J.; Yuan, S.Q.; Xu, H.; Li, H.M. Phase and interlayer effect of transition metal dichalcogenide cocatalyst toward photocatalytic hydrogen evolution: The case of MoSe2. Appl. Cata. B Environ. 2019, 243, 330–336. [Google Scholar] [CrossRef]
- Zhu, J.D.; Xu, S.R.; Ning, J.; Wang, D.; Zhang, J.C.; Hao, Y. Gate-Tunable Electronic Structure of Black Phosphorus/HfS2 P−N van der Waals Heterostructure with Uniformly Anisotropic Band Dispersion. J. Phys. Chem. C 2017, 121, 24845–24852. [Google Scholar] [CrossRef]
- Xu, Y.; Zhao, W.; Xu, R.; Shi, Y.; Zhang, B. Synthesis of ultrathin CdS nanosheets as efficient visible-light-driven water splitting photocatalysts for hydrogen evolution. Chem. Commun. 2013, 49, 9803–9805. [Google Scholar] [CrossRef] [PubMed]
- Wang, B.; Kuang, A.L.; Luo, X.K.; Wang, G.Z.; Yuan, H.K.; Chen, H. Bandgap engineering and charge separation in two-dimensional GaS-based van der Waals heterostructures for photocatalytic water splitting. Appl. Surf. Sci. 2018, 439, 374–379. [Google Scholar] [CrossRef]
- Kresse, G.; Furthmüller, J. Efficient iterative schemes for ab initio total energy calculations using a plane-wave basis set. Phys. Rev. B 1996, 54, 11169–11186. [Google Scholar] [CrossRef]
- Kresse, G.; Joubert, D. From ultrasoft pseudopotentials to the projector augmented-wave method. Phys. Rev. B 1999, 59, 1758–1775. [Google Scholar] [CrossRef]
- Blöchl, P.E. Projector augmented wave method. Phys. Rev. B 1994, 540, 17953–17979. [Google Scholar] [CrossRef]
- White, J.A.; Bird, D.M. Implementation of gradient-corrected exchange correlation potentials in Car-Parrinello total-energy calculations. Phys. Rev. B 1994, 50, 4954–4957. [Google Scholar] [CrossRef]
- Ernzerhof, M.; Scuseria, G.E. Assessment of the Perdew-Burke-Ernzerh of exchange-correlation functional. J. Chem. Phys. 1999, 110, 5029–5036. [Google Scholar] [CrossRef]
- Bengtsson, L. Dipole correction for surface supercell calculations. Phys. Rev. B 1999, 50, 12301. [Google Scholar] [CrossRef]
- Heyd, J.; Scuseria, G.E. Hybrid functionals based on a screened Coulomb potential. J. Chem. Phys. 2003, 118, 8207–8215. [Google Scholar] [CrossRef]
- Grimme, S.; Antony, J.; Ehrlich, S.; Krieg, S. A consistent and accurate ab initio parametrization of density functional dispersion correction (DFT-D) for the 94 elements H-Pu. J. Chem. Phys. 2010, 132, 154104. [Google Scholar] [CrossRef] [PubMed]
- Monkhorst, H.J.; Pack, J.D. Special points for Brillouin-zone integrations. Phys. Rev. B 1976, 13, 5188–5192. [Google Scholar] [CrossRef]
- Ramasubramaniam, A. Large excitonic effects in monolayers of molybdenum and tungsten dichalcogenides. Phys. Rev. B 2012, 86, 115409. [Google Scholar] [CrossRef]
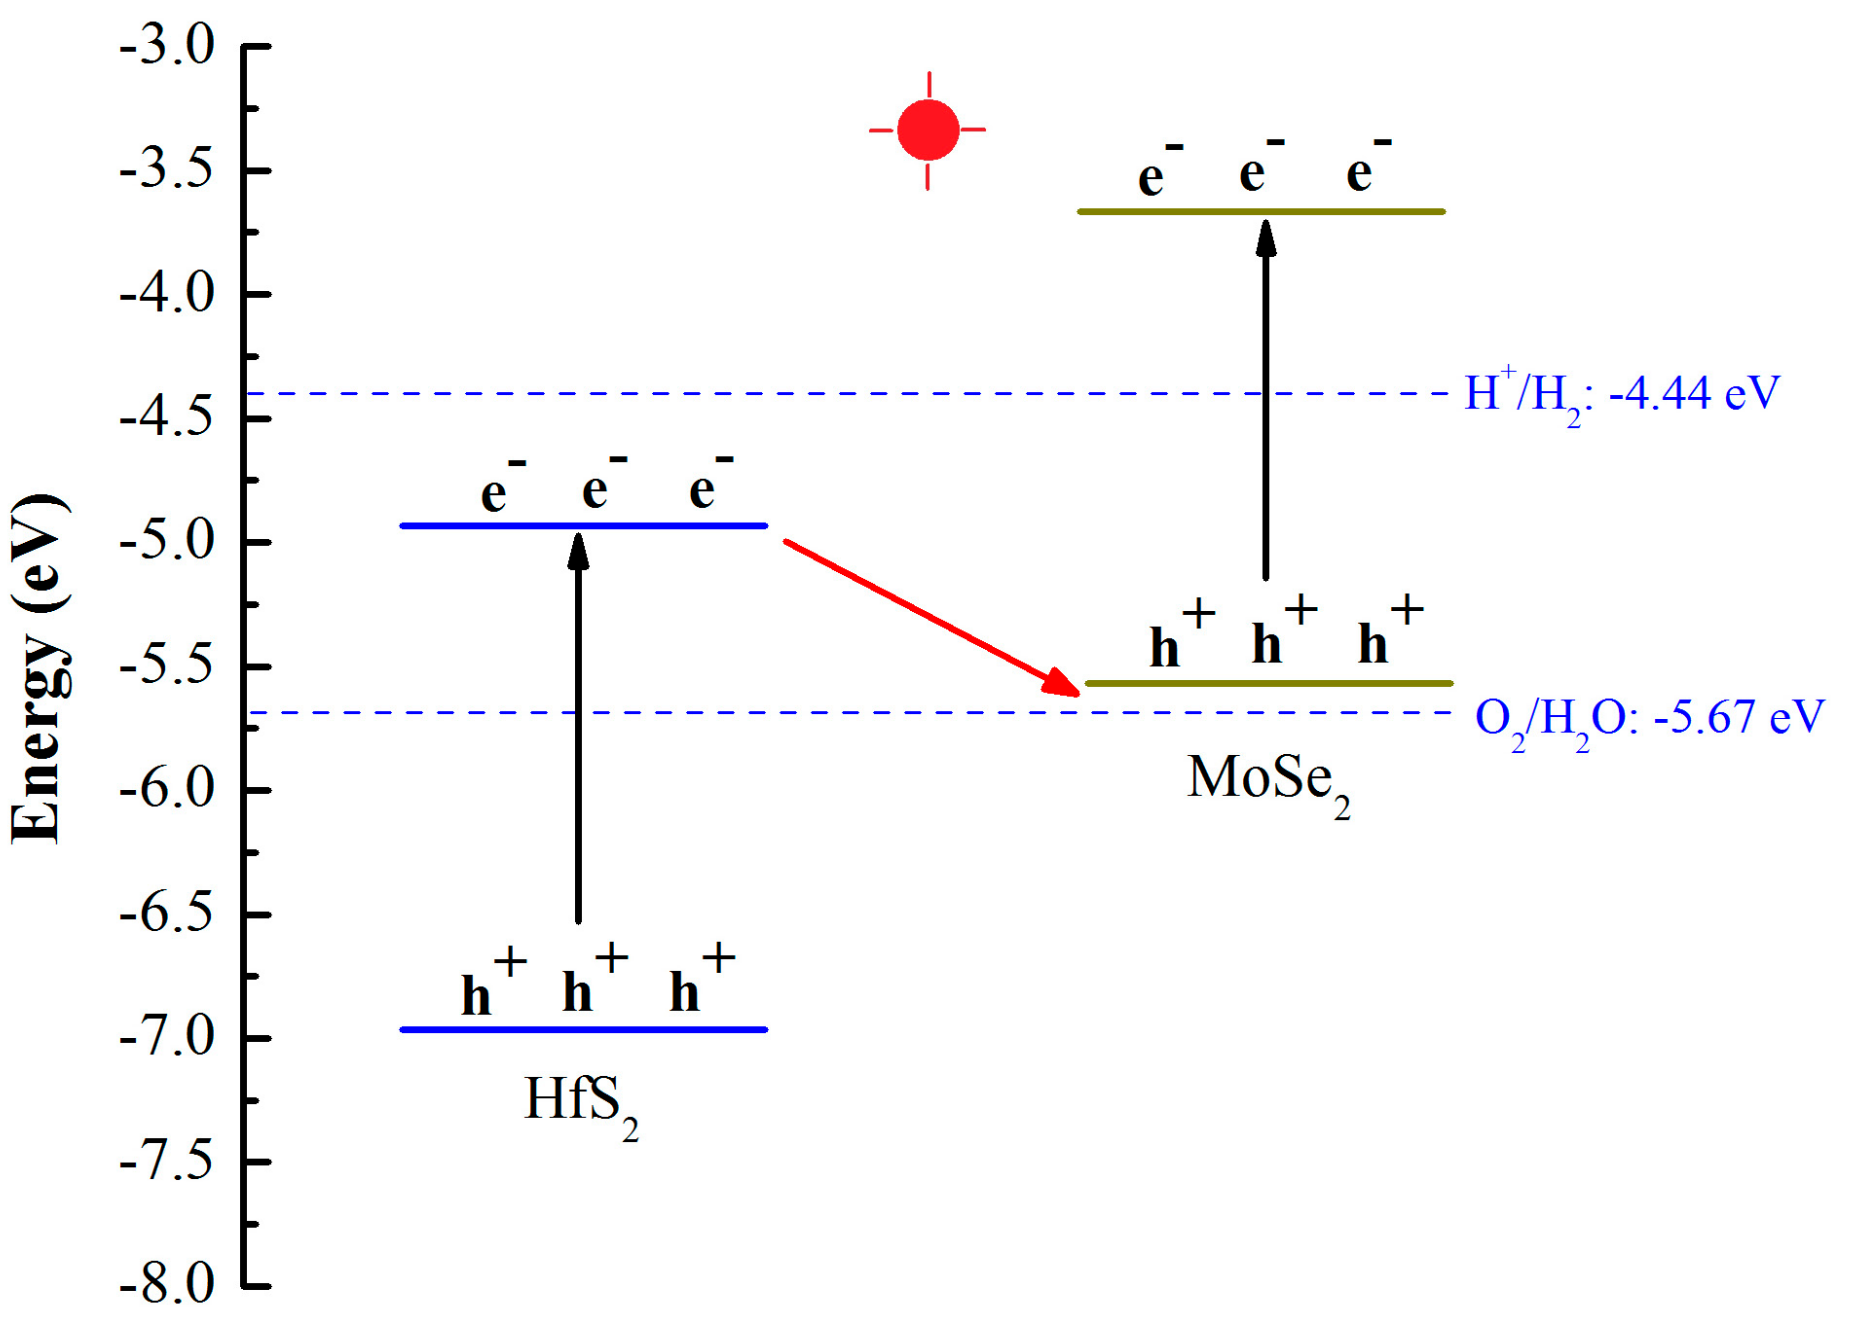
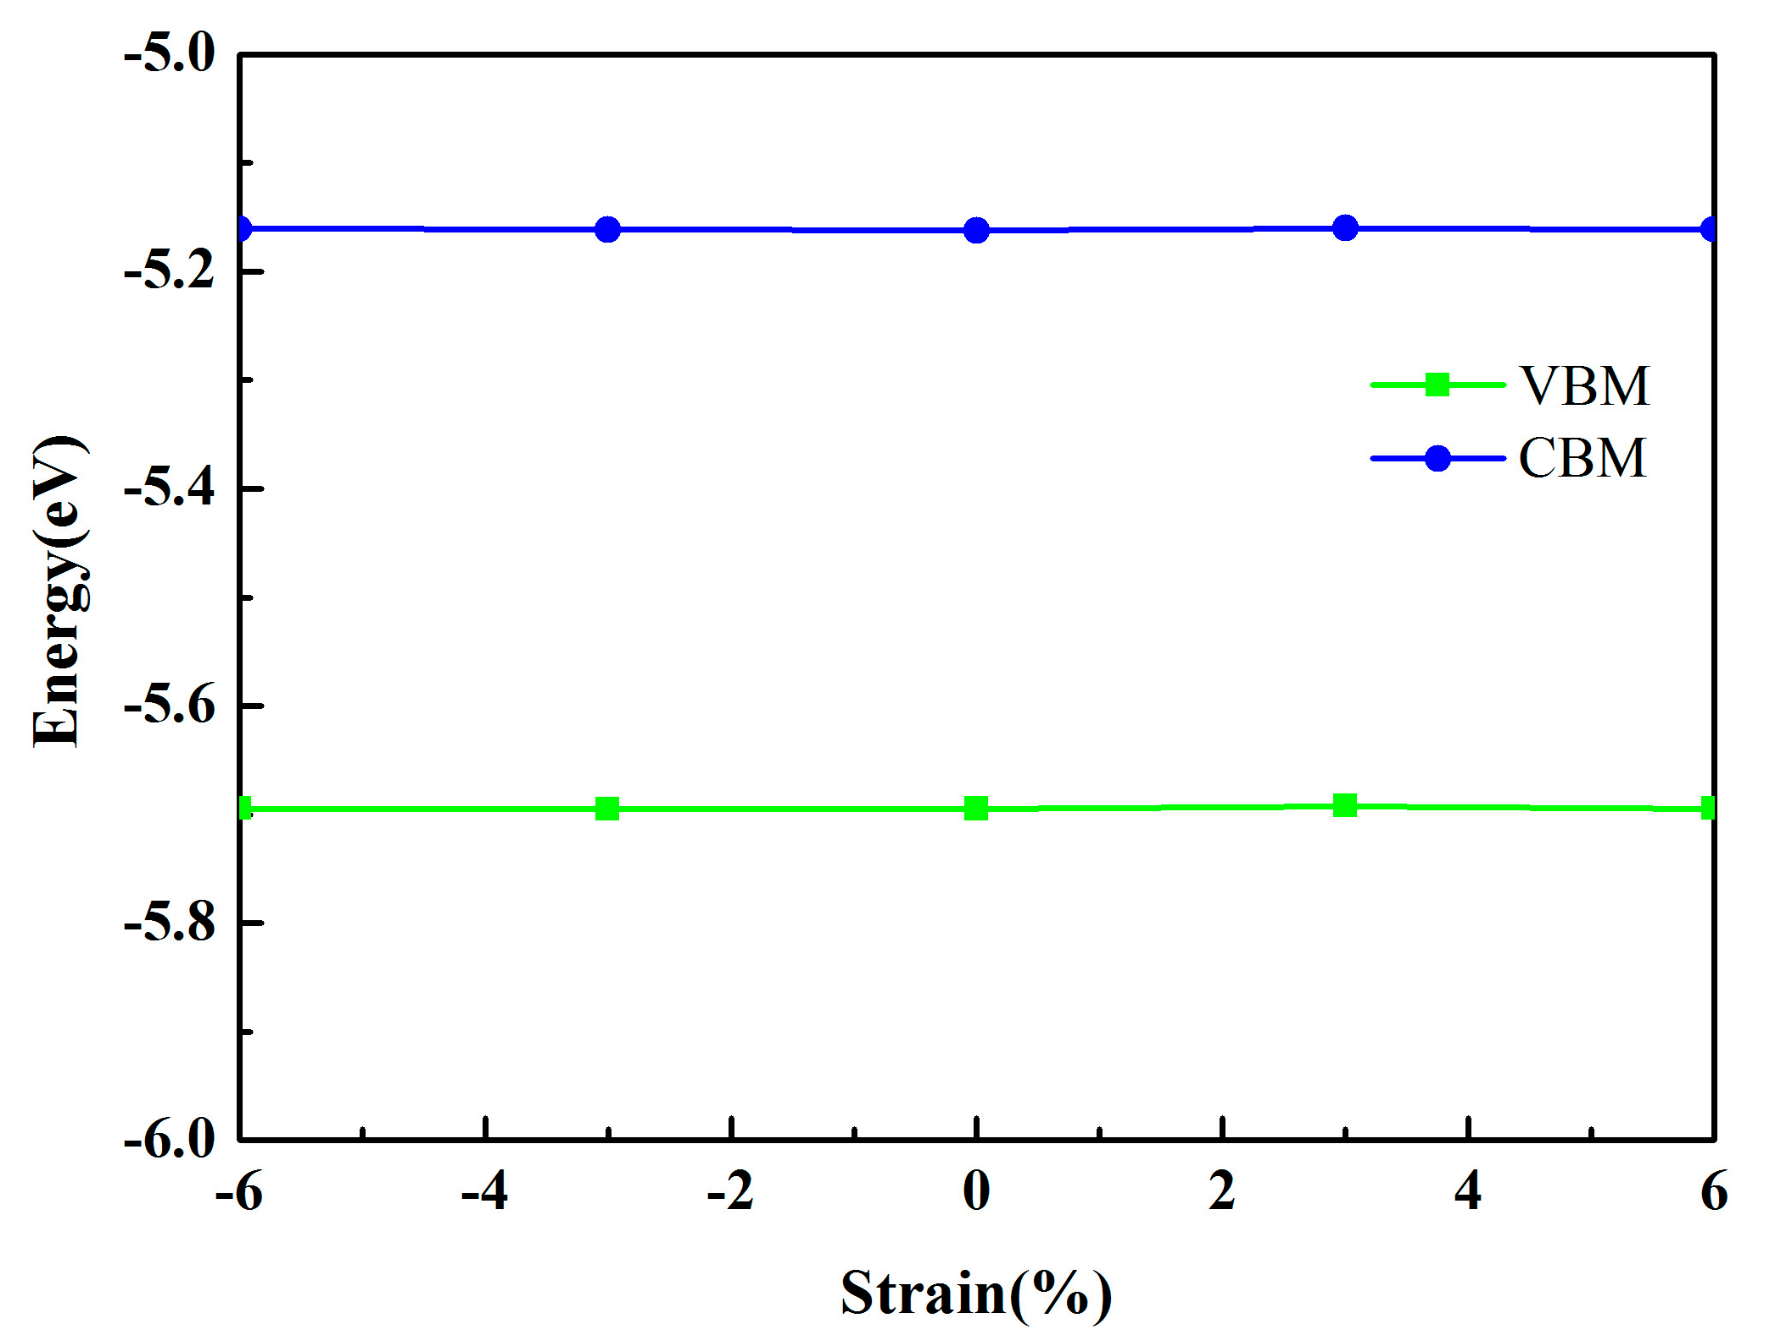
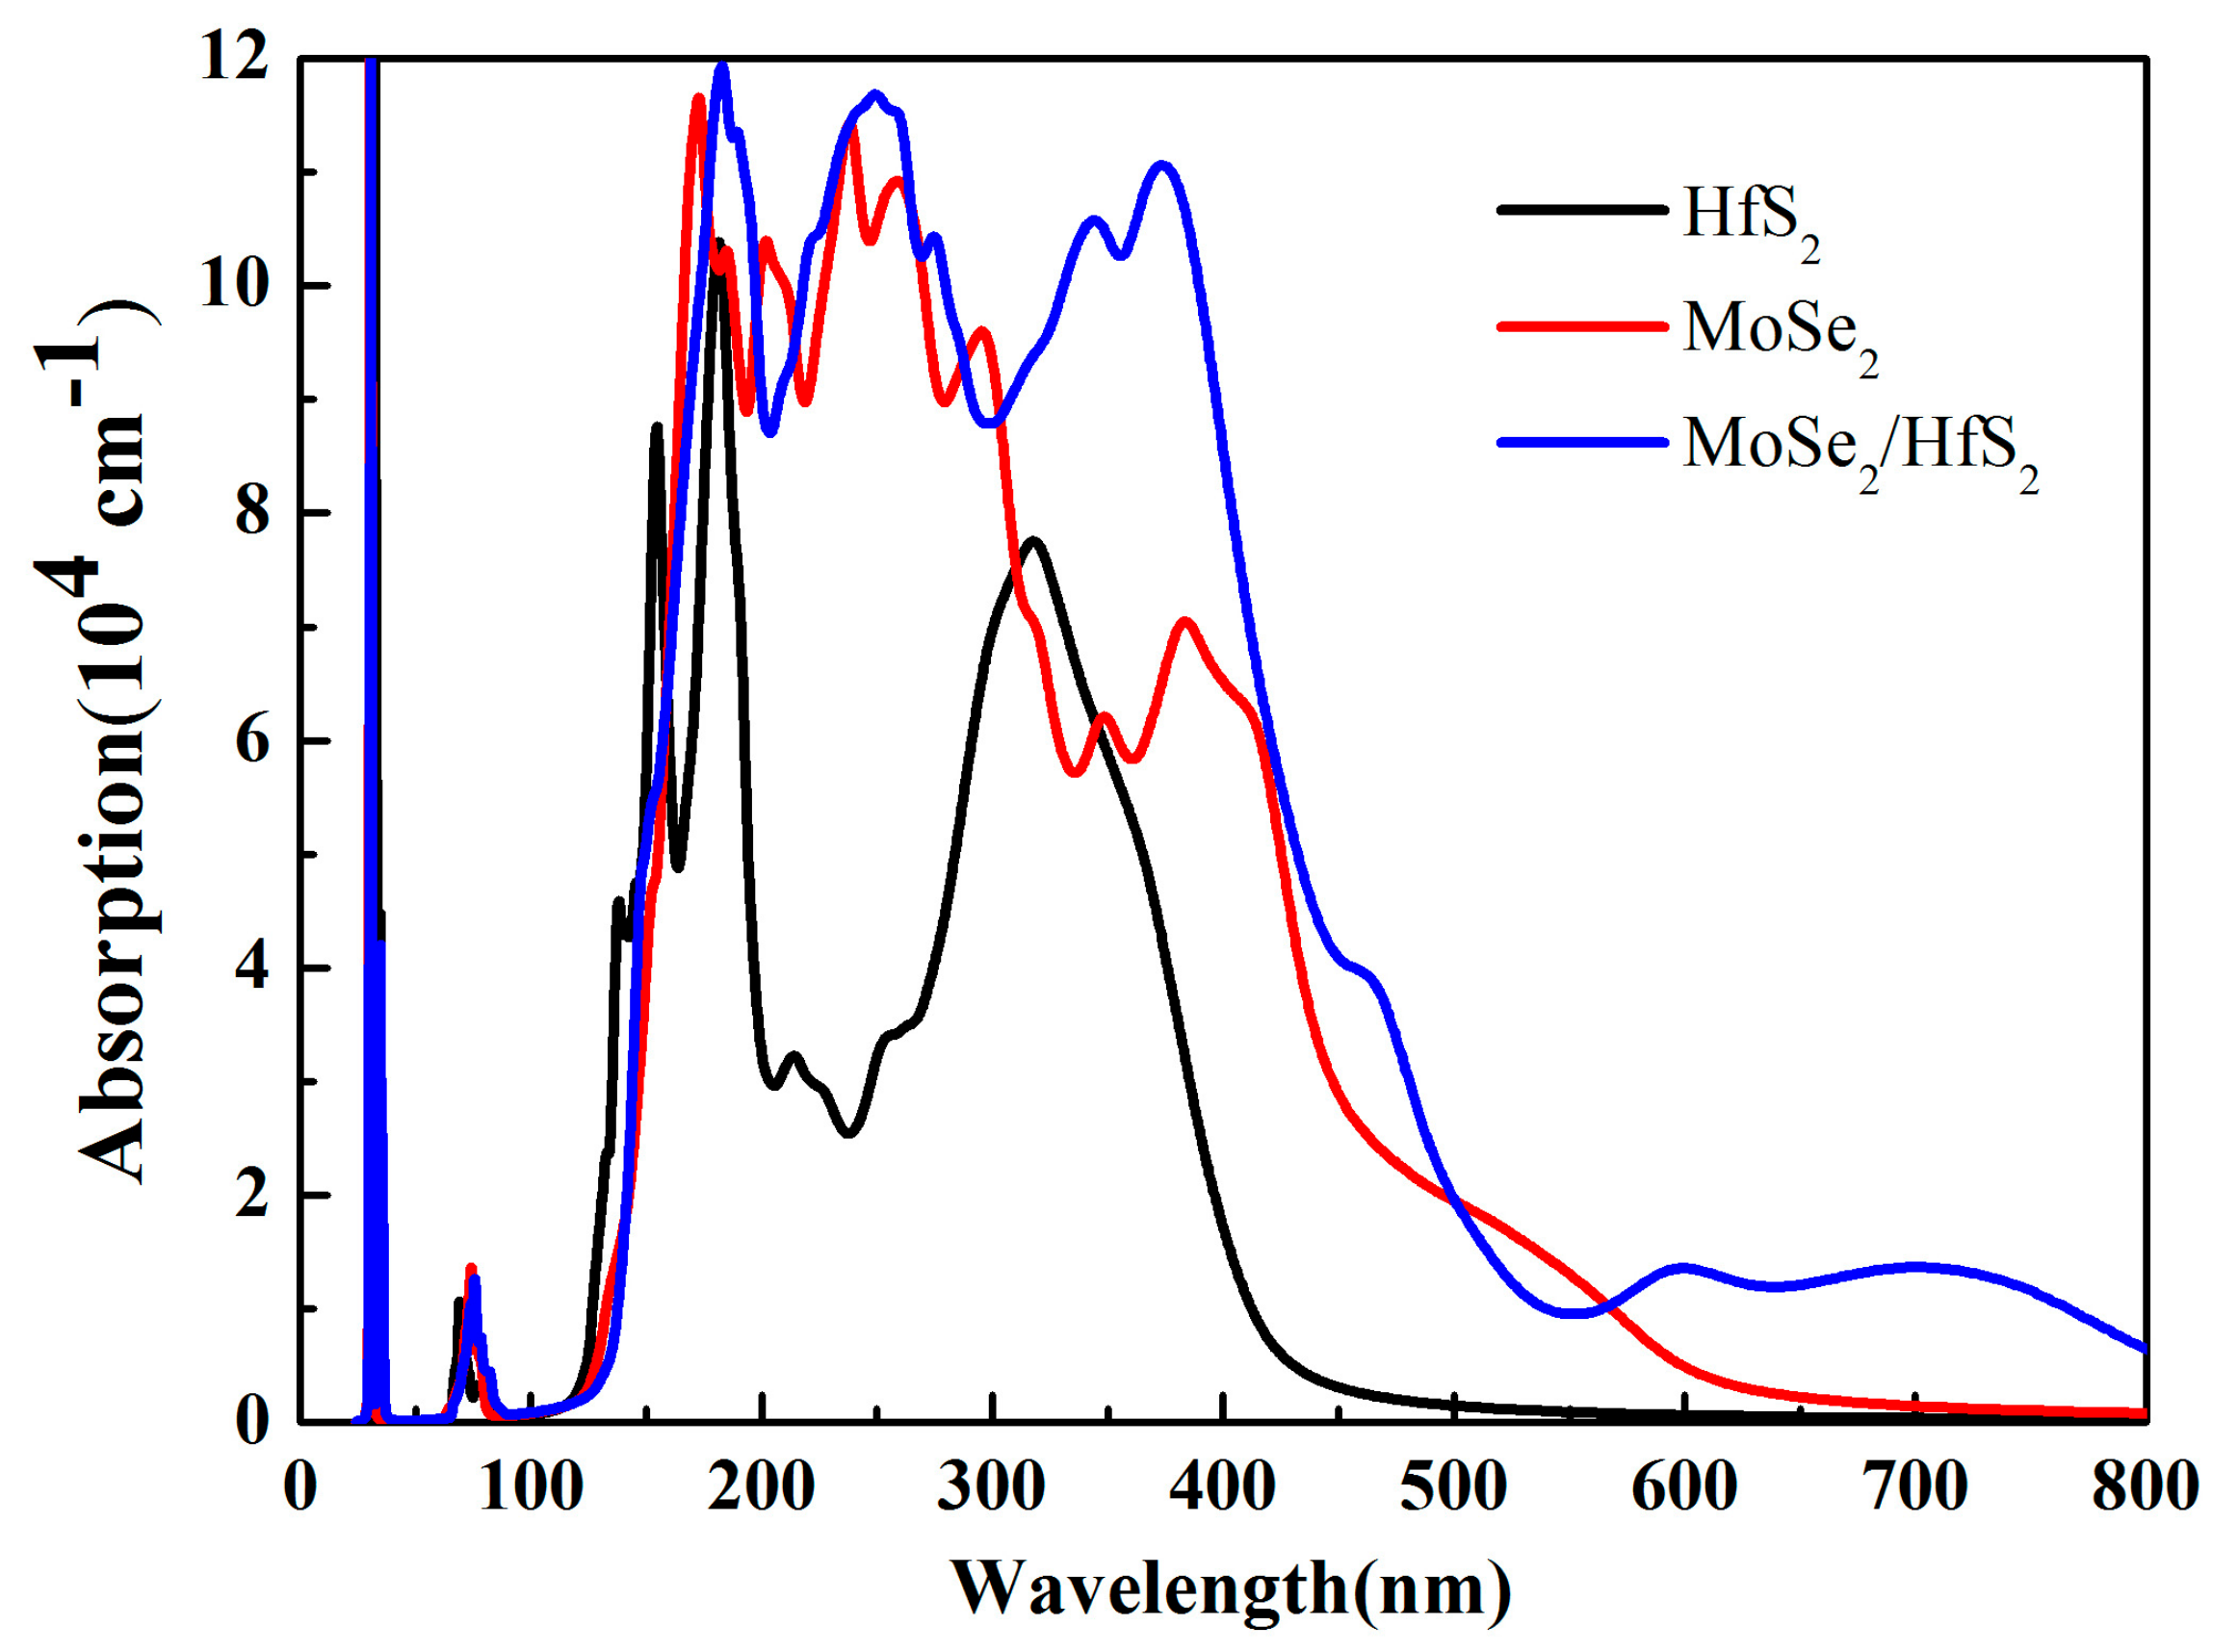
| Structure | Eg (eV) | EVBM (eV) | ECBM (eV) | Bandgap Type |
|---|---|---|---|---|
| MoSe2 | 2.02 | −5.63 | −3.61 | Direct |
| HfS2 | 1.99 | −6.93 | −4.94 | Indirect |
| MoSe2/HfS2 | 0.53 | −5.69 | −5.16 | Direct |
| MoSe2/HfS2 with −6% strain | 0.53 | −5.69 | −5.16 | Direct |
| MoSe2/HfS2 with −3% strain | 0.54 | −5.70 | −5.16 | Direct |
| MoSe2/HfS2 with 3% strain | 0.53 | −5.69 | −5.16 | Direct |
| MoSe2/HfS2 with 6% strain | 0.53 | −5.69 | −5.16 | Direct |
© 2019 by the authors. Licensee MDPI, Basel, Switzerland. This article is an open access article distributed under the terms and conditions of the Creative Commons Attribution (CC BY) license (http://creativecommons.org/licenses/by/4.0/).
Share and Cite
Wang, B.; Wang, X.; Wang, P.; Yang, T.; Yuan, H.; Wang, G.; Chen, H. Bilayer MoSe2/HfS2 Nanocomposite as a Potential Visible-Light-Driven Z-Scheme Photocatalyst. Nanomaterials 2019, 9, 1706. https://doi.org/10.3390/nano9121706
Wang B, Wang X, Wang P, Yang T, Yuan H, Wang G, Chen H. Bilayer MoSe2/HfS2 Nanocomposite as a Potential Visible-Light-Driven Z-Scheme Photocatalyst. Nanomaterials. 2019; 9(12):1706. https://doi.org/10.3390/nano9121706
Chicago/Turabian StyleWang, Biao, Xiaotian Wang, Peng Wang, Tie Yang, Hongkuan Yuan, Guangzhao Wang, and Hong Chen. 2019. "Bilayer MoSe2/HfS2 Nanocomposite as a Potential Visible-Light-Driven Z-Scheme Photocatalyst" Nanomaterials 9, no. 12: 1706. https://doi.org/10.3390/nano9121706
APA StyleWang, B., Wang, X., Wang, P., Yang, T., Yuan, H., Wang, G., & Chen, H. (2019). Bilayer MoSe2/HfS2 Nanocomposite as a Potential Visible-Light-Driven Z-Scheme Photocatalyst. Nanomaterials, 9(12), 1706. https://doi.org/10.3390/nano9121706


