Article

Fabrication of Chitosan/Graphene Oxide/PVA-Vanillin@TiO2 Composites for Anti-Inflammatory Drug Removal from Wastewater


by
Anastasia D. Meretoudi
1,
Athanasia K. Tolkou
1,
Stavros G. Poulopoulos
2,
Rigini M. Papi
3,
Dimitra A. Lambropoulou
4 and
George Z. Kyzas
1,*
1
Hephaestus Laboratory, School of Chemistry, Faculty of Sciences, Democritus University of Thrace, GR-65404 Kavala, Greece
2
Chemical and Materials Engineering Department, School of Engineering and Digital Sciences, Environmental Science & Technology Group (ESTg), Nazarbayev University, Astana 010000, Kazakhstan
3
Laboratory of Biochemistry, School of Chemistry, Aristotle University of Thessaloniki, GR-54124 Thessaloniki, Greece
4
Laboratory of Environmental Pollution Control, School of Chemistry, Aristotle University of Thessaloniki, GR-54124 Thessaloniki, Greece
*
Author to whom correspondence should be addressed.
Nanomaterials 2026, 16(7), 414; https://doi.org/10.3390/nano16070414
Submission received: 28 February 2026 / Revised: 24 March 2026 / Accepted: 27 March 2026 / Published: 29 March 2026
(This article belongs to the Section Environmental Nanoscience and Nanotechnology)

Abstract

In this work, three functionalized hybrid composites, CS/PVA-VAN, CS/PVA-VAN@TiO2 and CS/GO/PVA-VAN@TiO2, were synthesized and applied for adsorption evaluation on two common non-steroidal anti-inflammatory drugs, i.e., diclofenac (DCF) and ketoprofen (KTP). The structural and morphological characteristics of new composites were identified via Fourier-transform infrared spectroscopy (FTIR), scanning electron microscopy (SEM), X-ray diffraction (XRD) and BET techniques. BET analysis demonstrated that the CS/GO/PVA-Van@TiO2 composite has a surface area 64.86 m2/g, which is twice that of CS/PVA-Van. Moreover, adsorption evaluation was achieved at an optimum pH condition (pH 5.0) for both drugs. In addition, the kinetic data fitted better in a pseudo-second-order kinetic model, while the adsorption was heterogeneous and multilayer. The adsorption capacity of CS/GO/PVA-VAN@TiO2 was found to be 114.53 mg/g and 65.20 mg/g for diclofenac and ketoprofen, respectively. Thermodynamic analysis confirmed that the adsorption process was endothermic and spontaneous for all pollutants. Moreover, the kinetic swelling and stability studies demonstrated that graphene oxide contributed to improving the structural compactness and stability of composite. Finally, the adsorption performance of the optimal composite material was investigated in a binary system of non-steroidal anti-inflammatory drugs in various ratios.

1. Introduction

Non-steroidal anti-inflammatory drugs (NSAIDs) are a class of drugs used to treat various diseases such as inflammation in various arthritic and post-surgical conditions [1]. During the COVID-19 pandemic, the consumption of NSAIDs increased as various NSAIDs were used to treat different symptoms such as fever, muscle pain, etc. [2], affecting human health and ecosystem balance [3]. According to the literature, there are various common NSAIDs, such as diclofenac, ibuprofen, naproxen, ketoprofen etc., that are present in surface water and wastewater [4].
Diclofenac or 2-[2-(2,6-dichloroanilino) phenyl] acetic acid (DCF) is used widely due to its analgesic, anti-inflammatory, and antipyretic properties [5]. In spite of the therapeutic effect of DCF, many research groups have studied and documented toxic effects in mammals, such as neurotoxicity, cardiotoxicity, and bone marrow toxicity, due to the high level of DCF in surface water and wastewater [6]. Ketoprofen (KTP) and naproxen (NPX) belong in the propionic acid category [7] and they have similar chemical structures. These pharmaceutical compounds are recommended for the treatment of inflammatory and painful musculoskeletal disorders, such as osteoarthritis and rheumatoid arthritis [8]. However, a high level of KTP can cause toxicological effects in aquatic organisms [9].
In the literature, there are various different methods used to remove pharmaceutical compounds from wastewater; for example, adsorption, coagulation, flocculation and electrochemical methods [10]. However, a critical point for selecting the appropriate method is the combination of efficiency and cost-effective technique, such as adsorption [11].
One of the most common natural adsorbent materials is chitosan (CS). Chitosan is a natural polysaccharide (β1→4) with linked residues of N-acetyl-2 amino-2-deoxy-D-glucose (glucosamine) and 2-amino-2-deoxy-D-glucose (N-acetyl-glucosamine), used in biomedicine and environmental and agricultural applications as it is a biodegradable, non-toxic and low-cost material [12]. Due to the main functional groups –NH2 and –OH, chitosan is efficient in adsorption because it can increase intermolecular interaction with the pollutant. To improve the adsorption capacity and enhance the chemical stability, chitosan is modified with various modification techniques, such as grafting, crosslinking, etc. [13]. In the recent literature, vanillin, which is a green crosslinker, has been widely used due to its characteristics, i.e., its biocompatibility, non-toxicity, low cost, and antimicrobial and antioxidant properties [14].
Moreover, vanillin is a phenolic aldehyde and therefore a Schiff base is formed between the aldehyde group of vanillin and the amino group of chitosan. This modification increase the π-π interactions between the adsorbent material and the pharmaceutical compounds due to the aromatic system [15]. Therefore, vanillin offers an extra animo group that it is important for electrostatic interaction with the polymeric chain or with the pollutants. Furthermore, the addition of TiO2 nanomaterials, which are present in the polymeric matrix, enhances the adsorption efficiency of the pharmaceutical compounds. The TiO2 nanoparticles are incorporated primarily to enhance the porosity and structural integrity of the composite material, thereby increasing the available surface area for adsorption [16]. In this study, their photocatalytic activity is not exploited, as the current focus was to investigate their role as an adsorptive medium. To increase the chemical stability of the polymeric complex, PVA (polyvinyl alcohol) and graphene oxide (GO) were also used. According to Zataline et al. 2023, if chitosan is combined with PVA the adsorption properties and mechanical strength are increased. On the other hand, GO is an adsorbent material that widely used to remove emerging contaminants from wastewater [17] due to its properties such as its extended surface area and various functional groups (carboxyl, epoxy, hydroxyl groups) that interact with the pollutants.
Previous studies have demonstrated the potential of chitosan-based bio-nanocomposites for wastewater treatment. For instance, El-Aziz et al. 2023 synthesized superabsorbent bio-nanocomposites based on grafted chitosan loaded with GO/TiO2, reporting removal efficiencies of 79.5% and 78.8% for Pd2+ and BR46, respectively [18]. Similarly, Aricov and Ludmila 2025 indicated that vanillin-modified chitosan effectively removed the aromatic compound Bisphenol A (BPA) from an aqueous solution [19]. The new composite CS/GO/PVA-VAN@TiO2 exhibits a unique combination of polymeric and nanomaterial components, resulting in an expanded active surface area and an exceptionally high adsorption performance. Furthermore, its demonstrated reusability over multiple cycles highlights its functional stability and sustainability, making the material both economical and environmentally efficient. In contrast to previous systems, which exhibit limited adsorption capacity and lack evaluations of their reusability, CS/GO/PVA-VAN@TiO2 clearly overcomes these limitations. This characteristic positions the material as a pioneering, effective and sustainable solution for the removal of emerging contaminants from aquatic systems.

2. Materials and Methods

2.1. Materials

Chitosan (CS) of high molecular weight with a degree of deacetylation (DDA) higher than 75% and vanillin (VAN) were supplied from Sigma-Aldrich-Merck KGaA, Darmstadt, Germany. Polyvinyl alcohol (PVA) was obtained from Thermo Scientific (Waltham, MA, USA), and titanium dioxide was purchased from Nanografi Nano Technology (Ankara, Turkey). Acetic acid (≥99%) was obtained from Fisher Chemicals (Hampton, NH, USA); acetone (>99%) and glutaraldehyde (GLA) 50% in H2O were obtained from Sigma-Aldrich-Merck KGaA, Darmstadt, Germany. Diclofenac sodium was supplied by Tokyo Chemical Industry (Tokyo, Japan), while ketoprofen 2-(3-Benzoylphenyl) propanoic acid was purchased from BLD pharm (Shanghai, China).

2.2. Synthesis

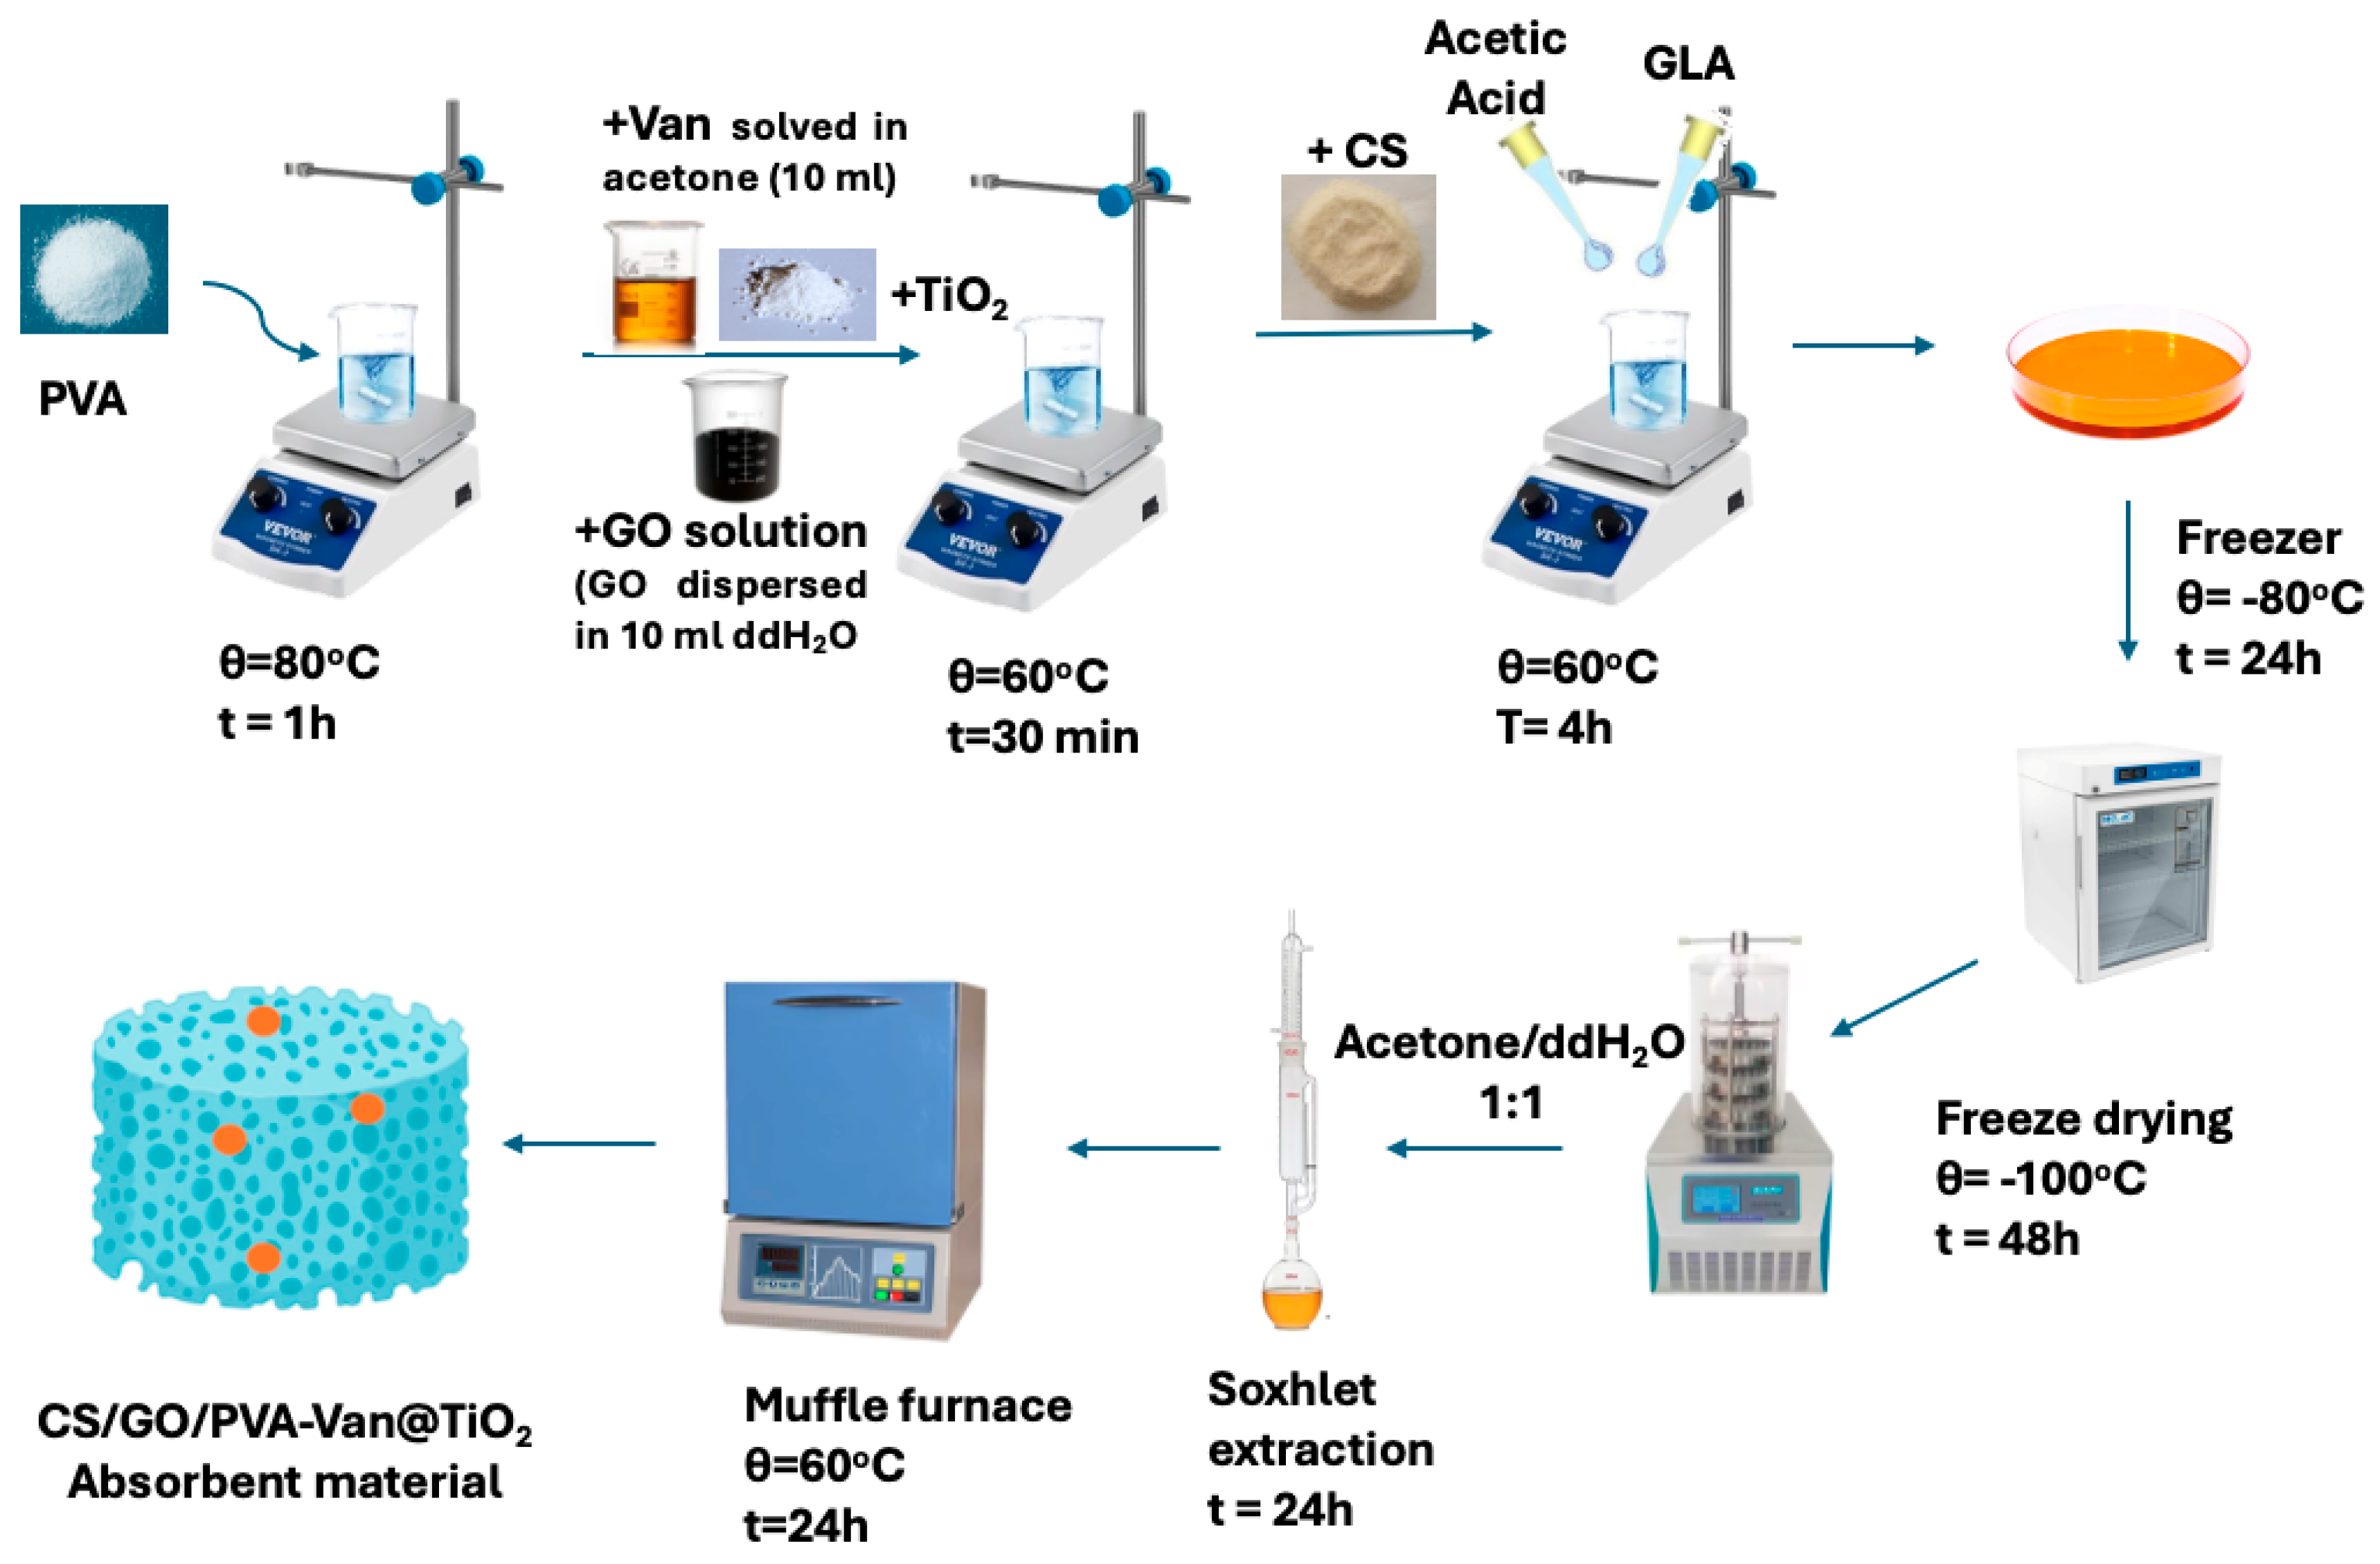
The CS/PVA-VAN composite was synthesized and subsequently evaluated for its efficacy in removing diclofenac (DCF) and ketoprofen (KTP) from aqueous media. Initially, 0.5 g of polyvinyl alcohol (PVA) was dissolved in 98 mL of double-distilled water under continuous magnetic stirring at 80 °C for 1 h. Upon complete dissolution, the solution was allowed to cool to 60 °C. Separately, 0.2 g of vanillin (VAN) was dissolved in 10 mL of acetone, and this solution was added dropwise to the PVA solution under vigorous stirring to ensure homogeneity. Subsequently, 1 g of chitosan (CS) was incorporated into the mixture (Table 1). To facilitate crosslinking, 2 mL of acetic acid was introduced, followed by the addition of 1 mL of glutaraldehyde (GLA). VAN acts as the primary crosslinking agent in this system, reacting with the free amino groups of the polymer to form Schiff bases, thereby establishing the main crosslinked network that underpins the material’s structural cohesion. On the other hand, GLA was incorporated in only small amounts and serves a complementary role, primarily enhancing the initial stabilization of the network and reinforcing mechanical integrity. The reaction mixture was maintained under stirring at 60 °C for 4 h. The samples were then placed in the freezer for 24 h. The resulting composite was subjected to lyophilization for 48 h and further purified using a Soxhlet extractor with a 1:1 (v/v) acetone/water solvent system to eliminate the residual crosslinker, i.e., glutaraldehyde. The samples were dried at 60 °C for 24 h, resulting in the final composite for adsorption evaluation.
Regarding the synthesis of the CS/PVA-VAN@TiO2 composite, 0.2 g of titanium dioxide (TiO2) was added to the PVA solution prepared for the previous synthesis (of CS/PVA-VAN) and stirred for 30 min to ensure uniform dispersion. Following this step, chitosan (CS) was added to the mixture, and the synthesis proceeded as described.
Concerning the synthesis of the CS/GO/PVA-VAN@TiO2 composite (Figure 1), GO was prepared in the laboratory according to the procedure reported by [20]. For this purpose, 0.01 g of GO was dispersed in 10 mL of double-distilled water and sonicated for 1 h at 30 °C. The resulting GO dispersion was then added to the PVA solution prepared for the previous synthesis (of CS/PVA-VAN@TiO2) and stirred for 1 h to ensure proper integration prior to the addition of CS.

2.3. Characterization Techniques

To provide a structural and physicochemical characterization of the prepared composites, various advanced techniques were used. Fourier-transform infrared (FTIR) spectroscopy was performed with a (ATR-FTIR, ZnSe) spectrometer (Perkin Elmer, New York, NY, USA) to identify the functional groups and chemical bonds. Crystallographic analysis was carried out using X-ray diffraction (XRD) with a BRUKER D8 FOCUS diffractometer (Karlsruhe, Germany). The surface morphology was examined via a JEOL JSM6390LV scanning electron microscope (SEM) (Tokyo, Japan). The specific surface area, pore size, and volume of the aerogels were determined by N2 adsorption with a NOVA 4200a (Quantachrome, Boynton Beach, FL, USA).

2.4. Adsorption Experiments

To determine the optimum conditions for adsorption, different experiments were carried out. Firstly, the effect of pH was studied in the range of 3.0–9.0 over a 24 h period at 303 K. The scope of this step was to determine the optimal pH value that would be kept constant for the next series of experiments. According to the literature [21,22], the initial concentration of pharmaceutical compounds, DCF and KTP, was 50 mg/L. For all adsorption experiments, the adsorbent mass applied was 1 g/L, which was chosen from the effect of adsorbent mass, which determined the lowest adsorption mass that can achieve the highest removal efficiency of NSAIDs. Furthermore, to determine the equilibrium time, the concentrations of the NSAIDs were measured at 5, 10, 15, 20, 30, 60, 90, 120, 180, 360 and 1440 min at 303 Κ. The contact-time study allowed us to understand the kind of sorption (physisorption or chemisorption) occurring between the adsorbent material and the pollutant. Moreover, isotherm studies were carried out at various initial concentrations of DCF (10–90 mg/L) and KTP (10–50 mg/L). Finally, thermodynamic analysis was performed at 303 K, 313 K and 323 K to determine if the adsorption was an endothermic or an endothermic phenomenon.

2.5. Statistical Analysis

Experiments were performed independently in triplicate for each condition. The presented values represent the mean of the three replicates. Additionally, variability among the measurements is indicated by error bars, as calculated by Equation (1) [23]:
S E = S D   N
where SE is standard error, SD is standard deviation and N is the number of replicates.
The results are presented graphically to convey both the central tendency of the data and the precision of the mean estimate for each condition.

2.6. Adsorption Evaluation

Evaluation of the effectiveness of the adsorbent materials was achieved with the determination of removal efficiency and adsorption capacity under various experimental conditions. The removal efficiency percentage was determined according to Equation (2):
R % = ( C 0 C e ) C 0 100 %
where R is the removal percentage (%) and C0 and Ce are the initial and equilibrium concentration of DCF and KTP (mg/L).
Moreover, Equation (3) describes the adsorption capacity:
Q t = C 0 C e V m
where Qt is the adsorption capacity (mg/g), C0 and Ce are the initial and equilibrium concentration (mg/L), m (g) is the amount of adsorbent material, and V (L) is the volume of solution used in the experiment.

2.6.1. Isotherm Studies

In the literature there are various equilibrium models which describe the interaction between absorbent materials and pollutants. The most common isotherm models are those of Langmuir [24] and Freundlich [25]. The Langmuir model illustrated a homogenous adsorption process where all of the adsorption sites are equivalent and each active site can interact with a pollutant molecule [26]. On the other hand, a heterogenous adsorption is described in the Freundlich model, which explains that adsorption is multilayer and all active sites require different energies for adsorption [27]. The Langmuir and Freundlich isotherm models are expressed in Equation (4) and Equation (5), respectively.
Q e = Q m K L C e 1 + K L C e
where Ce is the equilibrium concentration of the pollutants (mg/L), Qm is the maximum sorption capacity (mg/g), and KL = Langmuir constant, in L/mg.
Q e = K f C e 1 / n
where n = heterogeneity factor, and KF = Freundlich constant related to the adsorption capacity, in (mg/g)∙(L/mg)1/n.
In addition, as will emerge from the following experimental results, it is also necessary to apply the Langmuir–Freundlich (L-F) equation model (known as the Sips isotherm model [28]) to the data of this study as well. The Sips isotherm, a combination between the Langmuir and Freundlich models, is a model that studies three parameters to adjust the experimental results, and the relevant equation used is the following Equation (6):
Q e = Q m K L F C e 1 / n 1 + K L F C e 1 / n
where KLF = equilibrium constant of heterogeneous surfaces (L/g), Qe = adsorbed amount at equilibrium (mg/g), Qm = maximum adsorption capacity (mg/g), Ce = adsorbate equilibrium concentration (mg/L) and n = heterogeneity parameter (0 < n < 1). Equation (5) is used for both high and low solution concentrations. In particular, at low concentrations, this isotherm follows the Freundlich isotherm and at high concentrations it follows the Langmuir isotherm, predicting monolayer adsorption capacity [29].

2.6.2. Kinetic Studies

Pseudo-first-order (PFO) [30], pseudo-second-order (PSO) [31], and intraparticle diffusion (IPD) [32] models were chosen to fit the kinetic data, as they are the most commonly applied models. The PFO model refers to physisorption due to weak intermolecular interaction, such as Van der Waals interaction, electrostatic interaction, etc., which increases between the adsorbent and the pollutant [33]. The PSO model describes chemisorption, in particular the formation of new chemical bonds between the adsorbent and NSAIDs [34]. Equations (7) and (8) express the PFO and PSO model, respectively, and intraparticle diffusion (IPD) is also described (Equation (9)). The adsorption process is best explained by the model with the highest correlation coefficient (R2):
Q t = Q e ( 1 e K 1 t )
Q t = Q e 2 K 2 t ( 1 + Q e K 2 t )
where Qe and Qt (mg/g) are the adsorption capacities at equilibrium and at time t, respectively, and K1 (1/min) and K2 (g/mg·min) are the first- and second-order rate constants.
Q t = K I P D t 0.5 + C
KIPD is the rate constant (mg/g min0.5), while the constant C (mg/g) reflects the thickness of the boundary layer.

2.6.3. Thermodynamic Study

To understand the nature of the adsorption mechanism, it is necessary to determine the thermodynamic parameters (to determine if adsorption is spontaneous or not). The change in Gibbs’s free energy is shown by Equations (10) and (11) [35]:
Δ G 0 = R T l n ( K c )
Δ G 0 = Δ H 0 T Δ S 0
where R is the gas constant (8.314 J/mol·K), T represents the temperature (K), and Kc is the thermodynamic constant.
Moreover, the thermodynamic parameters related to adsorption include enthalpy change (ΔH0) and entropy change (ΔS0) and are described by Equations (12) and (13) [36].
Κ C = Q e C e
l n Κ c = Δ H 0 R T + Δ S 0 R

2.7. Effect of Mass

The adsorption experiment for the effect of the adsorbent’s mass was carried out under the following conditions to determine the influence of the initial adsorbent quantity on equilibrium. Specifically, the range of adsorbent mass was 0.2–1.5 g/L at optimum pH value, for 180 min at 303 K. The process was repeated 2 more times, such as in all batch experiments.

2.8. Regeneration

In recent decades, the critical point between the academic world and industry is the reuse of absorbent material for environmental and economic benefit [37]. The reusability of all new composites was tested in batch experiments using a desorbing agent. According to the literature, during desorption, each of the adsorbent materials was processed with a 0.01 M NaOH solution (pH 12) and then washed repeatedly until a neutral pH was obtained [38]. In this way, the pharmaceutical compound can be removed from the polymeric matrix of the adsorbent material and can then be reused in the next regeneration cycle.

2.9. Swelling

The swelling ratio was measured using distilled water at an optimum pH value of 5.0 for the DCF and KTP solutions. Briefly, CS/PVA-VAN, CS/PVA-VAN@TiO2 and CS/GO/PVA-VAN@TiO2 were weighed (W1) (g) and placed in solution. An 0.05 g amount of adsorbent was added to 50 mL of each solution. Then, measurements were taken at specific time intervals (5, 10, 15, 30, 45, 60, 90 and 120 min) until a stable weight was achieved. Using filter paper, the materials were blotted to remove excess surface water and then weighed (W2) (g) until a constant weight was achieved. The swelling percentage for each composite was calculated at equilibrium using the following Equation (14) [39].
S w e l l i n g   ( % ) = W 2 W 1 W 1
where W1 is the initial and W2 the final amount of adsorbent dosage, respectively.

2.10. Stability Study

Adsorbent stability was evaluated in double-distilled water at various pH values (3.0, 5.0, 7.0, 9.0 and 11), which were adjusted using HCl and NaOH, respectively. In this experiment, 0.05 g (W1) of each adsorbent material was added to 50 mL of each solution for 24 h. Thereafter, the adsorbents were removed from solution and were placed in an oven at 60 °C until they completely dried (W2) (g). Finally, the composites were weighted and the mass loss was calculated using Equation (15) [40].
M a s s   l o s s   % = W 2 W 1 100 %

3. Results and Discussion

3.1. Characterization

3.1.1. FTIR

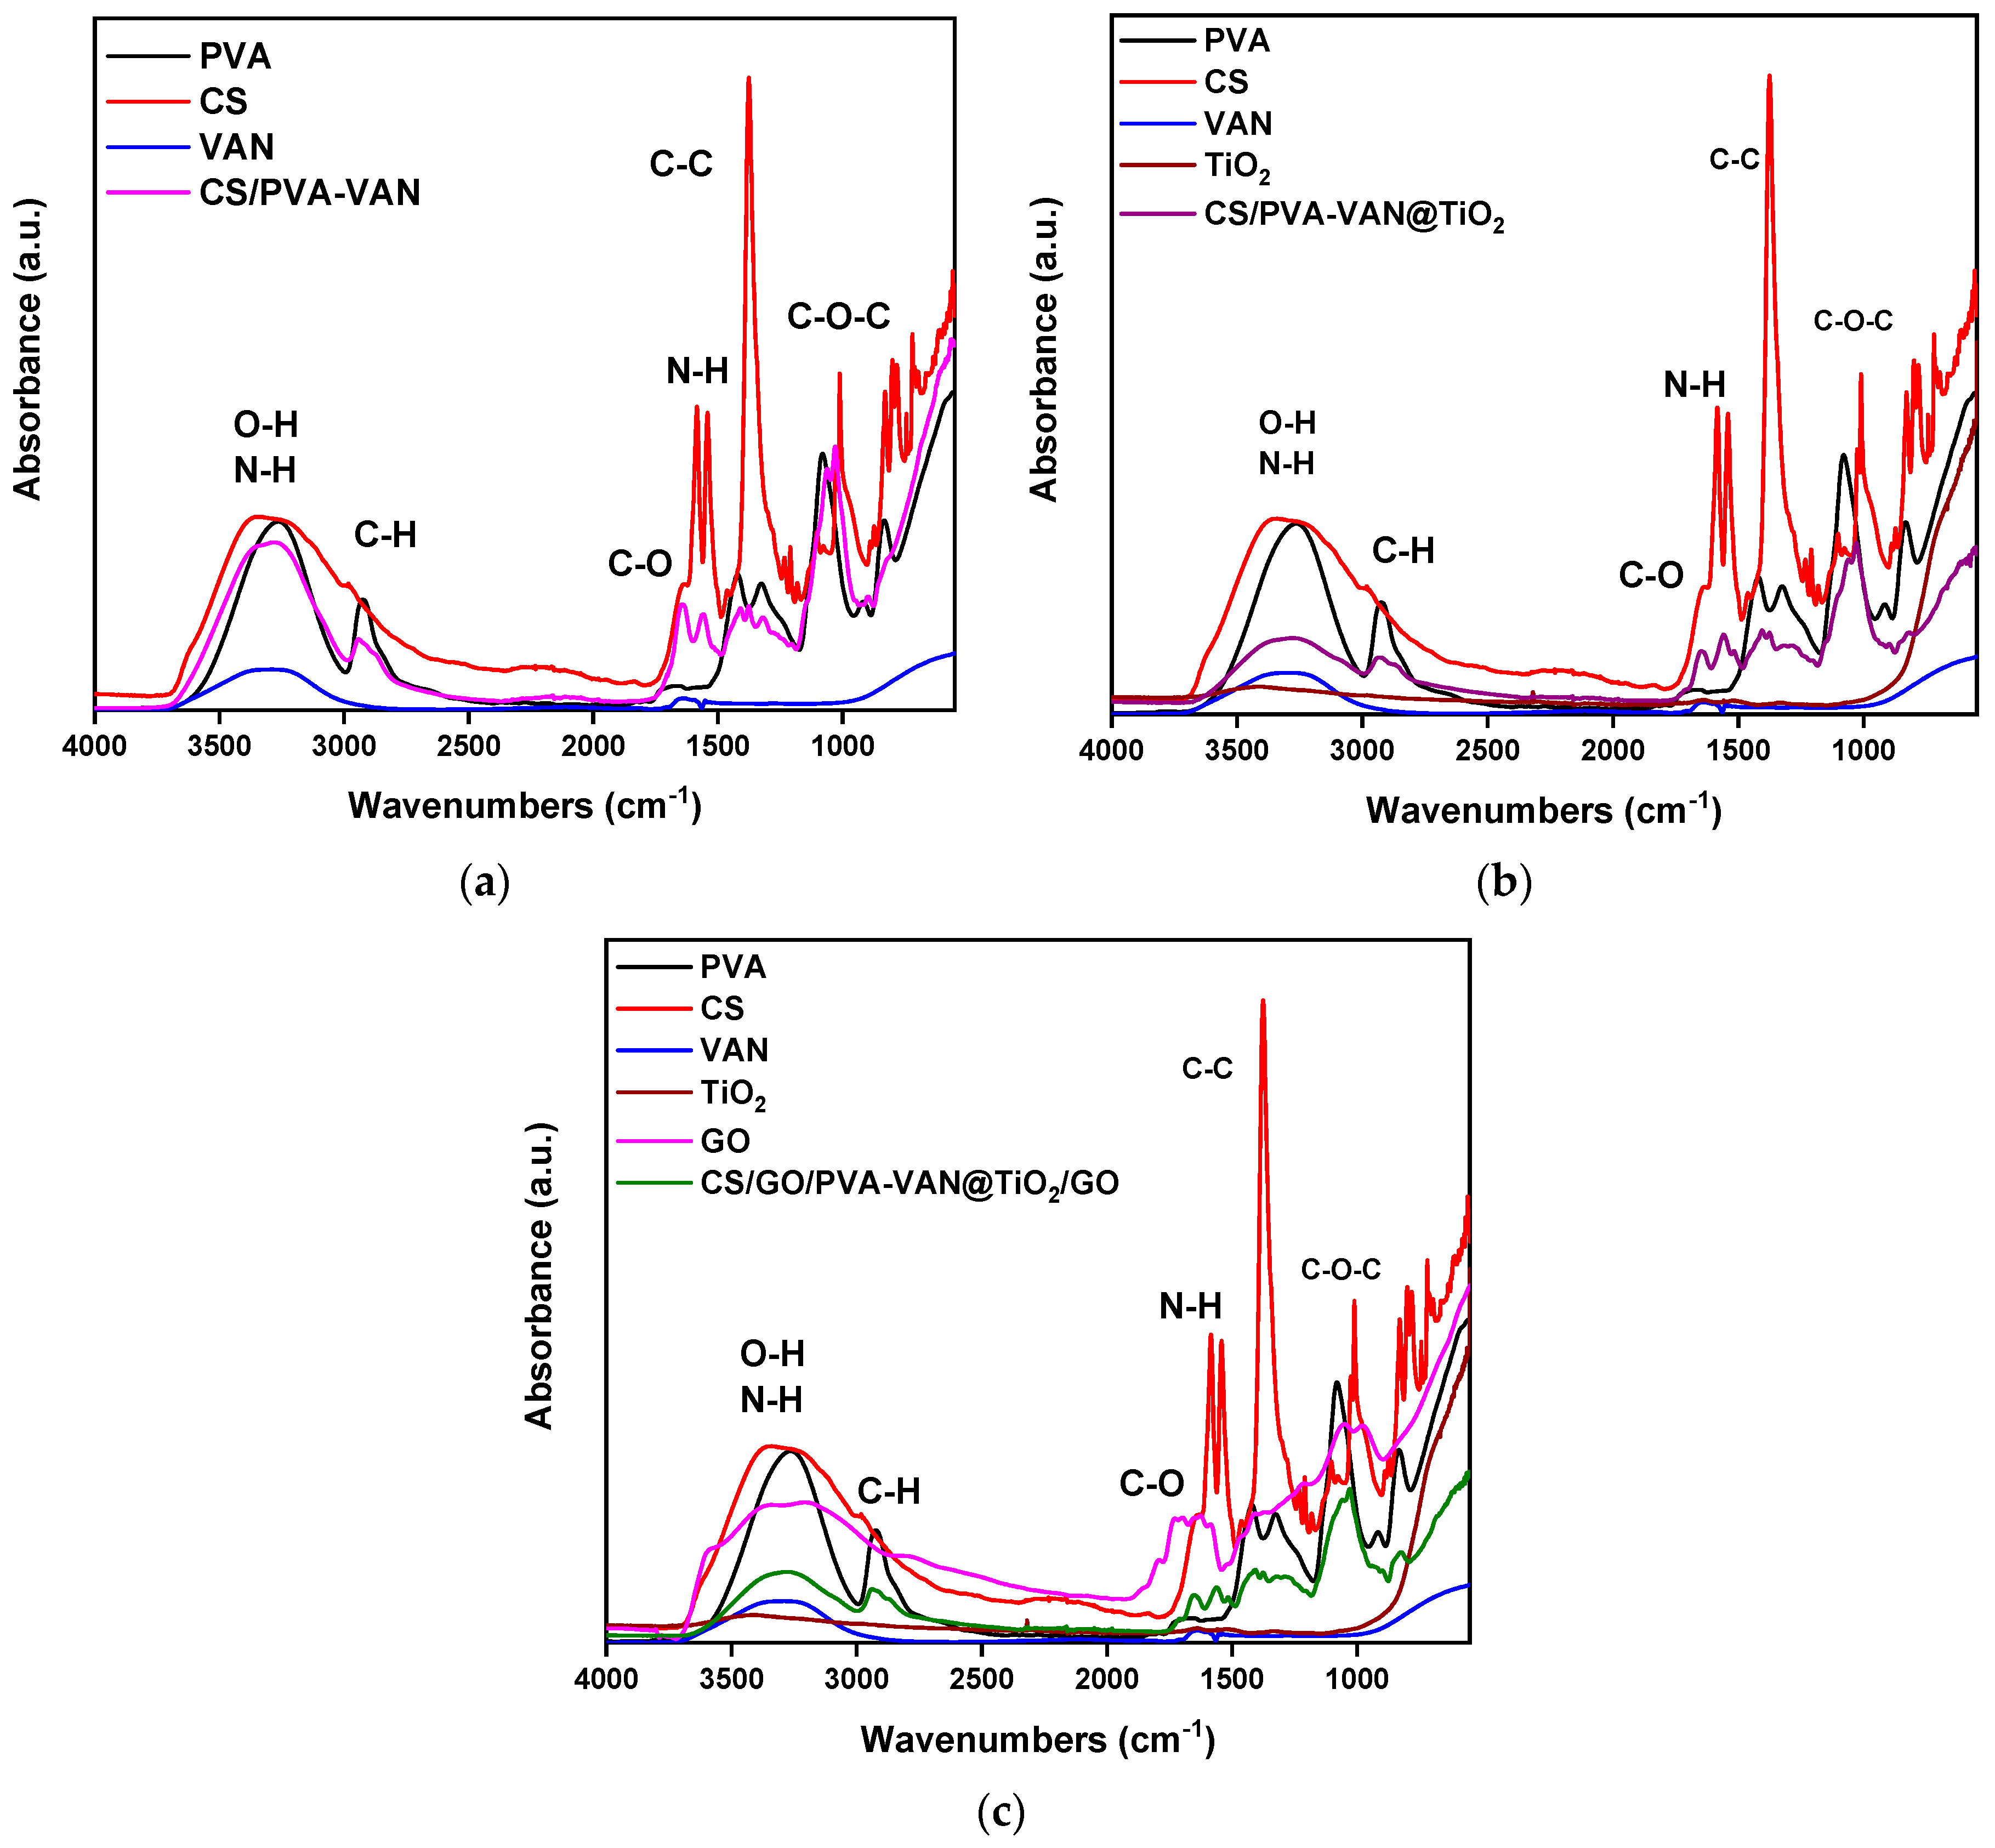
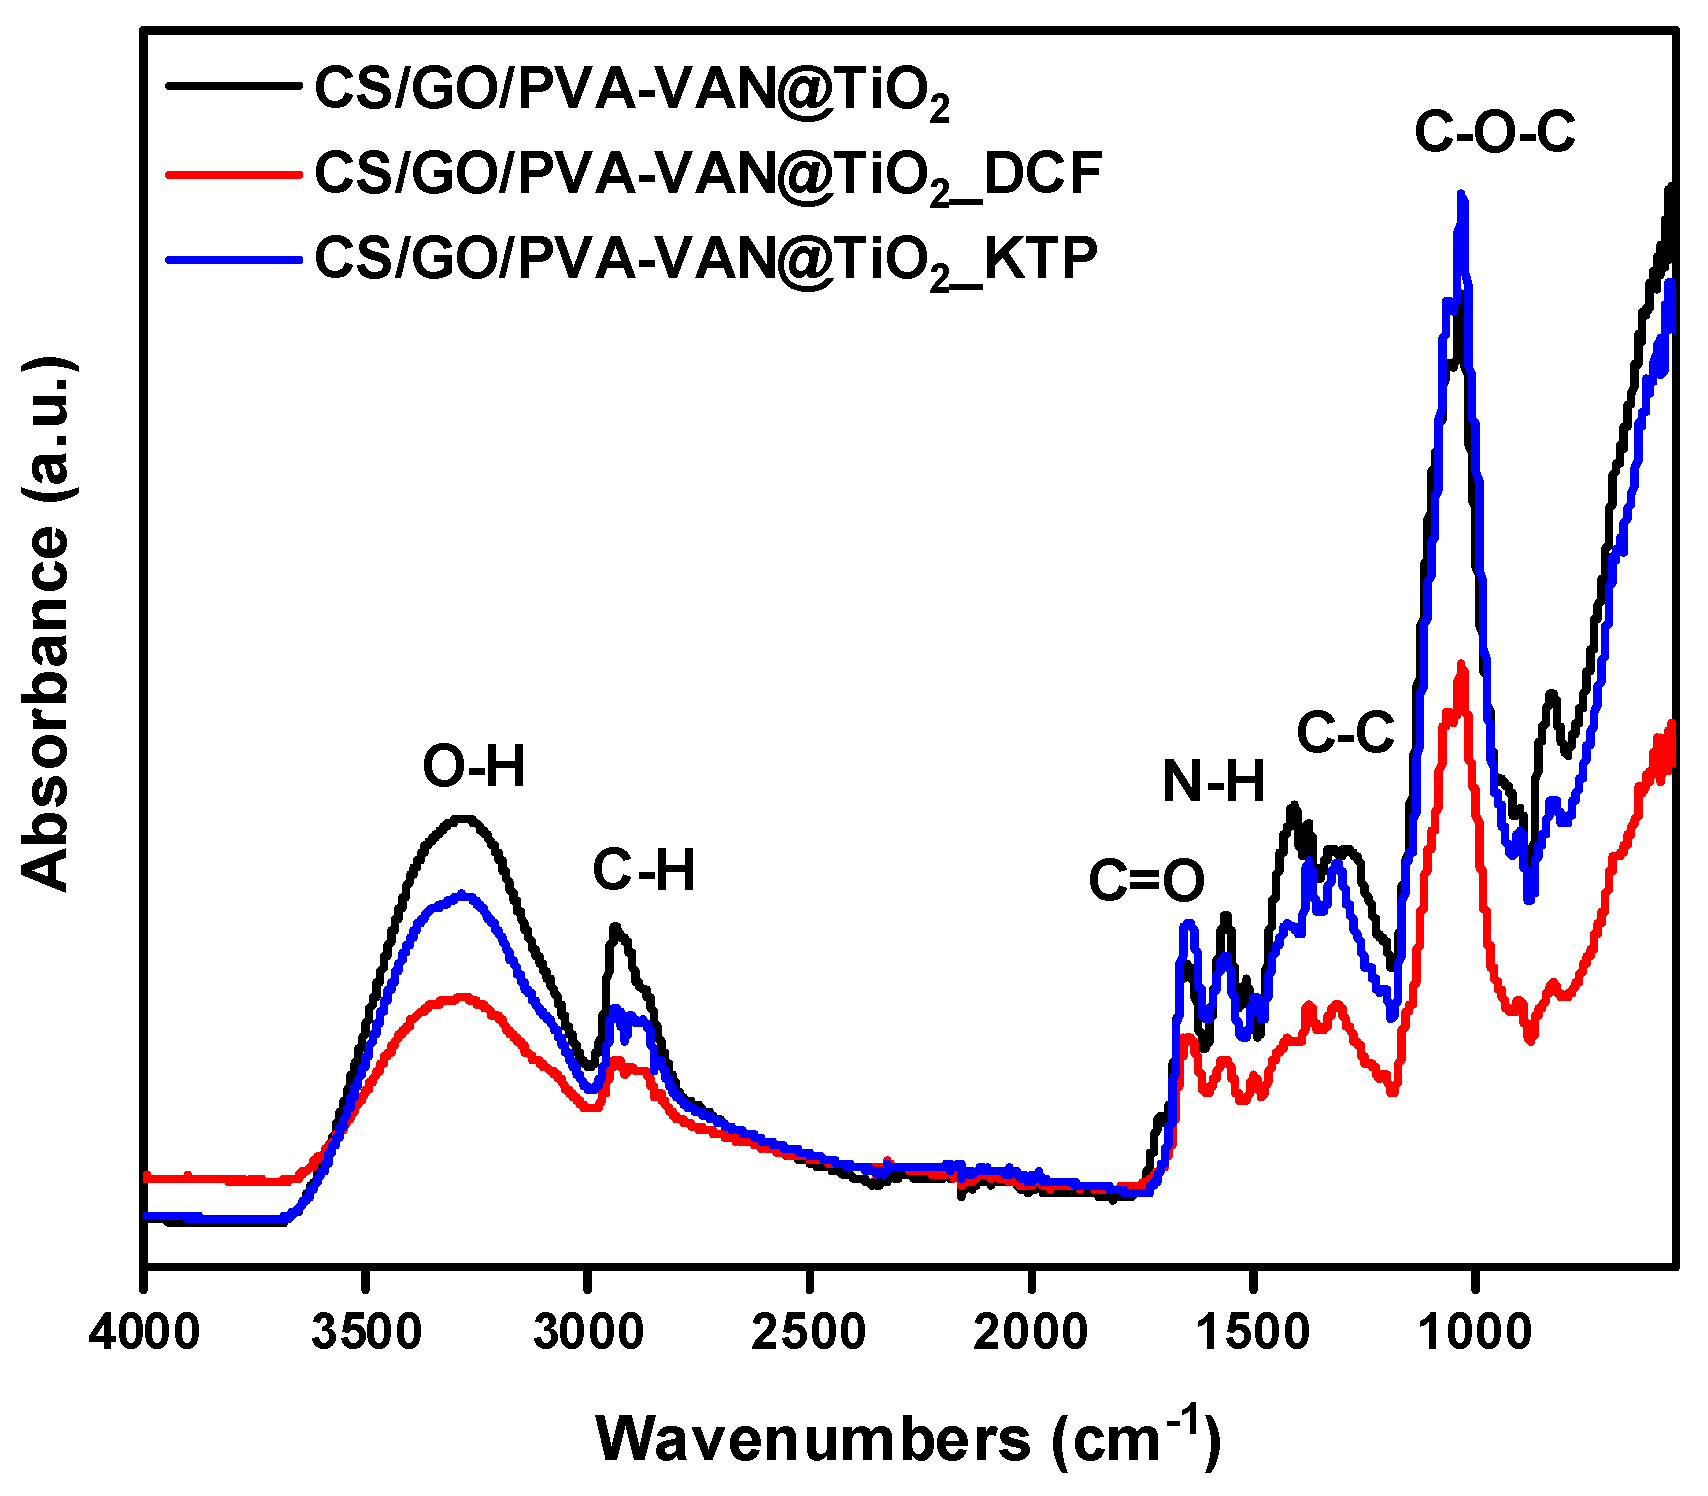
Figure 2 presents the FTIR spectrum of CS/PVA-VAN, CS/PVA-VAN@TiO2, and CS/GO/PVA-VAN@TiO2. Firstly, the characteristic peaks of O–H and N–H are depicted at 3000–3500 cm−1 [41], while the vibration band of C–H is shown at 2941 cm−1 [42]. The stretching bands of C–C and C–O–C appeared at 1398 cm−1 [43] and 1020 cm−1 [44], respectively. In three new composite adsorbent materials, the vibrations of the N-H bond are shown at different peaks, depending on the material [45]. Specifically, the band N–H appeared at 1553 cm−1, 1562 cm−1 and 1563 cm−1 for CS/PVA-VAN, CS/PVA-VAN@TiO2 and CS/GO/PVA-VAN@TiO2, respectively. This peak displacement is due to intermolecular interactions which take place between the polymeric matrix and newly added chemical compounds, such as TiO2 and GO [46].
The FTIR spectra of the composite adsorbent materials shows significant shifts in almost all of the characteristic functional group peaks (Figure 2). More specifically, the C–H bond vibration appears at 2941, 2930, and 2935 cm−1 for the materials CS/PVA-VAN (Figure 2a), CS/PVA-VAN@TiO2 (Figure 2b), and CS/GO/PVA-VAN@TiO2 (Figure 2c), respectively, while for neat chitosan (CS), it appeared at the lower wavenumber of 2981 cm−1. This decrease in vibration is attributed to changes in the polarity of the environment [47]. In the CS spectra, the amide bond vibration appeared at 1587 cm−1, while in the CS/PVA-VAN composite it appeared at 1553 cm−1. This shift is attributed to the formation of a Schiff base between the amino group of CS and the aldehyde group of vanillin [48]. In the spectra of CSPVA-VAN@TiO2 and CS/GO/PVA-VAN@TiO2, broad absorption peaks showed in the regions of 1554–1564 and 1569–1579 cm−1, respectively, which are assigned to intermolecular interactions such as hydrogen bonding [49] and electrostatic interactions [50], due to the addition of TiO2 and GO into the polymeric matrix. Furthermore, the C=O bond in chitosan presented at 1658 cm−1, whereas in the composite materials, CS/PVA-Van, CS/PVA-VAN@TiO2 and CS/PVA-VAN@TiO2, it appeared at 1644, 1645, and 1643 cm−1, respectively. The decrease in vibration confirmed the formation of hydrogen bonds in the composites [51]. Overall, FTIR analysis verified the successful incorporation of the additives into the polymer matrix through Schiff base formation, hydrogen bonding, and electrostatic interactions.
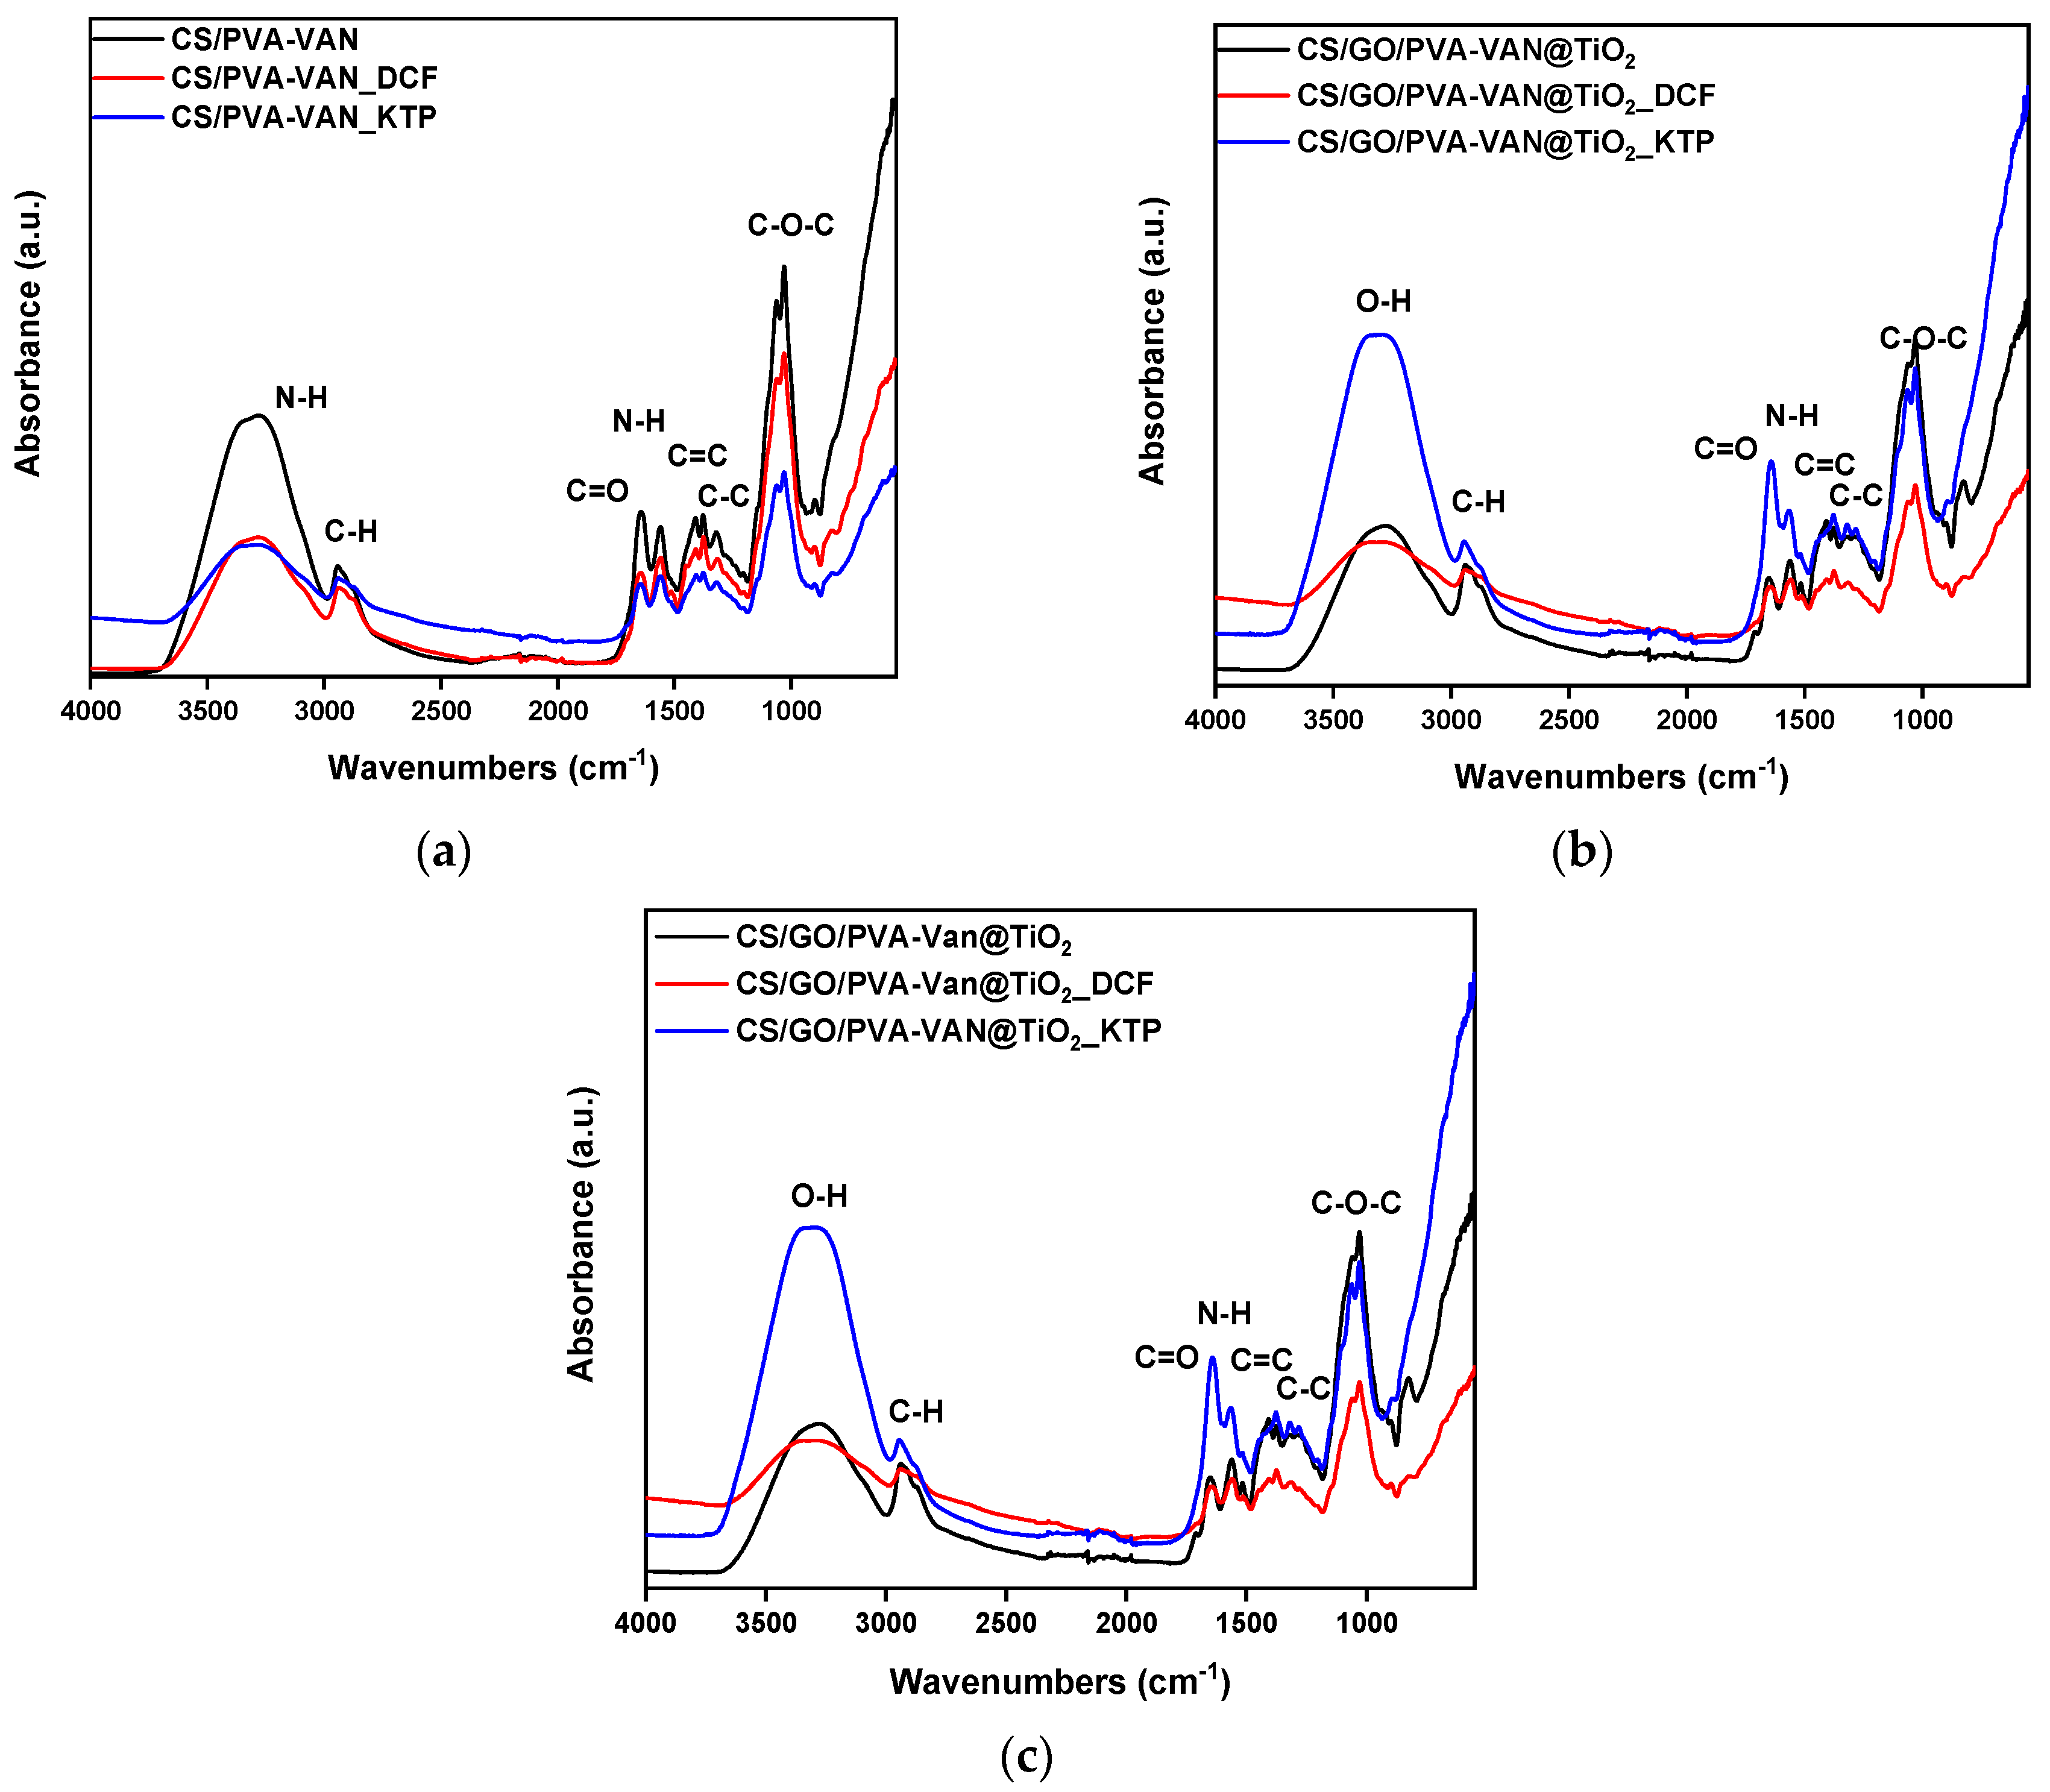
Comparative analysis of the FTIR spectra obtained before and after the adsorption process was performed to identify spectral shifts or alterations indicating specific functional groups in the adsorption mechanism. Moreover, Figure 3 presents the FTIR spectra after the adsorption of the pharmaceutical compounds. As illustrated, in the CS/PVA-VAN spectra (Figure 3a), the vibration of C–C bonds appeared at 1383 cm−1 before adsorption, while after the adsorption of DCF and KTP it shifted to 1373 cm−1. This shift indicated the presence of π–π stacking interactions between the adsorbent and the pollutants [52]. Furthermore, in the CS/PVA-VAN@TiO2 spectra (Figure 3b), a shift is observed from 1650 to 1643 and 1646 cm−1 after the adsorption of DCF and KTP, respectively. This shift further supported the occurrence of interactions between the functional groups of the adsorbent and the pharmaceutical molecules.
After the adsorption of DCF and KTP onto the CS/GO/PVA-VAN@TiO2 composite (Figure 3c), distinct shifts were observed in the characteristic FTIR bands. The C=O stretching vibration, initially at 1648 cm−1, shifted to 1638 cm−1 for DCF and KTP. Simultaneously, the N-H stretching vibration decreased from 1403 cm−1 to 1372 cm−1. These observed shifts indicate the involvement of intermolecular interactions in the adsorption mechanism, such as hydrogen bonding, but the dominant contribution is π-π stacking interactions between the aromatic groups of the drugs and π-electron network of GO. Furthermore, hydrogen bonding also appears to play a role in stabilizing the adsorption process, particularly through interaction between the -OH and -NH2 groups of the matrix and polar functional groups of the drugs. Additionally, small shifts are observed in the C=C bond peaks, while no new peaks appear in the 1500–1600 cm−1 region. These shifts indirectly support the presence of π-π interactions between the substrate and the aromatic ring of the NSAIDs, without generating new distinct vibrations. This dominant adsorption mechanism, also reported for other CS–biochar composites, involves both non-covalent, Van der Waals interaction between the CS chain and biochar surface [53].

3.1.2. XRD

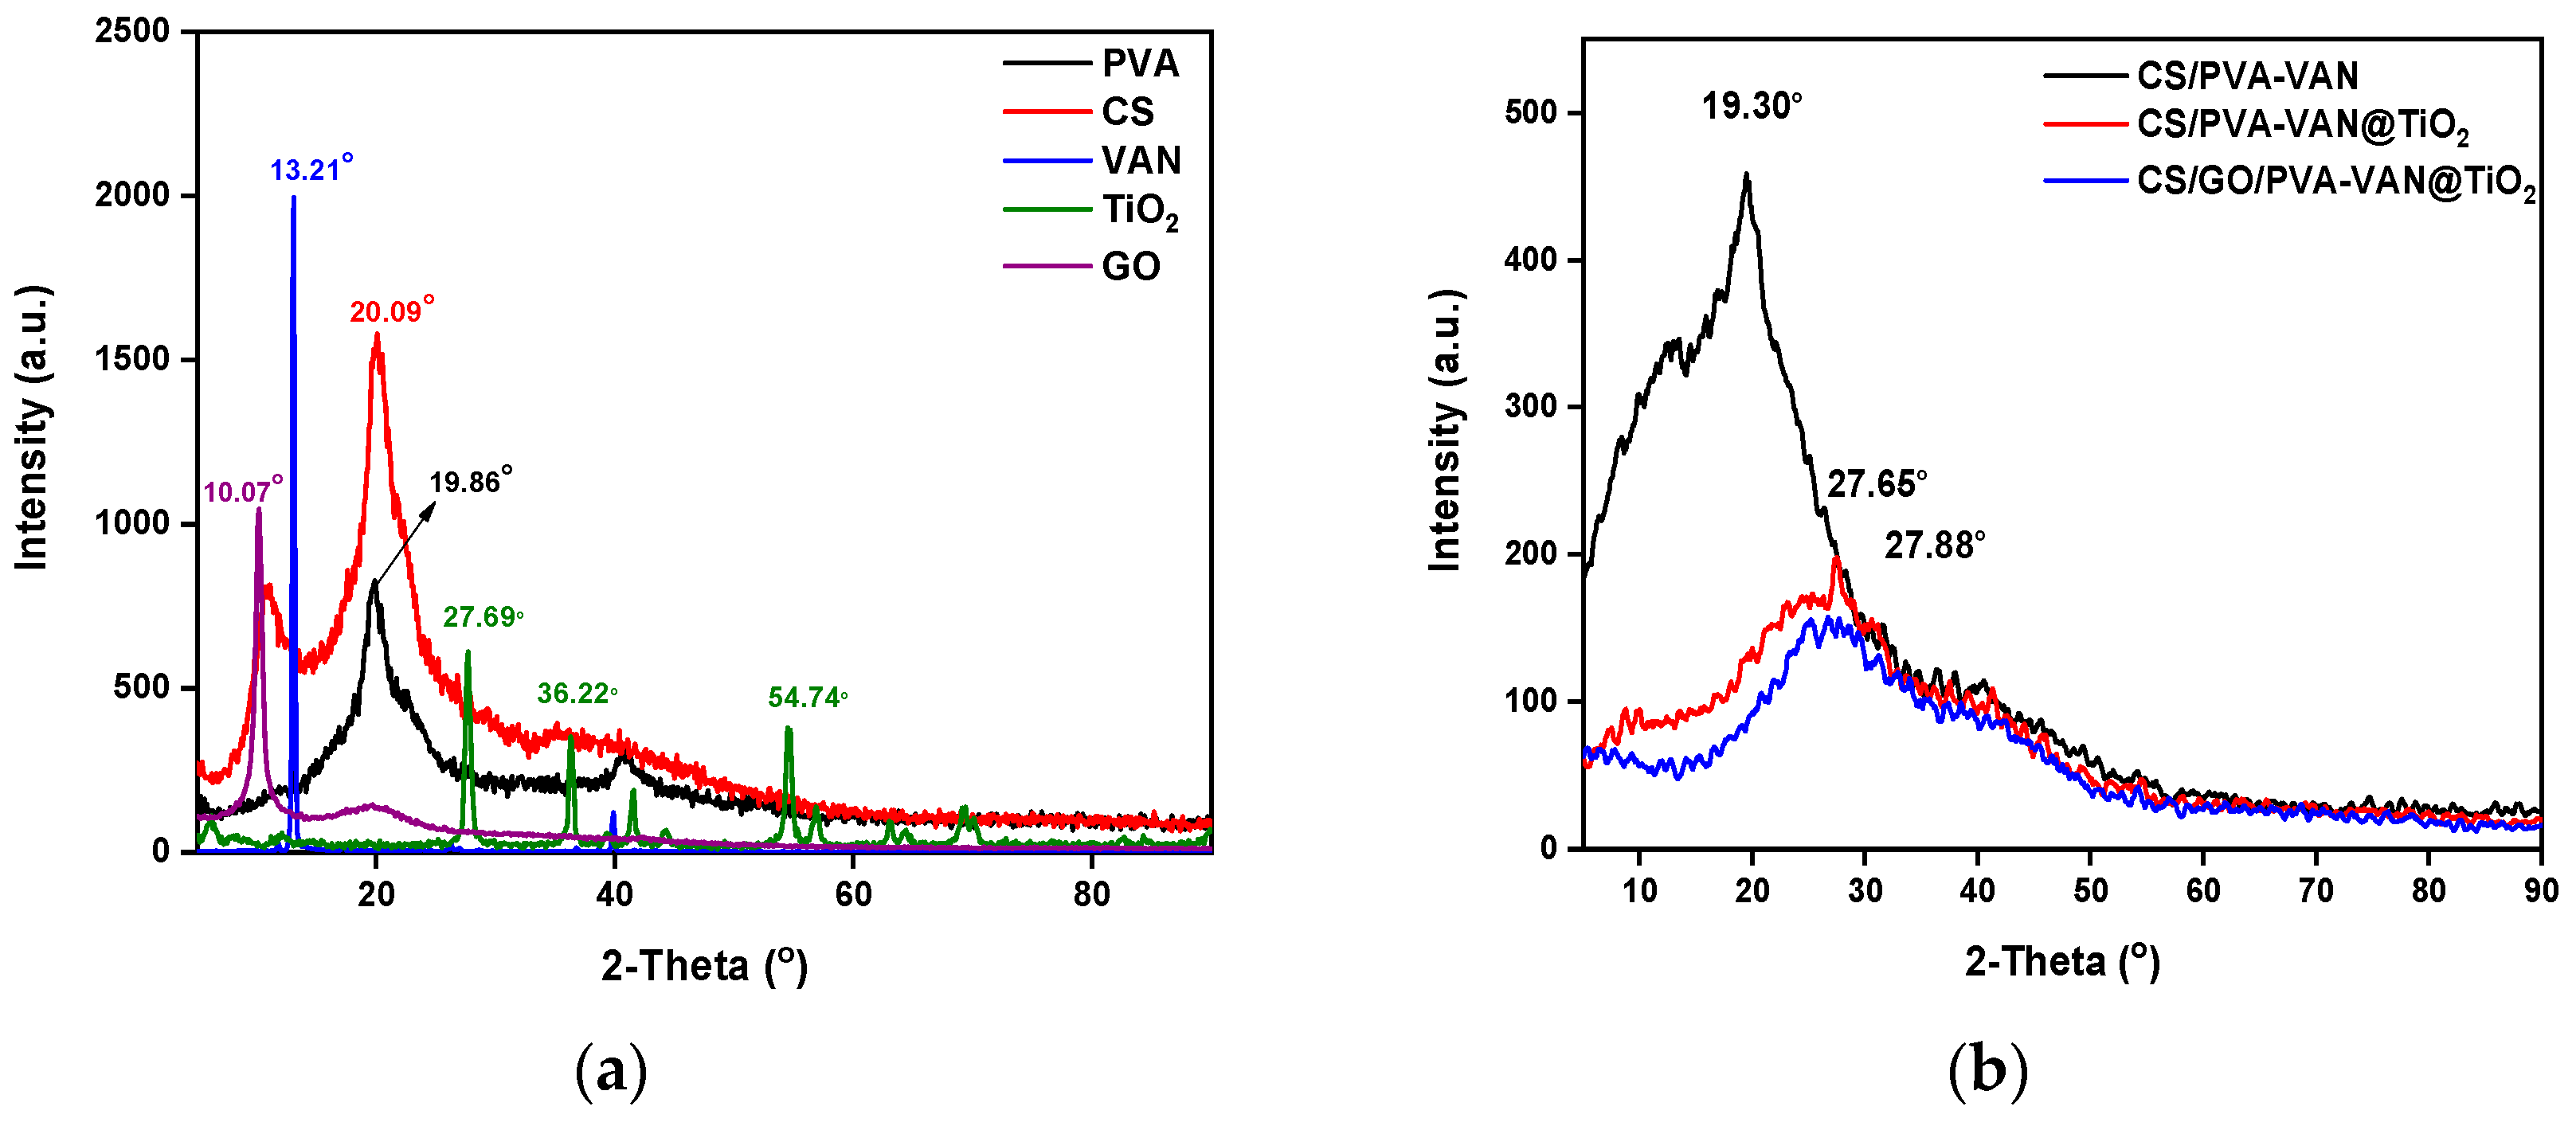
XRD analysis (Figure 4a) of the individual components shows distinct differences in crystallinity that influence the structure and function of the composite. Initially, PVA and CS exhibit semi-crystalline characteristics at 19.85° and 20.09°, typical of flexible polymer matrices that promote homogeneous aerogel formation [54]. In addition, TiO2 exhibits multiple diffraction peaks at 27.66°, 36.22° and 54.47°. These peaks indicate the presence of more ordered domains that provide structural support [55]. However, VAN and GO show low-angle reflections at 13.21° and 10.07°. This suggests layered structures with large lattice spacings [56]. Such structures can enhance adsorption through hydrogen bonding, electrostatic interaction and increased surface area [57].
Additionally, the XRD patterns of the composite material reveal a noticeable decrease in the intensity and slight broadening of the characteristic peaks compared to the neat TiO2 and GO, indicating a reduction in crystallinity. The main diffraction peaks corresponding to TiO2 are still present, confirming the retention of its crystal structure, while the broadening suggests smaller crystallite sizes or increased structural disorder due to incorporation of GO. Moreover, no new peaks were observed, implying the absence of new crystalline phases. These changes suggest that the addition of TiO2 and GO affects the crystallinity and structural order of the composite.

3.1.3. SEM Analysis

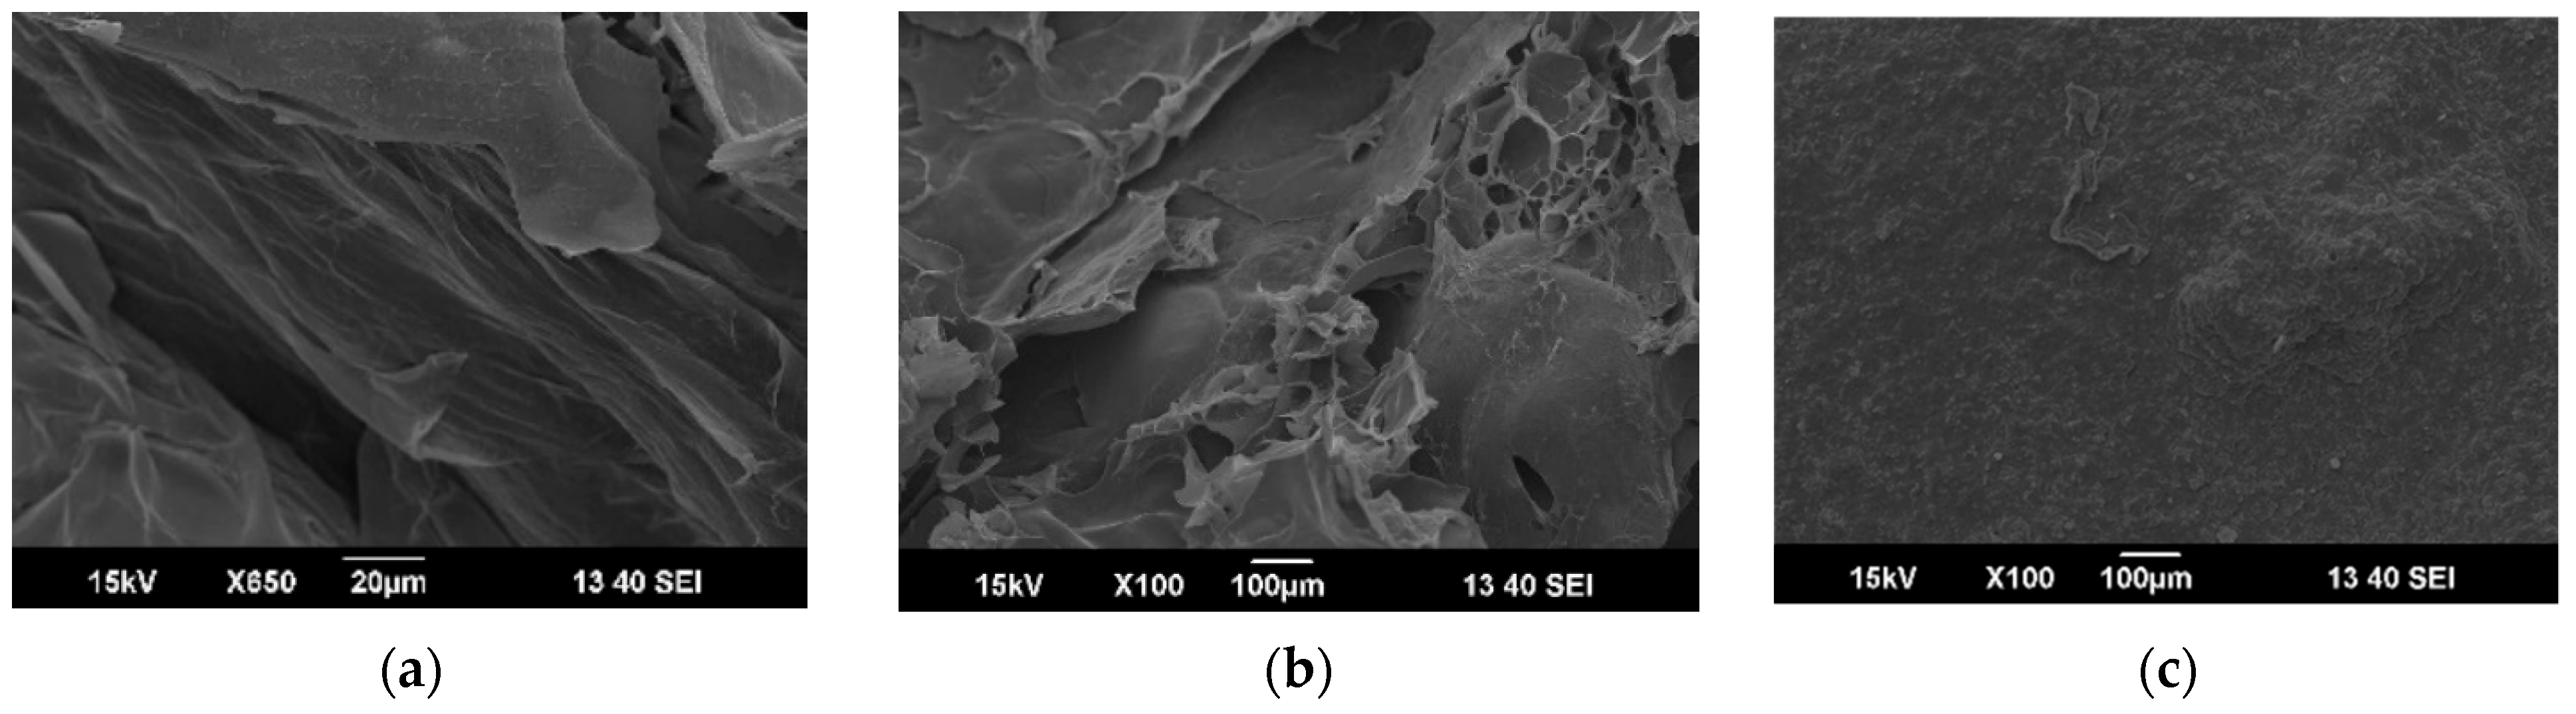
The morphology of CS/PVA-VAN, CS/PVA-VAN@TiO2 and CS/GO/PVA-VAN@TiO2 was assessed via SEM technique. The SEM image of the CS/PVA-VAN aerogel (Figure 5a) showed a relatively smooth and homogeneous surface without visible pores or cracks. This uniform morphology indicated complete miscibility and compatibility between PVA and chitosan, due to intermolecular interactions (as explained in Section 3.1.1). Moreover, Figure 5b presented the SEM image of CS/PVA-VAN@TiO2. The surface exhibited consistent roughness and integrity due to the complete incorporation of TiO2 into the polymeric matrix. Therefore, the SEM images of the CS/GO/PVA-VAN@TiO2 nanocomposite (Figure 5c) revealed a more compact and uniform structure. This phenomenon indicated strong interfacial interactions between GO and the polymer matrix, which enhanced internal cohesion [58]. A well-dispersed GO phase is crucial for improving the aerogels’ mechanical and structural properties [59].

3.1.4. BET Analysis

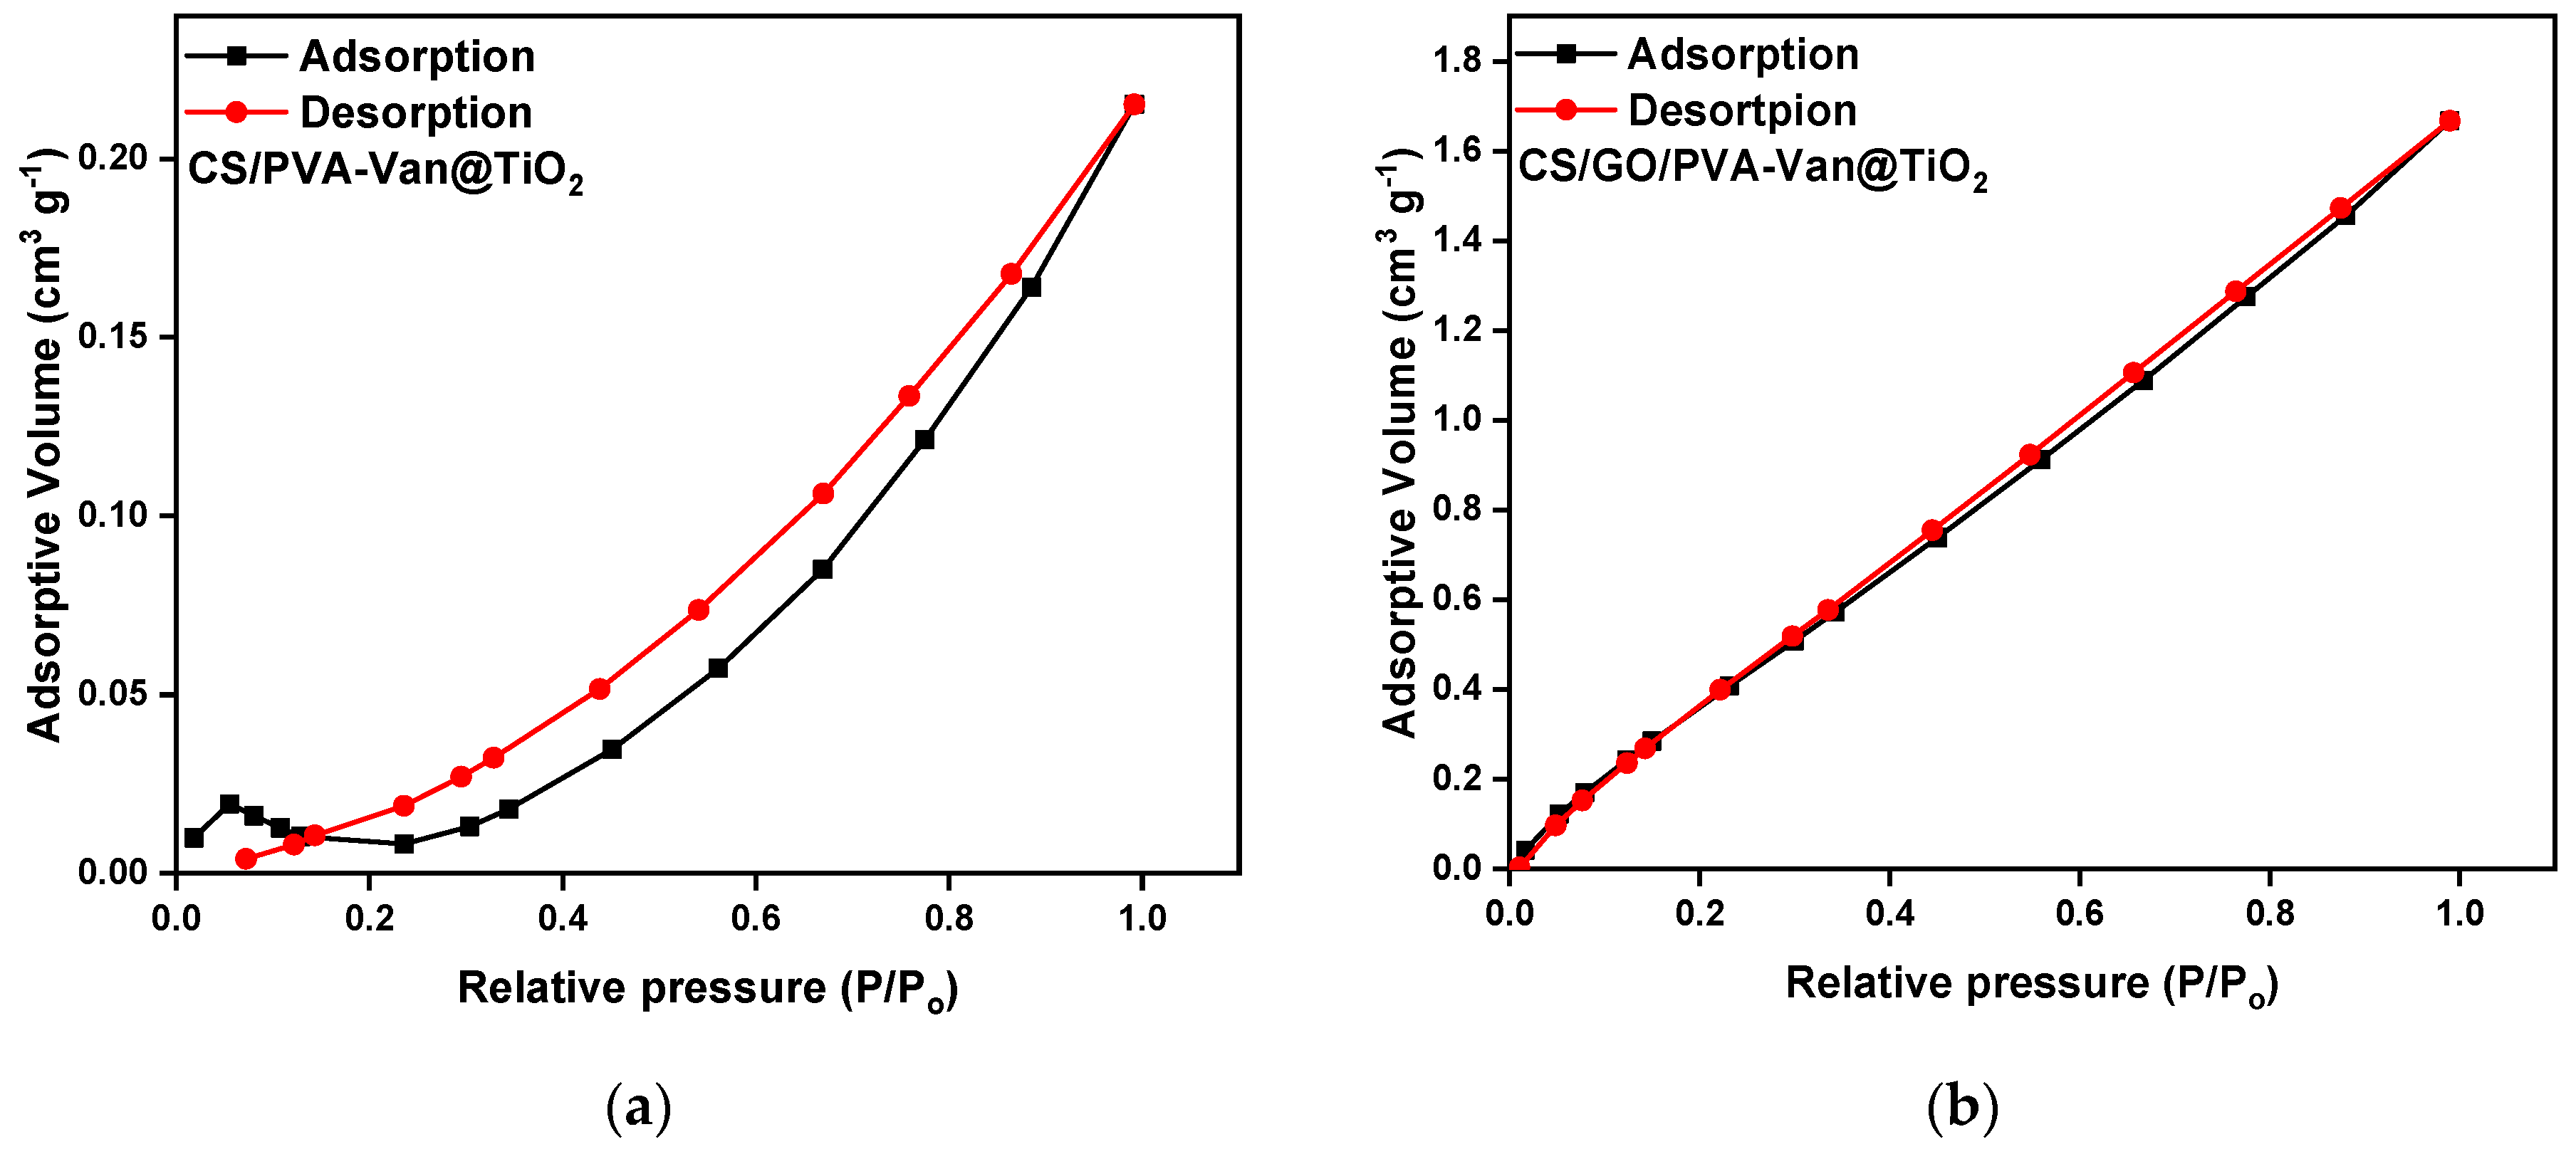
The BET analysis of the two adsorbent materials reveals significant differences in pore structure and surface area (Figure 6). Initially, CS/PVA-Van@TiO2 exhibited a specific surface area of 32.46 m2/g, a pore volume of 0.029 cm3/g and a very high average pore diameter of 161.18 nm (Table 2), indicating a primarily microporous material with a limited available surface area for the adsorption of small molecules [60]. However, with the addition of GO in CS/GO/PVA-Van@TiO2, the specific surface area doubled to 64.86 m2/g and the pore volume increased to 0.060 cm3/g, while the average pore diameter decreased to 2.016 nm, suggesting a transformation to a micro–mesoporous structure [61]. The notable increase in specific surface area upon the addition of 0.01 g GO indicates that even trace amounts can effectively enhance the dispersion of TiO2 particles and influence the polymer matrix morphology. Moreover, the functional group of GO may interact with polymer chain, creating an extended porous structure while simultaneously reducing particle aggregation [62]. Consequently, this modification significantly improved the adsorption capacity and the availability of active sites [63], making the CS/GO/PVA-Van@TiO2 more suitable for the adsorption of small organic pollutants. Overall, the incorporation of GO improves both pore geometry and specific surface area, thereby improving the performance of the adsorption process.

3.2. Adsorption Evaluation

3.2.1. Effect of pH—Adsorption Mechanism

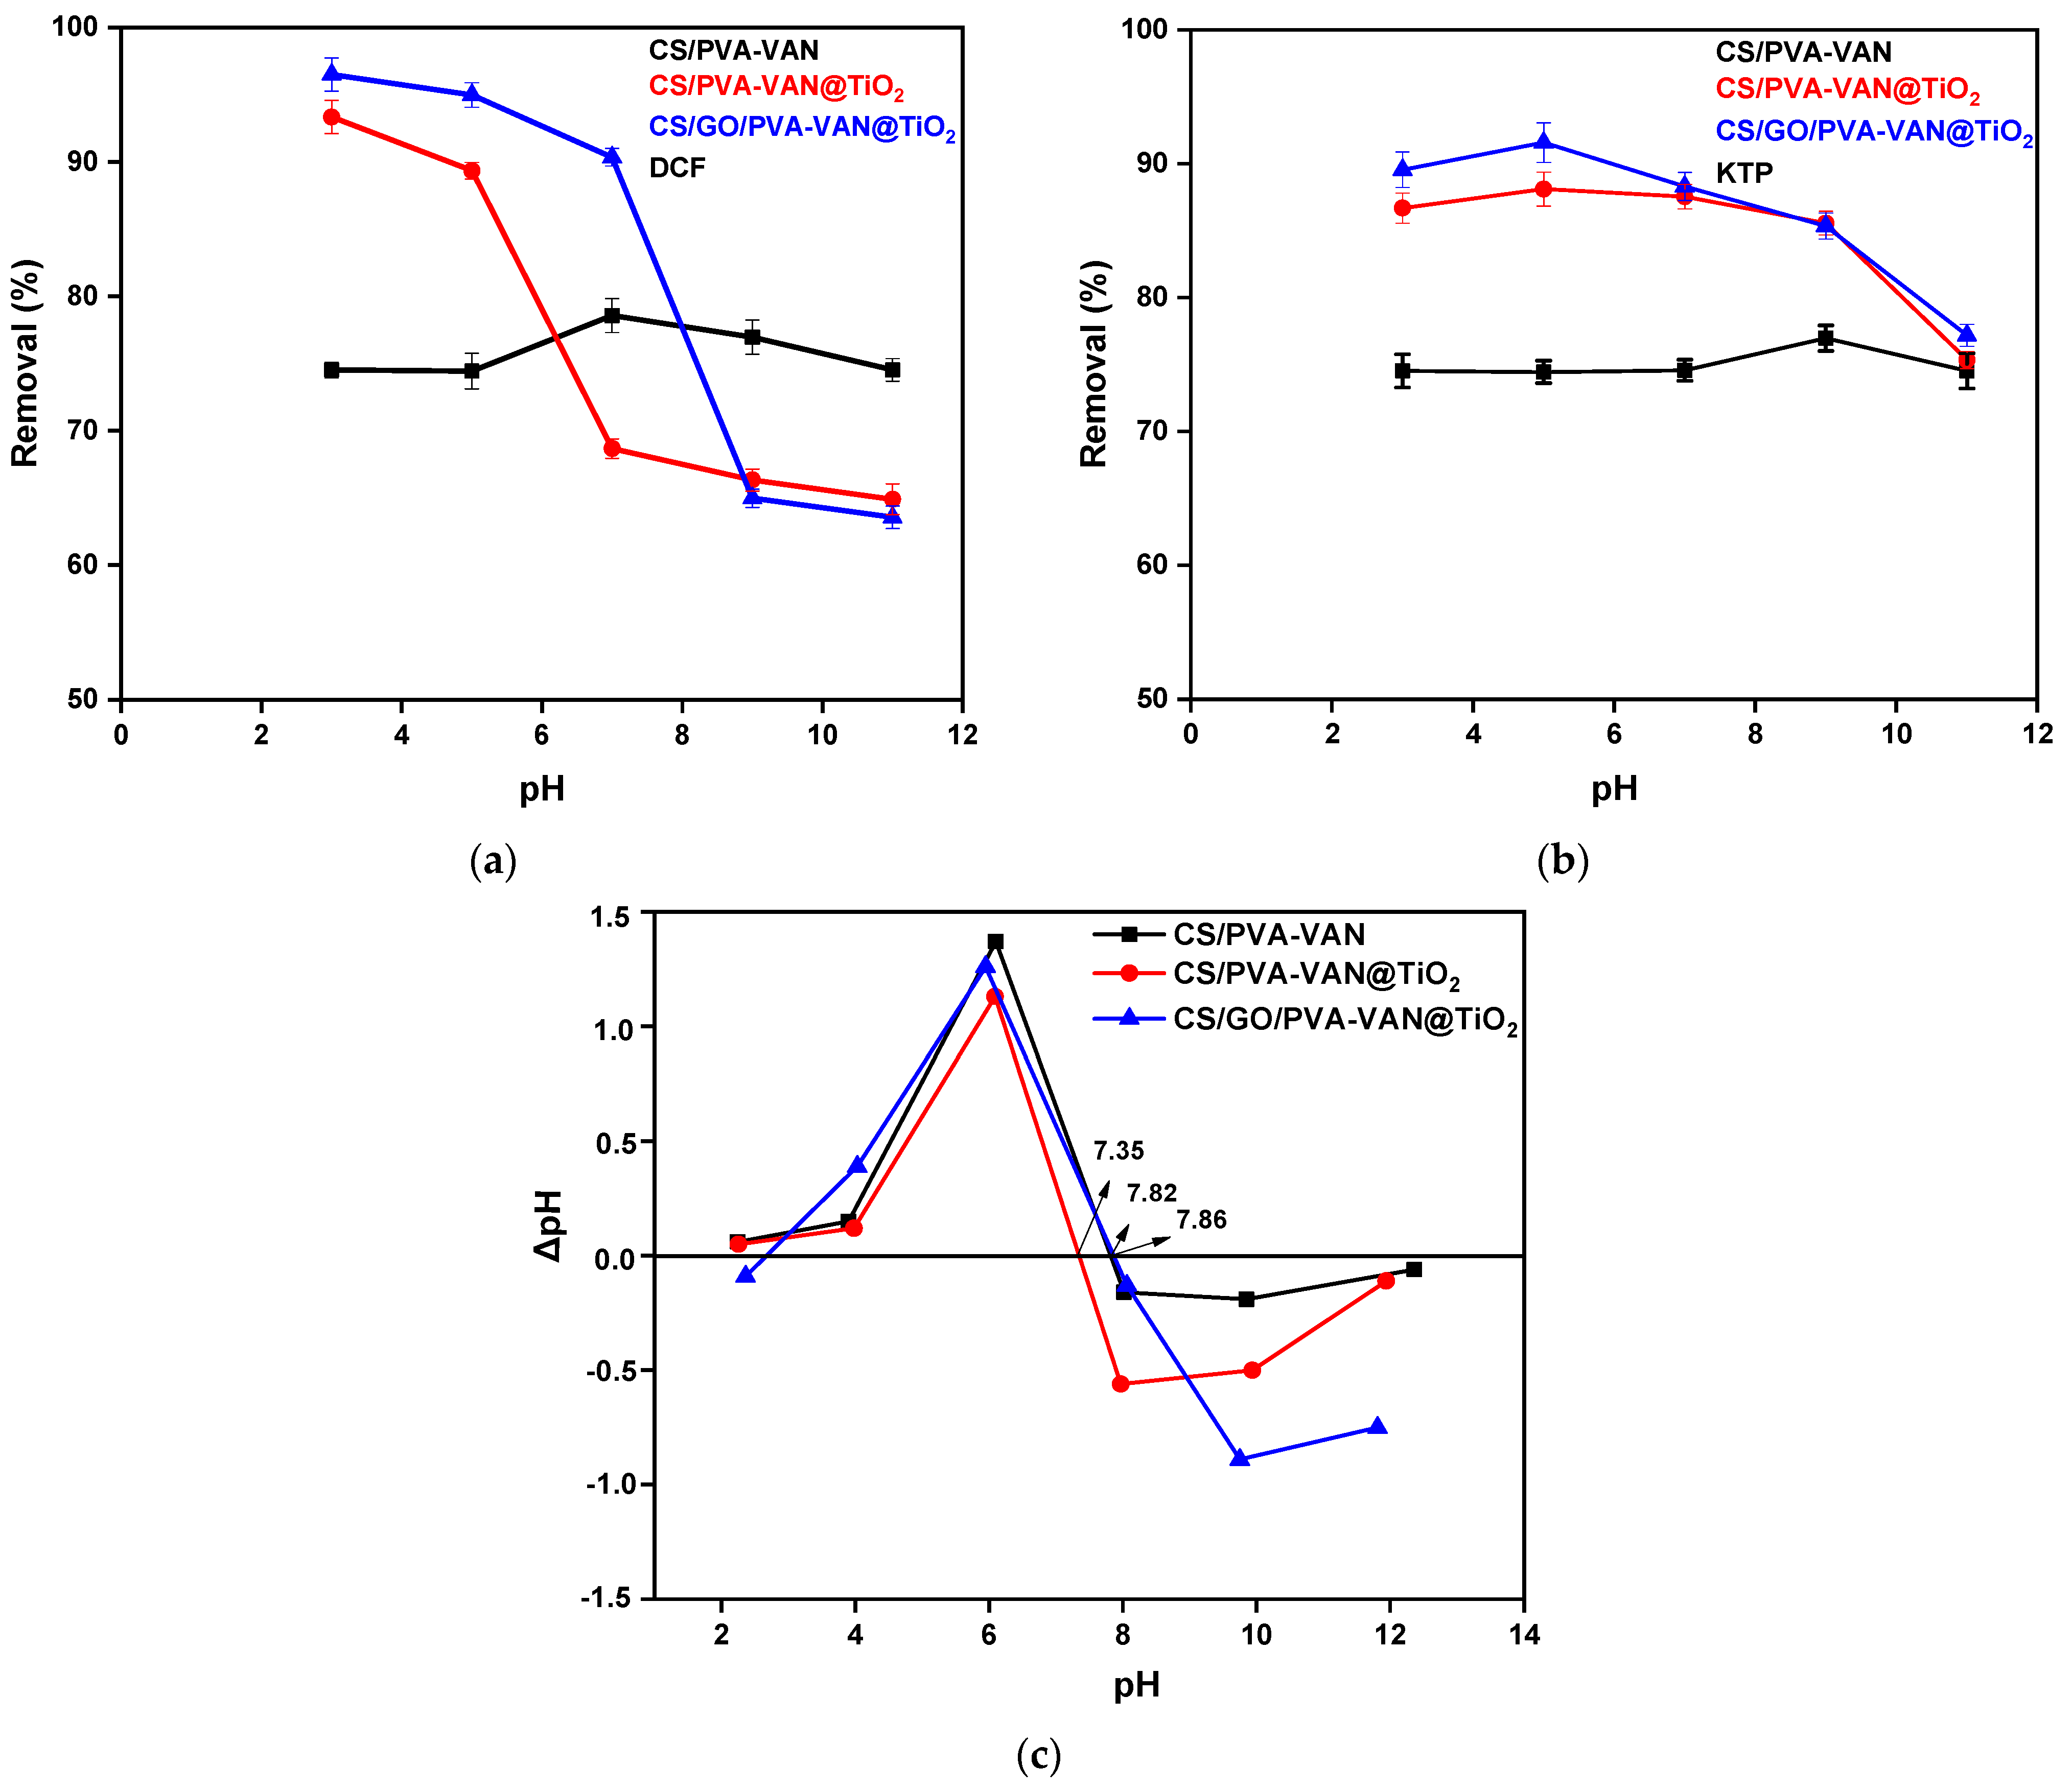
The effect of pH is a critical factor in all batch experiments, as the pH value influences all other aspects of adsorption evaluation. In this experimental process, the removal efficiency (%) of DCF and KTP using the newly developed composite adsorbent materials was tested at pH values of 3.0, 5.0, 7.0, 9.0, and 11.0. The adsorbent mass was 1 g/L at 303 K. The aim was to determine the optimum pH that maximizes removal efficiency, considering that DCF and KTP have different pKa values (4.71 [64] and 4.76 [65], respectively), as well as different charge characteristics across the pH spectrum.
As presented in Figure 7c, the CS/GO/PVA-VAN@TiO2 composite exhibited the highest percentages in all examined NSAIDs compared to CS/PVA-VAN (Figure 7a) and CS/PVA-VAN@TiO2 (Figure 7b). Additionally, diagrams showed that the highest removal efficiency is achieved at pH 3.0 and 5.0. However, it is known that the NSAIDs hydrolyze at a lower pH value [66] and for this reason in this study the optimal pH value chosen is pH 5.0 (and not 3.0). In neutral and basic conditions, the removal efficiency decreased for all composites. Specifically, at pH 5.0, CS/GO/PVA-VAN@TiO2 removed 95% and 86% of DCF and KTP, respectively, while CS/PVA-VAN absorbed less than 80% of each pollutant. Therefore, CS/GO/PVA-VAN@TiO2 is identified as the most effective adsorbent for NSAID removal under the studied conditions.
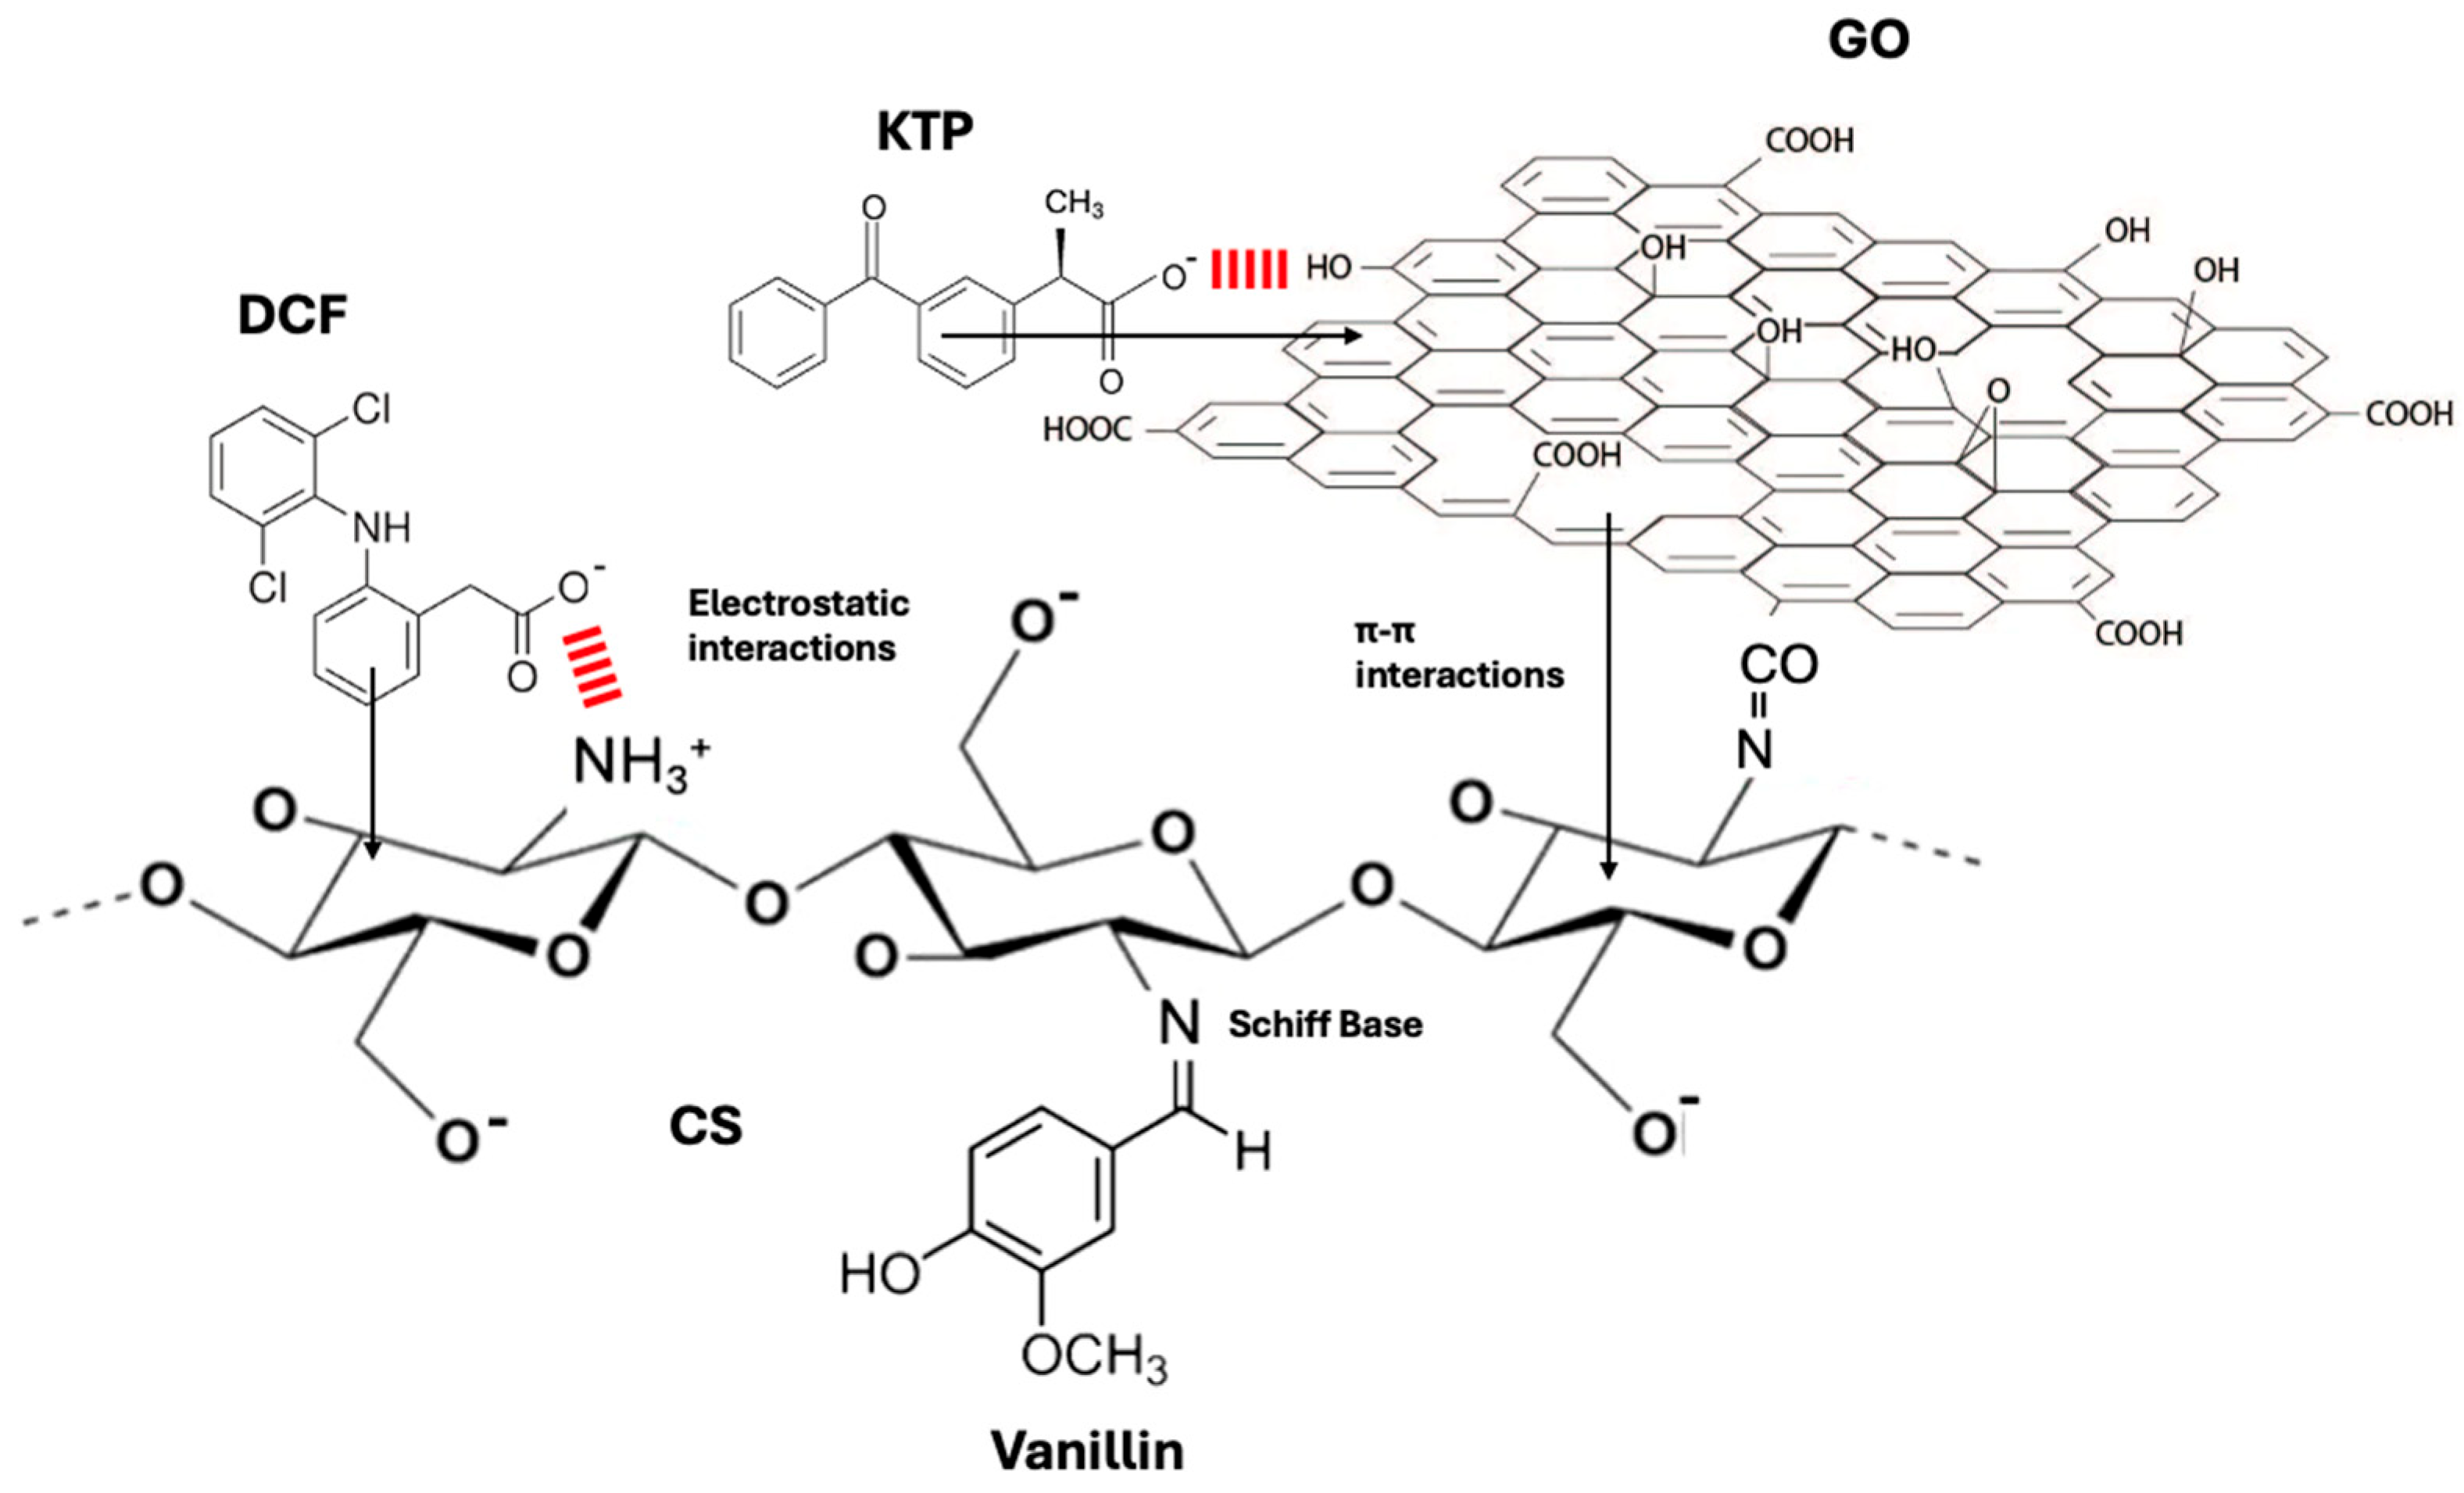
Moreover, the point of zero charge (pHpzc) of the composite material was determined by the pH drift method [67] and is shown in Figure 7c. After calculation, the relative pHpzc values for CS/PVA-VAN, CS/PVA-VAN@TiO2 and CS/GO/PVA-VAN@TiO2 were found to be 7.35, 7.82 and 7.86, respectively. Moreover, pHpzc was important to describe the surface interaction between the adsorbent material and pollutant. Particularly, when pH < pHpzc, the adsorbent surface is positively charged, while when pH > pHpzc it is negatively charged [68]. As previously mentioned, the optimum pH value for DCF and KTP removal was 5.0. This suggests that electrostatic interaction increased between the positive surface of the adsorbent and the negatively charged NSAIDs. Specifically, CS/GO/PVA-VAN@TiO2, due to the GO, offered various functional groups such as amino groups or carboxyl, hydroxyl and epoxy groups [69], which in low-pH conditions protonated and formed electrostatic interactions with the ionized structure of the NSAIDs (pH > pKa of DCF and KTP). According to the literature, π-π interactions between the aromatic rings of pollutants and carbon-based adsorbents enhance the adsorption efficiency, explaining the higher removal observed for CS/GO/PVA-Van_TiO2 [70]. These kinds of interactions with pharmaceutical compounds are responsible for the removal efficiency of CS/PVA-VAN. Figure 8 presents the proposed mechanism that may occur on the surface of the optimum CS/GO/PVA-VAN@TiO2 composite.

3.2.2. Effect of Contact Time

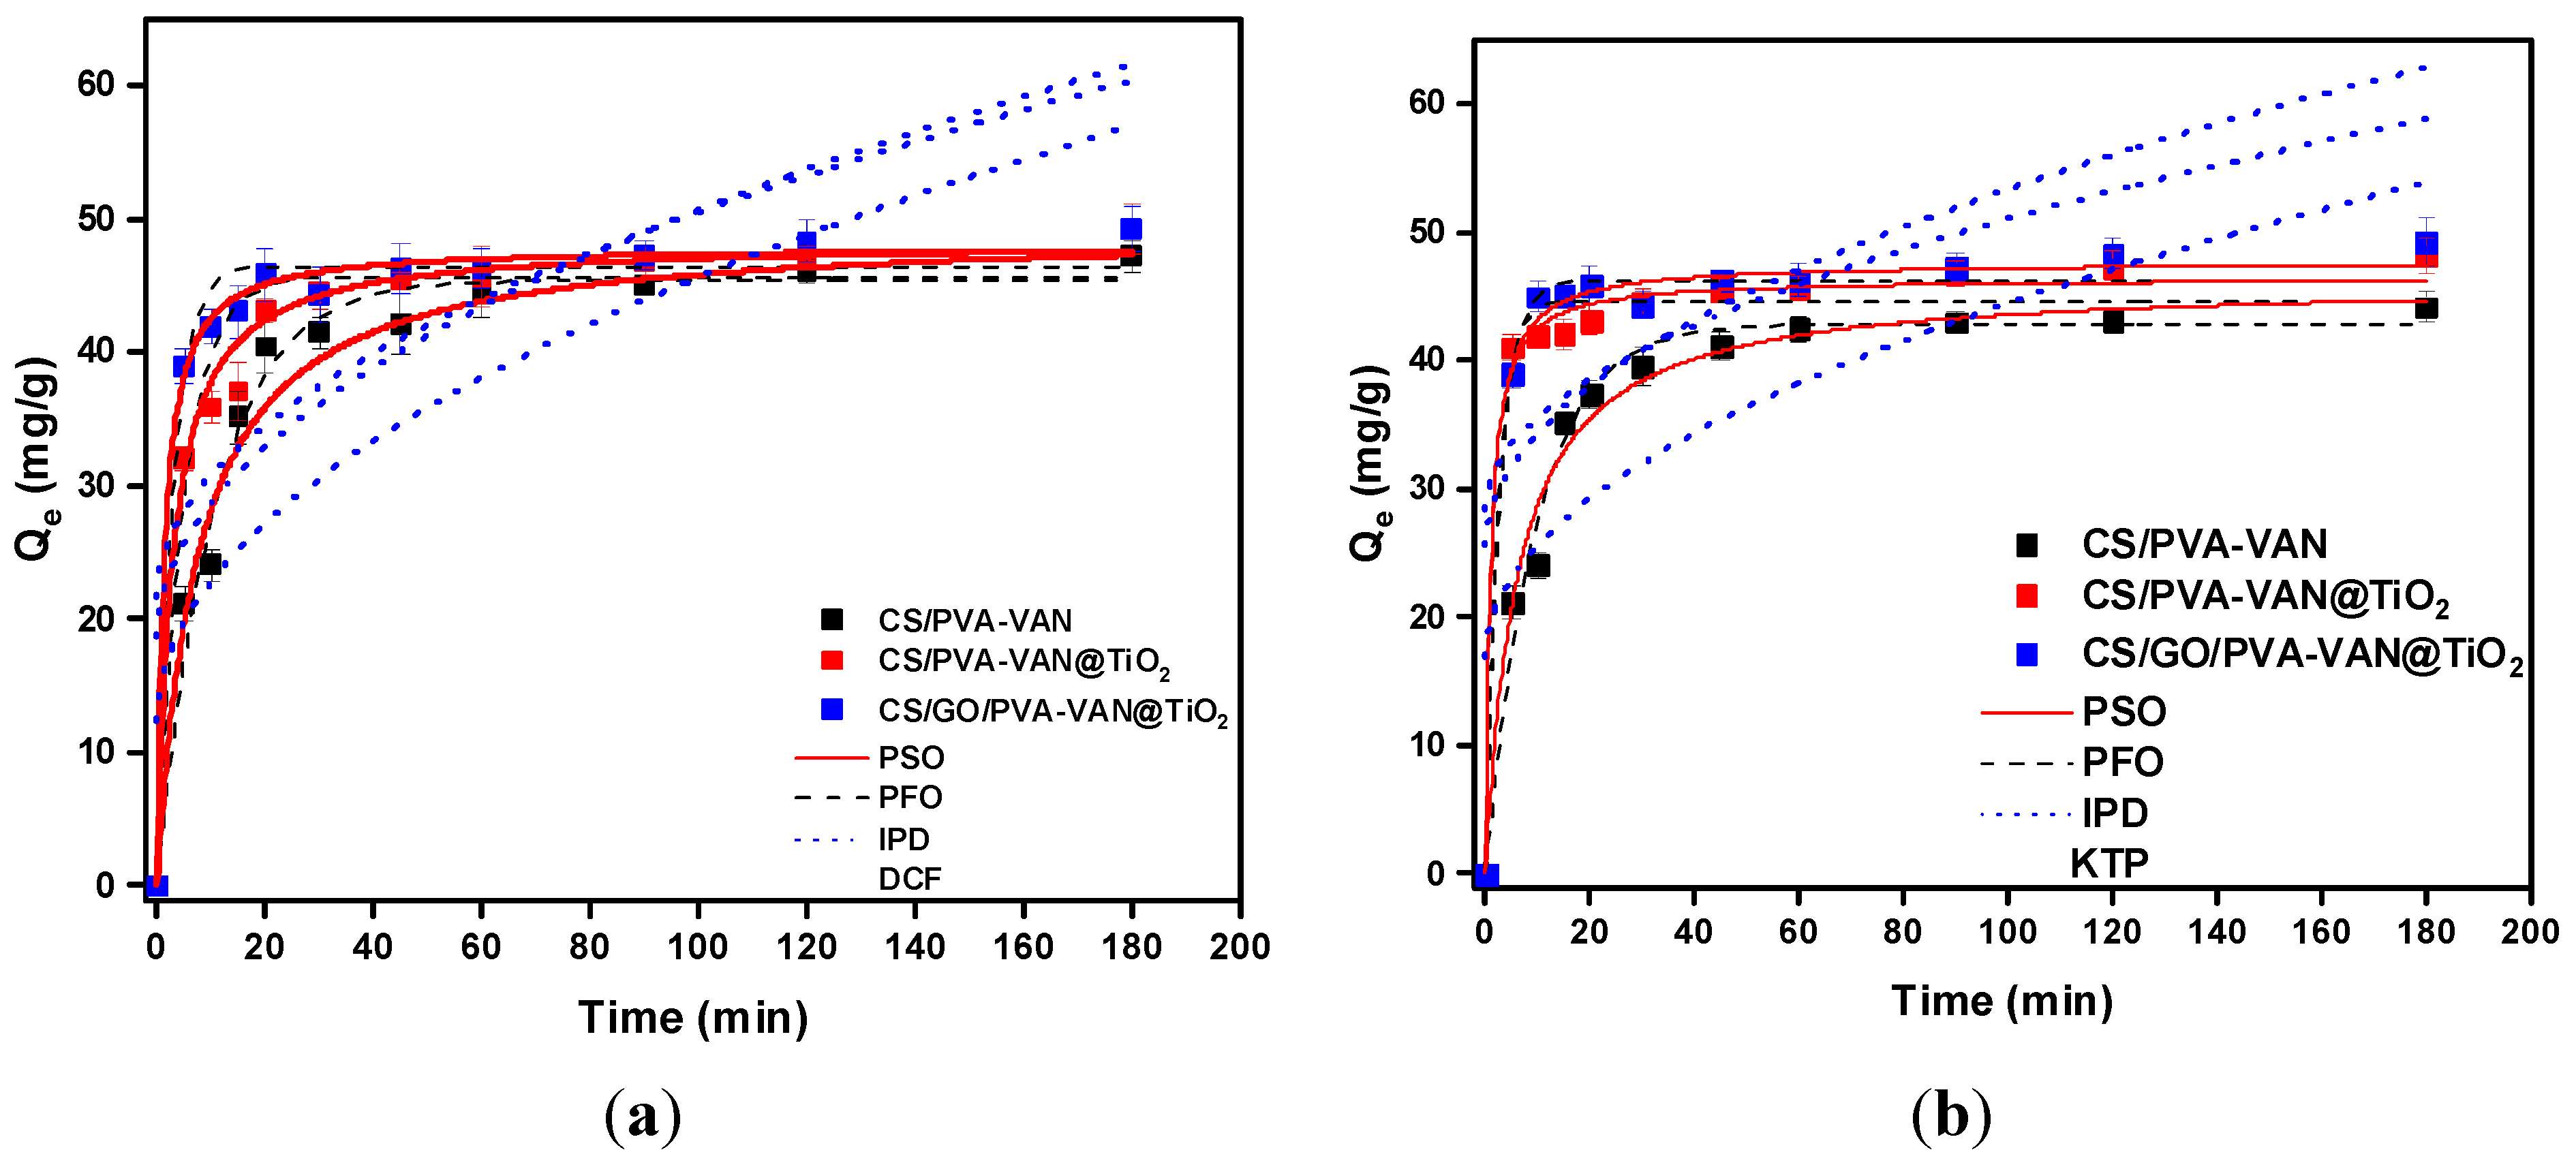
Another important parameter for adsorption evaluation is the effect of contact time because it gives information about the equilibrium time and the adsorption type. In this study, each adsorbent material (30 mg, V = 30 mL equal to 1 g/L) was tested at pH 5.0 and 303 K for different contact times ranging from 5 to 180 min to observe how adsorption changes over time. Figure 9 presents the effect of contact time for all of the new composite materials in DCF and KTP solutions.
During the initial minutes of the adsorption process, a sharp increase in the adsorbent’s capacity is observed, which subsequently stabilizes, and equilibrium was reached at 45 min for DCF and at 60 min for KTP. The rapid initial adsorption in the active sites is followed by a slower stage governed by the intraparticle diffusion of the DCF and KTP molecules. This phenomenon suggests that the adsorption process is controlled by both chemisorption and diffusion-limited mechanisms.
Kinetic studies constitute a critical aspect in elucidating the adsorption process. The experimental data were analyzed using the PFO and PSO models, those most applied in adsorption research, while the IPD model was used to evaluate whether intraparticle diffusion governs adsorption rates. As theory [71] assumes, the PFO model describes physisorption, specifically the weak interaction between adsorbents and NSAIDs, while the PSO model refers to chemisorption, which explains the formation of a chemical bond between the adsorbent and pollutants [72]. Table 3 shows the kinetic parameters for PFO, PSO and IPD models during DCF and KTP adsorption. According to the high correlation coefficient (R2), the PSO kinetic model fitted better to the experimental data, so a new chemical bond was formed between the adsorbent materials and NSAIDs. Therefore, this agreement indicates that the PSO model accurately describes the adsorption kinetics, implying that a new chemical bond developed between the adsorbents and pharmaceutical compounds. In addition, the IPD model showed relatively low R2 values (0.380–0.788), indicating that intraparticle diffusion is not the sole rate-limiting step. The non-zero intercept (C ≠ 0) further confirms the involvement of film diffusion [73]. Moreover, the variation in C values among the different composites suggests that the significance of external resistance varies depending on their morphology and porosity, providing a complementary perspective on the kinetic processes beyond the dominant chemisorption.

3.2.3. Isotherm Study

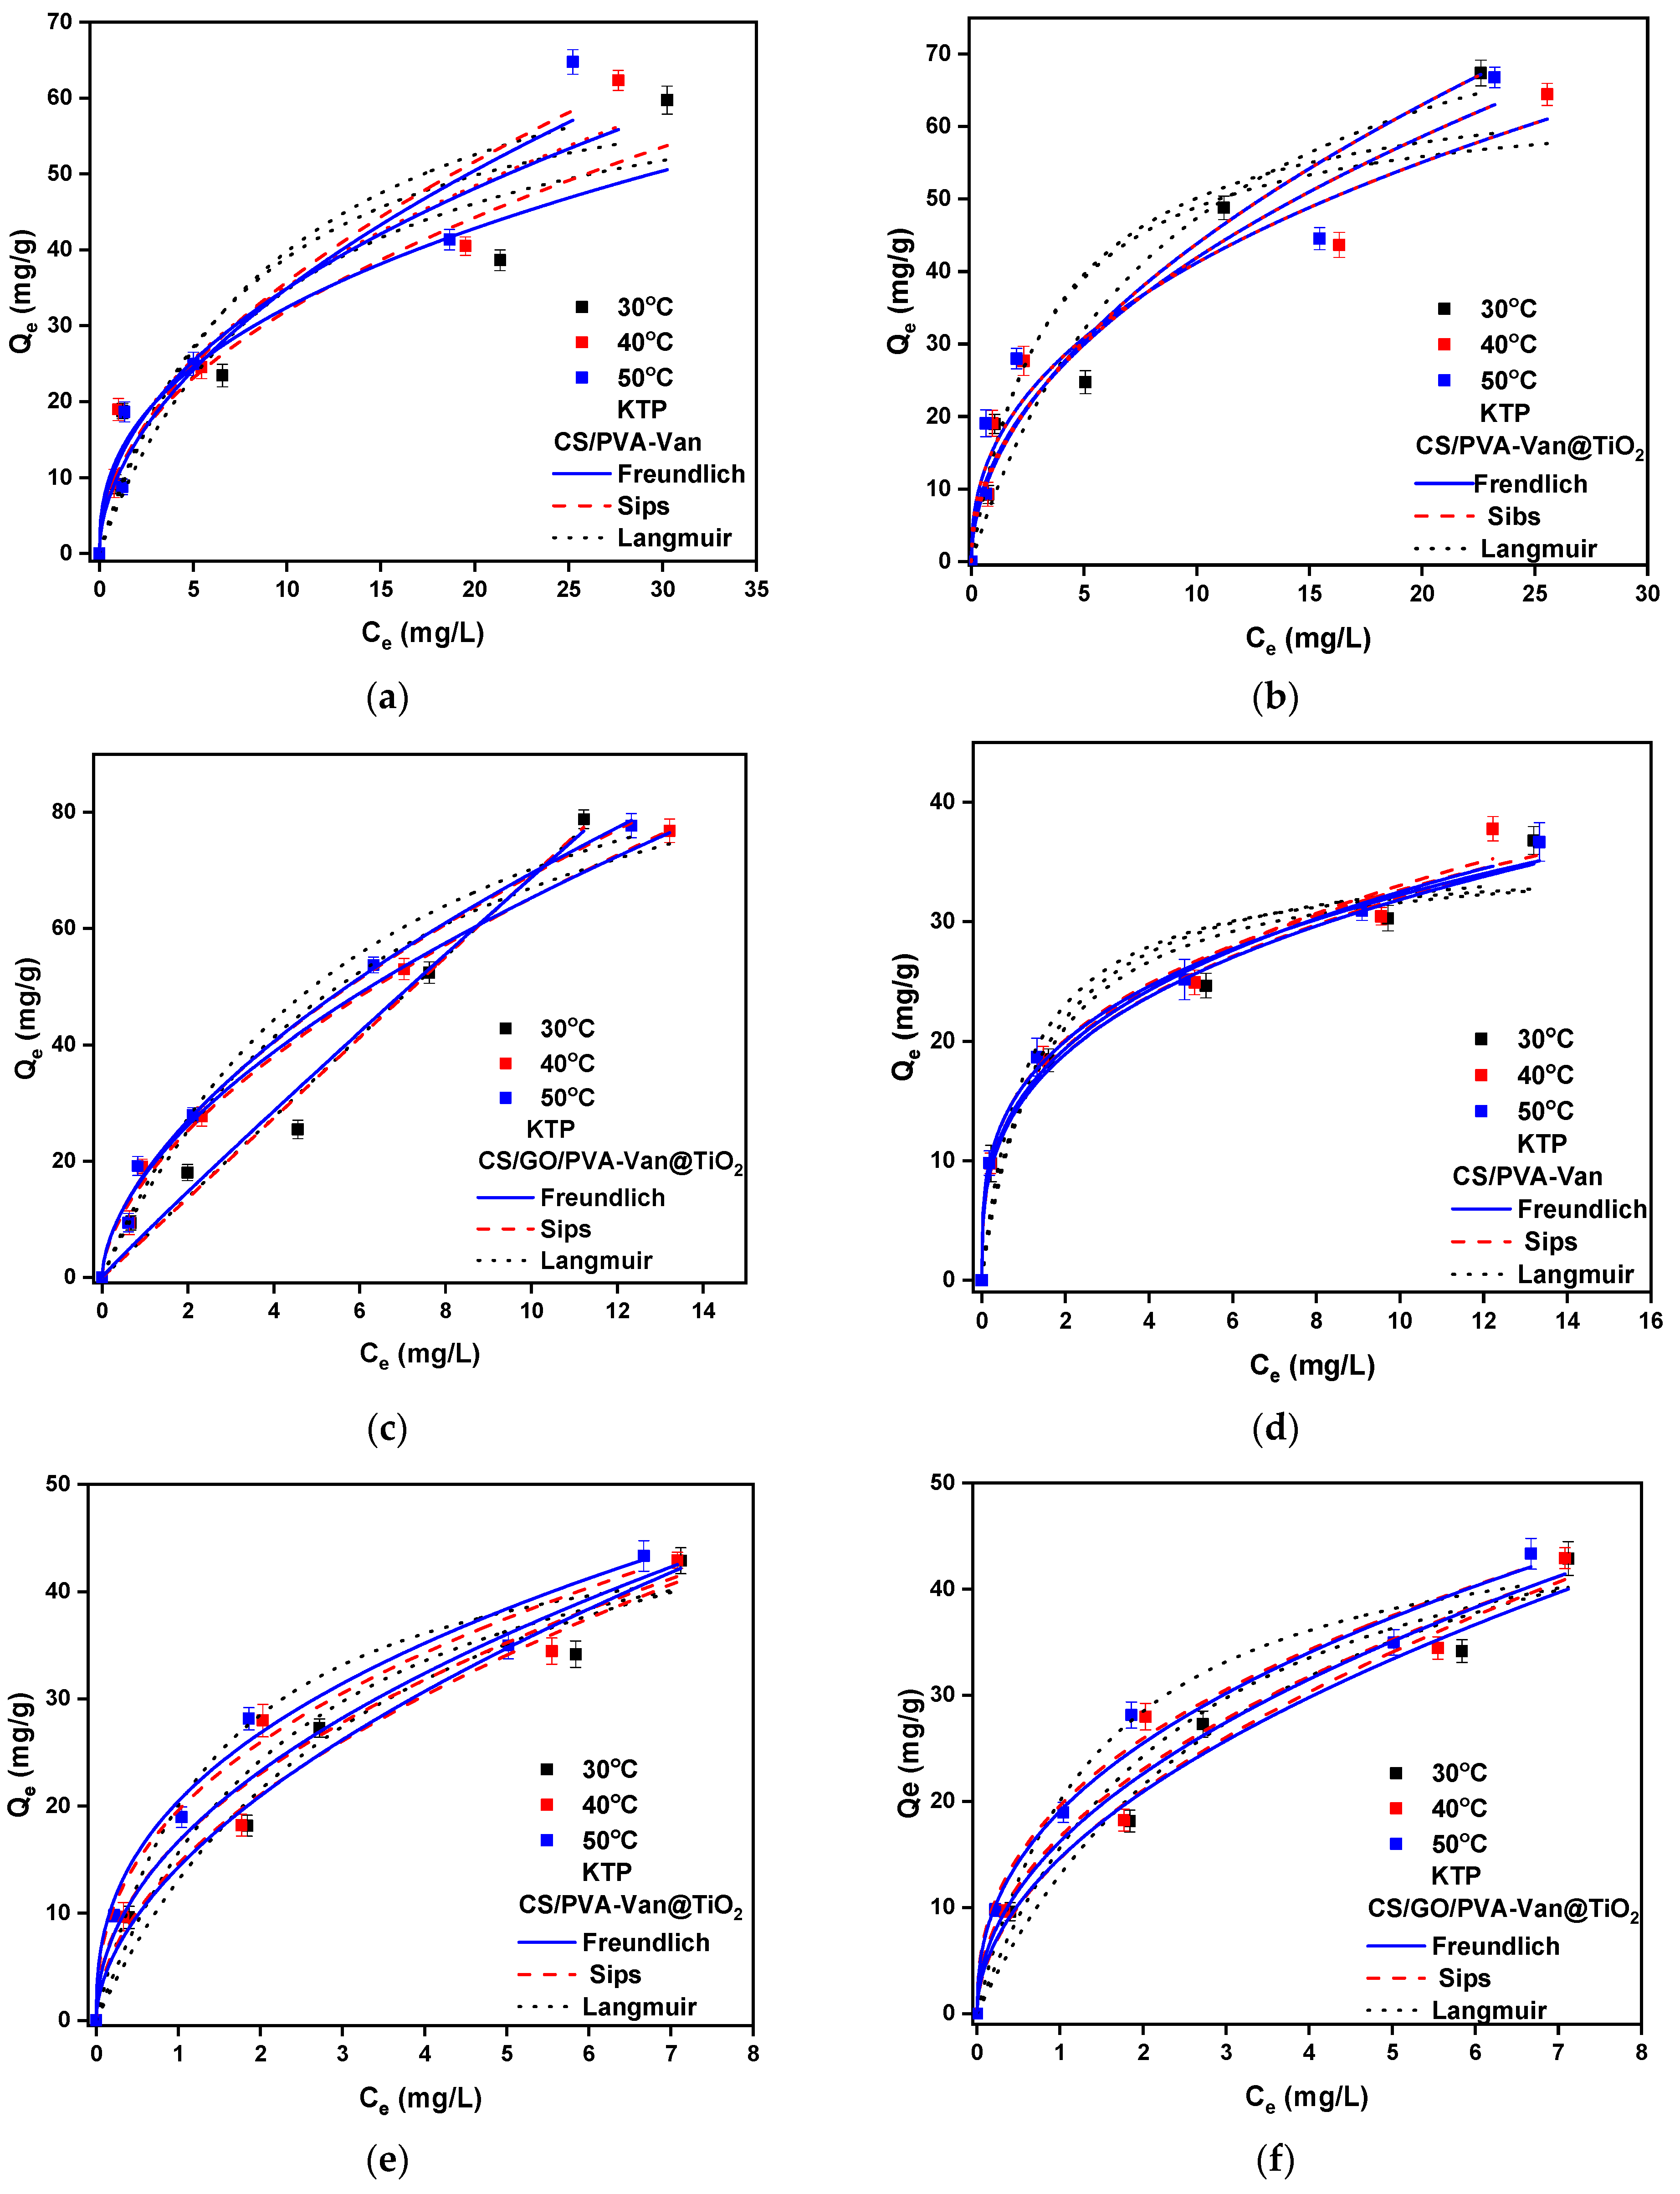
The adsorption equilibrium data were evaluated using three commonly applied isotherm models: the Freundlich, Langmuir and Sips models. The adsorption isotherms of DCF and KTP onto the new composites are shown in Figure 10, and the associated isotherm parameters are summarized in Table 4. In the case of CS/GO/PVA-VAN@TiO2, the adsorption of DCF and KTP is better fitted to the Freundlich isotherm model, as indicated by the higher correlation coefficient (R2 = 0.995 and 0.982 for DCF and KTP, respectively), in comparison to the Langmuir model (R2 = 0.986 and 0.970 for DCF and KTP, respectively). This fact means that the adsorption of the pharmaceutical compounds is multilayer on a heterogeneous surface area [74]. The Sips model also provides a satisfactory fit to the experimental data, reflecting its capability to account for heterogenous adsorption behavior and bridging characteristics between the Langmuir and Freundlich isotherms. According to the Freundlich isotherm model, the value of n provides insight into the nature of the adsorption process: when n < 1 the adsorption is chemical; when n = 1 it is linear; and when n > 1 the adsorption is a physical process [75]. Table 2 presents the 1/n values, which are less than one, confirming that the efficient NSAID removal from the new composite materials is a physical process.

3.2.4. Thermodynamic Studies

In Table 5 are presented the thermodynamic parameters during pharmaceutical compound adsorption. The Gibbs free energy (ΔG0) was calculated at 303, 313 and 323 K at pH 5.0. The results affirmed that the adsorption of both DCF and KTP was spontaneous onto all of the new composite materials, which indicates the strong interactions between the pharmaceutical molecules and the adsorbent surface. Moreover, the positive value of ΔH0 confirms that this process is an endothermic phenomenon [76]. This endothermic behavior can be attributed to the uptake of energy upon the formation of stable interactions between the NSAIDs and the active sites of the composites, indicating that the adsorption process was not driven by strong binding forces at the solid–solution interface [77].
Furthermore, a positive ΔS0 value demonstrated an increase in the disorder of the adsorbed molecules on the surface [78]. In the case of DCF and KTP adsorption, however, ΔS0 decreases at 313 K, indicating a reduction in molecular disorder. This behavior is consistent with a chemisorption mechanism [79]. The positive value of ΔS0 suggested an increase in randomness at the solid–solution interface during adsorption. This was probably caused by the displacement of water molecules or ions previously associated with the adsorbent surface or the hydration shell of the pharmaceutical molecules. As a result, the overall spontaneity of the process is enhanced.

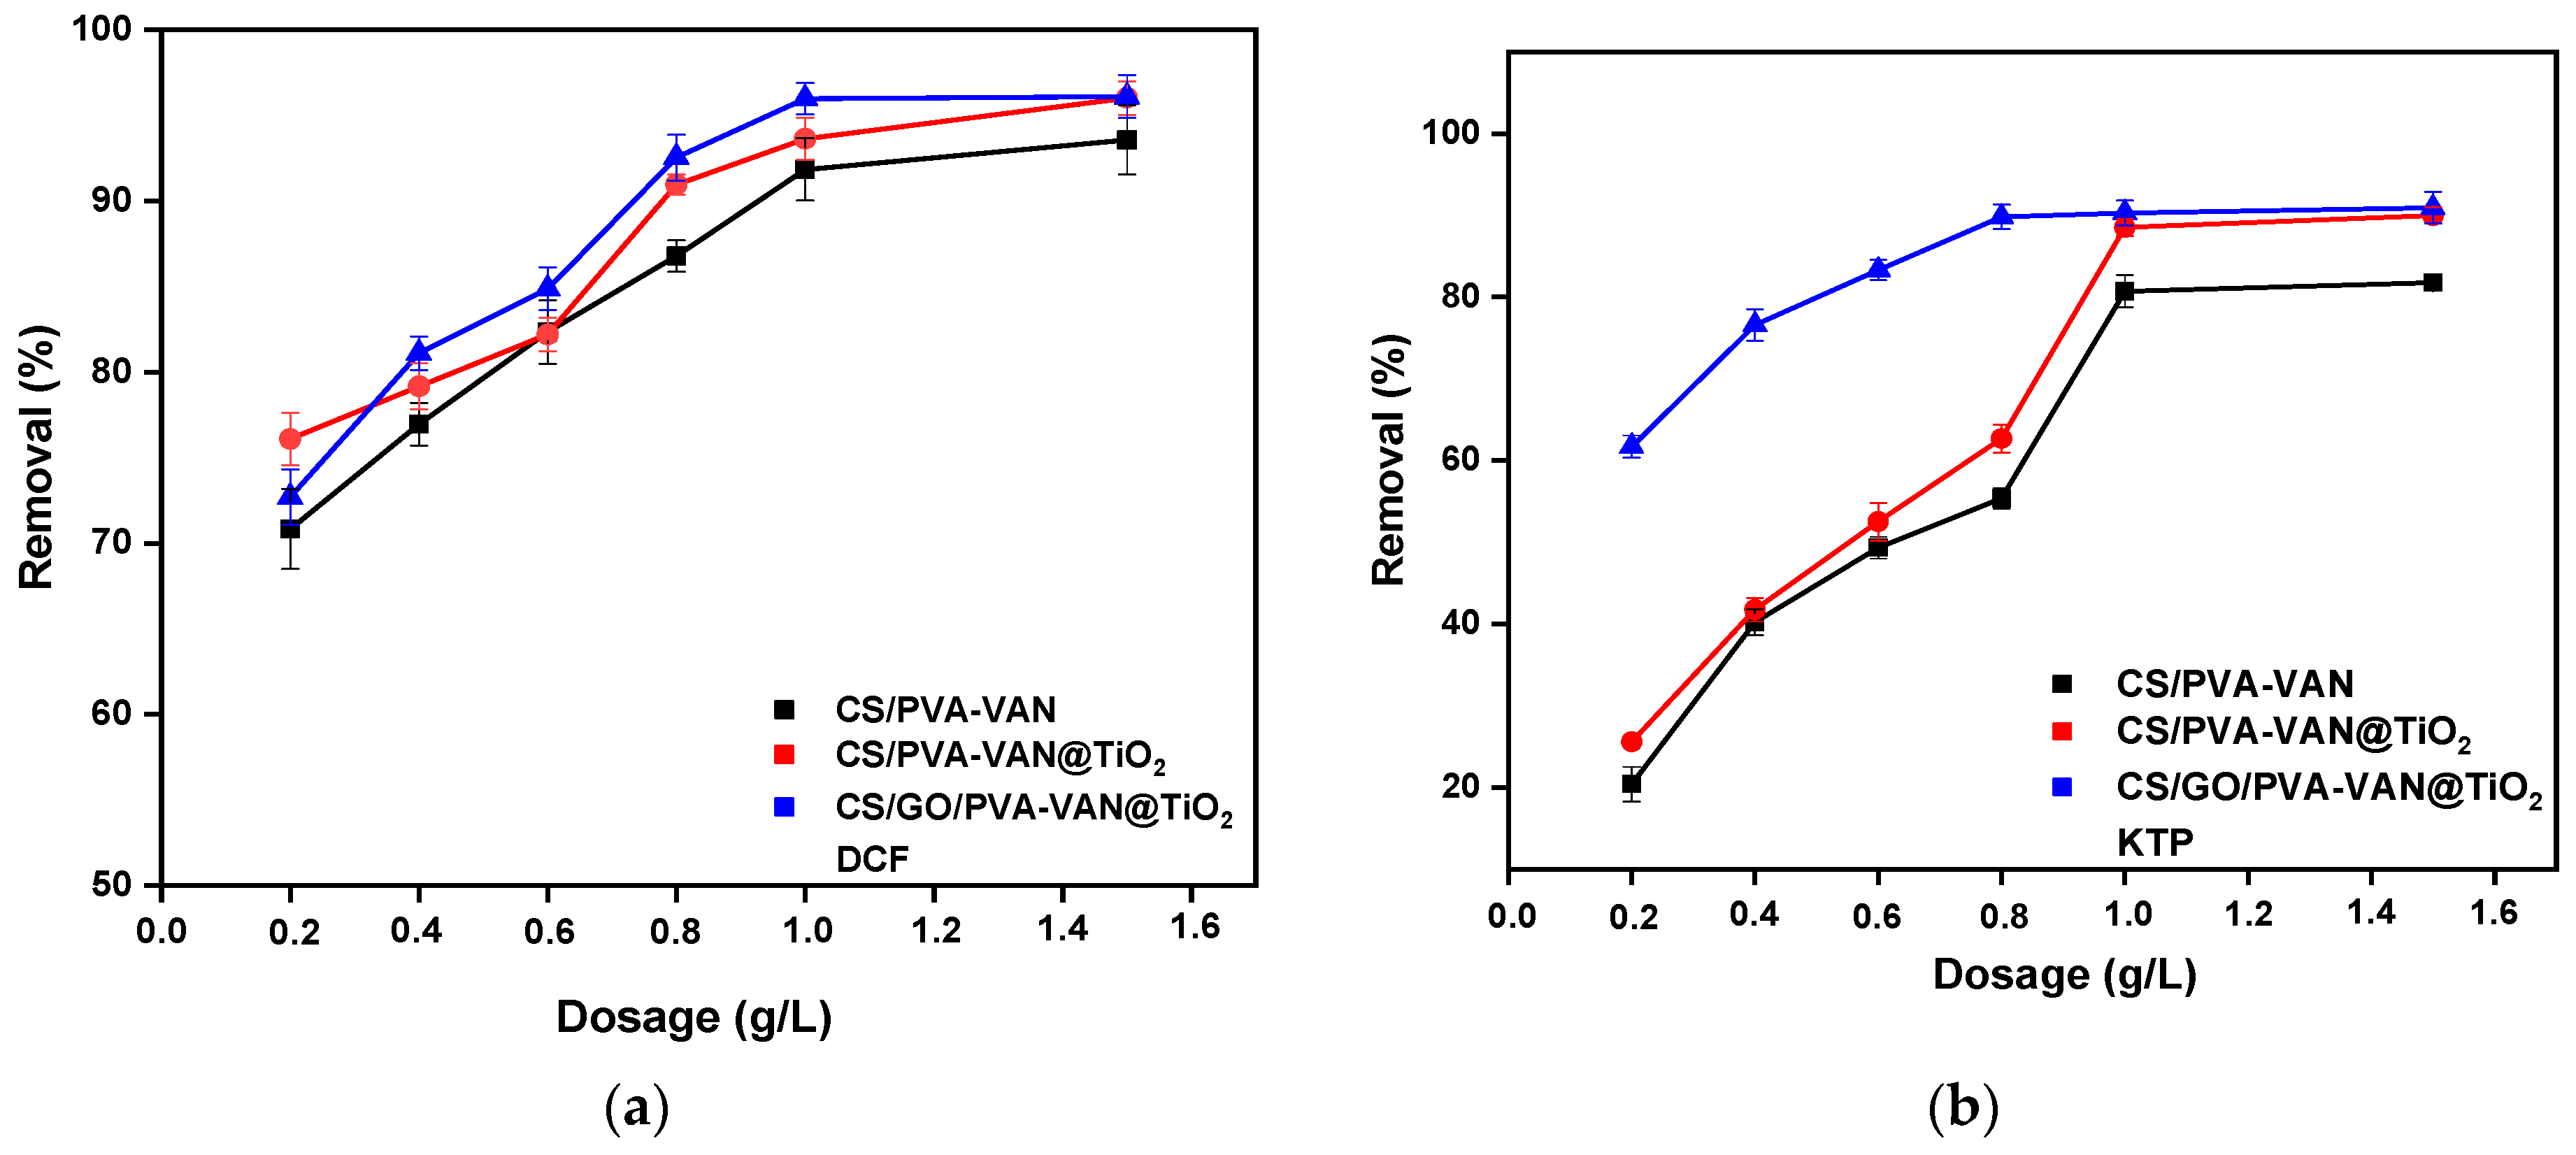
3.2.5. Effect of Mass

To determine the minimum amount of adsorbent mass by which the highest adsorption capacity was achieved, the effect of mass was studied in the range of 0.2–1.5 g/L. Figure 11 presents the experimental results. Initially, increasing the mass enhances the number of available active sites, improving the adsorption process. All of the new composites at a concentration of 1 g/L showed a high removal efficiency for NSAIDs, with the CS/GO/PVA-VAN@TiO2 composite exhibiting the highest performance. Overall, understanding this parameter is crucial not only for elucidating the adsorption mechanism and kinetics but also for the economical and practical design of adsorption systems, ensuring efficient material use while maintaining high removal efficiency.

3.3. Regeneration

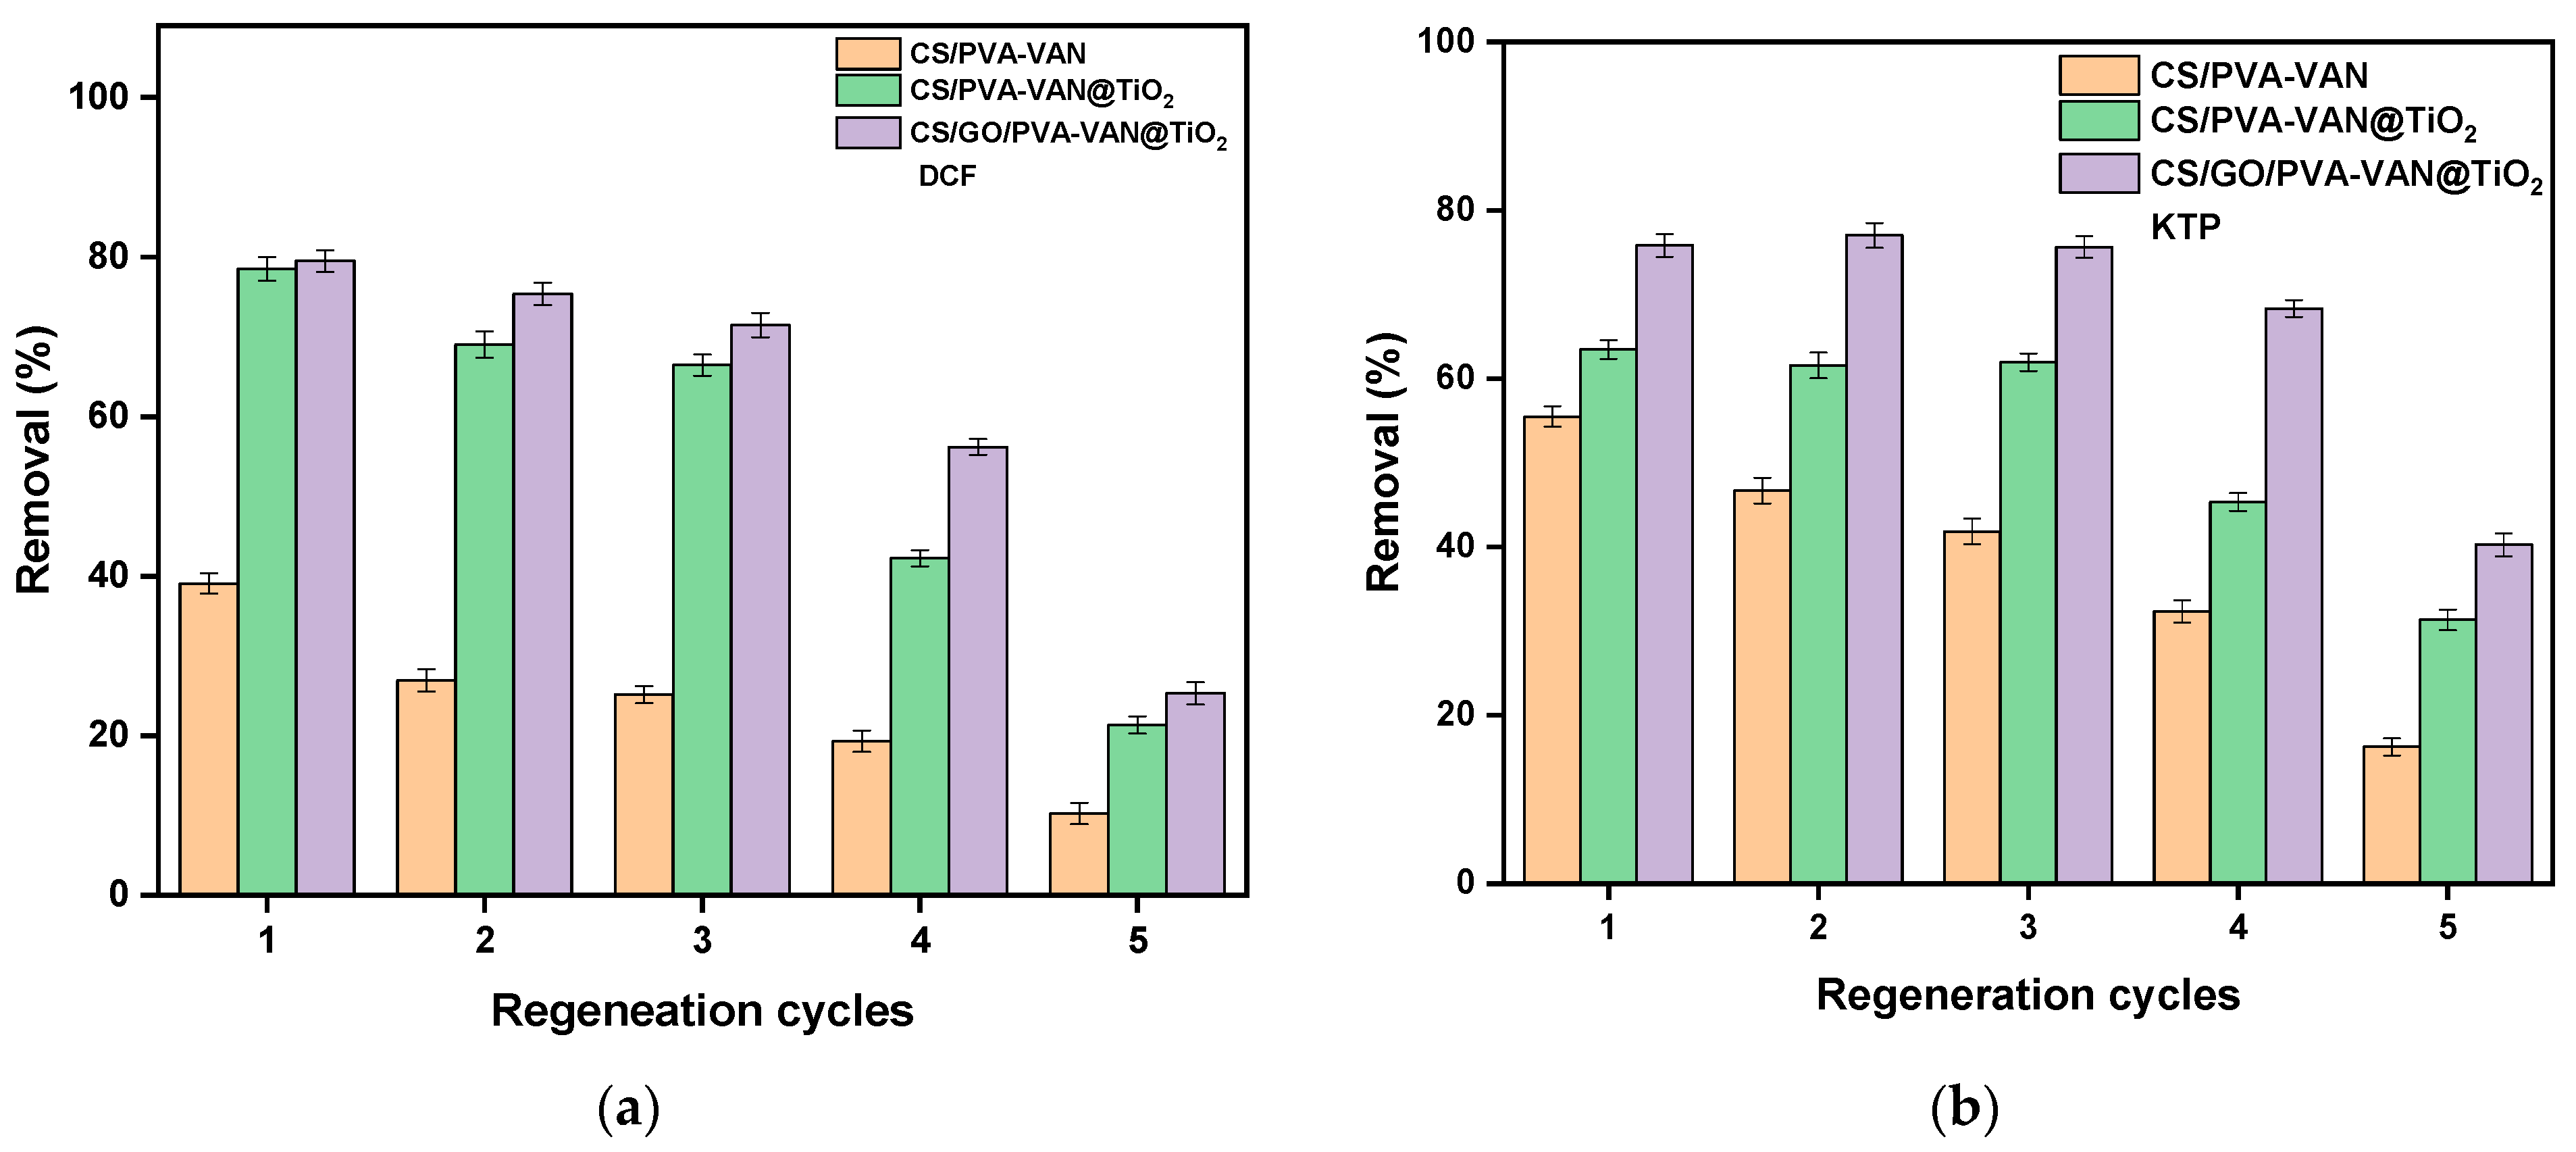
The regeneration ability of adsorbents constitutes a critical parameter in assessing their operational performance and long-term applicability in adsorption processes [80]. Figure 12 presents the regeneration results of the three adsorbent materials, i.e., CS/PVA-VAN, CS/PVA-VAN@TiO2 and CS/GO/PVA-VAN@TiO2 for DCF and KTP removal, after five regeneration cycles.
The reusability of all adsorbents for the removal of DCF and KTP was evaluated through successive adsorption–desorption experiments. During the regeneration process, a 0.01 M NaOH solution was employed to desorb the pharmaceutical compounds from the adsorbent surfaces. According to the literature, regeneration experiments have demonstrated that alkaline conditions are effective in promoting the desorption of pharmaceutical compounds.
In the 1st cycle, CS/GO/PVA-VAN@TiO2 removed 80% of DCF and 78% of KTP respectively. However, after five regeneration cycles the removal percentage for the material decreased to 25% and 40% for DCF and KTP, respectively. Therefore, reduction in the removal efficiency of DCF and KTP after five regeneration cycles is probably due to gradual changes in the structure and surface chemistry of the adsorbent material [81]. However, repeated washing with the alkaline solution during regeneration may cause partial damage or alteration of the active sites responsible for adsorption [82]. In addition, some pharmaceutical molecules may remain strongly attached to the surface through irreversible interactions, blocking access to adsorption sites. As a result, the material becomes less effective with each regeneration cycle. The deactivation of the optimal adsorbent after five regeneration cycles is evidenced by the FTIR spectrum (Figure 13).
The FTIR spectrum obtained after regeneration exhibited a reduction in the intensity of the characteristic peaks, accompanied by minor shifts. These observations suggest pore blockage, leading to a decrease in the adsorption capacity of the material after repeated regeneration cycles [83]. Furthermore, structural alterations were detected, indicating a potential loss of material stability [84].

3.4. Effect of Swelling

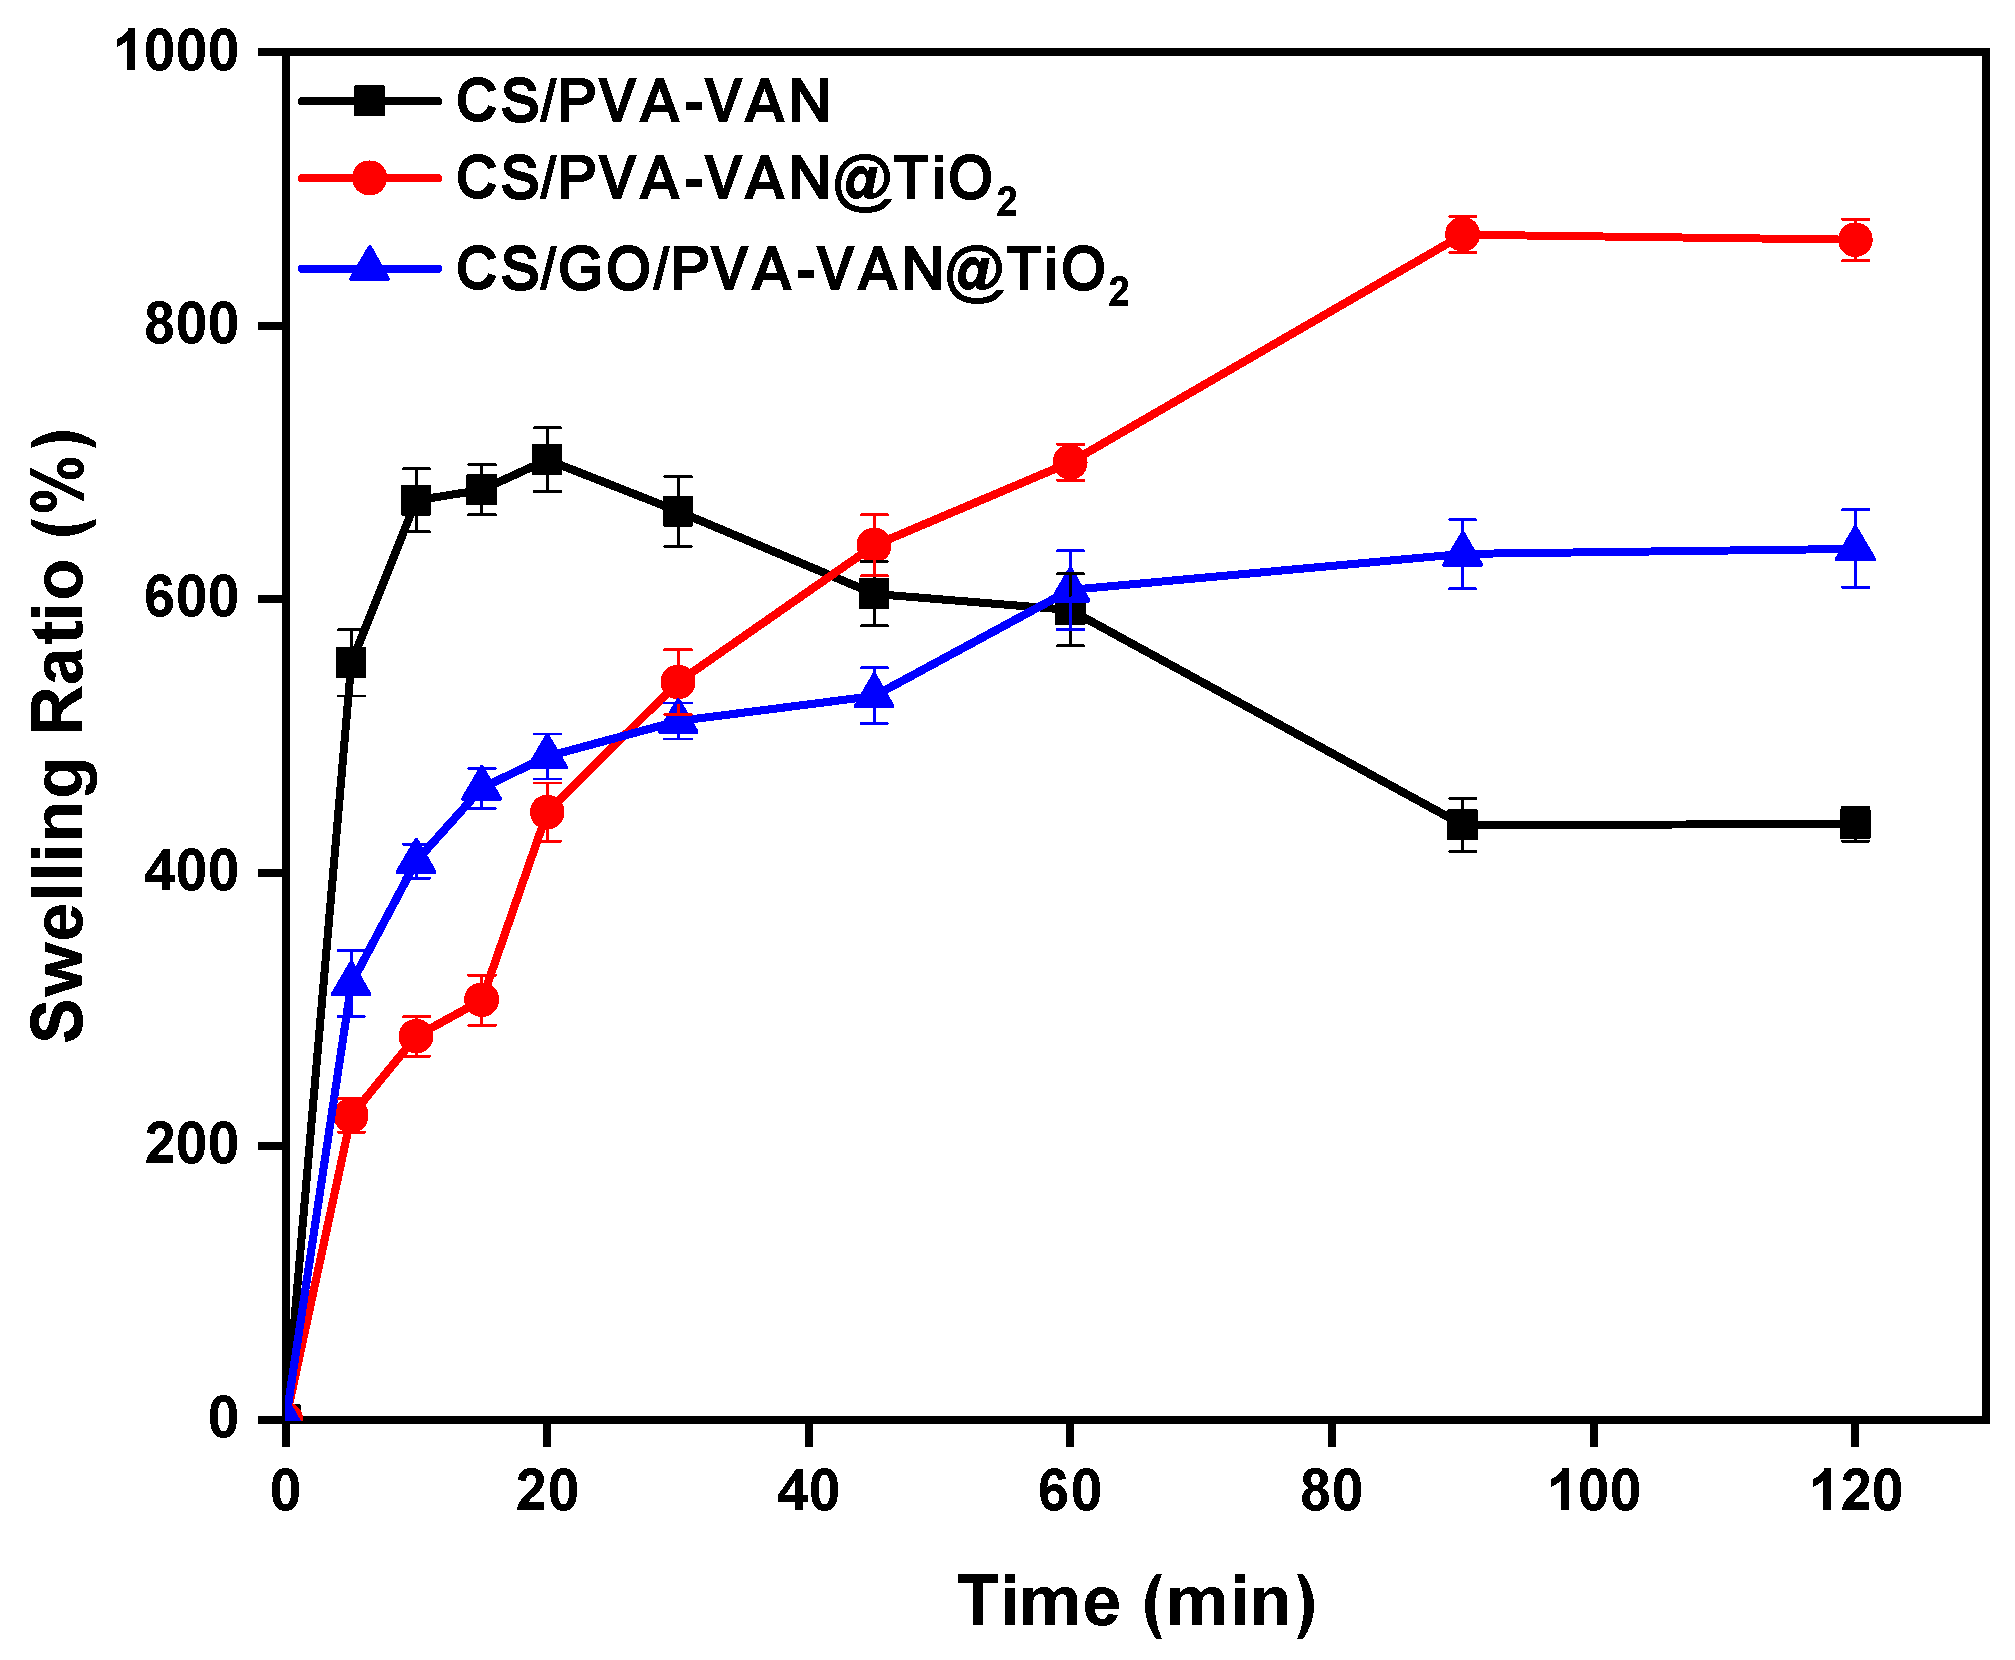
Swelling, in accordance with kinetics, is an essential parameter which combines mass transport and mechanical deformation [85]. Chitosan, vanillin and GO contain various functional groups, such as animo groups and hydroxylic, carboxylic, and epoxy groups, which can be protonated in different pH values. A swelling study allows to understand the amount of water that could be retained inside the chemical structure of the adsorbents. Figure 14 shows the swelling ratio of adsorbents at pH 5.0 during a time interval of 5–120 min.
Initially, the CS/PVA-VAN composite exhibited a rapid increase in its swelling ratio during the first 20 min, indicating intense water absorption. Nevertheless, after this initial phase, the material gradually lost its ability to retain water, probably due to a limited availability of hydrophilic sites and partial disruption of the polymeric network, which led to partial structural degradation. On the other hand, the CS/GO/PVA-VAN@TiO2 composite exhibited a significantly higher swelling ratio compared to CS/PVA-VAN@TiO2 within the time interval of 5 to 60 min. This enhanced water uptake can be attributed to the presence of GO, which contains abundant functional groups capable of forming hydrogen bonds with water molecules [86], thereby promoting stronger intermolecular interactions and increasing the swelling capacity. This finding is significant because CS/GO/PVA-Van@TiO2 can swell and retain water within its structure without disturbing its chemical integrity. In this way, the contact between the pollutants and the pores of the adsorbent increased, thereby enhancing the adsorption process [87]. Following the 60 min measurement, the swelling ratio of CS/GO/PVA-VAN@TiO2 stabilized. This suggests that the incorporation of GO contributed to regulating water uptake and retention, resulting in a more stable and compact chemical structure [88].

3.5. Stability Test

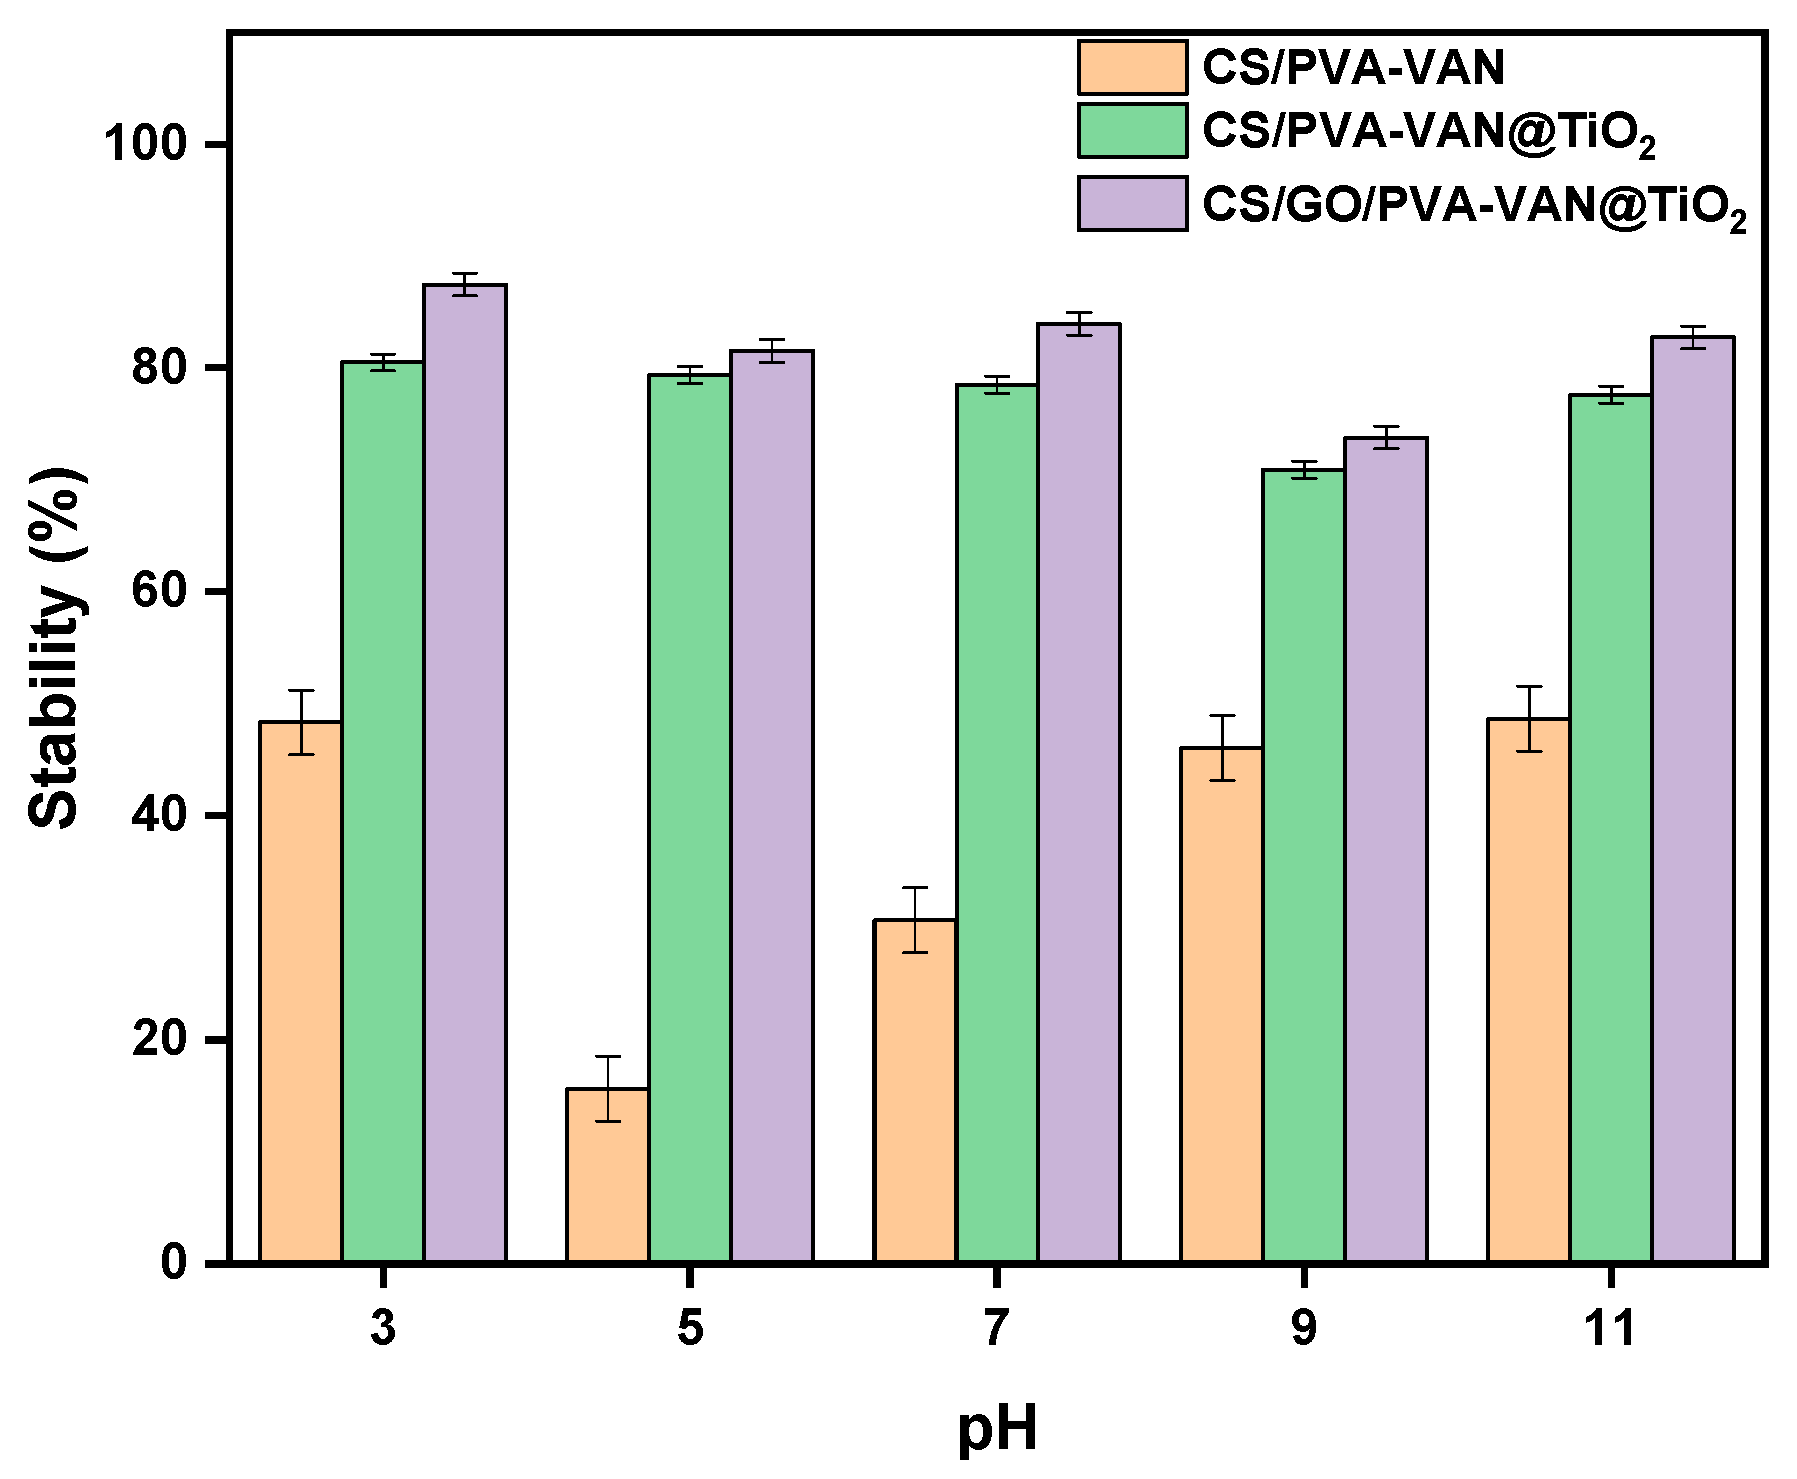
In Figure 15, the results of the stability studies of the new composites at different pH values are presented. Experimental data showed that the CS/GO/PVA-VAN@TiO2 composite presented the highest stability, especially at pH 5.0. The improved stability can be attributed to the incorporation of GO, which contains various useful functional groups that form strong hydrogen bonds and π-π interactions with the polymeric matrix, reinforcing the network and increasing mechanical integrity. Moreover, GO was incorporated into the chemical structure of the polymeric matrix (view 3.1.3) and formed strongly chemical bonds which did not allow the decomposition of material [89]. On the other hand, CS/PVA-VAN and CS/PVA-VAN@TiO2 degraded 30% and 80%, respectively, under experimental conditions in an aquatic solution (pH 3.0–11.0, t = 24 h, T = 303 K), probably due to weaker polymeric interactions and the absence of stabilizing GO. Consequently, the presence of GO strengthens the network through strong hydrogen bonding and electrostatic interactions with the CS and PVA chains, resulting in a dense and highly interconnected polymeric structure that restricts water penetration. In the absence of GO, the network exhibits a lower degree of crosslinking and demonstrates increasing susceptibility to hydrolytic cleavage of the Schiff base bonds. Overall, these findings indicate that GO incorporation not only improves structural integrity but enhances the composite’s suitability for practical applications in wastewater treatment.

3.6. Binary System

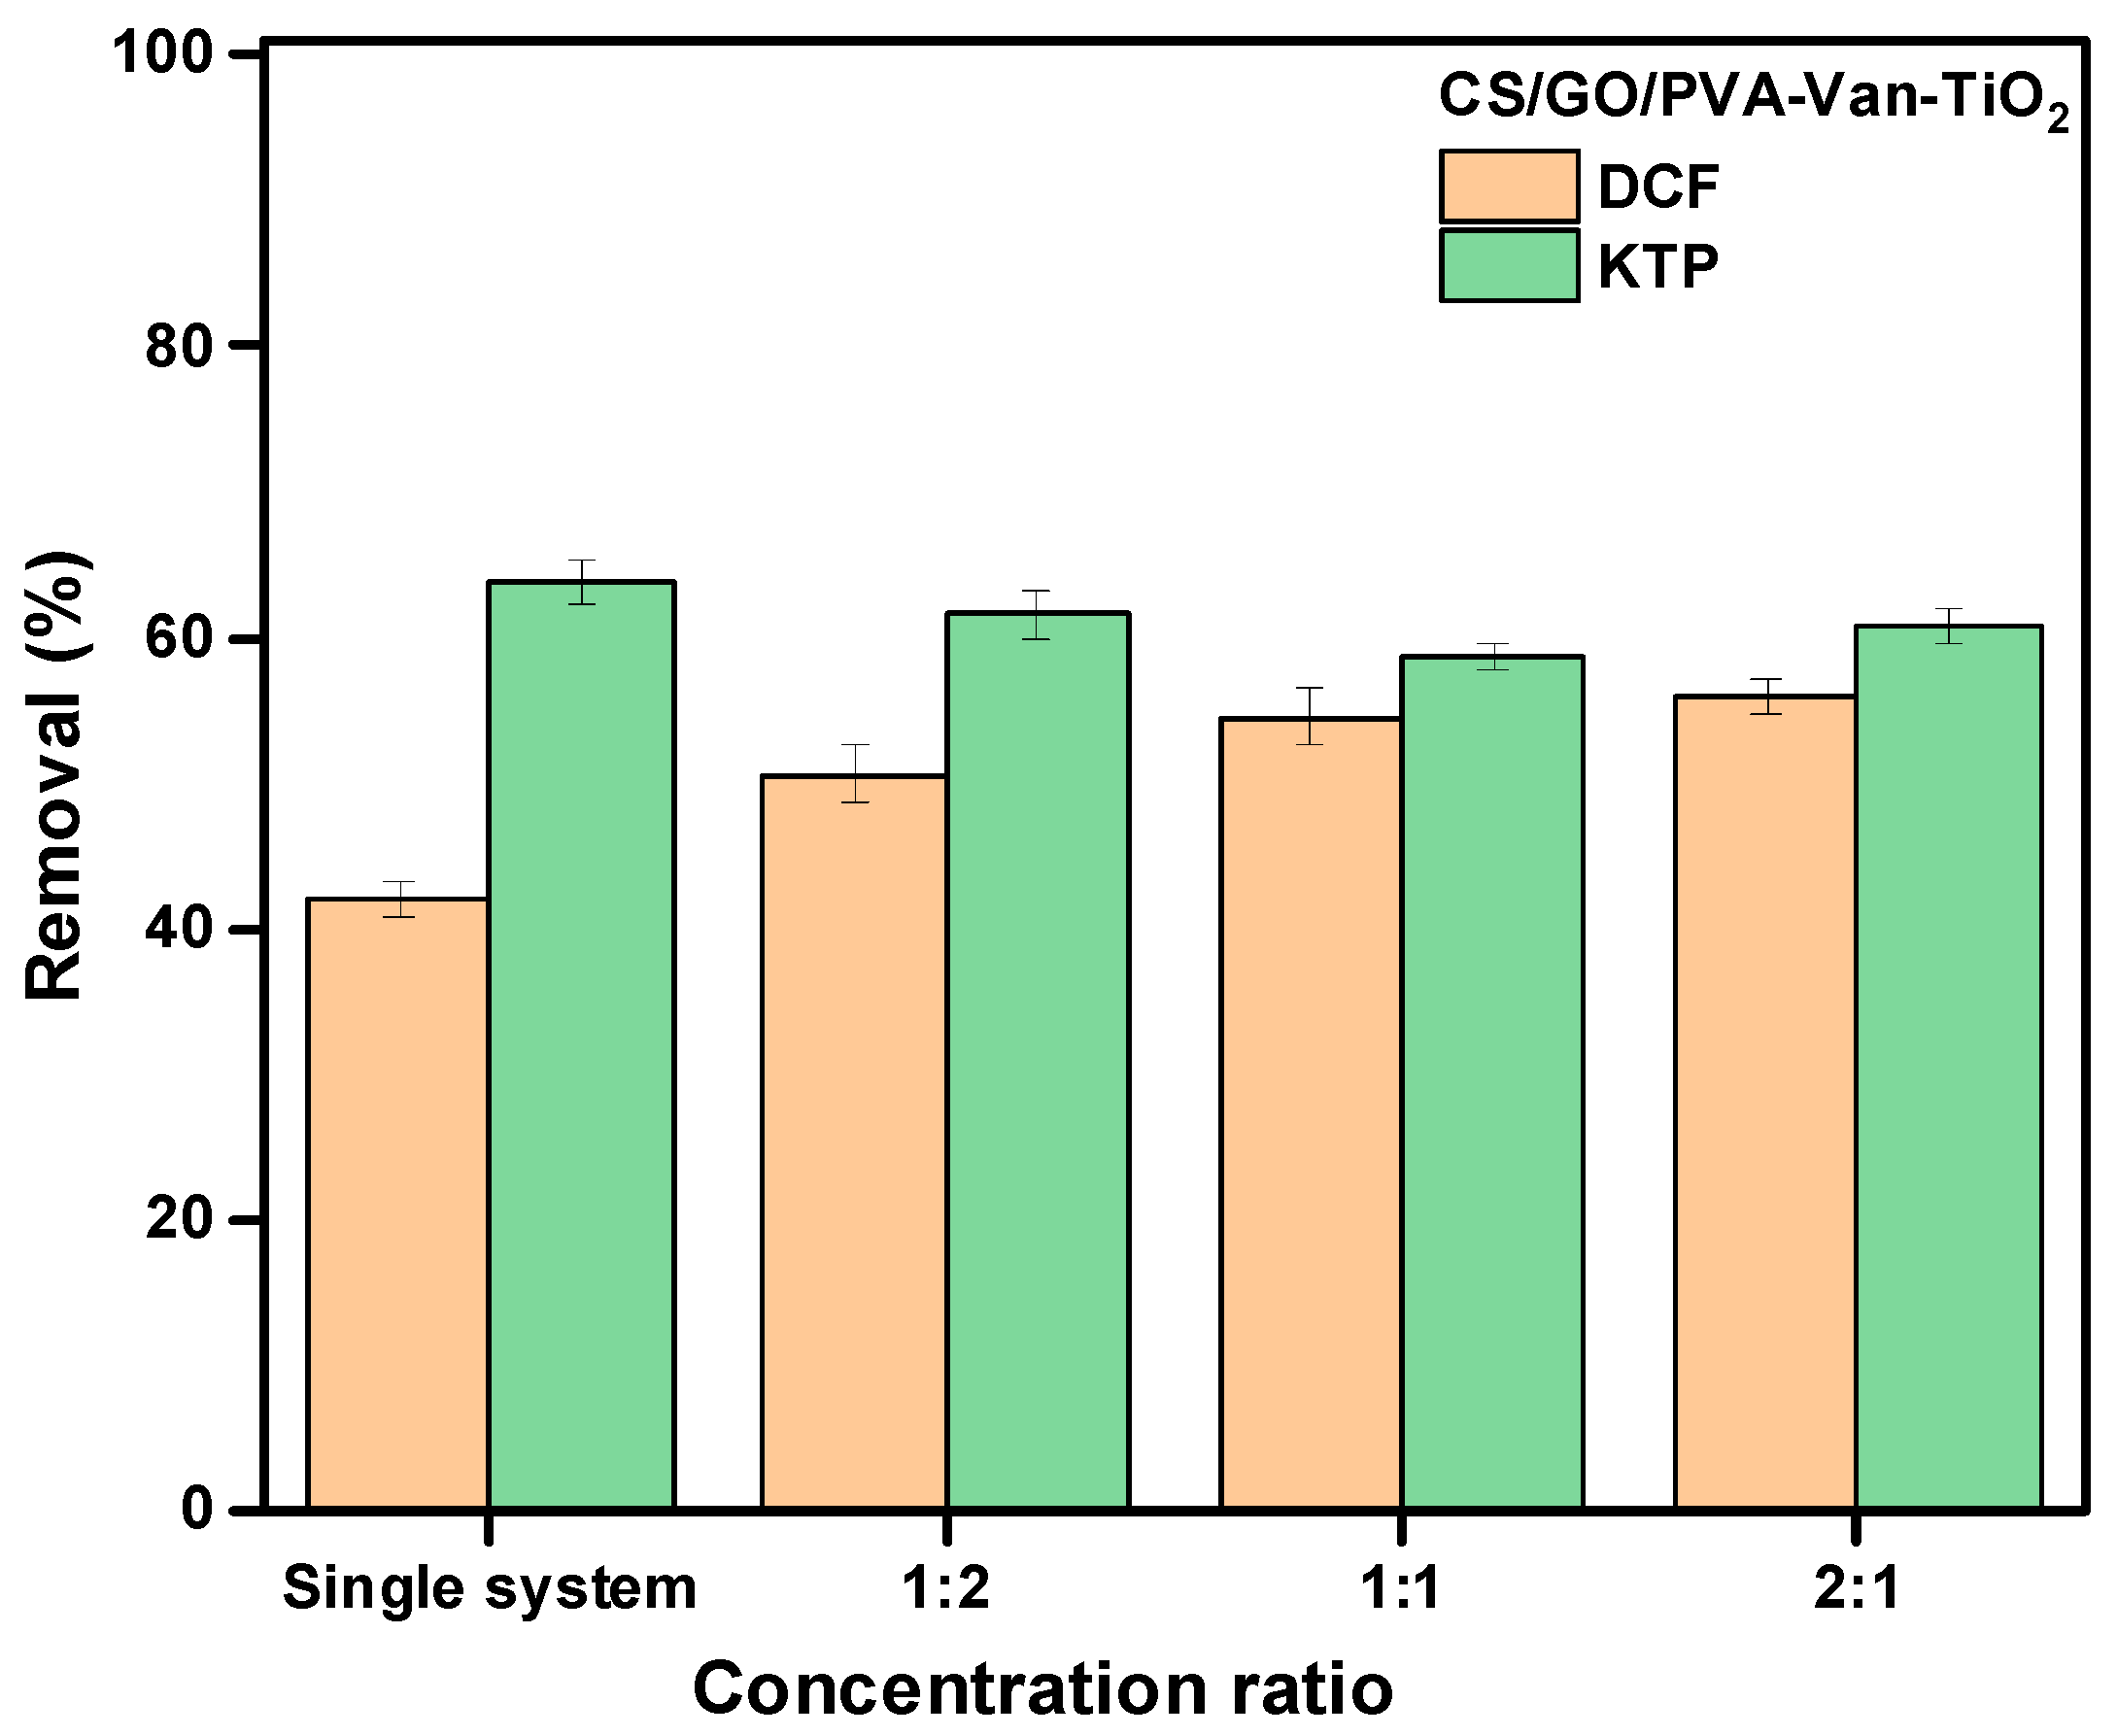
The adsorption process of DCF and KTP was investigated in a binary system at different molar ratios (1:2, 1:1 and 2:1) tο evaluate the interactions between the two compounds. According to the literature, a synergistic effect occurs when the presence of one compound enhances the adsorption of another, whereas a competitive effect arises when the compounds compete for the same adsorption sites on the adsorption surface. As shown in Figure 16, the presence of KTP enhances the adsorption of DCF in all ratios, as reflected by the increased removal efficiency of DCF (R%) from 42% to ≈55%, indicating a synergistic effect. Conversely, KTP adsorption was slightly suppressed in the presence of DCF, with removal efficiency reduced from 63% to 60%.
However, the selectivity coefficient values of 0.80, 0.84 and 0.82 at different concentration ratios (1:2, 1:1 and 2:1, respectively) suggest that the adsorbent exhibited a higher preference for KTP (Table 6). Although both molecules contain aromatic rings and a carboxylic group and therefore may compete for common active sites (e.g., amino and hydroxyl groups of CS and oxygenated groups of GO), differences in their molecular structure and hydrophobicity influence their adsorption behavior. Additionally, KTP, which possesses a benzophenone moiety and a more accessible carbonyl/carboxyl group, can interact more effectively with the polar functional groups of the CS/GO matrix though hydrogen bonding and electrostatic interactions, leading to a slightly higher affinity of the adsorbent for KTP [90]. On the other hand, DCF, which is bulkier and more hydrophobic due to its two chlorinated aromatic rings, is more likely to interact with the graphitic domains of GO via hydrophobic and π-π* interactions [91]. These differences help explain the observed selectivity toward KTP (S < 1), while the presence of KTP may simultaneously facilitate additional adsorption of DCF in binary system (Ri > 1), suggesting a combination of competitive and cooperative adsorption mechanisms. Specially, the synergistic effect can be attributed to a pre-adsorption mechanism, in which KTP (S < 1) initially occupies adsorption sites and modifies the local surface environment, creating more favorable conditions for subsequent DCF uptake (e.g., via π-π* stacking interactions, hydrogen bonding or changes is surface polarity). Similar behavior has been recently reported by Li et al., where pre-adsorption of aromatic compounds in MIL-53 (AI) systems promotes complementary or synergistic co-adsorption via π-π stacking, hydrophobic interactions, and the formation of additional adsorption sites [92]. This supports that the observed behavior cannot explained solely by competitive adsorption, but rather involves a surface “activation” effect induced by the initially adsorbent molecule.

4. Conclusions

In this study, three new composite materials, CS/PVA-VAN, CS/PVA-VAN@TiO2 and CS/GO/PVA-VAN@TiO2, were synthesized to remove DCF and KTP from aquatic solutions. Crosslinking was achieved with GLA and PVA. All new adsorbents are characterized via FTIR, XRD, SEM and BET techniques. According to BET analysis, the surface area of CS/GO/PVA-Van@TiO2 (64.86 m2/g) is approximately double that of CS/PVA-Van. Furthermore, the XRD techniques verify that GO decreases the crystallinity of the composite and it is dispersed inside the polymeric network. Moreover, according to batch experiments, the optimum pH value is 5.0 for both DCF and KTP, while the kinetic data fit better to the PSO kinetic model. Therefore, the isotherm study demonstrates that Freundlich model better describes the adsorption of DCF and KTP by all of the new composites, and the adsorption capacity of CS/GO/PVA-VAN@TiO2 is 114.53 mg/g and 65.20 mg/g for DCF and KTP, respectively. According to the thermodynamic parameters, NSAID adsorption is endothermic and spontaneous for all adsorbents. In addition, the regeneration study demonstrates that the optimum CS/GO/PVA-VAN@TiO2 composite material retains its removal efficiency for up to five consecutive cycles, indicating its satisfactory reusability for the adsorption of DCF and KTP from aqueous solutions. Moreover, the addition of GO to the polymeric matrix enhances its hydrophilicity, stability and mechanical properties, as confirmed by the swelling and stability studies. Finally, in the binary system, KTP is preferentially adsorbed, while its presence simultaneously enhances DCF adsorption, indicating a synergistic effect despite selectivity of KTP.

Author Contributions

Conceptualization, G.Z.K.; methodology, A.D.M., A.K.T. and G.Z.K.; software, A.D.M., A.K.T. and G.Z.K.; validation, A.D.M., A.K.T., S.G.P., R.M.P., D.A.L. and G.Z.K.; formal analysis, A.D.M., A.K.T. and G.Z.K.; investigation, A.D.M., A.K.T. and G.Z.K. resources, A.D.M., A.K.T. and G.Z.K.; data curation, A.D.M., A.K.T., S.G.P., R.M.P., D.A.L. and G.Z.K.; writing—original draft preparation, A.D.M., A.K.T., S.G.P., R.M.P., D.A.L. and G.Z.K.; writing—review and editing, A.D.M., A.K.T., S.G.P., R.M.P., D.A.L. and G.Z.K.; visualization, A.D.M., A.K.T., and G.Z.K.; supervision, A.K.T. and G.Z.K. All authors have read and agreed to the published version of the manuscript.

Funding

This research received no external funding.

Data Availability Statement

The data will be made available on request.

Acknowledgments

We acknowledge support of this work by the project “Advanced Nanostructured Materials for Sustainable Growth: Green Energy Production/Storage, Energy Saving and Environmental Remediation” (TAEDR-0535821), which is implemented under the action “Flagship actions in interdisciplinary scientific fields with a special focus on the productive fabric” (ID 16618), Greece 2.0—National Recovery and Resilience Fund and funded by European Union NextGenerationEU.

Conflicts of Interest

The authors declare no conflicts of interest.

References

  1. Halvey, E.J.; Haslam, N.; Mariano, E.R. Non-Steroidal Anti-Inflammatory Drugs in the Perioperative Period. BJA Educ. 2023, 23, 440–447. [Google Scholar] [CrossRef] [Scilit]
  2. Zhao, H.; Huang, S.; Huang, S.; Liu, F.; Shao, W.; Mei, K.; Ma, J.; Jiang, Y.; Wan, J.; Zhu, W.; et al. Prevalence of NSAID Use among People with COVID-19 and the Association with COVID-19-related Outcomes: Systematic Review and Meta-analysis. Br. J. Clin. Pharmacol. 2022, 88, 5113–5127. [Google Scholar] [CrossRef] [Scilit]
  3. S, D.L.; B, V.G.; Murali, V. From Prescription to Pollution: The Ecological Consequences of NSAIDs in Aquatic Ecosystems. Toxicol. Rep. 2024, 13, 101775. [Google Scholar] [CrossRef] [Scilit]
  4. Tyumina, E.; Subbotina, M.; Polygalov, M.; Tyan, S.; Ivshina, I. Ketoprofen as an Emerging Contaminant: Occurrence, Ecotoxicity and (Bio)Removal. Front. Microbiol. 2023, 14, 1200108. [Google Scholar] [CrossRef] [Scilit]
  5. Tomar, D.R.; Mehrotra, K.; Bhattacharya, B.; Saxena, A.; Jayakumar, V. Synthesis and Characterization of Novel Diclofenac (DCF) Derivatives. Macromol. Symp. 2023, 407, 2100476. [Google Scholar] [CrossRef] [Scilit]
  6. Badawy, A.S.; Xu, Y.; Ren, H.; Lu, Z. Diclofenac (DCF) as an Emerging Pollutant: Occurrence, Ecotoxicity, and Biodegradation Strategies. Ecotoxicol. Environ. Saf. 2025, 302, 118618. [Google Scholar] [CrossRef] [Scilit] [PubMed]
  7. Tsurushima, M.; Kurosawa, Y.; Goto, S. Propionic Acid Groups and Multiple Aromatic Rings Induce Binding of Ketoprofen and Naproxen to the Hydrophobic Core of Bovine Serum Albumin. Mol. Pharm. 2023, 20, 3549–3558. [Google Scholar] [CrossRef] [Scilit]
  8. Tsoupras, A.; Gkika, D.A.; Siadimas, I.; Christodoulopoulos, I.; Efthymiopoulos, P.; Kyzas, G.Z. The Multifaceted Effects of Non-Steroidal and Non-Opioid Anti-Inflammatory and Analgesic Drugs on Platelets: Current Knowledge, Limitations, and Future Perspectives. Pharmaceuticals 2024, 17, 627. [Google Scholar] [CrossRef] [Scilit]
  9. Wojcieszyńska, D.; Guzik, H.; Guzik, U. Non-Steroidal Anti-Inflammatory Drugs in the Era of the COVID-19 Pandemic in the Context of the Human and the Environment. Sci. Total Environ. 2022, 834, 155317. [Google Scholar] [CrossRef] [Scilit] [PubMed]
  10. El-harty, M.S.; Elkomy, A.S.; Shehata, N. Conventional Physical and Chemical Treatment Technologies and Economic Implications. In Wastewater to Resource Recovery; Mungray, A.K., Mungray, A.A., Arkatkar, A., Abdelkareem, M.A., Eds.; Wiley: Hoboken, NJ, USA, 2025; pp. 119–144. ISBN 978-1-394-27428-4. [Google Scholar]
  11. Mpongwana, N.; Rathilal, S. A Review of the Techno-Economic Feasibility of Nanoparticle Application for Wastewater Treatment. Water 2022, 14, 1550. [Google Scholar] [CrossRef] [Scilit]
  12. El-Araby, A.; Janati, W.; Ullah, R.; Ercisli, S.; Errachidi, F. Chitosan, Chitosan Derivatives, and Chitosan-Based Nanocomposites: Eco-Friendly Materials for Advanced Applications (a Review). Front. Chem. 2024, 11, 1327426. [Google Scholar] [CrossRef] [Scilit]
  13. Jiang, H.-L.; Xing, L.; Luo, C.-Q.; Zhou, T.-J.; Li, H.-S.; Cho, C.-S. Chemical Modification of Chitosan as a Gene Transporter. Curr. Org. Chem. 2018, 22, 668–689. [Google Scholar] [CrossRef] [Scilit]
  14. Correa, R.F.; Colucci, G.; Halla, N.; Pinto, J.A.; Santamaria-Echart, A.; Blanco, S.P.; Fernandes, I.P.; Barreiro, M.F. Development of Chitosan Microspheres through a Green Dual Crosslinking Strategy Based on Tripolyphosphate and Vanillin. Molecules 2021, 26, 2325. [Google Scholar] [CrossRef] [Scilit]
  15. Abdulhameed, A.S.; Abdullah, S.; Altamimi, A.A.; Abualhaija, M.; Algburi, S. Development of a Schiff Base-Chitosan-Vanillin/Hydroxyapatite Composite for Effective Brilliant Green Dye Removal: Characterization, Adsorption Modeling, and Cost Analysis. Int. J. Biol. Macromol. 2025, 310, 143140. [Google Scholar] [CrossRef] [Scilit]
  16. Wang, X.; Caruso, R.A. Enhancing Photocatalytic Activity of Titania Materials by Using Porous Structures and the Addition of Gold Nanoparticles. J. Mater. Chem. 2011, 21, 20–28. [Google Scholar] [CrossRef] [Scilit]
  17. Zatalini, D.F.; Hendradi, E.; Drake, P.; Sari, R. The Effect of Chitosan and Polyvinyl Alcohol Combination on Physical Characteristics and Mechanical Properties of Chitosan-PVA-Aloe Vera Film. JFIKI 2023, 10, 151–161. [Google Scholar] [CrossRef] [Scilit]
  18. El-Aziz, M.E.A.; Youssef, A.M.; Kamal, K.H.; Kelnar, I.; Kamel, S. Preparation and Performance of Bionanocomposites Based on Grafted Chitosan, GO and TiO2-NPs for Removal of Lead Ions and Basic-Red 46. Carbohydr. Polym. 2023, 305, 120571. [Google Scholar] [CrossRef] [Scilit]
  19. Aricov, L.; Leontieș, A.R. Adsorption of Bisphenol A from Water Using Chitosan-Based Gels. Gels 2025, 11, 180. [Google Scholar] [CrossRef] [Scilit] [PubMed]
  20. Marcano, D.C.; Kosynkin, D.V.; Berlin, J.M.; Sinitskii, A.; Sun, Z.; Slesarev, A.; Alemany, L.B.; Lu, W.; Tour, J.M. Improved Synthesis of Graphene Oxide. ACS Nano 2010, 4, 4806–4814. [Google Scholar] [CrossRef] [Scilit] [PubMed]
  21. Chen, J.; Ouyang, J.; Lai, W.; Xing, X.; Zhou, L.; Liu, Z.; Chen, W.; Cai, D. Synthesis of Ultralight Chitosan/Activated Biochar Composite Aerogel Globules for Ketoprofen Removal from Aqueous Solution. Sep. Purif. Technol. 2021, 279, 119700. [Google Scholar] [CrossRef] [Scilit]
  22. Ariesta, A.S.; Handayani, N.; Maniar, D.; Zulfikar, M.A.; Patah, A. Ketoprofen Adsorption on the Microporous Metal–Organic Framework MOF-303 for Water Decontamination. Microporous Mesoporous Mater. 2026, 114142. [Google Scholar] [CrossRef] [Scilit]
  23. Cumming, G.; Finch, S. Inference by Eye: Confidence Intervals and How to Read Pictures of Data. Am. Psychol. 2005, 60, 170–180. [Google Scholar] [CrossRef] [Scilit]
  24. Langmuir, I. The Evaporation, Condensation and Reflection of Molecules and the Mechanism of Adsorption. Phys. Rev. 1916, 8, 149–176. [Google Scholar] [CrossRef] [Scilit]
  25. Freundlich, H. Über Die Adsorption in Lösungen. Z. Für Phys. Chem. 1907, 57U, 385–470. [Google Scholar] [CrossRef] [Scilit]
  26. Swenson, H.; Stadie, N.P. Langmuir’s Theory of Adsorption: A Centennial Review. Langmuir 2019, 35, 5409–5426. [Google Scholar] [CrossRef] [Scilit]
  27. Danat, B.T.; Wuana, R.A.; Chahul, H.F.; Iorungwa, M.S. Review of Adsorption Isotherms Models. Appl. Water Sci. 2026, 16, 72. [Google Scholar] [CrossRef] [Scilit]
  28. Ho, Y.S.; McKay, G. Pseudo-Second Order Model for Sorption Processes. Process Biochem. 1999, 34, 451–465. [Google Scholar] [CrossRef] [Scilit]
  29. Ho, Y.S.; Porter, J.F.; McKay, G. Equilibrium Isotherm Studies for the Sorption of Divalent Metal Ions onto Peat: Copper, Nickel and Lead Single Component Systems. Water. Air. Soil Pollut. 2002, 141, 1–33. [Google Scholar] [CrossRef] [Scilit]
  30. Lagergren, S. Zur Theorie Der Sogenannten Adsorption Gelöster Stoffe. K. Sven. Vetenskapsakademiens Handl. 1898, 24, 1–39. [Google Scholar]
  31. Ng, K.C.; Burhan, M.; Shahzad, M.W.; Ismail, A.B. A Universal Isotherm Model to Capture Adsorption Uptake and Energy Distribution of Porous Heterogeneous Surface. Sci. Rep. 2017, 7, 10634. [Google Scholar] [CrossRef] [Scilit] [PubMed]
  32. Weber, W.J.; Morris, J.C. Kinetics of Adsorption on Carbon from Solution. J. Sanit. Eng. Div. 1963, 89, 31–59. [Google Scholar] [CrossRef] [Scilit]
  33. Wu, F.-C.; Tseng, R.-L.; Juang, R.-S. Initial Behavior of Intraparticle Diffusion Model Used in the Description of Adsorption Kinetics. Chem. Eng. J. 2009, 153, 1–8. [Google Scholar] [CrossRef] [Scilit]
  34. Crispi, S.; Filice, S.; Scuderi, V.; Zimbone, M.; Iannazzo, D.; Celesti, C.; Scalese, S. Kinetic and Isotherm Studies of Organic and Inorganic Anions Adsorption from Water by Quaternized Pentablock Copolymeric Film (PTBr). Polymers 2025, 17, 1624. [Google Scholar] [CrossRef] [Scilit]
  35. Gibbs, J.W.; Tyndall, J.; Connecticut Academy of Arts and Sciences; Burndy Library. On the Equilibrium of Heterogeneous Substances: First [-Second] Part; Academy: New Haven, CT, USA, 1874. [Google Scholar]
  36. Rahman, N.; Haseen, U. Equilibrium Modeling, Kinetic, and Thermodynamic Studies on Adsorption of Pb(II) by a Hybrid Inorganic–Organic Material: Polyacrylamide Zirconium(IV) Iodate. Ind. Eng. Chem. Res. 2014, 53, 8198–8207. [Google Scholar] [CrossRef] [Scilit]
  37. Gkika, D.A.; Tolkou, A.K.; Katsoyiannis, I.A.; Kyzas, G.Z. The Adsorption-Desorption-Regeneration Pathway to a Circular Economy: The Role of Waste-Derived Adsorbents on Chromium Removal. Sep. Purif. Technol. 2025, 368, 132996. [Google Scholar] [CrossRef] [Scilit]
  38. Bayuo, J.; Rwiza, M.J.; Choi, J.W.; Mtei, K.M.; Hosseini-Bandegharaei, A.; Sillanpää, M. Adsorption and Desorption Processes of Toxic Heavy Metals, Regeneration and Reusability of Spent Adsorbents: Economic and Environmental Sustainability Approach. Adv. Colloid Interface Sci. 2024, 329, 103196. [Google Scholar] [CrossRef] [Scilit]
  39. Zhang, L.G.; Im, O.; Li, J.; Keidar, M. Biomimetic Three-Dimensional Nanocrystalline Hydroxyapatite and Magnetically Synthesized Single-Walled Carbon Nanotube Chitosan Nanocomposite for Bone Regeneration. Int. J. Nanomed. 2012, 7, 2087. [Google Scholar] [CrossRef] [Scilit] [PubMed]
  40. Xu, H.; Yang, X.; Xie, L.; Hakkarainen, M. Conformational Footprint in Hydrolysis-Induced Nanofibrillation and Crystallization of Poly(Lactic Acid). Biomacromolecules 2016, 17, 985–995. [Google Scholar] [CrossRef] [Scilit] [PubMed]
  41. Schneider, S.; Wendinger, E.; Baran, V.; Hatz, A.; Lotsch, B.V.; Nentwig, M.; Oeckler, O.; Bräuniger, T.; Schnick, W. Comprehensive Investigation of Anion Species in Crystalline Li+ Ion Conductor Li27−x[P4O7+xN9−x]O3 (x ≈ 1.9(3)). Chem. A Eur. J 2023, 29, e202300174. [Google Scholar] [CrossRef] [Scilit]
  42. Adar, F. Interpretation of Raman Spectrum of Proteins. Spectroscopy 2022, 37, 9–13. [Google Scholar] [CrossRef] [Scilit]
  43. Nabedryk, E.; Andrianambinintsoa, S.; Dejonghe, D.; Breton, J. FTIR Spectroscopy of the Photoreduction of the Bacteriopheophytin Electron Acceptor in Reaction Centers of Rb. Sphaeroides and Rps. Viridis. Chem. Phys. 1995, 194, 371–378. [Google Scholar] [CrossRef] [Scilit]
  44. Zhao, X.; Zhu, H.; Chen, J.; Ao, Q. FTIR, XRD and SEM Analysis of Ginger Powders with Different Size: Structure Characteristic of Ginger Powders. J. Food Process. Preserv. 2015, 39, 2017–2026. [Google Scholar] [CrossRef] [Scilit]
  45. Demina, T.S.; Kuryanova, A.S.; Aksenova, N.A.; Shubnyy, A.G.; Popyrina, T.N.; Sokovikov, Y.V.; Istranova, E.V.; Ivanov, P.L.; Timashev, P.S.; Akopova, T.A. Chitosan-g-Oligo/Polylactide Copolymer Non-Woven Fibrous Mats Containing Protein: From Solid-State Synthesis to Electrospinning. RSC Adv. 2019, 9, 37652–37659. [Google Scholar] [CrossRef] [Scilit] [PubMed]
  46. Ovchinnikov, O.V.; Evtukhova, A.V.; Kondratenko, T.S.; Smirnov, M.S.; Khokhlov, V.Y.; Erina, O.V. Manifestation of Intermolecular Interactions in FTIR Spectra of Methylene Blue Molecules. Vib. Spectrosc. 2016, 86, 181–189. [Google Scholar] [CrossRef] [Scilit]
  47. Amarasinghe, P.M.; Katti, K.S.; Katti, D.R. Nature of Organic Fluid–Montmorillonite Interactions: An FTIR Spectroscopic Study. J. Colloid Interface Sci. 2009, 337, 97–105. [Google Scholar] [CrossRef] [Scilit] [PubMed]
  48. Xu, C.; Zhan, W.; Tang, X.; Mo, F.; Fu, L.; Lin, B. Self-Healing Chitosan/Vanillin Hydrogels Based on Schiff-Base Bond/Hydrogen Bond Hybrid Linkages. Polym. Test. 2018, 66, 155–163. [Google Scholar] [CrossRef] [Scilit]
  49. Wang, F.C.; Feve, M.; Lam, T.M.; Pascault, J. FTIR Analysis of Hydrogen Bonding in Amorphous Linear Aromatic Polyurethanes. I. Influence of Temperature. J. Polym. Sci. Part B Polym. Phys. 1994, 32, 1305–1313. [Google Scholar] [CrossRef] [Scilit]
  50. Szafran, M.; Katrusiak, A.; Dega-Szafran, Z. Hydrogen Bonds and Electrostatic Interactions in 1:1 and 2:1 Complexes of Homarine with Mineral Acids Studied by NMR, FTIR, DFT and X-Ray Diffraction. J. Mol. Struct. 2007, 827, 56–66. [Google Scholar] [CrossRef] [Scilit]
  51. Mitani, E.; Ozaki, Y.; Sato, H. Two Types of C O⋯HO Hydrogen Bonds and OH⋯OH (Dimer, Trimer, Oligomer) Hydrogen Bonds in PVA with 88% Saponification/PMMA and PVA with 99% Saponification/PMMA Blends and Their Thermal Behavior Studied by Infrared Spectroscopy. Polymer 2022, 246, 124725. [Google Scholar] [CrossRef] [Scilit]
  52. Hu, X.; Li, Z.; Ge, Y.; Liu, S.; Shi, C. Enhanced π − π Stacks of Aromatic Ring-Rich Polymer Adsorbent for the Rapid Adsorption of Organic Dyes. Colloids Surf. Physicochem. Eng. Asp. 2022, 643, 128782. [Google Scholar] [CrossRef] [Scilit]
  53. Niu, S.; Li, C.; Gao, S.; Tian, J.; Zhang, C.; Li, L.; Huang, Y.; Lyu, H. Biochar, Microbes, and Biochar-Microbe Synergistic Treatment of Chlorinated Hydrocarbons in Groundwater: A Review. Front. Microbiol. 2024, 15, 1443682. [Google Scholar] [CrossRef] [Scilit]
  54. Hou, X.; Chen, J.; Chen, Z.; Yu, D.; Zhu, S.; Liu, T.; Chen, L. Flexible Aerogel Materials: A Review on Revolutionary Flexibility Strategies and the Multifunctional Applications. ACS Nano 2024, 18, 11525–11559. [Google Scholar] [CrossRef] [Scilit]
  55. Kim, H.; Kim, M.G.; Cho, J. Unique Structural Changes of Three-Dimensionally Ordered Macroporous TiO2 Electrode Materials During Electrochemical Cycling. Adv. Energy Mater. 2012, 2, 1425–1432. [Google Scholar] [CrossRef] [Scilit]
  56. Rajaura, R.S.; Srivastava, S.; Sharma, V.; Sharma, P.K.; Lal, C.; Singh, M.; Palsania, H.S.; Vijay, Y.K. Role of Interlayer Spacing and Functional Group on the Hydrogen Storage Properties of Graphene Oxide and Reduced Graphene Oxide. Int. J. Hydrogen Energy 2016, 41, 9454–9461. [Google Scholar] [CrossRef] [Scilit]
  57. Yan, H.; Wu, H.; Li, K.; Wang, Y.; Tao, X.; Yang, H.; Li, A.; Cheng, R. Influence of the Surface Structure of Graphene Oxide on the Adsorption of Aromatic Organic Compounds from Water. ACS Appl. Mater. Interfaces 2015, 7, 6690–6697. [Google Scholar] [CrossRef] [Scilit] [PubMed]
  58. Govindaraj, P.; Sokolova, A.; Salim, N.; Juodkazis, S.; Fuss, F.K.; Fox, B.; Hameed, N. Distribution States of Graphene in Polymer Nanocomposites: A Review. Compos. Part B Eng. 2021, 226, 109353. [Google Scholar] [CrossRef] [Scilit]
  59. Das, M.; Fatma, K.; Das, B.; Kundu, C.N.; Yadav, M.; Tripathy, J. TiO2/Graphene Oxide-Filled Carboxymethyl Cellulose/Chitosan Blend Films. Mater. Chem. Phys. 2025, 332, 130233. [Google Scholar] [CrossRef] [Scilit]
  60. Milewska-Duda, J.; Duda, J.T.; Jodłowski, G.; Kwiatkowski, M. A Model for Multilayer Adsorption of Small Molecules in Microporous Materials. Langmuir 2000, 16, 7294–7303. [Google Scholar] [CrossRef] [Scilit]
  61. Prokešová-Fojtíková, P.; Mintova, S.; Čejka, J.; Žilková, N.; Zukal, A. Porosity of Micro/Mesoporous Composites. Microporous Mesoporous Mater. 2006, 92, 154–160. [Google Scholar] [CrossRef] [Scilit]
  62. Wang, M.; Duan, X.; Xu, Y.; Duan, X. Functional Three-Dimensional Graphene/Polymer Composites. ACS Nano 2016, 10, 7231–7247. [Google Scholar] [CrossRef] [Scilit]
  63. Dehghani, M.H.; Ahmadi, S.; Ghosh, S.; Othmani, A.; Osagie, C.; Meskini, M.; AlKafaas, S.S.; Malloum, A.; Khanday, W.A.; Jacob, A.O.; et al. Recent Advances on Sustainable Adsorbents for the Remediation of Noxious Pollutants from Water and Wastewater: A Critical Review. Arab. J. Chem. 2023, 16, 105303. [Google Scholar] [CrossRef] [Scilit]
  64. De Oliveira, T.; Guégan, R.; Thiebault, T.; Milbeau, C.L.; Muller, F.; Teixeira, V.; Giovanela, M.; Boussafir, M. Adsorption of Diclofenac onto Organoclays: Effects of Surfactant and Environmental (pH and Temperature) Conditions. J. Hazard. Mater. 2017, 323, 558–566. [Google Scholar] [CrossRef] [Scilit]
  65. Sheng, J.J.; Kasim, N.A.; Chandrasekharan, R.; Amidon, G.L. Solubilization and Dissolution of Insoluble Weak Acid, Ketoprofen: Effects of pH Combined with Surfactant. Eur. J. Pharm. Sci. 2006, 29, 306–314. [Google Scholar] [CrossRef] [Scilit]
  66. Kim, S.-H.; Kim, T.-K.; Shin, G.-S.; Lee, K.-W.; Shin, H.-D.; Lee, Y.-H. Enantioselective Hydrolysis of Insoluble (R,S)-Ketoprofen Ethyl Ester in Dispersed Aqueous Reaction System Induced by Chiral Cyclodextrin. Biotechnol. Lett. 2004, 26, 965–969. [Google Scholar] [CrossRef] [Scilit] [PubMed]
  67. Rivera-Utrilla, J.; Bautista-Toledo, I.; Ferro-García, M.A.; Moreno-Castilla, C. Activated Carbon Surface Modifications by Adsorption of Bacteria and Their Effect on Aqueous Lead Adsorption. J. Chem. Technol. Biotechnol. 2001, 76, 1209–1215. [Google Scholar] [CrossRef] [Scilit]
  68. Órfão, J.J.M.; Silva, A.I.M.; Pereira, J.C.V.; Barata, S.A.; Fonseca, I.M.; Faria, P.C.C.; Pereira, M.F.R. Adsorption of a Reactive Dye on Chemically Modified Activated Carbons—Influence of pH. J. Colloid Interface Sci. 2006, 296, 480–489. [Google Scholar] [CrossRef] [Scilit] [PubMed]
  69. Chen, D.; Feng, H.; Li, J. Graphene Oxide: Preparation, Functionalization, and Electrochemical Applications. Chem. Rev. 2012, 112, 6027–6053. [Google Scholar] [CrossRef] [Scilit]
  70. Peng, B.; Chen, L.; Que, C.; Yang, K.; Deng, F.; Deng, X.; Shi, G.; Xu, G.; Wu, M. Adsorption of Antibiotics on Graphene and Biochar in Aqueous Solutions Induced by π-π Interactions. Sci. Rep. 2016, 6, 31920. [Google Scholar] [CrossRef] [Scilit]
  71. Wazzan, N. Adsorption of Non-Steroidal Anti-Inflammatory Drugs (NSAIDs) on Nanographene Surface: Density Functional Theory Study. Arab. J. Chem. 2021, 14, 103002. [Google Scholar] [CrossRef] [Scilit]
  72. Agboola, O.D.; Benson, N.U. Physisorption and Chemisorption Mechanisms Influencing Micro (Nano) Plastics-Organic Chemical Contaminants Interactions: A Review. Front. Environ. Sci. 2021, 9, 678574. [Google Scholar] [CrossRef] [Scilit]
  73. Dharmarathna, S.P.; Priyantha, N. Investigation of Boundary Layer Effect of Intra-Particle Diffusion on Methylene Blue Adsorption on Activated Carbon. Energy Nexus 2024, 14, 100294. [Google Scholar] [CrossRef] [Scilit]
  74. Kalam, S.; Abu-Khamsin, S.A.; Kamal, M.S.; Patil, S. Surfactant Adsorption Isotherms: A Review. ACS Omega 2021, 6, 32342–32348. [Google Scholar] [CrossRef] [Scilit]
  75. Desta, M.B. Batch Sorption Experiments: Langmuir and Freundlich Isotherm Studies for the Adsorption of Textile Metal Ions onto Teff Straw (Eragrostis tef) Agricultural Waste. J. Thermodyn. 2013, 2013, 375830. [Google Scholar] [CrossRef] [Scilit]
  76. Fan, T.; Liu, Y.; Feng, B.; Zeng, G.; Yang, C.; Zhou, M.; Zhou, H.; Tan, Z.; Wang, X. Biosorption of Cadmium(II), Zinc(II) and Lead(II) by Penicillium Simplicissimum: Isotherms, Kinetics and Thermodynamics. J. Hazard. Mater. 2008, 160, 655–661. [Google Scholar] [CrossRef] [Scilit]
  77. Sharma, G.; Sharma, S.; Kumar, A.; Lai, C.W.; Naushad, M.; Shehnaz; Iqbal, J.; Stadler, F.J. Activated Carbon as Superadsorbent and Sustainable Material for Diverse Applications. Adsorpt. Sci. Technol. 2022, 2022, 4184809. [Google Scholar] [CrossRef] [Scilit]
  78. Húmpola, P.D.; Odetti, H.S.; Fertitta, A.E.; Vicente, J.L. Thermodynamic Analysis of Adsorption Models of Phenol in Liquid Phase on Different Activated Carbons. J. Chil. Chem. Soc. 2013, 58, 1541–1544. [Google Scholar] [CrossRef] [Scilit]
  79. Lander, J.J. Chemisorption and Ordered Surface Structures. Surf. Sci. 1964, 1, 125–164. [Google Scholar] [CrossRef] [Scilit]
  80. Gkika, D.A.; Mitropoulos, A.C.; Kyzas, G.Z. Why Reuse Spent Adsorbents? The Latest Challenges and Limitations. Sci. Total Environ. 2022, 822, 153612. [Google Scholar] [CrossRef] [Scilit]
  81. Rehman, A.; Nazir, G.; Heo, K.; Hussain, S.; Ikram, M.; Akhter, Z.; Algaradah, M.M.; Mahmood, Q.; Fouda, A.M. A Focused Review on Lignocellulosic Biomass-Derived Porous Carbons for Effective Pharmaceuticals Removal: Current Trends, Challenges and Future Prospects. Sep. Purif. Technol. 2024, 330, 125356. [Google Scholar] [CrossRef] [Scilit]
  82. Acharya, A.; Jeppu, G.; Girish, C.R.; Prabhu, B.; Murty, V.R.; Martis, A.S.; Ramesh, S. Adsorption of Arsenic and Fluoride: Modeling of Single and Competitive Adsorption Systems. Heliyon 2024, 10, e31967. [Google Scholar] [CrossRef] [Scilit] [PubMed]
  83. Juturu, R.; Vinayagam, R.; Murugesan, G.; Selvaraj, R. Enhanced Adsorptive Removal of Chromium (VI) Ions from Wastewater with Phosphorus-Doped Magnetite-Carbon Composite: Advanced Statistical Physics Modeling and Kinetic Studies. Environ. Dev. Sustain. 2025. [Google Scholar] [CrossRef] [Scilit]
  84. Moldoveanu, E.-T.; Niculescu, A.-G.; Hadibarata, T.; Grumezescu, A.-M.; Mihaiescu, D.-E. Bridging Material Innovation and Environmental Safety: Aerogel-Based Magnetic Nanocomposites as Emerging Platforms for Water Decontamination. Toxics 2026, 14, 115. [Google Scholar] [CrossRef] [Scilit]
  85. Bouklas, N.; Huang, R. Swelling Kinetics of Polymer Gels: Comparison of Linear and Nonlinear Theories. Soft Matter 2012, 8, 8194. [Google Scholar] [CrossRef] [Scilit]
  86. Iakunkov, A.; Talyzin, A.V. Swelling Properties of Graphite Oxides and Graphene Oxide Multilayered Materials. Nanoscale 2020, 12, 21060–21093. [Google Scholar] [CrossRef] [Scilit]
  87. Akhtar, M.S.; Ali, S.; Zaman, W. Innovative Adsorbents for Pollutant Removal: Exploring the Latest Research and Applications. Molecules 2024, 29, 4317. [Google Scholar] [CrossRef] [Scilit]
  88. Maiti, T.K.; Dixit, P.; Singh, J.; Talapatra, N.; Ray, M.; Chattopadhyay, S. A Novel Strategy toward the Advancement of Proton Exchange Membranes through the Incorporation of Propylsulfonic Acid-Functionalized Graphene Oxide in Crosslinked Acid-Base Polymer Blends. Int. J. Hydrogen Energy 2023, 48, 1482–1500. [Google Scholar] [CrossRef] [Scilit]
  89. Cruz-Benítez, M.M.; Castro-Rosas, J.; González-Morones, P.; Santos-López, E.M.; Villagómez-Ibarra, J.R.; Tlahuextl-Romero, A.M.; Fonseca-Florido, H.A.; Gómez-Aldapa, C.A. Biocomposites Based on Starch with Multi-functionalized Graphene Oxide: Effect of Graft Composition and Concentration. Polym. Compos. 2022, 43, 267–281. [Google Scholar] [CrossRef] [Scilit]
  90. Sirajudheen, P.; Karthikeyan, P.; Ramkumar, K.; Meenakshi, S. Effective Removal of Organic Pollutants by Adsorption onto Chitosan Supported Graphene Oxide-Hydroxyapatite Composite: A Novel Reusable Adsorbent. J. Mol. Liq. 2020, 318, 114200. [Google Scholar] [CrossRef] [Scilit]
  91. Veclani, D.; Tolazzi, M.; Fogolari, F.; Melchior, A. Mechanism and Thermodynamics of Adsorption of Diclofenac on Graphene-Based Nanomaterials. J. Environ. Chem. Eng. 2022, 10, 108789. [Google Scholar] [CrossRef] [Scilit]
  92. Li, H.; Lin, C.; Ma, R.; Chen, Y. π–π Stack Driven Competitive /Complementary Adsorption of Aromatic Compounds on MIL-53(Al). Chemosphere 2023, 337, 139377. [Google Scholar] [CrossRef] [Scilit] [PubMed]
Figure 1. Experimental scheme of CS/GO/PVA-Van@TiO2 composite synthesis.
Nanomaterials 16 00414 g001
Figure 2. FTIR spectra of (a) CS/PVA-VAN, (b) CS/PVA-VAN@TiO2 and (c) CS/GO/PVA-VAN@TiO2 in comparison to net materials, before adsorption of DCF and KT.
Nanomaterials 16 00414 g002
Figure 3. FTIR spectra of (a) CS/PVA-VAN, (b) CS/PVA-VAN@TiO2 and (c) CS/GO/PVA-VAN@TiO2 after adsorption of DCF and KTP.
Nanomaterials 16 00414 g003
Figure 4. XRD pattern of (a) PVA, CS, VAN, TiO2 and GO and (b) CS/PVA-VAN, CS/PVA-VAN@TiO2 and CS/GO/PVA-VAN@TiO2.
Nanomaterials 16 00414 g004
Figure 5. SEM images of (a) CS/PVA-VAN, (b) CS/PVA-VAN@TiO2 and (c) CS/GO/PVA-VAN@TiO2.
Nanomaterials 16 00414 g005
Figure 6. BET analysis of (a) CS/PVA-Van@TiO2 and (b) CS/GO/PVA-Van@TiO2.
Nanomaterials 16 00414 g006
Figure 7. Effect of pH on the adsorption of (a) DCF and (b) KTP from CS/PVA-VAN, CS/PVA-VAN@TiO2 and CS/GO/PVA-VAN@TiO2 and (c) the pHpzc of adsorbent materials. (C0 = 50 mg/L, dose = 1 g/L, T = 303 K, t = 24 h).
Nanomaterials 16 00414 g007
Figure 8. Schematic illustration of the proposed adsorption mechanism of DCF and KTP onto the optimum CS/GO/PVA-VAN@TiO2 composite.
Nanomaterials 16 00414 g008
Figure 9. Effect of contact time on the adsorption of (a) DCF and (b) KTP for CS/PVA-VAN, CS/PVA-VAN@TiO2 and CS/GO/PVA-VAN@TiO2. (C0 = 50 mg/L, pH = 5.0, T = 303 K, t = 0–180 min).
Nanomaterials 16 00414 g009
Figure 10. Isotherm models for the evaluation of removal efficiency of (ac) DCF and (df) KTP using the new composites. Experimental conditions: for DCF removal C0 = 10–90 mg/L, pH = 5.0, T = 303, 313 and 323 K, t = 60 min; for KTP removal C0 = 10–20 mg/L, pH = 5.0, T = 303, 313 and 323 K, t = 60 min.
Nanomaterials 16 00414 g010
Figure 11. Effect of mass for (a) DCF and (b) KTP adsorption. (C0 = 50 mg/L, pH 5.0, t = 60 min, T = 303 K).
Nanomaterials 16 00414 g011
Figure 12. Adsorption of (a) DCF and (b) KTP for 5 cycles after regeneration at pH level 10 using 0.1 M NaOH treatment. (C0 = 50 mg/L, pH 5.0, t = 60 min, T = 303 K).
Nanomaterials 16 00414 g012
Figure 13. FTIR spectrum of optimum composite after five regeneration cycles during DCF and KTP removal.
Nanomaterials 16 00414 g013
Figure 14. Swelling ratio of CS/PVA-VAN, CS/PVA-VAN@TiO2 and CS/GO/PVA-VAN@TiO2 (aquatic solution, pH 5.0, T = 303 K, t = 5–120 min).
Nanomaterials 16 00414 g014
Figure 15. Stability study of CS/PVA-VAN, CS/PVA-VAN@TiO2 and CS/GO/PVA-VAN@TiO2 (aquatic solution, pH 3.0–11.0, t = 24 h, T = 303 K).
Nanomaterials 16 00414 g015
Figure 16. Adsorption study on the removal efficiency of DCF and KTP from a binary system using the CS/GO/PVA-Van@TiO2 composite.
Nanomaterials 16 00414 g016
Table 1. Synthesis of CS/PVA composites with VAN, TiO2 and GO (final volume 100 mL).
AdsorbentPVA
(g)
Van
(g)
CS (g)TiO2 (g)GO
(g)
Acetic Acid (mL)GLA (mL)
CS/PVA-VAN0.50.21.0--22
CS/PVA-VAN@TiO20.50.21.00.2-22
CS/GO/PVA-VAN@TiO20.50.21.00.20.0122
Table 2. BET parameter of new composite adsorbent materials.
Adsorbent MaterialSurface Area
(m2/g)
Pore Volume (cm3/g)Average Pore Diameter (nm)
CS/PVA-Van@TiO232.460.029161.180
CS/GO/PVA-Van@TiO264.860.0602.016
Table 3. Kinetic data of PFO, PSO and IPD kinetic models for DCF and KTP.
PollutantAdsorbentQe,exp (mg/g)PFOPSOIPD
K1 (1/min)Qe,cal (mg/g)R2K2 (L/mg.min)Qe,cal (mg/g)R2KIPD (mg* min−0.5/g)C
(mg/g)
R2
DCFCS/PVA-VAN47.210.09245.410.9850.00342.240.9873.3312.320.788
CS/PVA-VAN@TiO249.160.20545.680.9780.00748.350.9952.8821.680.588
CS/GO/PVA-VAN@TiO249.200.33546.470.9910.01647.990.9983.2018.580.568
KTPCS/PVA-VAN46.160.10342.850.9840.00346.200.9792.7516.940.670
CS/PVA-VAN@TiO246.640.43144.620.9770.02446.420.9932.2628.420.380
CS/GO/PVA-VAN@TiO247.680.36646.240.9930.02047.690.9952.7825.530.444
Table 4. Isotherm parameters of the Langmuir, Freundlich and Sips models for the DCF and KTP adsorptions.
Langmuir model
PollutantAdsorbentKL (L/mg)Qm (mg/g)R2
DCFCS/PVA-VAN0.10268.600.876
CS/PVA-VAN@TiO20.10891.190.945
CS/GO/PVA-VAN@TiO20.141114.530.986
KTPCS/PVA-VAN0.70636.070.935
CS/PVA-VAN@TiO20.28958.510.974
CS/GO/PVA-VAN@TiO20.27565.200.970
Freundlich model
PollutantAdsorbentKLF (L/g)1/nR2
DCFCS/PVA-VAN10.8670.470.939
CS/PVA-VAN@TiO213.1150.530.975
CS/GO/PVA-VAN@TiO216.7840.590.995
KTPCS/PVA-VAN15.1650.320.990
CS/PVA-VAN@TiO214.7320.520.982
CS/GO/PVA-VAN@TiO215.3620.560.982
Sips model
PollutantAdsorbentKF (mg/g)(L/mg)1/n1/nR2
DCFCS/PVA-VAN10.830.400.933
CS/PVA-VAN@TiO210.620.520.975
CS/GO/PVA-VAN@TiO29.801.020.981
KTPCS/PVA-VAN9.210.320.990
CS/PVA-VAN@TiO28.310.550.987
CS/GO/PVA-VAN@TiO28.200.510.982
Table 5. Thermodynamic parameters for DCF and KTP adsorption.
MaterialT (K)ΔG0
(kJ/mol)
ΔH0 (kJ/mol)ΔS0 (kJ/mol∙K)R2
DCF
CS/PVA-VAN303−0.728.620.0320.977
313−1.13
323−1.35
CS/PVA-VAN@TiO2303−1.507.260.0300.941
313−1.83
323−2.09
CS/GO/PVA-VAN@TiO2303−4.568.270.0420.923
313−5.03
323−4.34
KTP
CS/PVA-VAN303−2.509.010.0390.996
313−2.84
323−3.28
CS/PVA-VAN@TiO2303−3.355.400.0300.976
313−3.71
323−3.94
CS/GO/PVA-VAN@TiO2303−4.372.860.0250.990
313−4.54
323−4.87
Table 6. Adsorption characteristics of DCF and KTP in binary systems at different concentration ratios.
System DCF:KTPNSAIDsC0 (mg/L)Ce
(mg/L)
Qe
(mg/g)
SDCF/KTPRi
1:2DCF2510.9414.060.801.77
KTP5019.2029.380.91
1:1DCF5022.7127.290.841.65
KTP5020.6229.380.81
2:1DCF5022.0028.000.821.75
KTP259.8215.180.88
Disclaimer/Publisher’s Note: The statements, opinions and data contained in all publications are solely those of the individual author(s) and contributor(s) and not of MDPI and/or the editor(s). MDPI and/or the editor(s) disclaim responsibility for any injury to people or property resulting from any ideas, methods, instructions or products referred to in the content.